statistical challenges in the quantification of gunshot residue evidence
TRANSCRIPT

PAPER
CRIMINALISTICS; GENERAL
Romain Gauriot,1 M.Sc.; Lawrence Gunaratnam,2 M.Sc.; Rossana Moroni,2,3 Ph.D.;Tapani Reinikainen,2 Ph.D.; and Jukka Corander,1 Ph.D.
Statistical Challenges in the Quantification ofGunshot Residue Evidence*
ABSTRACT: The discharging of a gun results in the formation of extremely small particles known as gunshot residues (GSR). These may bedeposited on the skin and clothing of the shooter, on other persons present, and on nearby items or surfaces. Several factors and their complex inter-actions affect the number of detectable GSR particles, which can deeply influence the conclusions drawn from likelihood ratios or posterior proba-bilities for prosecution hypotheses of interest. We present Bayesian network models for casework examples and demonstrate that probabilisticquantification of GSR evidence can be very sensitive to the assumptions concerning the model structure, prior probabilities, and the likelihood com-ponents. This finding has considerable implications for the use of statistical quantification of GSR evidence in the legal process.
KEYWORDS: forensic science, Bayesian networks, gunshot residue, statistical quantification of evidence, contamination, model uncertainty
Over the most recent two decades, forensics literature displaysa considerable research activity around the chemistry related toorganic and inorganic compounds present in gunshot residues(GSR), as well as the different laboratory techniques used in theanalysis of such residues. The comprehensive review by Dalbyet al. (1) covers in detail all major aspects of GSR analysis,except the statistical quantification of the strength of evidencepresent in a particular GSR finding. The dominating practice ofreporting GSR findings to the prosecutors is a dichotomousstatement, including a disclaimer, according to which the find-ings are either compatible or noncompatible with the prosecutionhypothesis that a suspect has been involved in the shooting inci-dent under investigation. To a varying degree, the prosecutionhypothesis may also be formulated more strictly, such that astatement about the suspect being the actual shooter is made.Some forensic laboratories use a quantitative scale of interpreta-tion, such that the probability of involvement increases with thenumber of GSR particles identified from the samples taken fromthe suspect.Recently, a variety of proposals have been made concerning
how GSR evidence could be quantified in statistical terms usingprobabilistic models for the number of observed particles (2–5).In particular, the Bayesian approach that has successfully pene-trated several fields of forensic science was advocated by Bie-dermann et al. (4,5). The essential strength of Bayesian analysis
lies in the possibility to use expert opinions and knowledge toformulate both probability models and statements of uncertaintyabout them, including models and model parameters (6–8). How-ever, currently the use of Bayesian reasoning in GSR caseworkappears to be very rare in the forensic practice.Here, we focus on identifying and discussing the challenges
associated with any statistical quantification of GSR evidence,both Bayesian and frequentist alike. The primary purpose of ourwork is to show what requirements a rigorous statistical quantifica-tion should meet to be valid and why this goal may not always beachievable, even if considerable forensic expertise would be avail-able for a particular casework. The implications of our study arethus that extreme caution should be applied when using a probabi-listic statement of the strength of evidence in a GSR finding andthat considerable further investigation is necessary before widelyadopting such procedures within the legal process.
Methods
Formation and Behavior of Gunshot Residue Particles
The discharging of a gun results in the formation of extremelysmall, burnt, and unburnt particles from the explosive primer,the propellant, and the ammunition, known as firearms dischargeresidues or GSR, which are invisible to the naked eye. Thesemay be deposited on the skin and clothing of the shooter, on theskin and clothing of persons near to the firing point, and onnearby surfaces or items (1). As discussed by Dalby et al. (1),the persistence of GSR particles mainly depends on the physicalactivities taking place after the shooting incident. Particles maybe removed or they may be transferred by, for example, wipingor rubbing the hands, excessive sweating. Carefully washinghands afterward or wearing gloves while shooting wouldtypically result in no traceable particles on the hands of theshooter.
1Department of Mathematics and Statistics, University of Helsinki,FI-00014 Helsinki, Finland.
2National Bureau of Investigation Forensic Laboratory, Jokiniemenkuja 4,FI-01370 Vantaa, Finland.
3Department of Mathematics, �Abo Akademi University, F€anriksgatan 3B,FI-20500 Turku, Finland.
*Supported by the Academy of Finland grants 121301 and 251170 to JC.Received 24 April 2012; and in revised form 24 July 2012; accepted 29
July 2012.
© 2013 American Academy of Forensic Sciences 1149
J Forensic Sci, September 2013, Vol. 58, No. 5doi: 10.1111/1556-4029.12179
Available online at: onlinelibrary.wiley.com
There are also several additional factors that influence thenumber of GSR particles detected on the samples collected fromthe suspect, such as elapsed time between the shooting incidentand sample collection, the location and environmental conditionsin which the firearm was discharged, type of weapon, type ofammunition, number of shots, condition of the sampling area,the efficiency of sampling media, competence of the samplecollection officer, sample preparation for analysis, and theperformance of the instrumental analysis (1).A nonshooter can be contaminated inadvertently with GSR
particles (secondary transfer) by being near to a firearm when itwas discharged, having handled a firearm or having touched anitem which had GSR particles on it. Casework and experimentalexperience (1) show that persons who touch the gunshot wound,the bullet entrance hole in the clothing of a victim shot at closerange, collect cartridge cases at the crime scene, or conceal themurder weapon are likely to have even more GSR particles pres-ent in their samples compared with the sample taken from theactual shooter.
Statistical Modeling of the GSR Evidence
According to the most widespread protocol currently in foren-sic use, samples are collected from the suspect(s) using adhesivetape device and the collection of eventual particles is analyzedusing automated scanning electron microscopy (SEM) (1). Theinorganic particles of special interest are the primary particlescontaining a characteristic combination of lead (Pb), barium (Ba)and antimony (Sb), which emanate exclusively from firearm dis-charges. Nevertheless, in a typical sample, there are even largerquantities of secondary inorganic particles, which do not containthe characteristic triplet of elements, but often pairs of elementssuch as Pb-Sb. The secondary or indicative particles do not pro-vide conclusive evidence for the source being a firearm, but theystill represent valuable information for the forensic expert,because the frequencies of characteristic and secondary particlesare known to highly uneven, the latter being more numerous insamples. Also, using the automated SEM technique, it is possi-ble to investigate the morphological characteristics of the parti-cles in addition to their chemical composition. The dataextracted from the SEM analysis that has been suggested as thetarget for statistical modeling are usually summarized by thenumber of characteristic particles identified in a sample, say Y,which takes nonnegative integer values.To facilitate interpretation of the results presented later, we
summarize below some essential properties of the likelihoodratio (LR) and posterior probabilities of particular simple hypoth-eses that are of interest in the current context. For a detaileddiscussion of these concepts, see Aitken and Taroni (9). Let Hp
denote the prosecution hypothesis, which can either be a strictstatement, such as “the suspect is the shooter,” or a less strictstatement, such as “the suspect had primary involvement in theshooting incident.” Correspondingly, Hd denotes the defensehypothesis, that is, the complementary event to the prosecutionhypothesis (e.g., “the suspect is not the shooter”). Let E denotethe evidence, which can here be summarized in terms of observ-ing Y = y characteristic GSR particles in the sample taken fromthe suspect. In the statistical analyses reported below, we alwaysuse only the number of characteristic particles, although themodels could be generalized to take into account also morpho-logical characteristics and secondary particles.In the LR = P(E|Hp)/P(E|Hd), the numerator is the probability
of observing the evidence given that the prosecution hypothesis
Hp is true, and the denominator is the corresponding probabilityprovided that the defense hypothesis Hd is true instead. If theLR is larger than 1, the prosecution hypothesis attains more sup-port than the defense hypothesis. Conversely, if LR < 1, thenthe defense hypothesis has more support.The posterior probabilities P(Hp|E), P(Hd|E) of the prosecution
and defense hypotheses, respectively, are obtained by updatingthe prior probabilities P(Hp), P(Hd) in light of evidence throughthe LR, such that the ratio of posterior probabilities equals P(Hp|E)/P(Hd|E) = LR 9 P(Hp)/P(Hd) (note that P(Hd) = 1 � P(Hp)).The posterior probability of either of the two hypotheses is theprobability that it is true given the evidence E. The prior infor-mation expressed through the probability P(Hd) of the prosecu-tion hypothesis being represents the knowledge of the expertabout the case before observing the GSR evidence. In our exam-ples, uniform prior probabilities are used, as suggested in (10). Itis nevertheless important to underline that legal practices varyover different countries and several alternative choices of priorsare possible. As the sensibility of using uniform priors is not thefocus of this study, we refer the reader to the wide discussion ofthe topic in the forensic literature (see, e.g., [10,11]). Note alsothat scientific experts are typically required to summarize theweight of evidence in a particular case in terms of a LR, it beingleft to the adjudicator (be it the judge or jury) to combine thiswith possibly other background evidence in the case to formulatethe posterior judgment based on all the evidence.
Bayesian Network Model with a Single Likelihood Ratio
Biedermann et al. (4,5) discussed in detail the use of Bayesiannetwork (BN) models to calculate LRs and posterior probabili-ties in light of particular GSR evidence. In (4), they used theexperimental data from the study conducted by Cardinetti et al.(2) to obtain likelihood values for observed numbers of particlesunder a variety of settings. As neither of the two experimentalsettings in (2) represents well typical casework situations, weuse here instead data from an experiment conducted at theFinnish National Bureau of Investigation (Table 1). In the studyby Cardinetti et al. (2), 10 and 40 shots were fired with a heavyhandgun under setting A and B, respectively, whereas in realcasework forensic scientists tend to encounter incidents whereonly a single or very few shots have been fired.
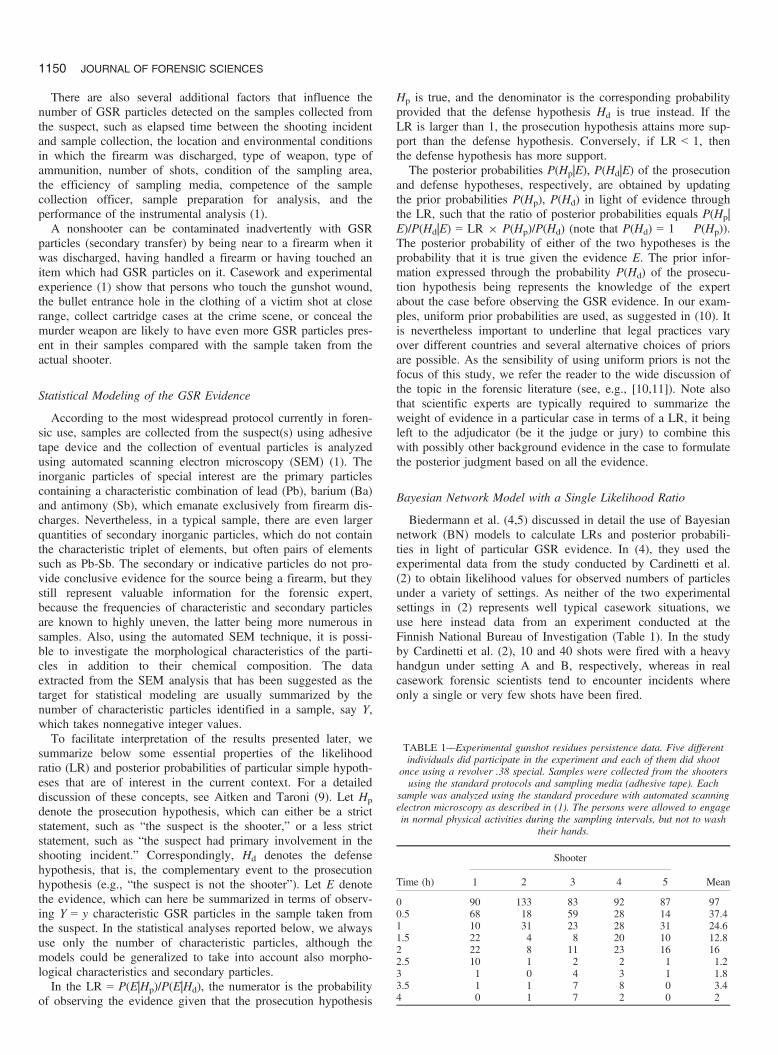
TABLE 1––Experimental gunshot residues persistence data. Five differentindividuals did participate in the experiment and each of them did shoot
once using a revolver .38 special. Samples were collected from the shootersusing the standard protocols and sampling media (adhesive tape). Each
sample was analyzed using the standard procedure with automated scanningelectron microscopy as described in (1). The persons were allowed to engagein normal physical activities during the sampling intervals, but not to wash
their hands.
Time (h)
Shooter
Mean1 2 3 4 5
0 90 133 83 92 87 970.5 68 18 59 28 14 37.41 10 31 23 28 31 24.61.5 22 4 8 20 10 12.82 22 8 11 23 16 162.5 10 1 2 2 1 1.23 1 0 4 3 1 1.83.5 1 1 7 8 0 3.44 0 1 7 2 0 2
1150 JOURNAL OF FORENSIC SCIENCES
From Table 1, it is clearly seen that the two experimental datasets differ considerably, because in our experiment, the numberof persisting GSR particles is near zero already after 4 h, whereasin the other study (2), particles persisted up to 8 h. It is evidentthat the larger number of particles and their longer persistencedepends mainly on the difference in the type of the weapon usedand the number of shots fired. As a large particle population thatis distributed at the time of shooting allows evidence to be mod-eled for a longer duration of time, it is important to acknowledgethat experimental data may not be representative to allow for theestimation of likelihoods unless the experiment matches wellenough with the details of a casework.Figure 1 and Table 2 jointly describe a BN model for
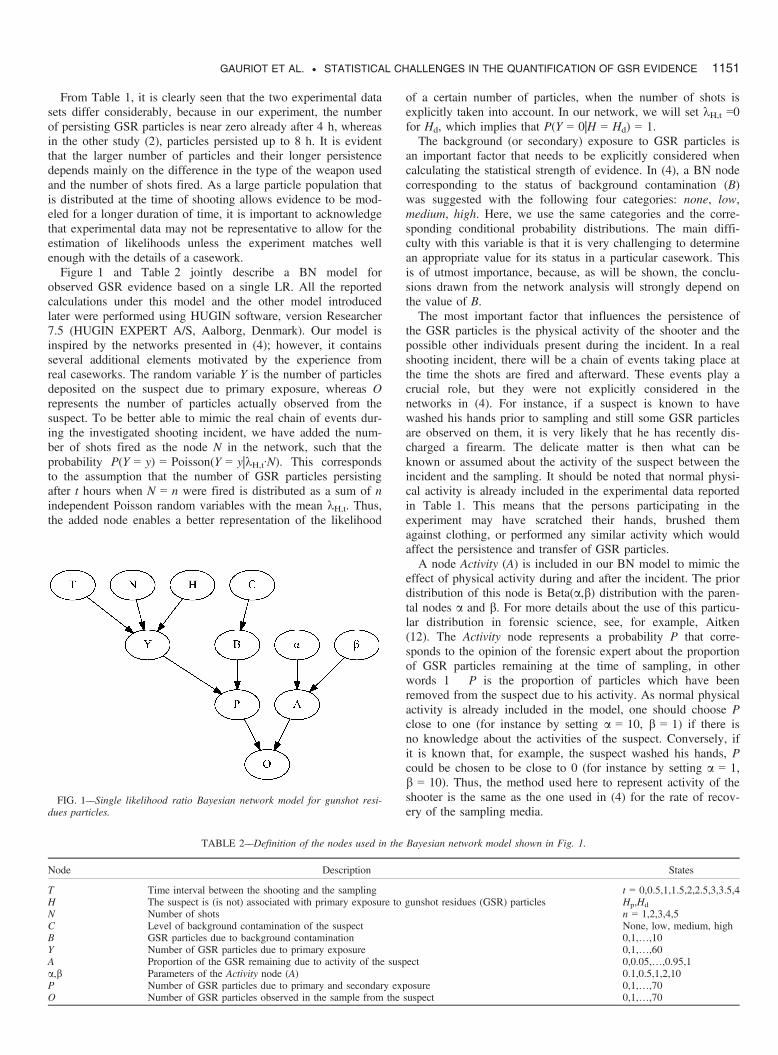
observed GSR evidence based on a single LR. All the reportedcalculations under this model and the other model introducedlater were performed using HUGIN software, version Researcher7.5 (HUGIN EXPERT A/S, Aalborg, Denmark). Our model isinspired by the networks presented in (4); however, it containsseveral additional elements motivated by the experience fromreal caseworks. The random variable Y is the number of particlesdeposited on the suspect due to primary exposure, whereas Orepresents the number of particles actually observed from thesuspect. To be better able to mimic the real chain of events dur-ing the investigated shooting incident, we have added the num-ber of shots fired as the node N in the network, such that theprobability P(Y = y) = Poisson(Y = y|kH,t∙N). This correspondsto the assumption that the number of GSR particles persistingafter t hours when N = n were fired is distributed as a sum of nindependent Poisson random variables with the mean kH,t. Thus,the added node enables a better representation of the likelihood
of a certain number of particles, when the number of shots isexplicitly taken into account. In our network, we will set kH,t =0for Hd, which implies that P(Y = 0|H = Hd) = 1.The background (or secondary) exposure to GSR particles is
an important factor that needs to be explicitly considered whencalculating the statistical strength of evidence. In (4), a BN nodecorresponding to the status of background contamination (B)was suggested with the following four categories: none, low,medium, high. Here, we use the same categories and the corre-sponding conditional probability distributions. The main diffi-culty with this variable is that it is very challenging to determinean appropriate value for its status in a particular casework. Thisis of utmost importance, because, as will be shown, the conclu-sions drawn from the network analysis will strongly depend onthe value of B.The most important factor that influences the persistence of
the GSR particles is the physical activity of the shooter and thepossible other individuals present during the incident. In a realshooting incident, there will be a chain of events taking place atthe time the shots are fired and afterward. These events play acrucial role, but they were not explicitly considered in thenetworks in (4). For instance, if a suspect is known to havewashed his hands prior to sampling and still some GSR particlesare observed on them, it is very likely that he has recently dis-charged a firearm. The delicate matter is then what can beknown or assumed about the activity of the suspect between theincident and the sampling. It should be noted that normal physi-cal activity is already included in the experimental data reportedin Table 1. This means that the persons participating in theexperiment may have scratched their hands, brushed themagainst clothing, or performed any similar activity which wouldaffect the persistence and transfer of GSR particles.A node Activity (A) is included in our BN model to mimic the
effect of physical activity during and after the incident. The priordistribution of this node is Beta(a,b) distribution with the paren-tal nodes a and b. For more details about the use of this particu-lar distribution in forensic science, see, for example, Aitken(12). The Activity node represents a probability P that corre-sponds to the opinion of the forensic expert about the proportionof GSR particles remaining at the time of sampling, in otherwords 1 � P is the proportion of particles which have beenremoved from the suspect due to his activity. As normal physicalactivity is already included in the model, one should choose Pclose to one (for instance by setting a = 10, b = 1) if there isno knowledge about the activities of the suspect. Conversely, ifit is known that, for example, the suspect washed his hands, Pcould be chosen to be close to 0 (for instance by setting a = 1,b = 10). Thus, the method used here to represent activity of theshooter is the same as the one used in (4) for the rate of recov-ery of the sampling media.
TABLE 2––Definition of the nodes used in the Bayesian network model shown in Fig. 1.
Node Description States
T Time interval between the shooting and the sampling t = 0,0.5,1,1.5,2,2.5,3,3.5,4H The suspect is (is not) associated with primary exposure to gunshot residues (GSR) particles Hp,Hd
N Number of shots n = 1,2,3,4,5C Level of background contamination of the suspect None, low, medium, highB GSR particles due to background contamination 0,1,…,10Y Number of GSR particles due to primary exposure 0,1,…,60A Proportion of the GSR remaining due to activity of the suspect 0,0.05,…,0.95,1a,b Parameters of the Activity node (A) 0.1,0.5,1,2,10P Number of GSR particles due to primary and secondary exposure 0,1,…,70O Number of GSR particles observed in the sample from the suspect 0,1,…,70
FIG. 1––Single likelihood ratio Bayesian network model for gunshot resi-dues particles.
GAURIOT ET AL. . STATISTICAL CHALLENGES IN THE QUANTIFICATION OF GSR EVIDENCE 1151
Bayesian Network Model with Multiple Likelihood Ratios
On a crime scene, one can be contaminated with GSR parti-cles by discharging a firearm, standing next to the shooter, or bytouching a contaminated object, such as the weapon, a spentcartridge, or the victim. The LR approach considered above islimited in this respect, because it does not include the variety ofpossible scenarios for the chain of events that took place duringthe shooting incident. In the network displayed in Fig. 1, thesuspect could only be primarily exposed to GSR contaminationby discharging a firearm. To take into account the diversity ofpossible scenarios, we will develop a BN that can handle multi-ple LRs. To enable this, the earlier simple hypotheses arereplaced with a more elaborate set of hypotheses. Recall that theearlier prosecution and defense hypotheses could be the follow-ing two statements:Hp: The suspect has discharged a firearmHd: The suspect has not discharged a firearm
These are now replaced by the following three pairs ofhypotheses:Hp0: The suspect has discharged a firearmHd0: The suspect has not discharged a firearmHp1: The suspect was contaminated by standing near the shooterHd1: The suspect was not contaminated by standing near the
shooterHp2: The suspect was contaminated by touching the victim, a
spent cartridge or by concealing the weaponHd2: The suspect was not contaminated by touching the victim,
a spent cartridge or by concealing the weapon
To remain consistent with the previous notation (Hp for theprosecution, and Hd for the defense), we have kept the samenotation and added indexing to distinguish between differentsources of GSR contamination. However, note that using a BNbased on the above pairs of hypotheses, the defense can arguethat the suspect has not discharged a firearm but was insteadcontaminated by standing next to the shooter (Hd0 and Hp1
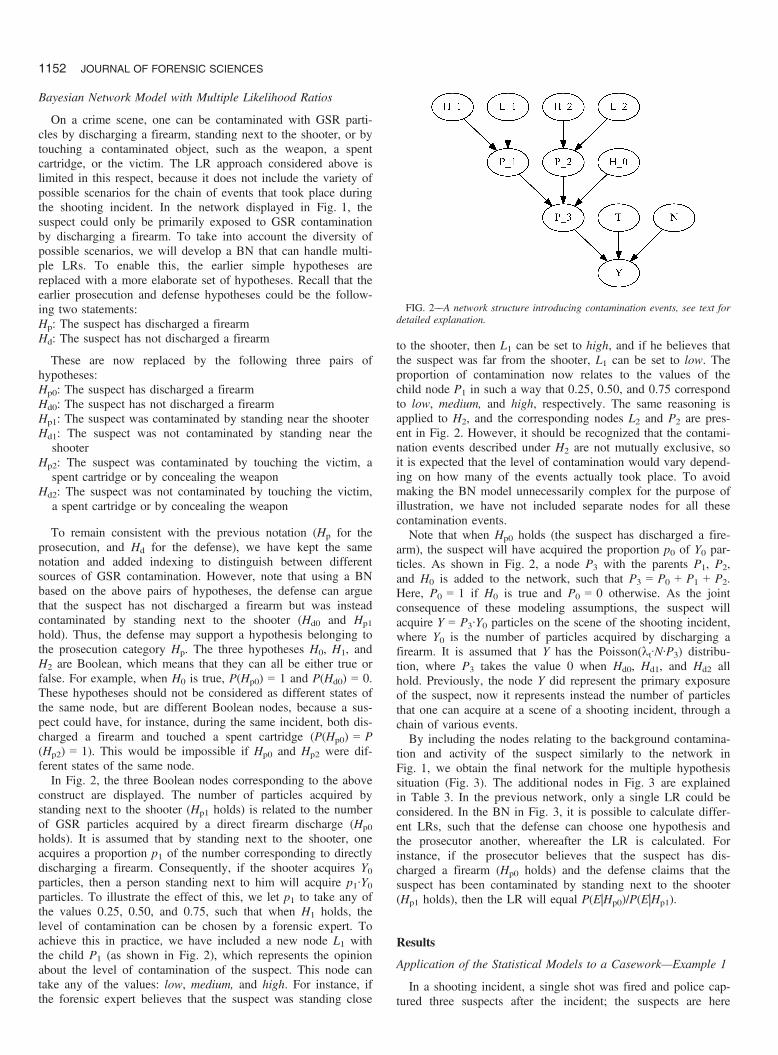
hold). Thus, the defense may support a hypothesis belonging tothe prosecution category Hp. The three hypotheses H0, H1, andH2 are Boolean, which means that they can all be either true orfalse. For example, when H0 is true, P(Hp0) = 1 and P(Hd0) = 0.These hypotheses should not be considered as different states ofthe same node, but are different Boolean nodes, because a sus-pect could have, for instance, during the same incident, both dis-charged a firearm and touched a spent cartridge (P(Hp0) = P(Hp2) = 1). This would be impossible if Hp0 and Hp2 were dif-ferent states of the same node.In Fig. 2, the three Boolean nodes corresponding to the above
construct are displayed. The number of particles acquired bystanding next to the shooter (Hp1 holds) is related to the numberof GSR particles acquired by a direct firearm discharge (Hp0
holds). It is assumed that by standing next to the shooter, oneacquires a proportion p1 of the number corresponding to directlydischarging a firearm. Consequently, if the shooter acquires Y0particles, then a person standing next to him will acquire p1∙Y0particles. To illustrate the effect of this, we let p1 to take any ofthe values 0.25, 0.50, and 0.75, such that when H1 holds, thelevel of contamination can be chosen by a forensic expert. Toachieve this in practice, we have included a new node L1 withthe child P1 (as shown in Fig. 2), which represents the opinionabout the level of contamination of the suspect. This node cantake any of the values: low, medium, and high. For instance, ifthe forensic expert believes that the suspect was standing close
to the shooter, then L1 can be set to high, and if he believes thatthe suspect was far from the shooter, L1 can be set to low. Theproportion of contamination now relates to the values of thechild node P1 in such a way that 0.25, 0.50, and 0.75 correspondto low, medium, and high, respectively. The same reasoning isapplied to H2, and the corresponding nodes L2 and P2 are pres-ent in Fig. 2. However, it should be recognized that the contami-nation events described under H2 are not mutually exclusive, soit is expected that the level of contamination would vary depend-ing on how many of the events actually took place. To avoidmaking the BN model unnecessarily complex for the purpose ofillustration, we have not included separate nodes for all thesecontamination events.Note that when Hp0 holds (the suspect has discharged a fire-
arm), the suspect will have acquired the proportion p0 of Y0 par-ticles. As shown in Fig. 2, a node P3 with the parents P1, P2,and H0 is added to the network, such that P3 = P0 + P1 + P2.Here, P0 = 1 if H0 is true and P0 = 0 otherwise. As the jointconsequence of these modeling assumptions, the suspect willacquire Y = P3∙Y0 particles on the scene of the shooting incident,where Y0 is the number of particles acquired by discharging afirearm. It is assumed that Y has the Poisson(kt∙N∙P3) distribu-tion, where P3 takes the value 0 when Hd0, Hd1, and Hd2 allhold. Previously, the node Y did represent the primary exposureof the suspect, now it represents instead the number of particlesthat one can acquire at a scene of a shooting incident, through achain of various events.By including the nodes relating to the background contamina-
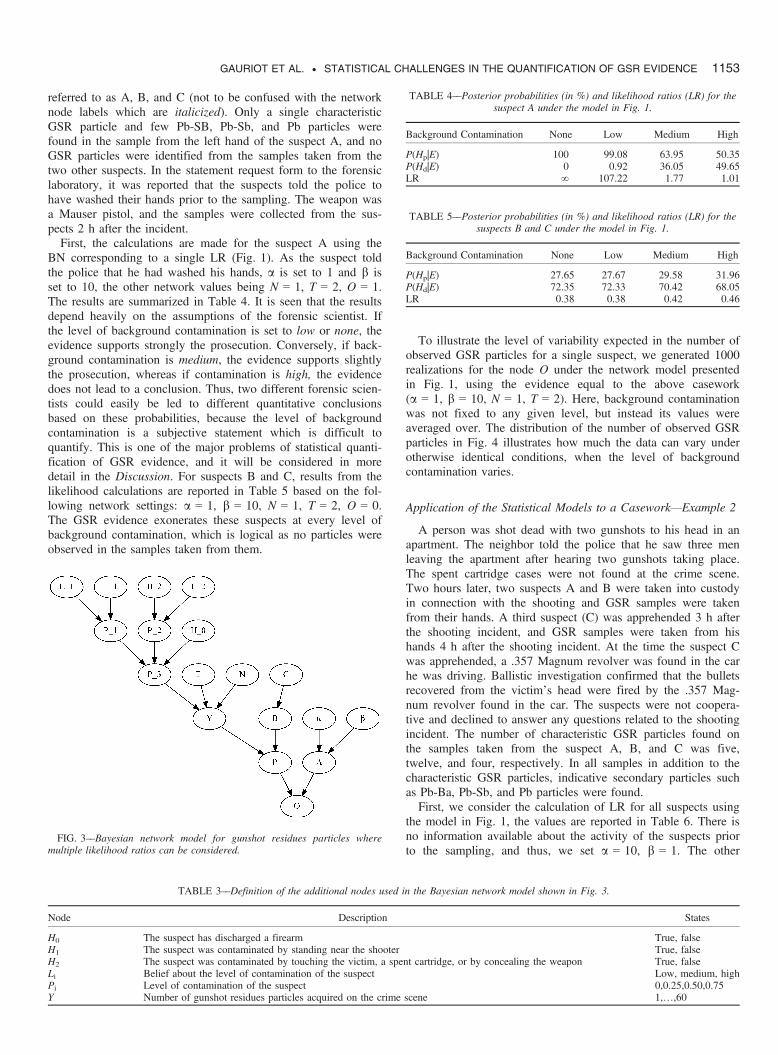
tion and activity of the suspect similarly to the network inFig. 1, we obtain the final network for the multiple hypothesissituation (Fig. 3). The additional nodes in Fig. 3 are explainedin Table 3. In the previous network, only a single LR could beconsidered. In the BN in Fig. 3, it is possible to calculate differ-ent LRs, such that the defense can choose one hypothesis andthe prosecutor another, whereafter the LR is calculated. Forinstance, if the prosecutor believes that the suspect has dis-charged a firearm (Hp0 holds) and the defense claims that thesuspect has been contaminated by standing next to the shooter(Hp1 holds), then the LR will equal P(E|Hp0)/P(E|Hp1).
Results
Application of the Statistical Models to a Casework—Example 1
In a shooting incident, a single shot was fired and police cap-tured three suspects after the incident; the suspects are here
FIG. 2––A network structure introducing contamination events, see text fordetailed explanation.
1152 JOURNAL OF FORENSIC SCIENCES
referred to as A, B, and C (not to be confused with the networknode labels which are italicized). Only a single characteristicGSR particle and few Pb-SB, Pb-Sb, and Pb particles werefound in the sample from the left hand of the suspect A, and noGSR particles were identified from the samples taken from thetwo other suspects. In the statement request form to the forensiclaboratory, it was reported that the suspects told the police tohave washed their hands prior to the sampling. The weapon wasa Mauser pistol, and the samples were collected from the sus-pects 2 h after the incident.First, the calculations are made for the suspect A using the
BN corresponding to a single LR (Fig. 1). As the suspect toldthe police that he had washed his hands, a is set to 1 and b isset to 10, the other network values being N = 1, T = 2, O = 1.The results are summarized in Table 4. It is seen that the resultsdepend heavily on the assumptions of the forensic scientist. Ifthe level of background contamination is set to low or none, theevidence supports strongly the prosecution. Conversely, if back-ground contamination is medium, the evidence supports slightlythe prosecution, whereas if contamination is high, the evidencedoes not lead to a conclusion. Thus, two different forensic scien-tists could easily be led to different quantitative conclusionsbased on these probabilities, because the level of backgroundcontamination is a subjective statement which is difficult toquantify. This is one of the major problems of statistical quanti-fication of GSR evidence, and it will be considered in moredetail in the Discussion. For suspects B and C, results from thelikelihood calculations are reported in Table 5 based on the fol-lowing network settings: a = 1, b = 10, N = 1, T = 2, O = 0.The GSR evidence exonerates these suspects at every level ofbackground contamination, which is logical as no particles wereobserved in the samples taken from them.
To illustrate the level of variability expected in the number ofobserved GSR particles for a single suspect, we generated 1000realizations for the node O under the network model presentedin Fig. 1, using the evidence equal to the above casework(a = 1, b = 10, N = 1, T = 2). Here, background contaminationwas not fixed to any given level, but instead its values wereaveraged over. The distribution of the number of observed GSRparticles in Fig. 4 illustrates how much the data can vary underotherwise identical conditions, when the level of backgroundcontamination varies.
Application of the Statistical Models to a Casework—Example 2
A person was shot dead with two gunshots to his head in anapartment. The neighbor told the police that he saw three menleaving the apartment after hearing two gunshots taking place.The spent cartridge cases were not found at the crime scene.Two hours later, two suspects A and B were taken into custodyin connection with the shooting and GSR samples were takenfrom their hands. A third suspect (C) was apprehended 3 h afterthe shooting incident, and GSR samples were taken from hishands 4 h after the shooting incident. At the time the suspect Cwas apprehended, a .357 Magnum revolver was found in the carhe was driving. Ballistic investigation confirmed that the bulletsrecovered from the victim’s head were fired by the .357 Mag-num revolver found in the car. The suspects were not coopera-tive and declined to answer any questions related to the shootingincident. The number of characteristic GSR particles found onthe samples taken from the suspect A, B, and C was five,twelve, and four, respectively. In all samples in addition to thecharacteristic GSR particles, indicative secondary particles suchas Pb-Ba, Pb-Sb, and Pb particles were found.First, we consider the calculation of LR for all suspects using
the model in Fig. 1, the values are reported in Table 6. There isno information available about the activity of the suspects priorto the sampling, and thus, we set a = 10, b = 1. The other
TABLE 4––Posterior probabilities (in %) and likelihood ratios (LR) for thesuspect A under the model in Fig. 1.
Background Contamination None Low Medium High
P(Hp|E) 100 99.08 63.95 50.35P(Hd|E) 0 0.92 36.05 49.65LR ∞ 107.22 1.77 1.01
TABLE 5––Posterior probabilities (in %) and likelihood ratios (LR) for thesuspects B and C under the model in Fig. 1.
Background Contamination None Low Medium High
P(Hp|E) 27.65 27.67 29.58 31.96P(Hd|E) 72.35 72.33 70.42 68.05LR 0.38 0.38 0.42 0.46
FIG. 3––Bayesian network model for gunshot residues particles wheremultiple likelihood ratios can be considered.
TABLE 3––Definition of the additional nodes used in the Bayesian network model shown in Fig. 3.
Node Description States
H0 The suspect has discharged a firearm True, falseH1 The suspect was contaminated by standing near the shooter True, falseH2 The suspect was contaminated by touching the victim, a spent cartridge, or by concealing the weapon True, falseLi Belief about the level of contamination of the suspect Low, medium, highPi Level of contamination of the suspect 0,0.25,0.50,0.75Y Number of gunshot residues particles acquired on the crime scene 1,…,60
GAURIOT ET AL. . STATISTICAL CHALLENGES IN THE QUANTIFICATION OF GSR EVIDENCE 1153
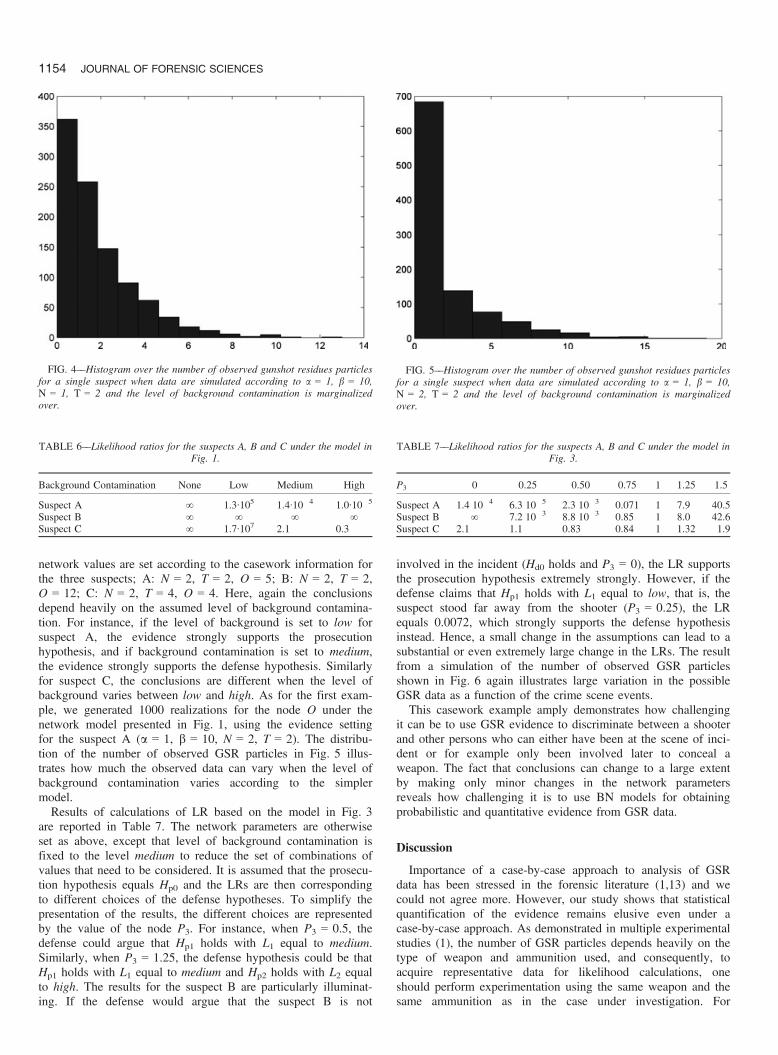
network values are set according to the casework information forthe three suspects; A: N = 2, T = 2, O = 5; B: N = 2, T = 2,O = 12; C: N = 2, T = 4, O = 4. Here, again the conclusionsdepend heavily on the assumed level of background contamina-tion. For instance, if the level of background is set to low forsuspect A, the evidence strongly supports the prosecutionhypothesis, and if background contamination is set to medium,the evidence strongly supports the defense hypothesis. Similarlyfor suspect C, the conclusions are different when the level ofbackground varies between low and high. As for the first exam-ple, we generated 1000 realizations for the node O under thenetwork model presented in Fig. 1, using the evidence settingfor the suspect A (a = 1, b = 10, N = 2, T = 2). The distribu-tion of the number of observed GSR particles in Fig. 5 illus-trates how much the observed data can vary when the level ofbackground contamination varies according to the simplermodel.Results of calculations of LR based on the model in Fig. 3
are reported in Table 7. The network parameters are otherwiseset as above, except that level of background contamination isfixed to the level medium to reduce the set of combinations ofvalues that need to be considered. It is assumed that the prosecu-tion hypothesis equals Hp0 and the LRs are then correspondingto different choices of the defense hypotheses. To simplify thepresentation of the results, the different choices are representedby the value of the node P3. For instance, when P3 = 0.5, thedefense could argue that Hp1 holds with L1 equal to medium.Similarly, when P3 = 1.25, the defense hypothesis could be thatHp1 holds with L1 equal to medium and Hp2 holds with L2 equalto high. The results for the suspect B are particularly illuminat-ing. If the defense would argue that the suspect B is not
involved in the incident (Hd0 holds and P3 = 0), the LR supportsthe prosecution hypothesis extremely strongly. However, if thedefense claims that Hp1 holds with L1 equal to low, that is, thesuspect stood far away from the shooter (P3 = 0.25), the LRequals 0.0072, which strongly supports the defense hypothesisinstead. Hence, a small change in the assumptions can lead to asubstantial or even extremely large change in the LRs. The resultfrom a simulation of the number of observed GSR particlesshown in Fig. 6 again illustrates large variation in the possibleGSR data as a function of the crime scene events.This casework example amply demonstrates how challenging
it can be to use GSR evidence to discriminate between a shooterand other persons who can either have been at the scene of inci-dent or for example only been involved later to conceal aweapon. The fact that conclusions can change to a large extentby making only minor changes in the network parametersreveals how challenging it is to use BN models for obtainingprobabilistic and quantitative evidence from GSR data.
Discussion
Importance of a case-by-case approach to analysis of GSRdata has been stressed in the forensic literature (1,13) and wecould not agree more. However, our study shows that statisticalquantification of the evidence remains elusive even under acase-by-case approach. As demonstrated in multiple experimentalstudies (1), the number of GSR particles depends heavily on thetype of weapon and ammunition used, and consequently, toacquire representative data for likelihood calculations, oneshould perform experimentation using the same weapon and thesame ammunition as in the case under investigation. For
TABLE 6––Likelihood ratios for the suspects A, B and C under the model inFig. 1.
Background Contamination None Low Medium High
Suspect A ∞ 1.3∙105 1.4∙10�4 1.0∙10�5
Suspect B ∞ ∞ ∞ ∞Suspect C ∞ 1.7∙107 2.1 0.3
FIG. 4––Histogram over the number of observed gunshot residues particlesfor a single suspect when data are simulated according to a = 1, b = 10,N = 1, T = 2 and the level of background contamination is marginalizedover.
FIG. 5––Histogram over the number of observed gunshot residues particlesfor a single suspect when data are simulated according to a = 1, b = 10,N = 2, T = 2 and the level of background contamination is marginalizedover.
TABLE 7––Likelihood ratios for the suspects A, B and C under the model inFig. 3.
P3 0 0.25 0.50 0.75 1 1.25 1.5
Suspect A 1.4�10�4 6.3�10�5 2.3�10�3 0.071 1 7.9 40.5Suspect B ∞ 7.2�10�3 8.8�10�3 0.85 1 8.0 42.6Suspect C 2.1 1.1 0.83 0.84 1 1.32 1.9
1154 JOURNAL OF FORENSIC SCIENCES

instance, if a heavy revolver is discharged, the shooter will notbe subjected to the same number of GSR particles than in a casewhere a shotgun is discharged, as the latter releases almost noparticles. This requirement is an obvious problem for a forensiclaboratory from the practical perspective, as it necessitatescollection of data from many different weapon and ammunitiontypes, which would consume many resources.Even if the likelihoods were fairly well calculated from repre-
sentative experimental data, major obstacles remain in the use ofstatistical models to make quantitative claims from observedGSR data. We have demonstrated that contamination is an issuewhich is not easily dealt with and that the physical activities ofthe shooter and other persons involved play a central role inshaping the observed data. As discussed in (1), numerous experi-ments have shown that GSR particles may be present on a sus-pect due to various reasons, even when excluding the primaryexposure during the incident under investigation. This is a partic-ularly delicate issue in the case of persons generally involved incriminal activities and who routinely carry and handle weapons,which can lead to a nearly constant exposure to background con-tamination. When only very few GSR particles are detected on asuspect, it may be practically impossible to statistically discrimi-nate between a prosecution hypothesis and an alternative hypoth-esis claiming no involvement of the suspect and insteadbackground contamination as the source of the particles (forexample, see the results in Table 4).Due to the complexity of the set of factors that influence GSR
particle persistence and transfer, the number of GSR particlesdoes not correlate well (if at all) with the hypothesis of beingthe actual shooter. As we illustrated, it may be challenging todiscriminate between the roles of different suspects in the chainof events related to a shooting incident. This issue was recentlyconsidered experimentally also in the study by Lindsay et al.(14). More importantly, the subjective choices made by a foren-sic expert when building a statistical model for the data deeplyinfluence the conclusions and in such a manner that smallchanges in the assumptions can lead to large changes in thequantitative evidence, as exemplified, for instance in Tables 6and 7. Hence, an inevitable degree of arbitrariness will remain inthe probabilities derived from the observed GSR data even whenanalyzed by an experienced forensic scientist, which may haveconsequences for the legal process. The use of probabilisticclaims in the context of GSR evidence may easily also be mis-leading in itself, in the sense that probabilities yield an impres-sion that a reliable and precise number is derivable from thesedata.This ambiguity suggests that serious caution should be used if
a statistical approach is used to derive a quantitative claim onthe basis of GSR observations. The extensive experience derivedfrom complex caseworks is reflected in the several negativeopinions (e.g., [15,16]) mentioned in (1) in the context of usingand quantitating GSR evidence.
Acknowledgments
The authors would like to thank the two anonymous reviewersfor useful comments and suggestions.
References
1. Dalby O, Butler D, Birkett JW. Analysis of gunshot residue and associ-ated materials. J Forensic Sci 2010;55(4):924–43.
2. Cardinetti B, Ciampini C, Abate S, Marchetti C, Ferrari F, Di Tullio D,et al. A proposal for statistical evaluation of the detection of gunshot res-idues on a suspect. Scanning 2006;28:142–7.
3. Biedermann A, Taroni F. A probabilistic approach to the joint evaluationof firearm evidence and gunshot residues. Forensic Sci Int 2006;163:18–33.
4. Biedermann A, Bozza S, Taroni F. Probabilistic evidential assessment ofgunshot residue particle evidence (Part I): likelihood ratio calculation andcase pre-assessment using Bayesian networks. Forensic Sci Int2009;191:24–35.
5. Biedermann A, Bozza S, Taroni F. Probabilistic evidential assessment ofgunshot residue particle evidence (Part II): Bayesian parameterestimation for experimental count data. Forensic Sci Int2011;206:103–10.
6. Gelman A, Carlin JB, Stern H, Rubin DB. Bayesian data analysis, 2ndedn. New York, NY: Chapman and Hall/CRC, 2004.
7. Bernardo JM, Smith AFM. Bayesian theory. Chichester, U.K.: Wiley,1994.
8. Taroni F, Aitken CGG, Garbolino G, Biedermann A. Bayesian networksand probabilistic inference in forensic science. Chichester, U.K.: Wiley,2006.
9. Aitken CGG, Taroni F. Statistics and the evaluation of evidence forforensic scientists. Chichester, U.K.: Wiley, 2004.
10. Biedermann A, Taroni F, Garbolino P. Equal prior probabilities: can onedo better? Forensic Sci Int 2007;172:85–93.
11. Expert Working Group Marks Conclusion Scale Committee. Conclusionscale for shoeprint and toolmarks examination. J Forensic Identif2006;56:255–80.
12. Aitken CGG. Sampling—how big a sample? J Forensic Sci 1999;44(4):750–60.
13. Romolo FS, Margot P. Identification of gunshot residue: a criticalreview. Forensic Sci Int 2001;119:195–211.
14. Lindsay E, McVicar MJ, Gerard RV, Randall ED, Pearson J. Passiveexposure and persistence of gunshot residue (GSR) on bystanders to ashooting: comparison of shooter and bystander exposure to GSR. CanSoc Forensic Sci J 2011;44(3):89–96.
15. Mejia R. Why we cannot rely on firearm forensics. New Sci 2005;(2527):6.
16. Aleksandar I. Is there a way to precisely identify that the suspect firedfrom the firearm? Forensic Sci Int 2003;136(Suppl. 1):158–9.
Additional information and reprint requests:Jukka Corander, Ph.D.Department of Mathematics and StatisticsUniversity of HelsinkiP.O. Box 6800014 HelsinkiFinlandE-mail: [email protected]
GAURIOT ET AL. . STATISTICAL CHALLENGES IN THE QUANTIFICATION OF GSR EVIDENCE 1155