statistical applications in genetics and molecular...
TRANSCRIPT

Volume 10, Issue 1 2011 Article 38
Statistical Applications in Geneticsand Molecular Biology
Entropy Based Genetic Association Tests andGene-Gene Interaction Tests
Mariza de Andrade, Mayo ClinicXin Wang, Mayo Clinic
Recommended Citation:de Andrade, Mariza and Wang, Xin (2011) "Entropy Based Genetic Association Tests and Gene-Gene Interaction Tests," Statistical Applications in Genetics and Molecular Biology: Vol. 10:Iss. 1, Article 38.DOI: 10.2202/1544-6115.1719Available at: http://www.bepress.com/sagmb/vol10/iss1/art38
©2011 Berkeley Electronic Press. All rights reserved.

Entropy Based Genetic Association Tests andGene-Gene Interaction Tests
Mariza de Andrade and Xin Wang
Abstract
In the past few years, several entropy-based tests have been proposed for testing either singleSNP association or gene-gene interaction. These tests are mainly based on Shannon entropy andhave higher statistical power when compared to standard χ2 tests. In this paper, we extend some ofthese tests using a more generalized entropy definition, Rényi entropy, where Shannon entropy is aspecial case of order 1. The order λ (>0) of Rényi entropy weights the events (genotype/haplotype)according to their probabilities (frequencies). Higher λ places more emphasis on higher probabilityevents while smaller λ (close to 0) tends to assign weights more equally. Thus, by properlychoosing the λ, one can potentially increase the power of the tests or the p-value level ofsignificance. We conducted simulation as well as real data analyses to assess the impact of theorder λ and the performance of these generalized tests. The results showed that for dominantmodel the order 2 test was more powerful and for multiplicative model the order 1 or 2 had similarpower. The analyses indicate that the choice of λ depends on the underlying genetic model andShannon entropy is not necessarily the most powerful entropy measure for constructing geneticassociation or interaction tests.
KEYWORDS: Rényi entropy, genetic association, gene-gene interaction
Author Notes: Mariza de Andrade, Division of Biomedical Statistics and Informatics, Departmentof Health Sciences Research, Mayo Clinic, Rochester, MN. Xin Wang, Division of BiomedicalStatistics and Informatics, Department of Health Sciences Research, Mayo Clinic, Rochester, MN.The authors thank DeLaine Anderson for her technical assistance in the manuscript and Dr. JohnHeit for giving permission to use the VTE data set. MdA was funded in part by the NationalInstitutes of Health research grants R01 HL87660 and R01 HL04735. XW was funded in part byMayo Clinic. The authors contributed equally in the manuscript.

1 IntroductionThe strategy of using a single locus to test for association with a particular pheno-type has not been as successful as one would expect [Manolio et al. (2009)]. Thismay be due to different reasons such as the predominance of common variants inthe genome-wide platforms, and the synergy between environment and genetic riskfactors as well as between different genetic risk factors [Kraft et al. (2007), Thomas(2010)]. However, complex human genetic diseases are typically caused not onlyby marginal effects of genes or gene-environment interactions, but also by the in-teractions of multiple genes [Cordell (2009)]. Recently, gene-gene interaction, orepistasis, has been a hot topic in molecular and quantitative genetics.
If the effect at one genetic locus is altered or masked by the effects at anotherlocus, single-locus tests or marginal tests may not be able to detect the association.By allowing for epistatic interactions among potential disease loci, we may succeedin identifying genetic variants that might otherwise remain undetected.
Several statistical techniques have been applied or developed in detectingstatistical epistasis or gene-gene interaction [Cordell (2009)]. Among those tech-niques the most applied ones are logistic regression models and χ2-tests of inde-pendence due to easy access in well known statistical packages. However, littleattention has been given to the entropy methods. Entropy methods are best knownfor their application in information theory with the seminal work by Kullback andLeibler [Kullback and Leibler (1951)]. Shannon’s entropy is one of the most wellknown entropy measures, and it is the one that has been applied in single locus andgene-gene interaction analyses [Zhao et al. (2005), Dong et al. (2008), Kang et al.(2008)]. However, Shannon’s entropy is a particular case of a more generalizedtype of entropy, the Renyi entropy [Renyi (1960)].
The goal of this study is to extend the application of Shannon entropy toRenyi entropy in a single locus association as well as gene-gene interaction. Sinceentropy measures are nonlinear transformations of the variable distribution, an en-tropy measure of allele frequencies can amplify the allele difference between groupsof interest (e.g. case/control). Furthermore, the extension to Renyi entropy intro-duces more flexibility in such transformations.
Thus, in this paper, we have proposed several Renyi entropy based tests andcompared the performance of the novel tests to some traditional methods. We firstintroduced a single locus association test under two-group design, then a one-groupgene-gene interaction test under linkage equilibrium (LE) assumption. The powerof these tests was compared through simulations. We demonstrated that by properlychoosing the Renyi entropy order λ , we could increase the power of the associationtest. We also discussed possible ways to construct a two-group interaction test andhow to check whether an interaction effect is due to disease or not under case-
1
de Andrade and Wang: Entropy Methods for Association and Interaction Tests
Published by Berkeley Electronic Press, 2011
control design. All the methods introduced in this paper were applied in analyzingreal venous thromboembolism (VTE) case-control data.
Throughout this paper, we use the terminology “statistical gene-gene inter-action test” or “statistical epistasis test” for interaction test. The word “entropy”refers to Renyi entropy unless otherwise specified. The simulation data sets weregenerated by GWAsimulator [Li et al. (2007)] and the analyses were performed byusing R functions written by the authors.
2 Methods
2.1 Renyi Entropy
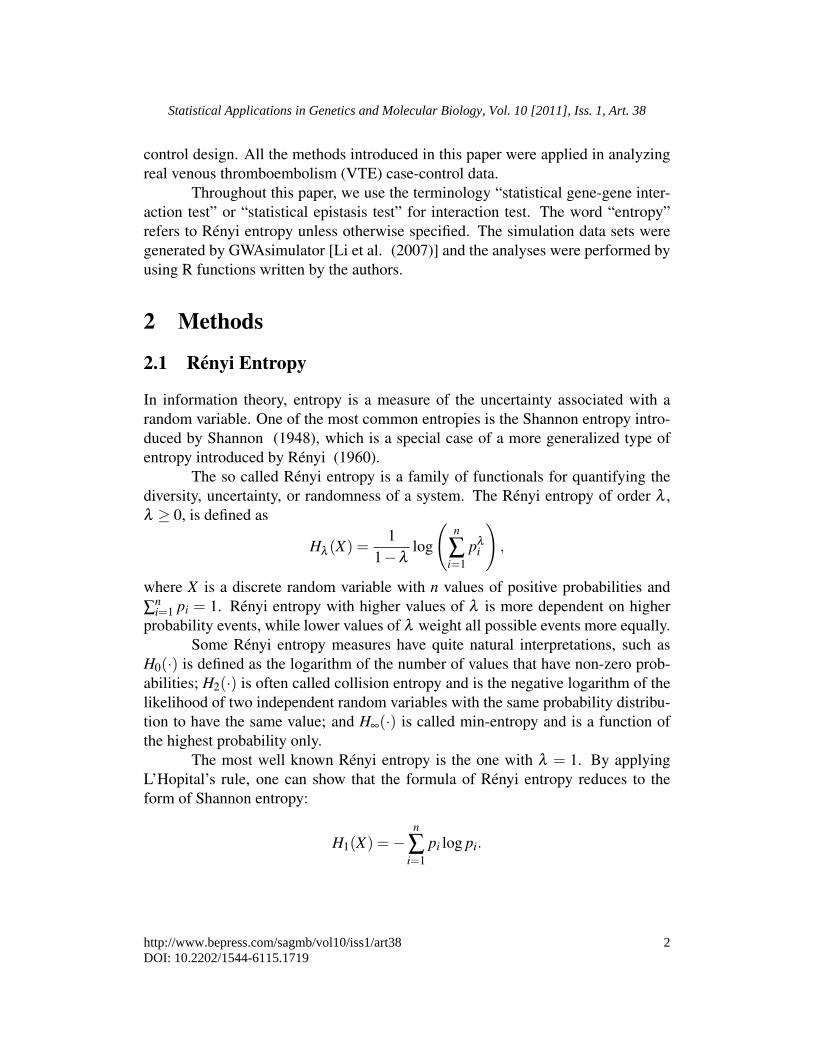
In information theory, entropy is a measure of the uncertainty associated with arandom variable. One of the most common entropies is the Shannon entropy intro-duced by Shannon (1948), which is a special case of a more generalized type ofentropy introduced by Renyi (1960).
The so called Renyi entropy is a family of functionals for quantifying thediversity, uncertainty, or randomness of a system. The Renyi entropy of order λ ,λ ≥ 0, is defined as
Hλ (X) =1
1−λlog
(n
∑i=1
pλi
),
where X is a discrete random variable with n values of positive probabilities and∑
ni=1 pi = 1. Renyi entropy with higher values of λ is more dependent on higher
probability events, while lower values of λ weight all possible events more equally.Some Renyi entropy measures have quite natural interpretations, such as
H0(·) is defined as the logarithm of the number of values that have non-zero prob-abilities; H2(·) is often called collision entropy and is the negative logarithm of thelikelihood of two independent random variables with the same probability distribu-tion to have the same value; and H∞(·) is called min-entropy and is a function ofthe highest probability only.
The most well known Renyi entropy is the one with λ = 1. By applyingL’Hopital’s rule, one can show that the formula of Renyi entropy reduces to theform of Shannon entropy:
H1(X) =−n
∑i=1
pi log pi.
2
Statistical Applications in Genetics and Molecular Biology, Vol. 10 [2011], Iss. 1, Art. 38
http://www.bepress.com/sagmb/vol10/iss1/art38DOI: 10.2202/1544-6115.1719

2.2 Association Tests
In this section, we derive a model free association test based on Renyi entropy.Under a two-group design, such as a case-control design, one may test whether aset of SNPs or a single SNP is associated with the disease of interest by comparingthe entropy of the first group (case group) to the second group (control group).
Let us assume a locus with k genotypes G1,G2, . . . ,Gk. For the diseasepopulation, let PD = [pD
1 , . . . , pDk ] be the distribution of the genotypes, where pD
i isthe probability of a case having genotype Gi at a locus of interest. Similarly let usdenote the genotype distribution of normal population by PN = [pN
1 , . . . , pNk ], where
pNi is the probability of a control having genotype Gi at a locus of interest. Under
null hypothesis of no association, PD and PN are identical.For a given observed case-control data, let PD and PN be the estimated distri-
bution of genotypes of cases and controls, respectively. The Renyi entropy of orderλ is calculated as
Hλ (PD) =1
1−λlog
(k
∑i=1
(pDi )λ
). (1)
Similarly, one calculates Hλ (PN). The difference between the two entropy statistics
SAλ
= Hλ (PD)−Hλ (PN) (2)
is then considered the association test statistic with superscript A standing for ”as-sociation”.
In the appendix, we show that the entropy statistic (2) follows asymptoti-cally a normal distribution. Therefore, a test of difference between the two groupscan be constructed, where a significant difference indicates a possible associationbetween the SNP and the disease.
For multiple loci, it is worth noting that this test may include or excludethe effect of interaction depending on the way PD and PN are estimated. To allowfor interaction, the genotype distributions should be jointly estimated. To test formarginal effects only, one could estimate PD and PN as the product of the marginalprobability estimates.
When λ = 1, the Renyi entropy reduces to the Shannon entropy, i.e.,
limλ→1
Hλ (PD) =−k
∑i=1
(pDi ) log(pD
i ). (3)
Thus the statistic of the association test SA1 is a summation of terms of the form
pi log(pi)− qi log(qi), where i is the index over all genotypes with p and q repre-senting the corresponding distributions of the case group and the control group. By
3
de Andrade and Wang: Entropy Methods for Association and Interaction Tests
Published by Berkeley Electronic Press, 2011

studying each component of the statistics, one can tell which genotype has the mostimpact on the statistics, and consequently, it can help us choose the appropriate λ
for the association test. For the purpose of achieving more power to observe a dif-ference between genotype frequency in cases and controls, the choice of λ dependson where the main difference lies, whether on the higher or the lower genotype fre-quencies. One should favor a larger λ value for the former and a smaller λ valuefor the latter.
The R codes of the entropy test are available upon request. We tested thecomputing time of the association test using a PC processor Intel(R) Core(TM)2 Duo CPU P7750 @2.26GHz. The test data set contains 1000 cases and 1000controls. It took about 0.4 sec to get the association test results of one SNP with20 different λ values. Since most of the computational time is contributed to thecalculation of frequency of genotypes, we recommend to apply the association testusing multiple values of lambda simultaneously.
2.3 Interaction Test
2.3.1 One-group analysis (case-only or control-only)
In this section we describe the Renyi entropy based interaction test of two loci,L1 and L2, in detail. A generalization of the test for three or more loci is straightforward. Assume the two loci are in linkage equilibrium with the first locus havingtwo alleles, A and a, and the second locus two alleles, B and b. Let pL1
0 , pL11 , pL1
2denote the probabilities of three genotypes aa, aA and AA, respectively, at the firstlocus. Similarly, at the second locus, let pL2
0 , pL21 , pL2
2 denote the correspondingprobabilities of three genotypes bb, bB and BB. Then the joint probability of thenine genotype combinations is represented by pi j, i, j = 0,1,2, with i and j beingthe index of the genotypes at the first and second locus, respectively.
Define qi j = pL1i pL2
j as the product of the two marginal probabilities. Underthe null hypothesis of no interaction effect, the two loci are independent and theentropy calculated based on the true joint probability pi j and on the induced qi jshould be identical.
We first estimate the joint and the marginal probabilities as the observedfrequencies pi j, pL1
i and pL2j . The induced joint probability is then the product of
the observed marginal frequencies qi j = pL1i pL2
j . The entropy (1) can be estimatedusing either the observed frequencies P = pi j or the induced frequencies Q = qi j.The proposed interaction (epistasis) test statistic, denoted as SE
λ, is calculated as the
entropy difference between the two entropy estimates,
SEλ
= Hλ (Q)−Hλ (P) = Hλ (P1)+Hλ (P2)−Hλ (P), (4)
4
Statistical Applications in Genetics and Molecular Biology, Vol. 10 [2011], Iss. 1, Art. 38
http://www.bepress.com/sagmb/vol10/iss1/art38DOI: 10.2202/1544-6115.1719

where P1 = pL1i and P2 = pL2
j are the observed marginal genotype distributions ofthe first and second locus, respectively. A statistically significant difference meansan interaction between the two loci.
For case-only study, in the case where λ = 1 and n is the case-only samplesize, the statistic 2nSE
1 is the interaction test statistic proposed by Kang et al. (2008).The statistics is asymptotically distributed as a χ2 with 4 degrees of freedom. Fora more general λ , the asymptotic distribution of (4) under null is unknown. Thussimulation methods such as Monte Carlo simulations are needed to determine itsdistribution and p-values. For a given pair of SNPs, permute the genotypes of oneSNP among subjects to break the possible joint structure of the pair. Follow witha calculation of the test statistic SE
λusing the permuted data. Generate N permu-
tation samples and for each permuted sample calculate the test to estimate the nulldistribution of (4).
We tested the computing time of the interaction test using a PC processorIntel(R) Core(TM) 2 Duo CPU P7750 @2.26GHz. The data set contains 1000samples. The calculation of interaction tests is based on 1000 shuffles and it tookabout 10.5 sec to get the one-group test results of one pair of SNPs. Note that mostof the computational time is attributed to the calculation of frequency of genotypes,thus it makes almost no difference if we test using only one value of lambda ormultiple values of λ . The R code is available upon request.
2.3.2 Two-group analysis
A question one may ask is, for a given significant p-value of an interaction test,how does one know if the interaction is truly due to either the disease or to someunknown cause. Under a case-control design, we can apply the one group interac-tion test to both case and control groups separately. If the interaction effect is notdue to the disease, we would expect the case group and control group to behavesimilarly. The question then becomes how to compare the test results between thetwo groups.
First, we compared the test statistics of two groups using the ratio of teststatistics. Let SE
λ(Case) and SE
λ(Ctrl) be the corresponding test statistics of the two
groups, then SEλ(Case)/SE
λ(Ctrl) should be close to 1 under null. If the ratio of the
statistics is significantly different from 1, the case group and control group are notequivalent in terms of interaction, therefore, the difference may be associated withthe disease. The null distribution of the ratio statistics can be estimated using thealready generated permutation samples of each one-group analysis, thus, the com-puting time is just the summation of the computing time of two one-group analysis.Our simulation results (data not shown) showed that the power to detect the true
5
de Andrade and Wang: Entropy Methods for Association and Interaction Tests
Published by Berkeley Electronic Press, 2011

difference is weak, especially when the marginal effect is strong. Larger samplesize is needed to get reliable test results, however, the exact sample size is not eas-ily determined. It depends on the disease model, the strength of the interaction andthe marginal effects.
In the case where a significant p-value for the case group and an insignif-icant p-value for the control group are observed, a further permutation test can beperformed to investigate whether these two groups are truly different in terms ofp-value significance. Notice that here we compare the p-values of interaction tests,thus only interaction effect difference is studied. The comparison can be done usinga 2-step procedure. In the first step the case-control indicator is shuffled to createnew case and control groups and to recalculate the interaction test for these twogroups. The second step is to compare the group p-value difference (defined as thep-value of the control group minus the p-value of the case group) of the observeddata to the group p-value difference of the shuffled sample. Repeat these two steps ntimes (n to be determined by the investigators) to obtain the proportion of the shuf-fled sample group p-value difference exceeding the observed sample group p-valuedifference, which is the empirical p-value of the permutation test. A significant re-sult of the permutation test indicates the case group has more significant interactionthan the control group, which means the interaction is associated with the disease.Since this procedure requires a lot of permutation, this method is computational in-tensive and may be only feasible to apply to a small set of genes or SNPs. Using aPC processor Intel(R) Core(TM) 2 Duo CPU P7750 @2.26GHz, it takes n×21 secto compare the p-values of one pair of SNPs for a date set of 1000 cases and 1000controls, where n is the number of permutations.
3 SimulationIn this study we performed Monte Carlo simulations to investigate the performanceof the entropy-based tests for several λ values. We also compared our results withtwo other methods, χ2-test for contingency tables and likelihood ratio (LR) test forlogistic regression. Data were simulated using GWAsimulator Version 2.0 [Li et al.(2007)].
3.1 Simulation 1: Comparison between association tests
We studied the performance of the entropy-based association tests with parameterλ = 0.9,1,2 and compared it to the logistic regression method. LR tests were usedto test for the significance of the allele effect in the regression model.
6
Statistical Applications in Genetics and Molecular Biology, Vol. 10 [2011], Iss. 1, Art. 38
http://www.bepress.com/sagmb/vol10/iss1/art38DOI: 10.2202/1544-6115.1719

Data were simulated using logistic models [Li et al. (2007)]. Four differentmarginal effect models were considered: weak dominant, strong dominant, weakmultiplicative and strong multiplicative. The dominant marginal effect (thresholdmarginal) is not affected by the number of copies of risk allele as long as at least onecopy is present. The multiplicative marginal assumes the relative risk (compared tothe risk with zero copy of risk allele) increases multiplicatively as the number ofcopies of the risk allele increases. Given a disease locus, let R1 be the relative riskwith 1 copy of risk allele and R2 be the relative risk with two copies, then dominantmarginal satisfies R1 = R2 and multiplicative marginal satisfies R2 = R2
1.Let gi = 0,1,2 be the number of copies of the the risk allele at SNP i, and
define f (gi) = Pr(affected|gi) as the penetrance for genotype gi. Then, the diseasemodels can be described by the following formula:
logit[ f (gi)] = β0 +β1Igi=1 +β2Igi=2, (5)
where β j is the marginal effect coefficient of the disease locus with j copies ofrisk allele. These parameters are calculated approximately as the natural log of thecorresponding relative risk.
For our simulation we fixed the risk allele frequency as 0.15. Relative riskR1 was chosen to be 1.25 as weak and 1.5 as strong. For each disease model, 1000data sets were simulated. The coefficients in (5) for each model are shown in thefollowing Table 1:
Model β0 β1 β21: WD -1.844 0.265 0.2652: SD -1.968 0.484 0.4843: WM -1.864 0.265 0.5424: SM -1.990 0.483 1.017
Table 1: Parameters for the four disease models: Weak Dominant (WD), StrongDominant (SD), Weak Multiplicative (WM), Strong Multiplicative (SM)
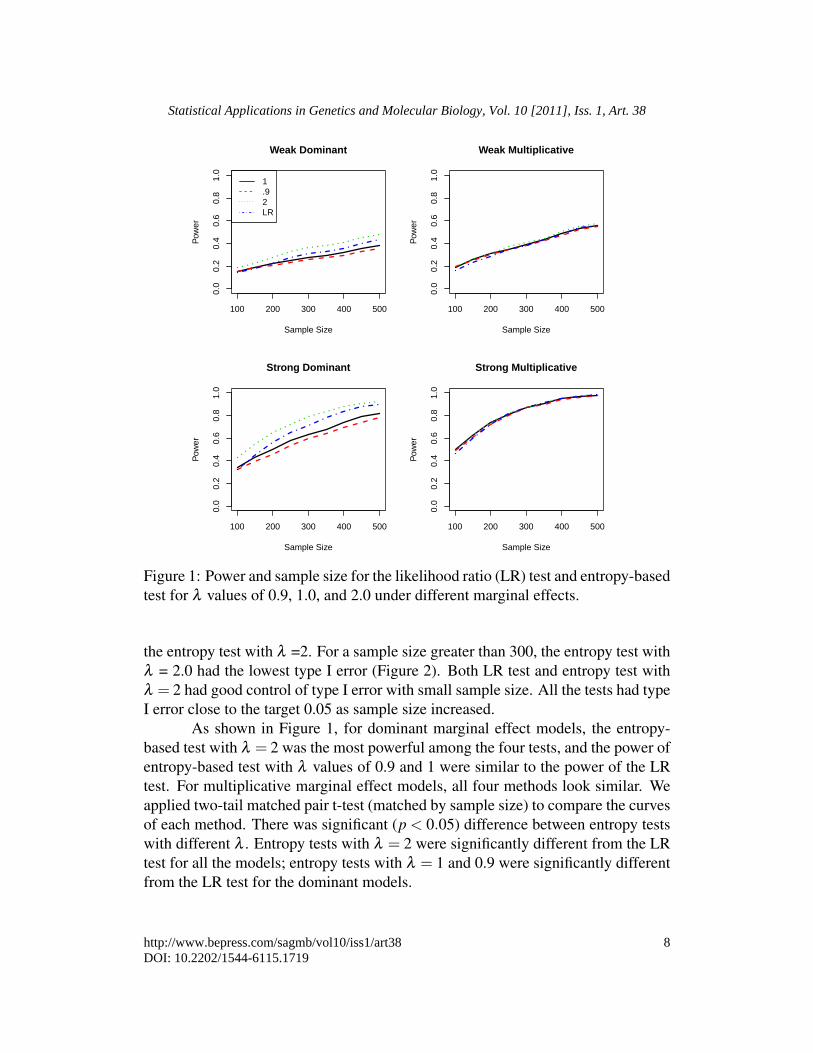
Each simulated data set was analyzed by Renyi entropy association testswith λ values of 0.9, 1, and 2. A logistic regression model assuming additive ge-netic effect was fitted to each data set. The likelihood ratio test was used to testthe association of a single SNP to the disease. For each test, power was calculatedas the percentage of having p value less than 0.05 over the 1,000 simulations. Thepower of the four tests under four disease models was summarized in Figure 1. Wealso evaluated the false positive (type I error) rates for the LR and entropy-basedtests under different sample sizes. We observed that for a sample size less than orequal to 300, the LR test had the lowest type I error rate (below 0.05) followed by
7
de Andrade and Wang: Entropy Methods for Association and Interaction Tests
Published by Berkeley Electronic Press, 2011
100 200 300 400 500
0.0
0.2
0.4
0.6
0.8
1.0
Weak Dominant
Sample Size
Pow
er
1.92LR
100 200 300 400 500
0.0
0.2
0.4
0.6
0.8
1.0
Weak Multiplicative
Sample Size
Pow
er
100 200 300 400 500
0.0
0.2
0.4
0.6
0.8
1.0
Strong Dominant
Sample Size
Pow
er
100 200 300 400 500
0.0
0.2
0.4
0.6
0.8
1.0
Strong Multiplicative
Sample Size
Pow
er
Figure 1: Power and sample size for the likelihood ratio (LR) test and entropy-basedtest for λ values of 0.9, 1.0, and 2.0 under different marginal effects.
the entropy test with λ =2. For a sample size greater than 300, the entropy test withλ = 2.0 had the lowest type I error (Figure 2). Both LR test and entropy test withλ = 2 had good control of type I error with small sample size. All the tests had typeI error close to the target 0.05 as sample size increased.
As shown in Figure 1, for dominant marginal effect models, the entropy-based test with λ = 2 was the most powerful among the four tests, and the power ofentropy-based test with λ values of 0.9 and 1 were similar to the power of the LRtest. For multiplicative marginal effect models, all four methods look similar. Weapplied two-tail matched pair t-test (matched by sample size) to compare the curvesof each method. There was significant (p < 0.05) difference between entropy testswith different λ . Entropy tests with λ = 2 were significantly different from the LRtest for all the models; entropy tests with λ = 1 and 0.9 were significantly differentfrom the LR test for the dominant models.
8
Statistical Applications in Genetics and Molecular Biology, Vol. 10 [2011], Iss. 1, Art. 38
http://www.bepress.com/sagmb/vol10/iss1/art38DOI: 10.2202/1544-6115.1719

100 200 300 400 500
0.02
0.04
0.06
0.08
0.10
NULL
Sample Size
Type
I er
ror
rate
1.92LR
Figure 2: Type I error rate of likelihood ratio (LR) test and entropy-based test withλ values of 0.9, 1.0 and 2.0
0.5 1.0 1.5 2.0 2.5 3.0 3.5 4.0
0.2
0.4
0.6
0.8
1.0
Strong Dominant
lambda
pow
er
0.5 1.0 1.5 2.0 2.5 3.0 3.5 4.0
0.2
0.4
0.6
0.8
1.0
Strong Multiplicative
lambda
pow
er
100300500
Figure 3: Power of the entropy-based test with sample size 100, 300 and 500 fordifferent λ values under strong dominant and multiplicative marginal effects
9
de Andrade and Wang: Entropy Methods for Association and Interaction Tests
Published by Berkeley Electronic Press, 2011

sample sizes 100, 300 and 500 under strong dominant and strong multiplicativemarginal effects. The power of the test with λ between 1 and 2 was about the samefor multiplicative model, while for dominant model, the power of λ = 1 test hadmuch lower power compared to the λ = 2 test. The curves under multiplicativemarginal effect were relatively flat compared to those under dominant marginaleffect. The figure illustrates that the multiplicative model was not very sensitive tothe choice of λ , while properly chosen λ greatly improved the power to detect thedominant marginal effect.
3.2 Simulation 2: Comparison between Interaction Tests
We studied the performance of the one-group and two group entropy-based inter-action tests with parameter λ = 0.9,1,2 and compared the one-group test to thestandard χ2-test of association between genotypes at the two loci for a case-onlyanalysis. We considered two disease loci models with three types of marginal ef-fects (no marginal, dominant marginal and multiplicative marginal) and two typesof interaction effects (threshold interaction and multiplicative interaction).
The dominant interaction, also called threshold interaction, assumes thesame interaction effect for all genotypes with at least one copy of risk allele at bothdisease loci. The multiplicative interaction increases multiplicatively as the numberof copies of disease allele increases. Let ri j be the relative risk with i copies ofrisk allele at disease locus 1 and j copies at disease locus 2 (compared to the casewith i copies at locus 1 and j copies at locus 2 but without interaction effect). Forthreshold interaction, r11 = r12 = r21 = r22 holds. For multiplicative interaction,r12 = r21 = r2
11 and r22 = r411.
Let gi = 0,1,2 be the number of copies of the risk allele at a locus/gene/SNPi,(i = 1,2), and f (g1,g2) = Pr(affected|g1,g2) the penetrance for the genotypes(g1,g2). The disease models can then be described by the following formula:
logit[ f (g1,g2)] = β0 +β11Ig1=1 +β12Ig1=2 +β21Ig2=1 +β22Ig2=2+γ11Ig1=1,g2=1 + γ12Ig1=1,g2=2+γ21Ig1=2,g2=1 + γ22Ig1=2,g2=2,
(6)
where the βi j is the marginal effect coefficient of disease locus i with j copies of riskallele, ∀ i,j, and the γi j the interaction effect coefficient with i copies of risk allele atdisease locus 1 and j copies of risk allele at disease locus 2. These parameters arecalculated approximately as the natural log of the corresponding relative risk.
We simulated 1,000 data sets from each of the disease models specifiedabove. We set the risk allele frequencies of 0.15 for locus 1 and 0.075 for locus 2respectively, with a relative risk of r1 = 4. The coefficients in (6) are specified inTable 2.
Figure 3 depicts the power of entropy-based test with different λ values for
10
Statistical Applications in Genetics and Molecular Biology, Vol. 10 [2011], Iss. 1, Art. 38
http://www.bepress.com/sagmb/vol10/iss1/art38DOI: 10.2202/1544-6115.1719

200 400 600 800 1000
0.0
0.2
0.4
0.6
0.8
1.0
Threshold interaction, no marginal
Sample Size
Pow
er
1
.9
2
chi2
200 400 600 800 1000
0.0
0.2
0.4
0.6
0.8
1.0
Multiplicative interaction, no marginal
Sample Size
Pow
er
200 400 600 800 1000
0.0
0.2
0.4
0.6
0.8
1.0
Threshold interaction, threshold marginal
Sample Size
Pow
er
200 400 600 800 1000
0.0
0.2
0.4
0.6
0.8
1.0
Multiplicative interaction, threshold marginal
Sample Size
Pow
er
200 400 600 800 1000
0.0
0.2
0.4
0.6
0.8
1.0
Threshold interaction, multiplicative marginal
Sample Size
Pow
er
200 400 600 800 1000
0.0
0.2
0.4
0.6
0.8
1.0
Multiplicative interaction, multiplicative marginal
Sample Size
Pow
er
Figure 4: Six models with different marginal and interaction effects under case-onlydesign. Power of χ2-test and entropy-based tests with λ = 0.9, 1 and 2 are plottedagainst the sample size
Under one group design (for instance, case-only), we evaluated the perfor-mance of the entropy-based test of three λ values, 0.9, 1.0, and 2.0 with the χ2 testby comparing their powers. The simulation results (refer to Figure 4) showed thatfor all six models, the entropy tests SE
λwith λ ≥ 1 had higher power than the χ2
test. On the other hand, the tests with λ < 1 had lower power. As shown in thefigure, λ = 2 has the highest power especially for the models with multiplicativeinteraction. We applied two-tail matched pair t-test (matched by sample size) tocompare the curves of each methods. There was significant (p < 0.05) difference
11
de Andrade and Wang: Entropy Methods for Association and Interaction Tests
Published by Berkeley Electronic Press, 2011

Model β0 β11 β12 β21 β22 γ11 γ12 γ21 γ221: N/D -1.816 0 0 0 0 1.386 1.386 1.386 1.3862: D/D -2.074 0.484 0.484 0.490 0.490 1.386 1.386 1.386 1.3863: M/D -2.096 0.483 1.017 0.490 1.037 1.386 1.386 1.386 1.3864: N/M -1.775 0 0 0 0 0.693 1.386 1.386 2.7735: D/M -2.023 0.484 0.484 0.490 0.490 0.693 1.386 1.386 2.7736: M/M -2.045 0.483 1.017 0.490 1.037 0.693 1.386 1.386 2.773Table 2: Coefficients of the six models (-/-): first letter labels the marginal effectand second letter labels the interaction effect. “N” for null, “D” for dominant, “M”for multiplicative.
between entropy tests with different λ . Entropy tests with λ = 2 and 0.9 were sig-nificantly different from the χ2-tests for all the models; entropy tests with λ = 1were significantly different from the χ2-test for the models without marginal effectand for the model with dominant (threshold) marginal and interaction effects. Byproperly choosing parameter λ , one can potentially increase the power.
Under two group design, we have also evaluated the performance of the ratiostatistics to detect interaction for the case-control design. Our simulation showedthat λ = 1 usually had better performance. We compared the test with the LR testunder certain scenarios. The power of the ratio test was low, specially when themarginal effect was strong (data not shown). As stated in section 2.3.2, this test isonly recommended for large sample size.
4 Real Data Application
4.1 Venous Thromboembolism (VTE) Data Set DescriptionThe data set consists of 1270 VTE subjects and 1302 unrelated controls collectedto participate in a candidate-gene study. 12,296 SNPs located in 764 genes weregenotyped. More details about this study can be found in Heit et al. (2011).Because there is a genomic region on chromosome 1q24.2 that contains a clusterof 5 genes highly associated with VTE, we decided to investigate this region forpotential association and SNP-SNP interactions using our proposed entropy-basedtests. A total of 102 SNPs were analyzed.
4.2 AssociationWe applied entropy-based test with λ = 0.9, 1.0 and 2.0 to test the association ofeach single SNP. The LR test was performed using a logistic regression model with
12
Statistical Applications in Genetics and Molecular Biology, Vol. 10 [2011], Iss. 1, Art. 38
http://www.bepress.com/sagmb/vol10/iss1/art38DOI: 10.2202/1544-6115.1719

additive genetic effect. Twenty-one SNPs were identified as significant (p < 0.05)by each of the three entropy-based tests. The p-values of those 21 SNPs are listedin Table 3.
SNP Gene LR λ = 0.9 λ = 1 λ = 2rs2420371 F5 2.22E-16 4.22E-15 1.33E-15 6.66E-16rs16861990 NME7 2.11E-13 3.03E-12 1.14E-12 2.65E-13rs1208134 SLC19A2 4.81E-13 9.34E-12 3.10E-12 3.43E-13rs2038024 SLC19A2 1.09E-10 2.62E-09 1.27E-09 1.97E-10rs3766031 ATP1B1 2.55E-05 1.73E-05 1.59E-05 5.55E-05rs6656822 SLC19A2 2.35E-05 0.000259 0.000234 7.47E-05rs4524 F5 0.001123 0.000403 0.000386 0.000558rs10158595 F5 0.001018 0.000403 0.000392 0.000911rs9332627 F5 0.001181 0.000415 0.000399 0.000604rs2239851 F5 0.001189 0.000419 0.000403 0.000592rs4525 F5 0.001262 0.000426 0.00041 0.000614rs970741 F5 0.002286 0.001043 0.000997 0.001292rs723751 SLC19A2/F5 0.00203 0.003416 0.003036 0.001767rs6030 F5 0.000572 0.004033 0.003842 0.002098rs3820059 C1orf114 6.92E-05 0.004635 0.004988 0.011502rs2176473 NME7 0.000528 0.006444 0.007138 0.021481rs4656687 F5 0.001071 0.007846 0.007588 0.004945rs1040503 ATP1B1 0.001453 0.011241 0.012167 0.029942rs10800456 F5 0.004685 0.01346 0.012734 0.007133rs3766077 NME7 0.026623 0.034665 0.035445 0.045988rs16828170 NME7 0.070794 0.03606 0.035897 0.035187
Table 3: The p-values (from likelihood ratio test and entropy-based test with λ =0.9,1 and 2) of the most significant 21 SNPs sorted by entropy-based associationtest with λ = 1.
As previously stated, the Renyi entropy reduces to the Shannon entropywhen λ = 1, therefore the entropy-based association test statistics is a summationof terms of the form pi log(pi)−qi log(qi), where i is the index over all genotypes ofthe SNPs in the test and p and q refer to the two different distributions of case groupand control group, respectively. Each component of the statistics follows a normaldistribution and the standard deviation can then be estimated by delta method (seeAppendix). Thus, to illustrate the effect of Renyi Entropy parameter λ , we de-composed the test statistics at λ = 1. Three typical SNPs’ analysis results weredisplayed. One was very significantly associated with VTE (rs2038024) in all three
13
de Andrade and Wang: Entropy Methods for Association and Interaction Tests
Published by Berkeley Electronic Press, 2011

tests, and the other two demonstrated a moderate significant association with VTE(rs9332627 and rs2176473). SNP names, genotypes, genotype frequencies withincase group, genotype frequencies within control group, the component statistics,and the standard deviation estimate of each component and p-value are listed in Ta-ble 4. The analysis showed that the most significant component of SNP rs2038024was genotype 0, followed by genotype 1 and genotype 2. It is worth noting thatgenotype 0 had the highest frequency, followed by genotype 1, with genotype 2having the lowest frequency. For this SNP, the main difference between case andcontrol groups came from the high frequency genotypes. To emphasize the differ-ence on high frequency genotypes, one may increase the λ value. As shown in Fig-ure 5 top panel, the p-value declined as λ increased. For SNP rs2176473, the geno-type with lower frequency was more significant. In this case, the p-value decreasedas the λ value moved toward 0 (Figure 5, bottom panel). For SNP rs9332627, therewas no monotonicity between the genotype frequency and the significance of thecomponents, and the minimum p-value was not achieved at the limits, but ratheraround λ =1.2.
Case freq Ctrl freq Stat comp SD p-valuers2038024
0 0.6144 0.7281 0.0683 0.0112 9.36E-101 0.3368 0.2488 0.0204 0.0041 7.85E-072 0.0489 0.0230 0.0607 0.0171 3.78E-04
rs93326270 0.5923 0.5438 -0.0211 0.0085 0.01301 0.3644 0.3840 0.0003 0.0003 0.31582 0.0434 0.0722 -0.0537 0.0170 0.0016
rs21764730 0.3462 0.3940 0.0003 0.0001 0.05161 0.4740 0.4731 -0.0002 0.0050 0.96532 0.1798 0.1329 0.0403 0.0123 0.0010
Table 4: Decomposition of the Shannon entropy statistics of three SNPs
To investigate whether two or more SNPs are jointly associated with a phe-notype, one can apply the entropy test to the joint frequency of the SNPs of interest.We checked the pairwise joint association for the VTE data set. As one would ex-pect, pairs with one or both SNPs of strong marginal effect were strongly associatedwith the disease. Figure 6, upper panel, depicts the histogram of p-values (entropy-based association test with λ = 2) for all possible pairs. Thirty percent (1571 outof 5151) pairs had p-values less than 0.05. We also investigated the joint effect ofSNPs without strong marginal effect. SNPs other than those 21 (identified by the
14
Statistical Applications in Genetics and Molecular Biology, Vol. 10 [2011], Iss. 1, Art. 38
http://www.bepress.com/sagmb/vol10/iss1/art38DOI: 10.2202/1544-6115.1719

0.0 0.5 1.0 1.5 2.0 2.5 3.00.
0e+
001.
5e−
06
rs2038024
lambda
p
0.0 0.5 1.0 1.5 2.0 2.5 3.0
0.00
050.
0015
rs9332627
lambda
p
0.0 0.5 1.0 1.5 2.0 2.5 3.0
0.01
0.03
0.05
rs2176473
lambda
p
Figure 5: The changing pattern of entropy-based association test p-values of SNPsrs2038024, rs9332627 and rs2176473
previous association test based on the frequency of a single SNP) were consideredSNPs with moderate or no marginal effect. The histogram in the lower panel ofFigure 6 is based on the pairs with both SNPs moderate or of no marginal effect.Six percent (204 out of 3240) pairs had p-values less than 0.05. The shape of thehistogram is a little skewed to the left. The joint association test seems to havelower power when the marginal effect is weak or absent.
4.3 Interaction
Entropy-based interaction tests were applied to the VTE data set. We first appliedthe tests to case group and control group separately. For an interaction associatedwith the disease, one would expect the test result of the case group to be significant
15
de Andrade and Wang: Entropy Methods for Association and Interaction Tests
Published by Berkeley Electronic Press, 2011

All pairs
p values
Fre
quen
cy
0.0 0.2 0.4 0.6 0.8 1.00
500
1500
Pairs with moderate or no marginal effect
p values
Fre
quen
cy
0.0 0.2 0.4 0.6 0.8 1.0
020
040
0
Figure 6: Distribution of p-values of entropy-based association tests for SNP pairs.Upper panel: SNP pairs of strong, moderate or no marginal effect. Lower panel:SNP pairs of moderate or no marginal effect.
while that of the control group insignificant. To check if the case group and thecontrol group differ in terms of interaction effect, we applied further permutationto compare p-values between case and control groups. The case-control indicatorwas shuffled to create new case and control groups and tests were performed usingthe shuffled data. The details of the two-step procedure is described in the lastparagraph of subsection 2.3.2.
Due to heavy computational burden, we only considered λ = 1 as an ex-ample, and we set up the threshold of significance and insignificance as 0.05 and0.2, respectively, and only considered the SNP pairs with case group p-value lessthan 0.05 and control group p-value greater than 0.2. There were 182 pairs of SNPsthat met the criteria. We applied the p-values comparison procedure to those 182SNP pairs and calculated the p-values of the comparison (for a given SNP pair, ittests if the interaction effect of case group is more significant than the control groupinteraction effect). Among those p-values of comparison, 82 were less than 0.05.Accordingly, those 82 pairs, with a case group p-value smaller than the controlgroup p-value, may have interaction associated with the disease and deserve furtheranalysis. These pairs are listed in Table 5.
16
Statistical Applications in Genetics and Molecular Biology, Vol. 10 [2011], Iss. 1, Art. 38
http://www.bepress.com/sagmb/vol10/iss1/art38DOI: 10.2202/1544-6115.1719

SNP1 SNP2 P SNP1 SNP2 Prs16828170 rs12120904 0.000 rs1200082 rs2420371 0.016rs16828170 rs9332618 0.000 rs10800456 rs6678795 0.017rs1208134 rs6427202 0.000 rs1208134 rs4525 0.017rs3766031 rs6703463 0.000 rs9332618 rs6663533 0.017*rs16861990 rs6427202 0.000 rs16861990 rs9332627 0.017rs3766031 rs2285211 0.000 rs6027 rs12755775 0.017*rs16861990 rs4656687 0.000 rs1894691 rs1894702 0.018*rs3766031 rs16828170 0.000 rs3766031 rs3766117 0.019rs16861990 rs6678795 0.000 rs3766031 rs7545236 0.019rs2213865 rs2420371 0.000 rs1208134 rs4524 0.020rs16861990 rs6030 0.000 rs16828170 rs12120605 0.021rs1892094 rs2420371 0.000 rs17516734 rs9332684 0.022*rs12728466 rs2420371 0.000 rs9783117 rs2420371 0.022rs3766031 rs1208370 0.000 rs16861990 rs4525 0.023rs1208134 rs9332627 0.001 rs10158595 rs6678795 0.024rs1208134 rs10800456 0.001 rs10158595 rs2239854 0.024rs16861990 rs10800456 0.001 rs17518769 rs6027 0.027*rs3753292 rs2420371 0.001 rs3766031 rs1894701 0.028rs3766031 rs10753786 0.001 rs6018 rs9332684 0.028*rs1200160 rs2420371 0.001 rs9783117 rs6022 0.030rs1208134 rs970741 0.002 rs16862153 rs2420371 0.031rs1208134 rs4656687 0.003 rs4524 rs2239854 0.032rs723751 rs2420371 0.003 rs1894691 rs2239854 0.034*rs2420371 rs6035 0.003 rs4525 rs2239854 0.034rs16861990 rs12120605 0.003 rs9783117 rs1894701 0.034*rs3766031 rs9287095 0.004 rs9783117 rs9332653 0.035*rs1208134 rs2239851 0.005 rs9332624 rs6663533 0.035*rs16861990 rs970741 0.005 rs3766031 rs12758208 0.036rs1208134 rs6030 0.006 rs4524 rs3766119 0.039rs1208134 rs6678795 0.006 rs2239851 rs3766119 0.039rs12753710 rs2038024 0.006 rs1200138 rs3766077 0.040rs1200131 rs1208134 0.006 rs2420371 rs9332628 0.040rs6027 rs9332684 0.008* rs6663533 rs12755775 0.040*rs1208134 rs2213865 0.008 rs1200131 rs12758208 0.041*rs2420371 rs12755775 0.008 rs1320964 rs2420371 0.042rs3766031 rs6022 0.012 rs4525 rs3766119 0.045rs1894691 rs3766119 0.012* rs2239851 rs2239854 0.045rs12120904 rs6663533 0.013* rs9332653 rs6663533 0.046*rs16861990 rs2239851 0.013 rs12074013 rs3766117 0.046*rs1200131 rs16861990 0.013 rs9783117 rs7545236 0.047*rs16861990 rs4524 0.015 rs9783117 rs3766117 0.049*
Table 5: Significance of control case p-value difference. *: Both SNPs have nosignificant main effect
17
de Andrade and Wang: Entropy Methods for Association and Interaction Tests
Published by Berkeley Electronic Press, 2011

5 Discussion
5.1 Choice of Renyi´ λ
We observed in our study that higher power can be achieved by properly choosingthe entropy parameter λ . The optimal λ should be the one that amplifies the truedifference between two populations, thus the choice of λ depends upon the truepopulation allele frequencies and the source of difference. Although such informa-tion is usually not available, the family of entropy-based tests allow us to test theassociation and/or interaction with a different emphasis.
Since most of the computational time is devoted to estimate the allele fre-quencies of the permuted samples, once the frequencies become available, we rec-ommend performing a series of Renyi entropy tests with multiple λ s. A p-value vs.λ plot or a summary of multiple tests is usually recommended.
If one wants to make an interpretation based on tests of a fixed λ withoutprior knowledge of the optimal λ , we would suggest using 1 ≤ λ ≤ 3. Accordingto our experience, the power of the entropy test is usually higher with λ in thatrange. Also, the interaction test λ < 1 may sometimes be misleading due to poorestimation of the distribution of the test statistics. A large number of permutation isusually required to achieve reliable p-value of the test.
5.2 Deviation from iform
In probability theory and information theory, the Renyi divergence measures thedifference between two probability distributions. For probability distribution P andQ of discrete random variables, the Renyi divergence of order λ of the two distri-butions is defined as
Dλ (P‖Q) =1
λ −1log∑
i
pλi
qλ−1i
.
The Renyi entropy and Renyi divergence are related by Hλ (P) = Hλ (U)−Dλ (P‖U), where U represents the finite discrete uniform distribution which takesequal probability at any possible value. The uniform distribution is special as it isthe one of maximum entropy, thus most unpredictable. We can rewrite the associa-tion test statistic as:
SAλ
= Hλ (PD)−Hλ (PN) = Dλ (PN‖U)−Dλ (PD‖U).
The statistic can then be interpreted as the difference between the two distributions’deviation from uniform. The interaction test can be represented as
SEλ
= Hλ (Q)−Hλ (P) = Dλ (P1‖U)+Dλ (P2‖U)−Dλ (P‖U ×U).
Parameter
Un
18
Statistical Applications in Genetics and Molecular Biology, Vol. 10 [2011], Iss. 1, Art. 38
http://www.bepress.com/sagmb/vol10/iss1/art38DOI: 10.2202/1544-6115.1719

The U ×U is uniform distribution over the nine genotypic combinations of the twoloci. The interaction test statistic compares the deviations from uniform of the sumof marginal distributions and that of the joint distribution.
It is easy to show that D1(P‖Q) = H1(Q)−H1(P). However, this equationdoes not hold for general λ . If we replace the reference distribution U in the teststatistics by some other distribution V , the equivalence between the entropy dif-ference and the divergence difference does not hold except for λ = 1.0. Thus theextension from Shannon’s case where λ = 1.0 to Renyi’s case with general λ allowsus to introduce other more reasonable reference distributions under various geneticssettings. For example, V can be the population allele frequencies or the theoreti-cal allele frequencies under certain model. The tests based on Renyi divergencewith different reference distributions require further study and can be an interestingfuture research direction.
6 AppendixAssume the loci of interest have k genotypes G1,G2, . . . ,Gk, let p = [p1, p2, . . . , pk],and ∑
ki=1 pi = 1 be the distribution of those genotypes in population. Let X =
[X1,X2, . . . ,Xk] be the number of observations of each genotype in the sample andn the sample size, then X has a multinomial distribution Mn(n, p). Note thatfor sufficiently large n, the multinomial distribution is approximately a multinor-mal distribution with mean E(Xi) = npi and variance-covariance matrix given byVar(Xi) = npi(1− pi) and Cov(Xi,X j) =−npi p j (i 6= j).
For P = X/n = [X1,X2, . . . ,Xk]/n = [p1, p2, . . . , pk] we defineE(P) = [p1, p2, . . . , pk] = p and the variance-covariance matrix of P as
Var(P) = ΣP =1n
p1(1− p1) −p1 p2 . . . −p1 pk−p2 p1 p2(1− p2) . . . −p2 pk
...... . . . ...
−pk p1 −pk p2 . . . pk(1− pk)
First consider the Shannon’s entropy, H1(P) = −∑
ki=1 pi log pi, and define
the function
h(P) = [h(p1),h(p2), . . . ,h(pk)] = [p1 log p1, p2 log p2, . . . , pk log pk].
The variance of h(P) can be approximated by the delta method as
V (n, p) ≈ [∇h(p)]T ΣP∇h(p)= diag(1+ log p1, . . . ,1+ log pk)ΣP diag(1+ log p1, . . . ,1+ log pk).
Thus Var(H1(P)) is the sum over all V (n, p)’s elements.
19
de Andrade and Wang: Entropy Methods for Association and Interaction Tests
Published by Berkeley Electronic Press, 2011

For the general Renyi’s entropy, Hλ (P) = 11−λ
log(
∑ki=1 pλ
i
), define the
function h(P) = [h(p1),h(p2), . . . ,h(pk)] = [pλ1 , pλ
2 , . . . , pλk ], have Z = ∑
ki=1 pλ
i andthe function g(Z) = 1
1−λlogZ. After applying the delta-method multiple times, we
obtainVar(Hλ (P)) =
ΣZ
(1−λ )2z2 ,
where z = ∑ki=1 pλ
i and ΣZ is the sum over all elements of the following matrixV (n, p), given by
V (n, p) = diag[λ pλ−11 , . . . ,λ pλ−1
k ]ΣP diag[λ pλ−11 , . . . ,λ pλ−1
k ].
Let n1 and n2 be the sample size of case group and the sample size of controlgroup, respectively. Under the null hypothesis of no association, the genotypic dis-tributions of the disease population and the normal population are identical. Let theoverall genotype population distribution be p = [p1, p2, . . . , pk], and X1i be the num-ber of cases with genotype Gi, then X1 = [X11,X12, . . . ,X1k] follows a multinomialdistribution Mn(n1, p). Similarly, let X2 = [X21,X22, . . . ,X2k] be the distribution ofcontrols over all genotypes, and X2 follows a multinomial distribution Mn(n2, p).When the case group and the control group are independent samples, the varianceof the test statistics is simply the sum of the variance of the two entropies given by
Var(SAλ) = Var(Hλ (PD))+Var(Hλ (PN)).
If there is no additional information about the distribution of genotypes in the over-all population, p is usually estimated by (X1 +X2)/(n1 +n2).
ReferencesCordell H.J. (2009): Detecting gene-gene interactions that underlie human disease,
Nature Reviews Genetics, 10, 392-404.Dong C.Z., Chu X., Wang Y., Wang Yi, Jin L., Shi T.L., Huang W. and Li Y.X.
(2008): Exploration of gene-gene interaction effects using entropy-based meth-ods, European Journal of Human Genetics, 16, 229-235.
Heit J.A., Cunningham J.M., Petterson T.M., Armasu S.M., Rider D.N. and deAndrade M. (2011): Genetic variation within the anticoagulant, procoagulant,fibrinolytic and innate immunity pathways as risk factors for venous thromboem-bolism, Journal of Thrombosis and Haemostasis, 9, 6, 1133-1142.
Kang G.L., Yue W.H., Zhang J.F., Cui Y.H., Zuo Y.J. and Zhang D. (2008): Anentropy-based approach for testing genetic epistasis underlying complex dis-eases, Journal of Theoretical Biology, 250, 362-374.
20
Statistical Applications in Genetics and Molecular Biology, Vol. 10 [2011], Iss. 1, Art. 38
http://www.bepress.com/sagmb/vol10/iss1/art38DOI: 10.2202/1544-6115.1719

Kraft P., Yen Y.C., Stram D.O. Morrison J. and Gauderman W.J. (2007): Exploitinggene-enviroment interaction to detect genetic associations, Human Heredity, 63,111-119.
Kullback S. and Leibler R.A. (1951): On information and sufficiency, Annals ofMathematical Statistics, 22, 1, 79-86.
Li C. and Li M.Y. (2007): GWAsimulator: A rapid whole-genome simulation pro-gram, Bioinformatics, 24, 1, 140-142.
Manolio T.A., Collins F.S., Cox N.J., Goldstein D.B., Hindorff L.A., Hunter D.J.,McCarthy M.I., Ramos E.M., Cardon L.R., Chakravarti A., Cho J.H., FeinbergA.P., Guttmacher A.E., Kong A., Kruglyak L., Mardis E., Rotimi C.N., SlatkinM., Valle D., Whittemore A.S., Boehnke M., Clark A., Eichler E.E., Gibson G.,Haines J.L., Mackay T.F.C., McCarroll S.A. and Visscher P.M. (2009): Findingthe missing heritability of complex diseases, Nature, 461, 747-753.
Renyi A. (1960): On measures of information and entropy, Proceedings of the 4thBerkeley Symposium on Mathematics, Statistics and Probability, 547-561.
Shannon, C.E. (1948): A mathematical theroy of communication, Bell System Tech-nical Journal, 27, 379-423, 623-656.
Thomas D.C. (2010): Gene–environment-wide association studies: emerging ap-proaches, Nature Reviews Genetics, 11, 259-272.
Zhao J.Y., Boewinkle E. and Xiong M.M. (2005): An entropy-based statistic forgenomewide association studies, American Journal of Human Genetics, 77, 27-40.
21
de Andrade and Wang: Entropy Methods for Association and Interaction Tests
Published by Berkeley Electronic Press, 2011