statistical anomaly detection for monitoring of human dynamics · statistical anomaly detection for...
TRANSCRIPT

STATISTICAL ANOMALY DETECTION FOR MONITORING OF HUMAN DYNAMICS
K. Kamiyaa, T. Fuseb
a Dept. of Civil Engineering, The University of Tokyo, 7-3-1 Hongo Bunkyo Tokyo 113-8656, [email protected]
b Dept. of Civil Engineering, The University of Tokyo, 7-3-1 Hongo Bunkyo Tokyo 113-8656, [email protected]
Commission V, WG V/4
KEY WORDS: Anomaly detection, Human dynamics monitoring, Dirichlet process, Hidden markov model, time-series data
ABSTRACT:
Understanding of human dynamics has drawn attention to various areas. Due to the wide spread of positioning technologies that useGPS or public Wi-Fi, location information can be obtained with high spatial-temporal resolution as well as at low cost. By collectingset of individual location information in real time, monitoring of human dynamics is recently considered possible and is expectedto lead to dynamic traffic control in the future. Although this monitoring focuses on detecting anomalous states of human dynamics,anomaly detection methods are developed ad hoc and not fully systematized. This research aims to define an anomaly detection problemof the human dynamics monitoring with gridded population data and develop an anomaly detection method based on the definition.According to the result of a review we have comprehensively conducted, we discussed the characteristics of the anomaly detectionof human dynamics monitoring and categorized our problem to a semi-supervised anomaly detection problem that detects contextualanomalies behind time-series data. We developed an anomaly detection method based on a sticky HDP-HMM, which is able to estimatethe number of hidden states according to input data. Results of the experiment with synthetic data showed that our proposed methodhas good fundamental performance with respect to the detection rate. Through the experiment with real gridded population data, ananomaly was detected when and where an actual social event had occurred.
1 INTRODUCTION
Understanding of human dynamics such as people’s mobility ordistribution in a city has drawn attention to various areas; for ex-ample, urban planning and marking. Recently, due to the widespread of positioning technologies that use GPS or public Wi-Fi,location information can be obtained with high spatial-temporalresolution as well as at low cost. Therefore, by collecting set ofindividual location information in real time, monitoring of hu-man dynamics is considered possible and is expected to lead todynamic traffic control in the future. This monitoring focuses ondetecting anomalous states of human dynamics as well as normalstates. Because there are uncountable possible factors that maytrigger the anomalous states, it would not possible to monitor allof the factors. In contrast, if anomalous states are detected byanalysis on observation data of human dynamics monitoring suchas mesh population data or set of individual GPS trajectories, thiswill be very useful. The characteristics that human dynamics maydrastically change depending on regions and times, and the mas-sive observation data through 24-hour-monitoring would howevermake manual anomaly detection difficult. On the other hand, sta-tistical anomaly detection method can learn normal states fromregularly acquired data and automatically detect anomalies as adifferent state from normal states.
Several researches on statistical anomaly detection of human dy-namics have been conducted. Candia (Candia et al., 2008) hasused extensive cell phone records resolved in both time and space,focused on the occurrence of anomalous events and discussedhow these spatial-temporal anomalies can be described using stan-dard percolation theory tools. Horanont (Horanont, 2010) in termsof hot spots extraction and visualization, has interpolated aggre-gate cell phone Call Detail Records by using an implementedplatform. As an example of researches focusing on GPS tra-jectory data, Pan (Pan et al., 2013) has identified anomalies ac-
cording to drivers’ routing behavior on an urban traffic network.Horiguchi (Horiguchi et al., 2013) has implemented a real timemonitoring system that provides the visual comprehension of re-gional traffic situations in terms of the fluidity and the singularityindices. Moreover, there are other researches that try to detectan anomalous trajectory caused by external factors such as acci-dents or vicious drivers by collecting the vehicle trajectories overa long period of time.
Although these researches on statistical anomaly detection of hu-man dynamics have been conducted so far, these methods aredeveloped ad hoc due to the diversity of data and anomalies.Anomaly detection methods are not fully systematized yet. Addi-tionally it is considered difficult even for a well-suited method forcertain application domain to apply to another domain because ofthe discrepancy in the definition of anomalies between the do-mains.
For these reasons, this research aims to firstly define an anomalydetection problem with regard to the human dynamics monitor-ing. Because of the anonymity and the high accessibility, thisresearch targets gridded population data that is aggregated indi-vidual GPS data into each grid to estimate population of eachgrid for each instance of time. Secondly, based on the definition,we develop a suitable anomaly detection method for the humandynamics monitoring, and finally evaluate the fundamental per-formance of the proposed method. Therefore, development ofanomaly detection method and clarification of the fundamentalperformance of the proposed method will make it possible to de-tect anomalous states behind the human dynamics. In the future,the human dynamics monitoring is expected to lead an effectivetraffic control and a better understanding of social mechanisms.
The paper is organized as follows: In section 2, we explain howthe anomaly detection of human dynamics monitoring can be in-
The International Archives of the Photogrammetry, Remote Sensing and Spatial Information Sciences, Volume XL-4/W5, 2015 Indoor-Outdoor Seamless Modelling, Mapping and Navigation, 21–22 May 2015, Tokyo, Japan
This contribution has been peer-reviewed. doi:10.5194/isprsarchives-XL-4-W5-93-2015
93

terpreted withrespect to the factors that characterize anomaly de-tection problem. Additionally, we give an explanation that thestate-space model, especially the Hidden Markov Model basedon Hierarchical Dirichlet Process, is considered possible to ap-ply. In section 3, after introducing the properties of nonparamet-ric Bayesian model such as Dirichlet process, detail of the pro-posed anomaly detection method is presented. We demonstrateour proposed method with synthetic and real data and discuss thefundamental performance in section 4. Finally, section 5 con-cludes with a summary and some directions for future works.
2 PROBLEM SETUP FOR ANOMALY DETECTION OFHUMAN DYNAMIC MONITORING
2.1 Interpretation of anomaly detection factors
Statistical anomaly detection aims to identify data that are notconsistent with a pattern that most other data follow (Chandola etal., 2009). It is also referred to as novelty detection (Pimentel etal., 2014) or outlier detection (Hodge and Austin, 2004) in differ-ent application domains although the main principle is common.The importance of anomaly detection attributes to value of de-tected anomalies in data; anomalies are often important trendsbehind huge data or critical and significant data. Combined withthe progress of data acquisition techniques and computer per-formance, this great importance makes anomaly detection gainmuch research attention in variety of application domains; intru-sion detection, image processing, structural health monitoring, etcetera.
Firstly, we have comprehensively reviewed the previous studiesof anomaly detection in variety of areas and a result of the reviewshows that there are four factors that characterize anomaly detec-tion problem; the nature of the input data, the output of anomalydetection, availability or unavailability of the data labels, and thetype of anomalies (Chandola et al., 2009). This section providesa clear explanation of these factors as well as the interpretation ofhuman dynamics monitoring targeting gridded population data.
2.1.1 Nature of input data: The first factor that character-izes anomaly detection is the nature of the input data. This canbe roughly divided into binary, categorical and continuous. Addi-tionally, each input data might consist of univariate or multivari-ate. Input data can also be categorized in terms of relationshipbetween each input data; for example, temporal data, spatial data,graph data, et cetera. In the case of this study with gridded popu-lation data, input data can be considered as temporal data of con-tinuous values because each gridded population can be regardedas input value. Moreover, since it is commonly considered thaturban population distribution has a greater influence with closerregion, this temporal data may also have some spatial correlation.Therefore, development to handle temporal anomaly detection isnecessary and spatial extension may be preferred.
2.1.2 Output of anomaly detection: The second importantfactor for any anomaly detection method is the manner in whichthe anomalies are reported. There are typically two ways: One isto calculate anomaly score for each instance, and the another isto assign ”normal” label or ”anomalous” label for each instance.If the anomaly score of every grid is computed, it can be utilizedas an indicator of the traffic control priority. Also, if normal oranomalous label that represents what kind of state the grid is, itcan be beneficial. In this manner, the human dynamics monitor-ing is considered to accept both anomaly score and labels.
2.1.3 Data labels: The normal or anomalous labels associ-ated with a input data instance that is used to learn anomalydetection models is the third factor to characterize anomaly de-tection. Since it is difficult to obtain all of possible states, es-pecially anomalous states, anomaly detection techniques can bedivided into three modes based on the extent to which the la-bels are available; supervised anomaly detection with the needof both normal and anomalous labels in training dataset, semi-supervised anomaly detection with only normal labels, and un-supervised anomaly detection without any prior information withregard to input dataset. In the case of human dynamics moni-toring, normal labels can be obtained in a relatively simple wayby using observational data of the day when and the place wherebig social events such as serious accidents and natural disastersare not reported. On the other hand, the availability of anoma-lous labels is a big issue for not only human dynamics monitor-ing but any anomaly detection problem. For these reasons, semi-supervised or unsupervised anomaly detection is thought able tobe employed.
2.1.4 Type of anomalies: Anomalies can be classified intofollowing three categories; point anomaly, contextual anomalyand collective anomaly. An individual data is regarded as a pointanomaly if the data is considered anomalous with respect to therest of the data, a data instance is regarded as a contextual anomalyif anomalous in the specific context (but not separately), and a setof data instance is regarded as a collective anomaly if anomalouswith respect to the entire data set. As examples of anomaliesthat are possibly detected in gridded population data, there is anextreme increase or decrease caused by traffic congestion and achange of the population pattern affected by a change of the trafficdemands. Figure 1 illustrates these possible anomalies in a grid-ded population temporal data. Aimed at the detection of thesetemporal anomalies as well as spatial anomalies due to the spa-tial correlations of gridded population data, contextual anomalydetection techniques are considered suitable to this study.
Figure 1:Anomalies in gridded population data
Based on these analyses showed in Table 2, we define the anomalydetection of human dynamics monitoring as a problem that de-tects contextual anomalies in time-series data of gridded popula-tion data by learning normal states with training dataset.
The International Archives of the Photogrammetry, Remote Sensing and Spatial Information Sciences, Volume XL-4/W5, 2015 Indoor-Outdoor Seamless Modelling, Mapping and Navigation, 21–22 May 2015, Tokyo, Japan
This contribution has been peer-reviewed. doi:10.5194/isprsarchives-XL-4-W5-93-2015
94
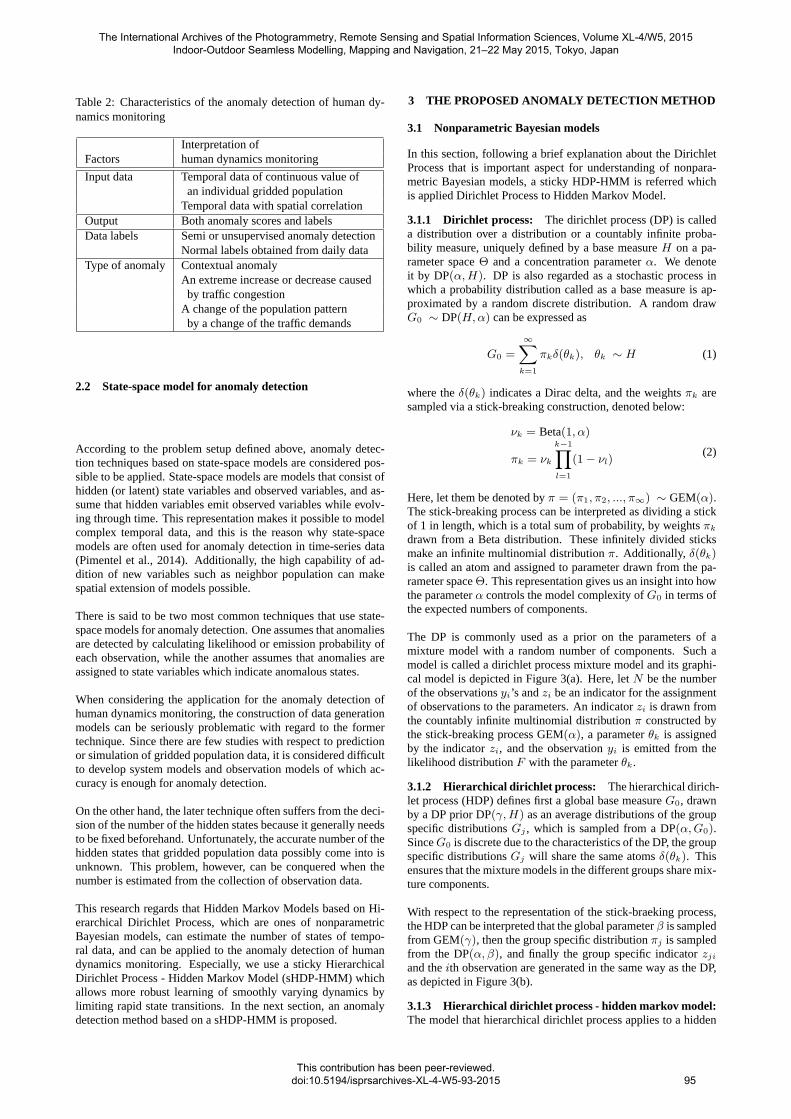
Table2: Characteristics of the anomaly detection of human dy-namics monitoring
Interpretation ofFactors human dynamicsmonitoring
Input data Temporaldata of continuous value ofan individual gridded population
Temporaldata with spatial correlationOutput Both anomalyscores and labelsData labels Semi orunsupervised anomaly detection
Normal labelsobtained from daily dataTypeof anomaly Contextualanomaly
An extreme increase or decrease causedby traffic congestion
A changeof the population patternby achange of the traffic demands
2.2 State-spacemodel for anomaly detection
According to the problem setup defined above, anomaly detec-tion techniques based on state-space models are considered pos-sible to be applied. State-space models are models that consist ofhidden (or latent) state variables and observed variables, and as-sume that hidden variables emit observed variables while evolv-ing through time. This representation makes it possible to modelcomplex temporal data, and this is the reason why state-spacemodels are often used for anomaly detection in time-series data(Pimentel et al., 2014). Additionally, the high capability of ad-dition of new variables such as neighbor population can makespatial extension of models possible.
There is said to be two most common techniques that use state-space models for anomaly detection. One assumes that anomaliesare detected by calculating likelihood or emission probability ofeach observation, while the another assumes that anomalies areassigned to state variables which indicate anomalous states.
When considering the application for the anomaly detection ofhuman dynamics monitoring, the construction of data generationmodels can be seriously problematic with regard to the formertechnique. Since there are few studies with respect to predictionor simulation of gridded population data, it is considered difficultto develop system models and observation models of which ac-curacy is enough for anomaly detection.
On the other hand, the later technique often suffers from the deci-sion of the number of the hidden states because it generally needsto be fixed beforehand. Unfortunately, the accurate number of thehidden states that gridded population data possibly come into isunknown. This problem, however, can be conquered when thenumber is estimated from the collection of observation data.
This research regards that Hidden Markov Models based on Hi-erarchical Dirichlet Process, which are ones of nonparametricBayesian models, can estimate the number of states of tempo-ral data, and can be applied to the anomaly detection of humandynamics monitoring. Especially, we use a sticky HierarchicalDirichlet Process - Hidden Markov Model (sHDP-HMM) whichallows more robust learning of smoothly varying dynamics bylimiting rapid state transitions. In the next section, an anomalydetection method based on a sHDP-HMM is proposed.
3 THE PROPOSED ANOMALY DETECTION METHOD
3.1 Nonparametric Bayesian models
In this section, following a brief explanation about the DirichletProcess that is important aspect for understanding of nonpara-metric Bayesian models, a sticky HDP-HMM is referred whichis applied Dirichlet Process to Hidden Markov Model.
3.1.1 Dirichlet process: The dirichlet process (DP) is calleda distribution over a distribution or a countably infinite proba-bility measure, uniquely defined by a base measureH on a pa-rameter spaceΘ and a concentration parameterα. We denoteit by DP(α,H). DP is also regarded as a stochastic process inwhich a probability distribution called as a base measure is ap-proximated by a random discrete distribution. A random drawG0 ∼ DP(H,α) can be expressed as
G0 =
∞∑k=1
πkδ(θk), θk ∼ H (1)
where theδ(θk) indicates a Dirac delta, and the weightsπk aresampled via a stick-breaking construction, denoted below:
νk = Beta(1, α)
πk = νk
k−1∏l=1
(1− νl)(2)
Here, let them be denoted byπ = (π1, π2, ..., π∞) ∼ GEM(α).The stick-breaking process can be interpreted as dividing a stickof 1 in length, which is a total sum of probability, by weightsπk
drawn from a Beta distribution. These infinitely divided sticksmake an infinite multinomial distributionπ. Additionally, δ(θk)is called an atom and assigned to parameter drawn from the pa-rameter spaceΘ. This representation gives us an insight into howthe parameterα controls the model complexity ofG0 in terms ofthe expected numbers of components.
The DP is commonly used as a prior on the parameters of amixture model with a random number of components. Such amodel is called a dirichlet process mixture model and its graphi-cal model is depicted in Figure 3(a). Here, letN be the numberof the observationsyi’s andzi be an indicator for the assignmentof observations to the parameters. An indicatorzi is drawn fromthe countably infinite multinomial distributionπ constructed bythe stick-breaking process GEM(α), a parameterθk is assignedby the indicatorzi, and the observationyi is emitted from thelikelihood distributionF with the parameterθk.
3.1.2 Hierarchical dirichlet process: The hierarchical dirich-let process (HDP) defines first a global base measureG0, drawnby a DP prior DP(γ,H) as an average distributions of the groupspecific distributionsGj , which is sampled from a DP(α,G0).SinceG0 is discrete due to the characteristics of the DP, the groupspecific distributionsGj will share the same atomsδ(θk). Thisensures that the mixture models in the different groups share mix-ture components.
With respect to the representation of the stick-braeking process,the HDP can be interpreted that the global parameterβ is sampledfrom GEM(γ), then the group specific distributionπj is sampledfrom the DP(α, β), and finally the group specific indicatorzjiand theith observation are generated in the same way as the DP,as depicted in Figure 3(b).
3.1.3 Hierarchical dirichlet process - hidden markov model:The model that hierarchical dirichlet process applies to a hidden
The International Archives of the Photogrammetry, Remote Sensing and Spatial Information Sciences, Volume XL-4/W5, 2015 Indoor-Outdoor Seamless Modelling, Mapping and Navigation, 21–22 May 2015, Tokyo, Japan
This contribution has been peer-reviewed. doi:10.5194/isprsarchives-XL-4-W5-93-2015
95

Figure 3:Dirichlet process mixture model(a), Hierarchical Dirichlet Process(b) and sticky HDP-HMM(c)
markov model is called hierarchical dirichlet process - hiddenmarkov model (HDP-HMM) (Teh et al., 2006). In HDP-HMMs,the inditatorzt acts as the hidden state at the timet, πj meansthe state specific transition distribution for statej, andβ is calledas the global transition distribution. Due to the fact that eachgroup specific ditributionGj shares the common components,each state specific distributionπj share the common countablyinfinite states. This also means the state transition matrixπ canbe regarded to have raw and column of countably infinite.
The ability of HDP-HMMs to have countably infinite states the-oretically make it possible to estimate the number of states ac-cording to input data, and has leads to some application such asclustering and anomaly detection, especially where the numberof clusters or states is unknown (Lello et al., 2012).
An extension of the HDP-HMM, nemed a sticky HDP-HMM orsHDP-HMM, has been deveploed by Fox (Fox et al., 2009) tosolve the issue which the standard HDP-HMM learns a modelwith unrealistically fast dynamics that causes the reduction of themodel precision. The sHDP-HMM introduces the hyper-parameterκ > 0 that controls the expected probability of the self-transitionto the stage where the state specific ditributionπj is sampled. Thegraphical representation of the sHDP-HMM is depicted in Figure3(c). The resulting generative model is given by:
β|γ ∼ GEM(γ)θk|H ∼ H
πj |α, β, κ ∼ DP(α+ κ,αβ+κδjα+κ
)zt|zt−1, {πj}∞j=1 ∼ πzt−1
xt|zt, {θj}∞j=1 ∼ F (xt|θzt)
(3)
In termsof the human dynamics monitoring, since it is consid-ered that hidden states behind human dynamics gradually transitthrough time, setting the accurate expected probability of tself-transition can lead to the model with high predictive performance.Therefore, we consider that the adequate number of states be-hind human dynamics data can probably be estimated by using asHDP-HMM for the an anomaly detection model.
3.2 THE PROPOSED ANOMALY DETECTION METHOD
The proposed method consists of the following three steps: Itfirstly learns hidden state that represent normal states sequenceand the hyper-parameters from training data (step 1). Secondly,the sHDP-HMM with the learned hyper-parameters infers hiddenstates of test data (step 2). By comparing the two estimated statesfor each instant of time, an anomaly will finally be detected ifthey are unequal (step 3).
In the step 1, a ”normal” training temporal data{xt}Tt=1 is set as
the observation variables of a sHDP-HMM, whereT indicatesthe length ofd dimensional temporal data. We used dimen-sional Gaussian distributionN(µk,Σk) for the likelihood dis-tribution of thekth hidden state, uniquely defined by parameterθk = (µk,Σk). Also, a Gaussian distributionN(µ0,Σ0) and aInverse-Wishart distribution IW(ν,∆) are used for the prior dis-tribution of the meanµk and the variance-covariance matrixΣk
each. Since hyper-parameters are unknown, we give vague priordistributions and try infer them by sampling algorithm. For thesHDP-HMM explained above, the Blocked Gibbs Sampler is em-ployed to infer all of the hyper-parameters and the parameters in-cluding the state sequence{zt}Tt=1.
The step 2 applies the inferred sHDP-HMM to training tempo-ral data{x′
t}Tt=1 and estimates its hidden state sequence{z′t}Tt=1
which may contain anomalies. With respect to the parameter set-ting, the step 2 uses the expected values which are calculatedfrom posterior distributions of the hyper-parameters sampled thein the step 1. Moreover, the initialization of the parameters suchasβ, π, θ is given not by new sampled values, but by using thelast ones in step 1.
Finally in the step 3, the normal state sequence{zt}Tt=1 and thetest state sequence{z′t}Tt=1 are compared. To handle the prob-lem that the indicators assigned to each state can be exchangeddue to re-estimation ofβ, π, θ, the proposed method employs theHungarian Algorithm to solve assignment problem of which costfunction is given by Hamming distance between the normal andtest state sequences. After the state assignment, an anomaly attime t is detected ifzt = z′t.
Based on the characteristics of anomaly detection problem de-fined in section 2, this proposed method is categorized to a semi-supervised anomaly detection technique that uses normal time-series data and detects contextual anomalies with output of anomalylabels. This proposed method especially aims to detect contextualanomalies that are anomalous at specific time, but normal other-wise.
4 EXPERIMENTS AND RESULTS
In this section, we apply our proposed anomaly detection methodto both synthetic and real data, and discuss the fundamental per-formance. In implementing the inference algorithm, we use aMATLAB toolbox supporting several inference algorithms basedon Gibbs sampling for the sticky HDP-HMM, which has beenmade available by Fox (Fox et al., 2009).
The International Archives of the Photogrammetry, Remote Sensing and Spatial Information Sciences, Volume XL-4/W5, 2015 Indoor-Outdoor Seamless Modelling, Mapping and Navigation, 21–22 May 2015, Tokyo, Japan
This contribution has been peer-reviewed. doi:10.5194/isprsarchives-XL-4-W5-93-2015
96

4.1 Experimentwith synthetic data
For an experiment with synthetic data, we generate 1 dimen-sional training and test time-series data with length ofT = 400,depicted in Figure 5(a). We manually set twelve states repre-sented by the numbers in Figure 5 and obtain i.i.d. samples fromGaussian distribution defined for each state. This synthetic tem-poral data imitates an average one-day pattern of a real grid-ded population data discussed later, by adjusting means and vari-ances of Gaussian distributions. The test data, which is alsosampled from the same distributions, is manually added anoma-lous values on 10% of the test data as follows; (i)5σ anomaly att = 46, (ii)3σ anomalies att = 98 ∼ 108, (iii)3σ anomalies att = 196 ∼ 210, (iv)3σ anomalies att = 311 ∼ 328 and (v)10σanomaly att = 381.
We used 1 dimensional Gaussian emission distribution, and placedpriorsN(µ0,Σ0) and IW(ν,∆) on the space of mean and vari-ance parameters. Theµ0 andΣ0 are given by empirical meanand variance, degree of freedomν is set as 4 and∆ = I whereI indicates the identity matrix. To realize a steady inference, wenormalize the input data to make its mean be 0 and variance be 1.
The upper side of Figure 5(b) depicts the learned state sequence{zt}Tt=1 where green solid and dotted lines represent the esti-mated mean and standard variation of each state. The estimatedstate sequence is also visualized. Although we have initially settwelve states, the final 10,000th sampling gave six states becausea couple of states were unified into one common state. Yet, sig-nificant differences between the real Gaussian parameters and theestimated parameters were not found.
After the inference of the test data in the step 2, hidden statesand their Gaussian parameters were estimated as illustrated in thelower side of Figure 5(b). The number of the hidden states, whichwas six at the time of training, was estimated seven. Besides, ouranomaly detection method regarded 64 points as anomaly pointedby red circles in the figure. Table 4 shows a confusion matrix inwhich a result of this anomaly detection experiment is listed. Thefact that results scored 80.0% of the detection rate shows that ourproposed method has good fundamental performance of anomalydetection for pseudo gridded population data with respect to thedetection rate. On the other hand, the precision was 50.0% be-cause a number of anomalies including false positives were oftendetected near borders of states.
Table 4: Confusion matrix of the result with the synthetic dataResult of anomaly detectionAnomaly
64Normal
336
TrueAnomaly
40TruePositive
32FalseNegative
8Normal
360FalsePositive
32TrueNegative
328
4.2 Experimentwith real data
As a real gridded population data for this experiment, we use500m-1hour resolved population of 30 October 2012 and 6 Novem-ber 2012 in Tokyo, provided by ZENRIN DataCom Co., Ltd.Because a serious accident on the Tobu Isesaki Line has beenrecognized at about 6 am on 6 November to end up an hour-and-a-half service interruption between Asakusa Sta. and Kita-SenjuSta., we use the data of Octber 30 for training and the another fortest. Especially, we target on a grid where Asakusa Sta. is lo-cated (Figure 6) because it was probably considerably impacted
Figure 6:Location of the target grid
by the accident. We employ our proposed anomaly method withthe normalized temporal data for observation variables and thesame sHDP-HMM setting as before.
The upper side of Figure 7 illustrates a result of the inference oftraining data and shows that the number of normal states was es-timated three, each of which stands for morning, afternoon andevening. After the test-data inference, new two states have beenassigned for data in morning and evening, and then, two anoma-lies were detected as pointed by red circles in the bottom of Fig-ure 7. This result shows that an anomaly was detected at the timewhen train services had been stopped. On the other hand, whilethe proposed method detected the another anomaly in evening,there is not recognized serious events such as traffic accidents orsocial events around the target area. An extensive analysis is re-quired on the reason of this detection, whether it is result of latentanomaly or a false alarm.
Figure 7:learning result of training data(upper), anomaly detec-tion result(lower) and compared states(middle)
5 CONCLUSIONS
In this study, we firstly defined an anomaly detection problem ofthe human dynamics monitoring with respect to gridded popula-tion data. Based on the result of review we have comprehensivelydone, we discussed how the anomaly detection of human dynam-ics monitoring can be interpreted in terms of the four factors; na-ture of data, output of anomaly detection, data labels and type ofanomalies. Additionally, we gave an explanation that state-spacemodel, especially a HDP-HMM is considered possible to applydue to its property that a HDP-HMM can estimate the number ofhidden states according to input data. Besides, we developed ananomaly detection method based on a sticky HDP-HMM, which
The International Archives of the Photogrammetry, Remote Sensing and Spatial Information Sciences, Volume XL-4/W5, 2015 Indoor-Outdoor Seamless Modelling, Mapping and Navigation, 21–22 May 2015, Tokyo, Japan
This contribution has been peer-reviewed. doi:10.5194/isprsarchives-XL-4-W5-93-2015
97

Figure 5:Synthetic training / test time-series data(a), inference and anomaly detection results(d)
is categorized to a semi-supervised anomaly detection techniquethat uses normal time-series data and detects contextual anoma-lies with output of anomaly labels. Results of the experiment withsynthetic data showed that our proposed method has good funda-mental performance with respect to the detection rate. Throughthe experiment with real gridded population data, an anomaly wasdetected at the location where a station was located and the timewhen train services had been stopped.
Future works include the improvement of the precision of theproposed method, the application of the proposed method to abigger dataset of different gridded population data, and the deep-ening the interpretation of the estimated states and the detectedanomalies on the traffic networks. The final goal of this researchis to construct a dynamic traffic control model by integrating thespatial extension of the proposed method, the on-line anomalydetection method and the control theory.
REFERENCES
Candia, J., Gonzalez, M. C., Wang, P., Schoenharl, T., Madey, G.and Barabasi, a. L., 2008. Uncovering individual and collectivehuman dynamics from mobile phone records. Journal of PhysicsA: Mathematical and Theoretical 41(22), pp. 1–11.
Chandola, V., Banerjee, A. and Kumar, V., 2009. Anomaly detec-tion: a survey. ACM Computing Surveys 41(3), pp. 15:1–15:58.
Fox, E. B., Sudderth, E. B., Jordan, M. I. and Willsky, A. S.,2009. Nonparametric bayesian learning of switching dynamicalsystems. Advances in Neural Information Processing Systems21, pp. 457–464.
Hodge, V. J. and Austin, J., 2004. A survey of outlier detectionmethodologies. Artificial Intelligence Review 22(2), pp. 85–126.
Horanont, T., 2010. A study on urban mobility and dynamicpopulation estimation by using aggregate mobile phone sources.CSIS Discussion Paper.
Horiguchi, R., Iijima, M., Kobayashi, M. and Hanabusa, H.,2013. Traffic anomaly detection for surface street networks withthe mesh-wised traffic indices on macroscopic fundamental di-agram. OPTIMUM 2013 International Symposium on RecentAdvances in Transport Modelling pp. 1–7.
Lello, E. D., Laet, T. D. and Bruyninckx, H., 2012. Hierarchi-cal dirichlet process hidden markov models for abnormality de-tection in robotic assembly. Workshop on Bayesian Nonparamet-ric Models (BNPM) For Reliable Planning And Decision-MakingUnder Uncertainty pp. 1–8.
Pan, B., Zheng, Y., Wilkie, D. and Shahabi, C., 2013. Crowdsensing of traffic anomalies based on human mobility and so-cial media. Proceedings of the 21st ACM SIGSPATIAL Interna-tional Conference on Advances in Geographic Information Sys-tems pp. 344–353.
Pimentel, M. A., Clifton, D. A., Clifton, L. and Tarassenko, L.,2014. A review of novelty detection. Signal Processing 99,pp. 215–249.
Teh, Y. W., Jordan, M. I., Beal, M. J. and Blei, D. M., 2006. Hi-erarchical dirichlet processes. Journal of the american statisticalassociation 101(476), pp. 1–30.
The International Archives of the Photogrammetry, Remote Sensing and Spatial Information Sciences, Volume XL-4/W5, 2015 Indoor-Outdoor Seamless Modelling, Mapping and Navigation, 21–22 May 2015, Tokyo, Japan
This contribution has been peer-reviewed. doi:10.5194/isprsarchives-XL-4-W5-93-2015
98