statistical analysis of child pedestrian accidents in manchester and salford
TRANSCRIPT

Accid. Ad. & Prev. Vol. 4, pp. 323-332. Pergamon Press 1972. Printed in Great Britain.
STATISTICAL ANALYSIS OF CHILD PEDESTRIAN ACCIDENTS
IN MANCHESTER AND SALFORD
BARBARA PRESTON
Manchester Polytechnic, England
(Received 28 July 1971, in revised form 3 April 1972)
INTRODUCTION
ACCIDENTS involving injury are reported to the police who investigate the circumstances and file particulars. The Chief Constable of Manchester and Salford allowed access to the files of all child pedestrian accidents occurring in these cities in 1969. I am grateful to the Chief Constable for making this survey possible.
This survey was of accidents in two towns and there will be very different problems in country districts. However, 96 per cent of child pedestrian casualties occurred in built up areas in 1969 (Department of Environment, 1969), so the main problem is in towns. Different towns have different problems, but where it has been possible to check against national figures the Manchester and Salford figures seem typical.
METHOD
Particulars of the age and sex of the children injured, where they lived, and where the accidents occurred, were abstracted from the police files. When the information was avail- able details of what the children were doing at the time of the accident were also noted, There were 994 children injured in Manchester and Salford in 1969, and this report covers 980 of them. Three were omitted, all very slight injuries, because the sex was not given and could not be guessed from the name and 11 files were not available at the time.
Many of the accidents resulted in slight injuries, 29 per cent of the injuries were serious and 14 children were killed. The national figures show similar proportions (RoSPA, 1969). Despite the very big difference between death and a very slight injury all types of accident have been considered together since the severity of the injury is often determined by factors not considered in this survey, such as the driver’s alertness and the vehicle’s speed, and from a statistical point of view if the analysis is complicated by too many variables the pattern may be lost.
RESULTS
Age and sex of the injured children
The number of boys and girls of different ages injured in Manchester and Salford in 1969 are given in Table 1.
The number of children injured increases with each year of age, up to the age of 4, and then gradually decreases after 6 yr of age. At all ages from 2 to 11 yr there are more boys than girls injured; but for older children there is no difference between the number of boys
323

324 BARBARA PRESTON
TABLE 1. THE NUMBER OF BOYS AND GIRLS OF DIFFERENT AGEZJ IWJRED IN MAN- CHESTER AND SALFORD IN 1969
Age (Yr) Boys Girls Total
Girls as a percentage of tile totai
f%)
0 2 4 50
: 21 13 7 34 13 54 39 3 64 23 87 26 4 72 37 109 34
d 75 67 36 34 101 111 34 32 7 57 44 101 44
; 46 56 37 26 93 72 39 36 :: 24 35 29 20 53 55 55 36
12 29 27 56 48 13 29 24 53 45 14 14 24 38 63
and girls injured. The avaiIable national figures indicate a comparable pattern. (RoSPA, 1969 Registrar General, 1969).
What were the children doing at the time of the accidents ?
The many minor variations are grouped under 4 headings. (a) Accidents in which the responsibili~ of movement was not the child’s, The child was controlled by a responsible adult or was in a pram or on the footpath. (b) The child was trying to cross the road, purposefully, to go somewhere. Accidents in which the child was with an adult, but not controlled by the adult come in this category, also crossing to and from ice cream vans and school. (c) The child was not trying to cross the road to go anywhere, but was roughly speaking “playing out”, or running away from someone, or to someone, but not actually wishing to cross the road. (d) Very often the information was not available, as the child was unable through illness, or too young, to say what had led up to the accident, or the child was not willing to give the information and there were no witnesses.
The figures are given in Table 2. For accidents when the children are crossing the road to get somewhere, there seem to be
more boys than girls injured until the age of 1 I ; after this it is reversed but the total differ- ence, 201 boys of all ages and 182 girls is not great. Moreover, the number of children of each age injured does not vary very much.
For accidents when the children are not trying to cross the road to get anywhere the pattern is quite different. There are far fewer girls than boys injured, for all ages 194 boys and 61 girls, and the number injured is highest in the 3-7 age group, and decreases as the children get older.
There are, however, a Iarge number of injuries in which the information is not available. Is it likely that these deductions would be different if full particulars were available? One cannot be sure, but it seems likely that the fact that the children were going somewhere would be more likely to be reported than the other category. If the child is crossing the road for
Statistical analysis of child pedestrian accidents
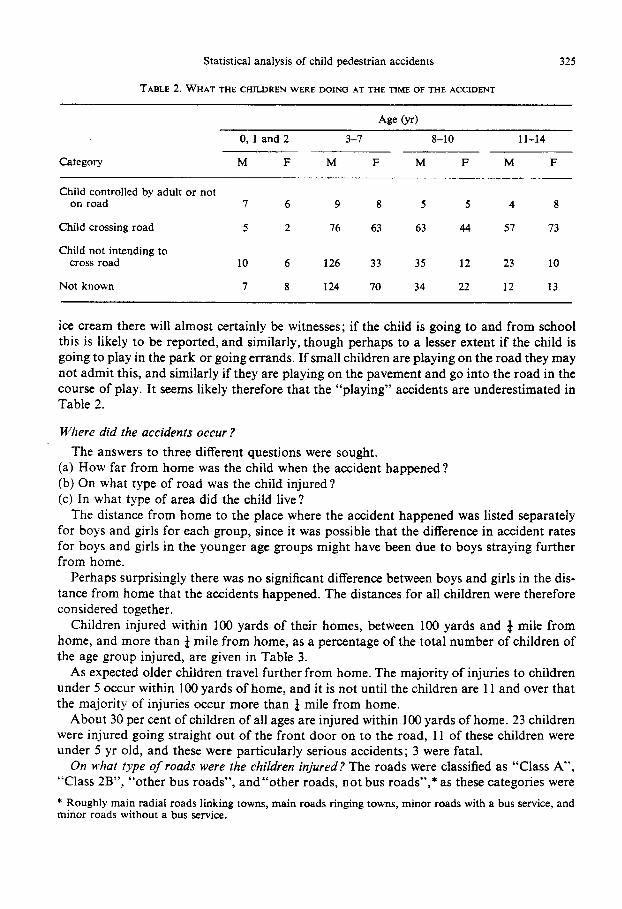
TABLE 2. WHAT THE CHILDREN WERE DOING AT THE TIME OF THE ACCIDENT
325
0, 1 and 2 3-7 S-10 11-14
Category M F M F M F M F
Child controlled by adult or not on road 7 6 9 8 5 5 4 8
Child crossing road 5 2 76 63 63 44 57 73
Child not intending to cross road 10 6 126 33 35 12 23 10
Not known 7 8 124 70 34 22 12 13
ice cream there will almost certainly be witnesses; if the child is going to and from school this is likely to be reported, and similarly, though perhaps to a lesser extent if the child is going to play in the park or going errands. If small children are playing on the road they may not admit this, and similarly if they are playing on the pavement and go into the road in the course of play. It seems likely therefore that the “playing” accidents are underestimated in Table 2.
Where did the accidents occur ?
The answers to three different questions were sought. (a) How far from home was the child when the accident happened ? (b) On what type of road was the child injured ? (c) In what type of area did the child live?
The distance from home to the place where the accident happened was listed separately for boys and girls for each group, since it was possible that the difference in accident rates for boys and girls in the younger age groups might have been due to boys straying further from home.
Perhaps surprisingly there was no significant difference between boys and girls in the dis- tance from home that the accidents happened. The distances for all children were therefore considered together.
Children injured within 100 yards of their homes, between 100 yards and 2 mile from home, and more than & mile from home, as a percentage of the total number of children of the age group injured, are given in Table 3.
As expected older children travel further from home. The majority of injuries to children under 5 occur within 100 yards of home, and it is not until the children are 11 and over that the majority of injuries occur more than & mile from home.
About 30 per cent of children of all ages are injured within 100 yards of home. 23 children were injured going straight out of the front door on to the road, 11 of these children were under 5 yr old, and these were particularly serious accidents; 3 were fatal.
On what type of roads were the children injured? The roads were classified as “Class A”, “Class 2B”, “other bus roads”, and“other roads, not bus roads”,* as these categories were
* Roughly main radial roads linking towns, main roads ringing towns, minor roads with a bus service, and minor roads without a bus service.

326 &RBARA hESTON
TABLE 3.Tx~ PERCE~A~EOF~NI~EDC~REN,INDI~~~AGEGRO~,I~~~ED AT
~AR~OUSDISTA~C~~OM HOME
Age (yr)
Distance from home Under 5 (%I
5-7 (%I
8-10 (%)
11-14 (%I
All ages (%I
Less than 100 yards 59 31 20 9 31
100 yards to $ mile 31 47 48 39 42
More than ) mile 10 22 32 52 27
loo IO0 loo loo loo
marked on a map. The children injured on each type of road were listed by age and sex. There was, again, no significant difference between the types of road on which boys and girls were injured, and therefore all the children were considered together. Table 4 gives the percentage of injured children, in different age groups, injured on different types of road.
There is a very different pattern of accident for children of different ages.
TABLE 4. THE PERCENTAGE OF INJURED CHILDREN, IN DIFFERENT AGE GROUPS, INJURED
ON DfFFERENT TYPES OF ROADS
Age frrf
Type of road 2, 3 and 4 5-7 8-10 11-14 All ages
(“/‘,I ( 5:) (%) (%) (%I
Class IA and 2B 18 31 41 62 38.5
Other bus roads 15 29 26 21 23
Other non-bus roads 67 39 27 17 38.5
loo 99 loo 100 100
For children under 5 yr of age, two-thirds of the accidents are on minor residential roads. more often that not within 100 yards of home, and most of these children (92 per cent) were not accompanied by an adult at the time. On classified roads, however, rather over half the children under 5 who were injured were accompanied by adults. Only 22 children out of the total of 247 children under 5 yr old injured on all types of road were injured on classified roads unaccompanied by an adult.
For children aged 5-10 the accidents are still mainly on unclassified roads and though the children are now travelling further from home the majority of accidents are still within 4 mile of home. Only for children of I1 yr of age and older do we find the majority of acci- dents on classified roads and the majority of accidents more than & mile from home.
Statistical analysis of child pedestrian accidents 327
Though adequate protection for crossing main roads is ob~ously important for children this is not the main concern for small children, for whom the problem is one of safety in the residential areas.
it? what type of area do these accidents occur ? The accidents are not evenly spaced, par- ticularly for the younger age groups. For the children under 5 yr of age: (a) Accidents seldom occur in the towncentres. The onlychildof this age injured in the centre of Manchester lived some distance outside Manchester and was accompanied by her mother. (b) There is a very high concentration of injuries in certain areas, particularly areas lying very roughly about 11 miles from the city centre. (c) There are fewer accidents in areas much further out.
In one of the “inner ring” areas there were 35 children under 5 yr of age injured in an area of 546 acres, well under a square mile; further out there were areas larger than this where no children were injured in 1969.
The same pattern persists, though not quite so extremely, for children aged 5-7 yr, and still, though to a much smaller extent for children aged 8-10 yr. For this age group the accidents begin to concentrate on some of the main roads, rather than particular residential areas, but it is only for children of 11 yr and over that the majority of accidents are along the main roads.
It has sometimes been suggested that children can only learn to cope with the dangers of traffic by being exposed to such dangers. If this were so then one might expect the areas with the highest accident rates for the under 5-yr-old children to have lower accident rates for older children and vice versa. This was not the case.
What are the differences bernieen these areus ? Firstly, is the difference merely that there are a great many children in a small area in the bad accident areas, and comparatively few children in the areas where there are fewer children injured?
We do not know how many children wafk through the various areas in the course of a year, but we do know that for the younger age groups most accidents occur very near home. We are, therefore, justified, for the children under 8 yr old, in considering the parliamentary wards in which the children live, rather than the wards in which the accidents occur, since there will be very little difference between the two. The advantage of this is that the 1966 Sample Census gives the number of children aged O-4, and 5-14 yr for each Parliamentary ward. So we know the number of children in each ward in 1966. However, the injuries were incurred in 1969. It seems reasonable to assume that the number of children under 5 in 1966 will correspond to the number of children aged 3-7 in 1969, provided that there has been no major slum clearance in the area between 1966 and 1969. There has, however, been considerable demolition and rebuilding in some of the inner areas of Manchester during the last few years. This was checked from the electoral register. In five wards the electo- rate had decreased so much between 1966 and 1969 (decreases of 31-41 per cent), that it could not be assumed that the number of children in any of these five wards would remain the same. These wards were therefore not included in the following analysis.
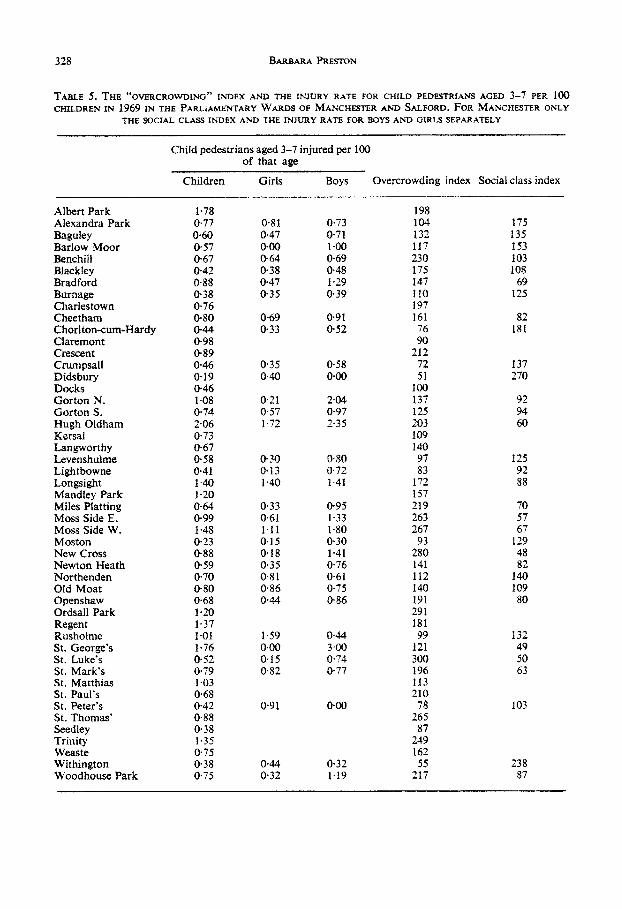
For the other 49 wards of Manchester and Salford the number of children, aged 3-7, injured per 100 children of that age group, was calculated. There were few accidents to children in the centre of Manchester, and this is perhaps because there were few children living near the town centre. But for other areas although there were more children in the wards where a great many children were injured, the differences in the number of children is not sufficient to account for the difference in the number of children injured in the differ- ent type of area. The figures are given in Table 5.
328 BARBARA PRESTON
TABLE 5. THE “OVERCROWDING” INDEX AND THE INJURY RATE FOR CHILD PEDESTRIANS AGED 3-7 PER 100 CHILDREN IN 1969 IN THE PARLIAMENTARY WARDS OF MANCHESTER AND SALFORD. FOR MANCHESTER ONLY
THE SOCIAL CLASS INDEX AND THE INJURY RATE FOR BOYS AND GIRLS SEPARATELY
Child pedestrians aged 3-7 injured per 100 of that age
Children Girls Boys Overcrowding index Social class index
Albert Park 1-78 Alexandra Park 0.77 Banuley 060 B&low Moor 0.57 Benchiil 067 Biackley O-42 Bradford O-88 Burnage 0.38 Charlestown @76 Cheetham O-80 Chorlton-cum-Hardy O-44 Claremont 0.98 Crescent @89 Crumpsall 0.46 Didsbury 0.19 Docks 046 Gorton N. 1.08 Gorton S. o-74 Hugh Oldham 2.06 Kersal o-73 Langworthy o-67 Levenshulme O-58 Lightbowne o-41 Longsight 140 Mandley Park l-20 Miles Pfatting 064 Moss Side E. 099 Moss Side W. I,48 Moston 0.23 New Cross 0.88 Newton Heath 0.59 Northenden 0.70 Old Moat 0.80 Openshaw 068 Ordsail Park 1.20 Regent 1‘37 Rushofme l-01 St. George’s 1.76 St. Luke’s O-52 St. Mark’s 0.79 St. Matthias 1.03 St. Paul’s 0.68 St. Peter’s 042 St. Thomas’ 0.88 Seedley 0.38 Trinity 1.35 Weasie 0.75 Withington 0.38 Woodhouse Park o-75
0.81 0.47 O*OO
x:z o-47 0.35
0,73 o-71 l-00 O-69 O-48 1.29 o-39
198 104 132 117
0.69 o-91 @33 0.52
230 175 147 110 197 I61 76 90
175 135 153 103 108
69 125
82 181
212 0.35 @58 72 137 0.40 0.00 51 270
0.21 2.04 0.57 0.97 1.72 2.35
100 137 125 203 109
92 94 60
O-30 0*x0 0.13 0.72 140 1.41
140 97 83
172 157
I25 92 88
o-33 0.95 0.61 1.33 1.11 1.80 o-15 0.30 O-18 1.41 0.35 0.76 O-81 O-61 O-86 O-75 044 0.86
219 263 267
2:: 141 112 140
1.59 044 0~00 3.00 o-15 O-74 0.82 o-77
191 291 181 99
121 300 196 113 210
78 265
87
70 57 67
129 48 82
140 109 80
132 49 50 63
0.91
::x
O-00 103
0.32 1.19
249 162 55
217 238 87

Statistical analysis of child pedestrian accidents 329
In Didsbury, a pleasant residential area, the accident rate was 2 children injured per 1000 children of this group; in Albert Park, Salford it was 18 per 1000 children, in Hugh Oldham
just over 20. The areas where the accident rate is high are generally areas of old overcrowded houses
with very small gardens, or no gardens at all, often with front doors leading straight on to the road, with no place for children to play, and frequently with traffic funnelling through the residential streets. It seems possible that one of the reasons why there are high accident rates in these areas might be that they lack safe places for children to play. What available ob- jective measure of this type of area can be used to test whether the accident rate is related to the safe play area ?
The 1966 Sample Census gives the number of people living in crowded conditions-l person per room or more. It seemed likely that this might give a measure of the type of physical conditions associated with high accident rates. The type of house which is over- crowded is not likely to be a house in a pleasant garden with space for children to play; the overcrowding is likely to be associated with lack of play space inside and out.
The number of people living 1 person per room or more, per 1000 population was cal- culated for 49 wards in Manchester and Salford. The 5 wards that had been extensively cleared between 1966 and 1969 were omitted, but no correction was made for the compara- tively small changes in the number of electors on the two dates, in the other wards.
There was a Spearman rank correlation of O-53, showing a statistically significant relation between the injury rate for child pedestrians and this measure of the physical conditions.
WHAT DOES THIS CORRELATION MEAN?
It is not due to there being more people, and more children in some wards than in others since this has been corrected for by taking the number of children injured per loo0 children of that age group, and the number of persons living more than 1 person per room per 1000 population.
Neither is it suggested that it is the actual proportion of persons living at more than 1 person per room that has this influence on the accident rate. It is possible that children from overcrowded houses may be more likely to “play out” since there may be little room for playing inside the house, but this in itself could only be a minor factor. It is suggested that this measure is an indicator, easily available, though probably not the best indicator, of a high accident area. It is suggested that space, inside and outside a house, go together. The spacious house will have a garden and space around it for children to play. The overcrowded house is likely to be in an overcrowded street, without gardens or play spaces for children.
But this is not the only interpretation. This type of property rings the town centre, further out there is less overcrowding; but since a great deal of traffic comes to, through, or near, the town centre, there is also likely to be a much greater density of traffic in the inner areas. The Spearman rank correlation coefficient between the number of children injured per 1000 children aged3-7and the distance of the centre of the ward from ManchesterTown Hall is 0.61, The distance from the town centre might be indicative of the type of property, or the amount of traffic, or both.
There is, however, a third possibility, that these measures which correlate with the injury rate are an indication of the type of people who live in the areas, and the physical environ- ment and the traffic are not the main factors, that these people are in some way inadequate and these children would be injured on the roads no matter what conditions they lived under.
An index of the social class of each ward in Manchester was calculated from the numbers
A.&P. 4!4-F

in social classes l-5 given in the 1966 Sampb Census. The index calculated was that used by Moser in his analysis of British Towns (Moser, 196 l)_
Social class index = a +- b where* 2 *
‘? in social class 1 and 2 in that ward a=
average percentage in social class 1 and 2 for all wards
b average percentage in social class 4 and 5 for all wards
==: % in social class 4 and 5 in that ward
For Manchester only (as the figures were not readiiy obtainable forSa&rd), theSpearman rank correlation between the social class index and the injury rate for children aged 3-7, for the 33 wards was 0*58.
Another relevant question is: does this relationship between the accident rate and the social class index apply, for some special reason, only to Manchester, or does it apply to other towns?
The number of children injured in 1969 was given in RoSPA’s ‘Road Accident Statistical Review’ Sept. 1970 for the twelve towns in Great Britain where there were more than 4 children killed on the roads. The number of children under 15 yr of age in these towns was obtained from the 1966 Sample Census and the social class index of the towns in 1951 was obtained from Moser and Scott’s British Towns. The Spearman rank correlation between the social class index and the accident rate for children per fOO0 children for these 12 towns was @.54 {statistically signi~cant at the 0*05 level) showing that this relationship exists fcrr other towns in England and Scotland.
For Manchester the rank correlation between the injury rate for children aged 3-7 for 33 wards and the social class index was 0*58. The rank correlation between the injury rate and the overcrowding index was O*SS,so from these figures it is not possible to say whether social class or the environment is the most important factor; in all probability both will play some part and they are too closely linked to separate.
From the practical point of view, however, it is very important to distinguish between the two factors. It is very difficult to change habits and ways of life, and in particular to make the poor behave like the rich without giving them affluence. If we think that the factors of child upbringing associated with social class are of major importance, then as the Depart- ment cf Environment annual publication, Road Accidents, 1969 states, “The res~nsibility for child safety lies mainly with parents.... This is not an easy area in which to work, nor is it one where signi~cant advances are iikeiy to be made in the short term.”
If, however, it is considered that, though both obviously play some part, the environment plays a major part, then injuries could be prevented by improving the environment. It is very much easier to do this.
The differences between the “worst” accident areas and the “better” areas applied parti- cularly to the younger age groups, the same age groups for which the difference between the number of boys and girls injured was the greatest. It was decided therefore to check whether the large differences between the number of boys and girls injured was connected with the type of area.
First, two extreme areas were compared. The 4 most overcrowded wards, and the 4 wards that rated lowest on Moser’s social class index, 5 wards in all, which will be called area A, was compared with area B, the4least overcrowded wards-and the 4 wards rating highest on

Statistical analysis of child pedestrian accidents 331
TABLE ~.THE NUMBER OFBOYS ANDGIRLS, AGED
~-~,LMNGINTHE~~A" and "B" AREAS, INJURED
Area
A
B
Boys Girls Total
60 22 82
15 15 30
Moser’s social class index, again 5 wards in all, since the two measures very largely overlap. The number of boys and girls aged 3-7 injured from these wards is given in Table 6. In the danger areas there were far more boys than girls injured but, this was not the case
in the “better” areas. Moreover, since there were more chitdren in the danger areas (8160 compared with 6370), the number of girls per 100 injured in the danger areas was only slightly higher than the number injured in the better areas.
From 11 yr of age there was very little difference in the number of boys and girls injured (96 boys and 104 girls). Also after this age, there are no longer obviously bad accident areas; at this age the accidents occur further from home on main roads.
The number of boys and girls, aged 11-14, living in the same “A” and “B” areas, injured in 1969, was found, as shown in Table 7.
TABLE ~.THENUMBEROFBOYSAND GIRLS,AGED 11-14 yr, LIVING IN THE "A" and “B" AREAS,
INJURED
Area
A
B
Boys Gids Total
10 13 23
10 6 16
There are still slightly more children from the “danger” area injured, but the number of children of this age in the different areas is not known, and fortunately, the numbers injured are smalI,so any difference between the number of boys and girls injured in either area might be due to chance.
As far as one can tell from these figures there is little difference between the number of boys and girls injured at all ages, except for a very considerable increase in accidents to younger boys in the areas where it is likely that there is nowhere safe for them to play.
If the accident rate for boys, rather than for girls,is influenced by the type of area, then the correlation between the injury rate for girls, and some measure of the type of area should be lower than that for boys. This was tested. The Spearman rank correlation between the num- ber of girls injured, per 1000 girls of that age, in each of the 33 wards in Manchester for which figures were available and either the social class index or the overcrowding index was negligible (0.01 and O-13 respectively).
For boys however, as expected from the previous discussion, the correlation between the injury rate and the social class index or the overcrowding index was high (0*71 and O-63 res~ctively).
332 BARBARA PRESTON
This is a most surprisingly high correlation when one considers the multitude of factors that might be considered “causes” of each individual accident.
It might be thought from the relative sizes of these correlations that social class was the more important factor, but it must be borne in mind that each of these indices is an indicator of something else. The sociaI class index is based on the father’s job, and it cannot be the father’s job, as such, that influences the accidents, nor can it be the number of persons per room, as such, that influences the accidents. Both are being used as indicators of other things. It so happens that, in Manchester, both are closely correlated except for one, excep- tional, ward. In this ward there had been considerable demolition before the 1966 Census, and the overcrowding index, at that particular time, just after much of the ward had been rehoused, showed retatively little overcrowding. If that ward is omitted then the two cor- relations considered, that between the injury rate and the overcrowding rate, and that between the injury rate and the social ciass index are almost the same, O-67 and O-68. The two indicators are measuring nearly the same thing and the correiation between them is 0.83.
It is not possible, for Manchester, to say whether the social class index or the over- crowding index is likely to be the better indicator of the accident rate for young boys.
To sum up:
(1)
(2)
(3)
f4)
(5)
The injury rate for child pedestrians aged 3-7 per 1000 children is much higher in some areas of Manchester and Salford than others. The injury rate for different areas correlates with (a) the distance of the area from the town centre; (b) an index of overcrowding for the area; and (c) an index of social class for the area. This might be explained by suggesting that the injury rate depended on the amount of traffic, the lack of play space, or the way children were brought up. However, it was found that the high correlation between the accident rate and the social class index or the overcrowding index, was for boys only; the correlation for girls was negligible. There was no difference in the distance from home, or the type of road on which the boys and girls were injured, but young boys were more likely to be injured while playing than girls.
This indicates that it may be lack of safe play spaces that is the main difference between the areas where the accident rate is high and the safer areas.
If this conclusion is correct then the provision of sufficient attractive play areas would be very effective in reducing accidents to young boys in the worst accident areas,
REFERENCES
CENSUS 1966 U. K. General Register Office. DEPARTMENT OF THE ENVIRONM& (1969) Road Accidents. H.M.S.O. MOSER. C. A. and SCOTT. W. (1961). Brirish Towns. Oliver & Bovd, London. The Registrar General’s Statistkal Reciew of England and Wales i1969). H.M.S.O. ROYAL SOCIETY FOR THE PREVENTION OF ACCIDENTS (1969). Road Accident Statistics. ROYAL SOCIEIT FOR THE PREVENTION OF ACCIDENTS (1970). Road Accident, Statistical Review Sept.