statistical analysis and predictive modeling for optimization of geriatrics healthcare processes
TRANSCRIPT
7/23/2019 Statistical Analysis and Predictive Modeling for Optimization of Geriatrics Healthcare Processes
http://slidepdf.com/reader/full/statistical-analysis-and-predictive-modeling-for-optimization-of-geriatrics 1/12
Statistical Analysis and Predictive Modeling for
Optimization of Geriatrics Healthcare Processes
Rafael San Miguel Carrasco
Data ScientistUniversidad Internacional de La Rioja / Hospital Central de la Cruz Roja
Madrid, Spain
Abstract —Geriatrics Medicine constitutes a clini-
cal research field in which big data, statistical analysis
and visualization techniques can deliver solid, reliable
and lasting benefits, including performance optimiza-
tion and improvements in quality of care.
The research work described in this article lever-
ages these tools to develop accurate models that pre-
dict key clinical variables, and delivers an intuitiveand scalable visualization platform to let domain ex-perts (doctors) perform exploratory analysis.
Keywords— Geriatrics, Medicine, Big Data,
Statistical Analysis, Predictive Modeling, Data
Visualization, Resource Optimization, Performance
improvement, Exploratory analysis.
I. I NTRODUCTION
The availability of big data in the healthcare sec-tor has not been seen as an advantage until recenttimes.
Today, managers of healthcare providers noticethat big data can bring significant improvements ina broad range of business processes, and can radi-cally increase the effectiveness and efficiency ofservice delivered to patients, while allowing fordynamic clinical research that can produce net newknowledge not intuitively or easily acquired by tra-ditional research.
This research work aims to generate predictivemodels and visualization tools to accurately antici-
pate demand of (scarce) clinical resources, facilitateclinical research and dramatically improve forecast-ing processes in Geriatric Acute Units.
The work has been split in four areas: develop-ment of predictive models that connect admission-related data with key target variables as LOS (lengthof stay) or mortality rate; development of a Hadoop-
based visual analytics platform for domain expertsto perform exploratory analysis and on-the-go clini-cal research; efficiency analysis of programs gearedtowards providing assistance to nursing homes; andidentification of factors leading to high admissionrates from nursing homes.
For this purpose, anonymized elderly patients'clinical records have been mined with data analyticssoftware and stored in a big data platform.
These records included information about pa-tients demographics, diagnosis, treatment, function-al and mental status, admission-related complica-tions and administered drugs.
II. STATE OF THE ART
Previous research work performed by other pro-fessionals in the fields of interest was reviewed pri-or to starting the project.
This information allowed for an understandingof what other professionals discovered in the past orare currently researching on, as a reference of howthis research must be approached.
A. Programs featuring support to nursing homes
Multiple studies have been performed to identify
solutions focused on lowering admission rates fromnursing homes. One of most recent and comprehen-sive is (Birgitte Graverholt L. F., 2014).
Generally speaking, it states that the followinginitiatives proved to make a relevant contribution inachieving lower admission rates:
• Training programs for healthcare givers, patients, and families.
• Onsite capabilities to deliver palliative care.• Appropriate vaccination levels.
• Assistance from an specialist in GeriatricsMedicine.
In (Martin J. Connolly MD, 2015), however, it'sconcluded that none of the initiatives implementedto decrease admission rates achieved its goal, evenwhen implemented in combination. Those includedmonitoring key clinical indicators, multidisciplinarysessions with healthcare givers, and specializedtraining for nurses, mainly focused on early detec-tion of circumstances leading to an admission.
These studies showed that there is no currentagreement in how nursing homes must be assistedto lower admission rates.
7/23/2019 Statistical Analysis and Predictive Modeling for Optimization of Geriatrics Healthcare Processes
http://slidepdf.com/reader/full/statistical-analysis-and-predictive-modeling-for-optimization-of-geriatrics 2/12
B. Performance indicators in nursing homes
Several studies focus on differences found in el-derly population living in a nursing home and livingalone, with their families or assisted by caregivers attheir homes.
(Birgitte Graverholt T. R., 2011) concludes thatadmission rate is higher among patients living in anursing home, but it also decreases as these patients
become older. Interestingly, (Pollock, 2001) gets tothe same conclusion; however, it also finds relevantdifferences among rates in nursing homes with dif-ferent levels of maturity and capabilities.
Number of total beds and short-term beds have been found to influence admission rates (more beds,lower rate), as stated by (Birgitte Graverholt T. R.,2013). This study also concludes that location ortype of management (public or private) have noimpact on admission rates. Interestingly, (Vikram RComondore, 2009) conclude that publicly-managednursing homes deliver a better service than thosethat are privately managed.
On a side note, a higher number of employees innursing homes bring lower admission rates, as noted
by (Jane E. Bostick, 2006). Improvements are no-ticed in patients' functional capabilities, weigh andoccurrence of pressure ulcers. This paper also pointsout that a high turnover increases admission rates.
Lastly, there are ambitious studies currently un-der development, as (Claire Goodman, 2014), thatwill shed additional light on this topic.
C.
Adverse reaction to drugsDatasets used in this research work included in-
formation on drugs administered to patients. There-fore, it was useful to understand what knowledgewas available about adverse interactions betweendrugs and clinical variables like mortality, LOS and,at a higher level, cost associated with healthcareservices delivery.
As (Grizzle, 2001) points out, average cost of anerror in drugs administration is $977. The total costis $177,5 billion, of which 70% represents the costof patients' admissions resulting from these errors.
(Matthew G. Whitbeck, 2013) demonstrated that patients with atrial fibrillation suffer from multipleadverse reactions to Digoxin, including a highermortality rate. The same conclusion is reached by(Mate Vamos, Increased Mortality Associated WithDigoxin in Contemporary Patients With Atrial Fi-
brillation, 2014), which explains that this adverseinteraction is independent from other factors as kid-ney function, cardiovascular comorbidity or adher-ence to medications.
Also, (Mate Vamos, Digoxin-associated mortali-ty: a systematic review and meta-analysis of theliterature, 2015) confirms that this circumstance is
not limited to patients having atrial fibrillation, butcan be applied to any patient using the drug, regard-less of his diagnosis.
Finally, (Wooten, 2012) concludes that drug-administration errors have a higher impact on elder-ly patients. It also explains that avoiding polyphar-macy, rigorous analysis of drug interactions andfrequent monitoring of patients' adverse reactions todrugs can dramatically lower risk.
D. Statistical analysis of clinical variables
There are multiple studies focused on discover-ing new patterns, correlations, trends or connectionsamong clinical variables.
In many cases, the goal is to predict the value ofkey variables, which becomes helpful to enhanceone or more clinical processes (prevention, diagno-sis, treatment, admission, etc.).
In other cases, the goal is to further understandthe cost structure of healthcare delivery. For exam-
ple, (Ravishankar Jayadevappa, 2006) demonstratesthat having a Geriatric Acute Unit saves up to 21%in cost per patient, lowers admission rate by 11%and shortens LOS by one day.
At this point it became clear that LOS and ad-mission rates are key variables in clinical manage-ment; therefore, they have been subject to specialattention in this research work.
(Michael Bogaisky MD, 2015) describes keyreadmission risk factors in elderly patients, compar-ing those living in nursing homes with the rest.
Generally speaking, readmission rates are higherfor patients from nursing homes. In addition to this,chronic kidney diseases and pressure ulcers aregood predictors of future readmissions.
Also, chronic pulmonary obstruction is only arisk factor for patients living in their homes. Cardi-ovascular diseases and dementia, however, are riskfactors only on patients from nursing homes. Lastly,readmission rate is 30% lower in nursing homesoperated by specialists in Geriatrics Medicine.
It's worth noting that LOS can be predicted for a patient with hip fracture from several variablesgathered along admission. This has been demon-strated by (Garcia, et al., 2012).
E.
Dynamic analysis of clinical variables
One of the fastest-growing trends in big data andstatistical modeling is providing software tools thatcan enable healthcare professionals to predict theevolution of a disease, or analyze patients' data fromdifferent angles.
In this context, the collection of Clinical Intelli-gence use cases described by (Peter K. Ghavami,2014) becomes an essential resource. The most rel-evant use cases are as follows:
• Prediction and management of patient'sLOS in a hospital.
•
Discovery of population at risk for a certaindisease.

7/23/2019 Statistical Analysis and Predictive Modeling for Optimization of Geriatrics Healthcare Processes
http://slidepdf.com/reader/full/statistical-analysis-and-predictive-modeling-for-optimization-of-geriatrics 3/12
• Readmission management.
• Detection of chronic diseases.• Prevention of hospital infections.
• Management of chronic diseases.
III. GOALS
The goal of this research work was being able toanswer the following questions:
• How can big data enhance procedures usedto build predictive models over traditionalapproaches, like hypothesis-based clinicalresearch?
• Can big data help to measure ROI from re-search initiatives and programs, in terms of
patients' quality of life or cost?
• Can big data produce net new knowledgefor the medical community? If so, is it use-
ful to optimize limited resources and en-hance planning and forecasting processes?
• How can exploratory analysis be madeavailable through ecosystems like Hadoop?
• Can big data help improve prediction accu-racy of clinical performance over traditionalinference techniques from small samples?
IV. METHODOLOGY
A. Data sources
Two datasets were used for this research work.
Records of patients' admissions to an Acute Unitfrom 2006 were obtained from a Microsoft Accessdatabase. These clinical records were anonymizedand saved in Excel format (to be used in SAS, SPSSand R), and in CSV format (for Weka and Hadoop).
This initial dataset was filtered to extract pa-tients from nursing homes in the first half of 2015.Additional variables were added to this smaller da-taset, including drug-administration, medical tests,visits to emergencies units and medical consults.
B. Data preparation
Multiple preparation routines were run againstrecords in both datasets to ensure easy managementand mining after loading them into a software tool.
Particularly:
• Missing values. Several default values wereassigned to empty cells:
o "Missing", for categorical (dis-crete) variables.
o Empty string ("") for numeric vari-ables (SAS, R).
o "---", both for categorical and nu-meric variables (Excel).
o In SPSS, the default missing value
was set in advance.
o The average value of a given field.
• Deletion of records. For records in whichmissing values occurred in key fields for thecurrent analysis (for example, target varia-
ble). Those records were recovered after theanalysis was completed.
• Review of minimum and maximum valuesto detect outliers or erroneous values. Thesewere replaced by the average, minimum ormaximum value in the field, depending oneach particular case.
• Deletion of variables not relevant for a par-ticular analysis.
• Deletion of redundant variables.
• Transformation of variables. For example,admission/discharge dates were replaced byLOS, and birthdate was converted to age.
•
Replacement of numeric codes with mean-ingful strings, for faster interpretation of re-sults.
• Replacement of hardcoded strings by nu-meric codes, to execute regression and clus-tering analyses more easily.
C. Data analysis
The following statistical analysis and modelingtechniques were used:
• Calculation of descriptive indicators, to un-
derstand each field's structure.• Multivariant linear regression, to build pre-
dictive models based on a linear combina-tion of input variables.
• Variable transformation, to increase the de-gree of linear correlation between predictorsand target variable, and identify non-trivialrelationships among variables.
• Variable selection, to quickly discard thosethat show low predictive capabilities.
• Logistic regression
•
Hypothesis tests, by using Chi-square and t-distribution for categorical and numeric var-iables, respectively.
• Clustering
• Associative rules, to discover what factorslead to certain clinical outcomes.
• Decision trees.
• Data indexing, to ensure fast access to data,and enable dynamic visualization and filter-ing features in Hadoop.
D.
Toolset
The following software tools were used:

7/23/2019 Statistical Analysis and Predictive Modeling for Optimization of Geriatrics Healthcare Processes
http://slidepdf.com/reader/full/statistical-analysis-and-predictive-modeling-for-optimization-of-geriatrics 4/12
1) IBM SPSS 1
The methodology used is described in section ti-tled "60.2 Numerical Example: K-Means Cluster-ing" of (Lawrence S. Meyers, 2013).
2)
SAS Data Miner 2
The methodology used for regression analysis isdescribed in sections 6.4.1-2 of (Sarma, 2013).
3) Hadoop/HUE/Solr
3Both HUE
4and Solr
5were deployed in Hadoop
to enable visualization features.
4) R Studio6
R was used to run hypothesis tests.
5) Weka7
Weka was used to run associative rules analysis.
Weka is frequently used for clinical research.One example is (Josceli Maria Tenório, 2011).
E. Limitations
The methodology, tools and data used in this re-search work is subject to several limitations that aredescribed next. This information will help the readerassess whether obtained results are reliable enoughfor a particular scenario.
1) Data sampling
The initial dataset was filtered to select patientsliving in nursing homes being admitted in the first
half of 2015. Typically, one year is a more appropi-ate period for inference techniques to be reliable.
Also, datasets were subject to bias, since patientrecords were gathered from a single hospital. In anideal scenario, patients must have been selectedfrom multiple hospitals.
2) Data quality
Information was gathered by healthcare person-nel and input into clinical information systems thatimplement measures to avoid input errors.
However, the risk of having erroneous data is
not fully mitigated.
1 http://www.ibm.com/software/es/analytics/spss/
2 http://www.sas.com/en_us/software/analytics/enterprise-miner.html
3 http://www.cloudera.com/content/cloudera/en/products-and-services/cdh.html
4 http://gethue.com/hadoop-search-dynamic-search-
dashboards-with-solr/
5 http://lucene.apache.org/solr/ 6 http://www.revolutionanalytics.com/what-r
7 http://www.cs.waikato.ac.nz/ml/weka/
Also, certain variables' values are influenced bythe subjective perception of the doctor or nurse.
Finally, full clinical records (including all varia- bles) were not processed for analysis; just relevantvariables were included.
3)
Accuracy of resultsTools used are enterprise-class and are common-
ly used in scientific studies. In addition to this, crite-ria used to assess statistical significance was basedon generally accepted practices.
However, this doesn't imply that they are alsosuitable for other scenarios beyond the context ofthis research work.
4) Seasonality
Clinical records of patients from nursing homescovered a period of six months. Therefore, seasonal-ity factors couldn't be accounted for.
This might result in biased values. However, theresulting deviation won't likely impact the final re-sults that were obtained.
5) Geographical factors
As stated previously, the source of data was onehospital in Madrid (Spain).
Therefore, conclusions might not be applicableto other geopgraphies. However, this source of biasis common to most clinical trials.
6) Methodological errors
Data mining techniques used for this projectconstitute industry best practices. Nevertheless, oth-er context-related factors might not have been takeninto account.
7) Other limitations
No additional limitations were identified.
In addition, conflicts of interest were not foundto apply to the author of this work or any of his col-laborators. None of the participants will personally
benefit from obtained results.
V.
OBTAINED R ESULTS Digoxin, a regular drug occasionally used in the
treatment of various heart conditions, was proved to be linked to patients' mortality. This connection had been demonstrated for other populations but nevertested with elderly patients.
An statistically significant model to predict el-derly patients' LOS was built. The model is basedon variables that are usually gathered during pa-tient's admission. This model could be implementedto improve forecasting processes in hospitals.
Nursing homes' features that lower hospital ad-
mission rates were identified. This helps healthcaremanagers choose those nursing homes that will re-quest fewer admissions. It also helps nursing homes'
7/23/2019 Statistical Analysis and Predictive Modeling for Optimization of Geriatrics Healthcare Processes
http://slidepdf.com/reader/full/statistical-analysis-and-predictive-modeling-for-optimization-of-geriatrics 5/12
managers make informed decisions as to what in-vestments will increase performance (hence leadingto fewer admission requests).
A Hadoop-based visual analytics environmentwas created. Using this platform, doctors can quick-ly answer questions like: what is the most common
patient' profile for a given disease? How a certaindisease occurrence evolved overtime? What diseas-es lead to more costly treatments?
The ultimate goal was proving that big data ana-lytics can optimize traditional approaches to clinicalresearch. Both exploratory features and a discoverystrategy (as opposed to testing a single hypothesis)leads to more insights, more findings and non-intuitive or complex relationships among variablesthat would never be searched for otherwise.
VI. STATISTICAL MODEL TO PREDICT MORTALITY
A.
Background
Patients mortality is a key clinical variable.
Datasets were mined to discover what variablescould accurately predict mortality (Exitus) on a giv-en set of patients.
B. Methodology
The dataset with elderly patients from nursinghomes was chosen for this analysis, as it includesmore variables and, therefore, can lead to a moreaccurate model.
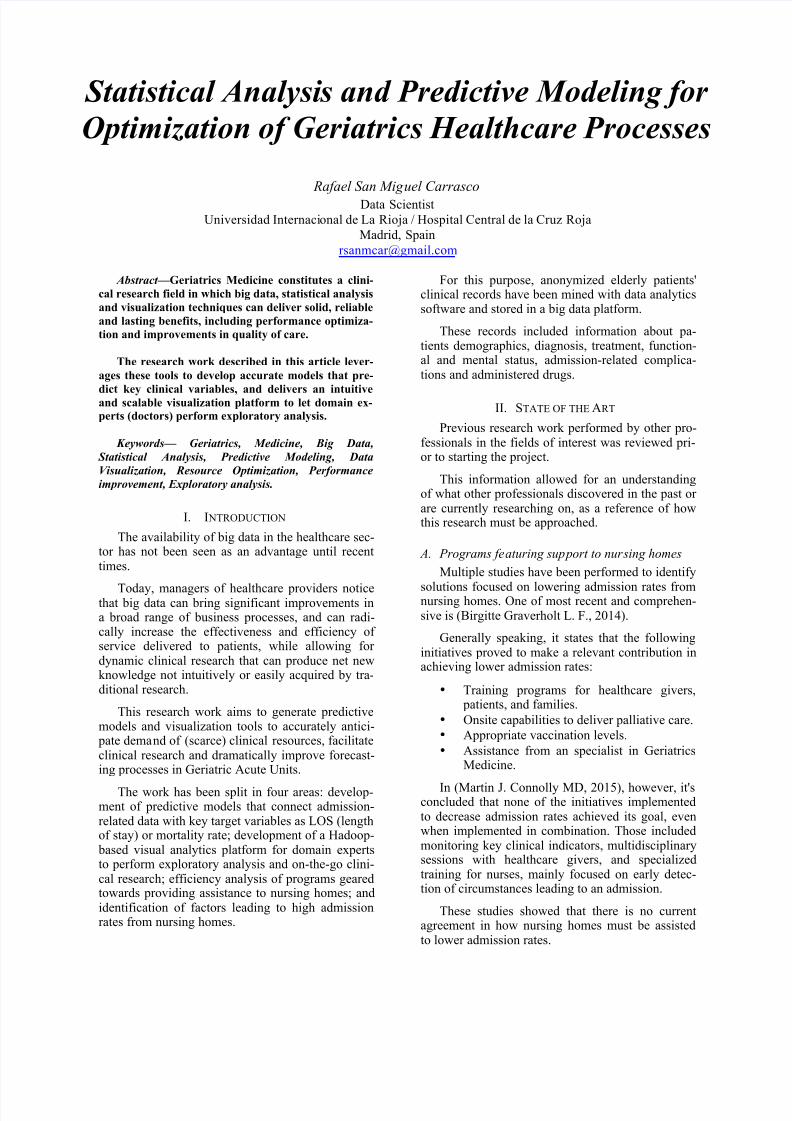
The following diagram was designed and run inSAS Enterprise Miner to build the model:
The regression node was configured as follows:
• Two factors interaction: No.
• Polynomials terms: No.• Regression type: Logistic regression.
•
Link function: Logit.• Model selection: Stepwise.
• Selection criteria: Validation error.
• Optimization technique: Default.
Model fit indicators and relative risk (odds-ratio)values were analyzed to assess the reliability and
predictive capabilities of the model.
C.
Obtained results
The process to build the model was split in sev-eral iterations.
In the first iteration, a single variable was foundto predict mortality with 100% of accuracy: Place ofExitus. It became obvious that this variable had to
be removed from the model.
In the next iteration, Morphine was found to ac-curately predict mortality. However, since this drugis typically administered to patients when they areabout to die, the resulting model would offer no
predictive capabilities to a doctor. As such, this drug
was also removed from the model.
In the third iteration, however, a model contain-ing several meaningful variables was obtained.
These were the following:
• Digoxin, a drug that has been proved to beassociated with higher mortality rates in
previous clinical trials.
• Number of lab tests requested by the doctorduring the admission process.
• Occurrence of pressure ulcers.
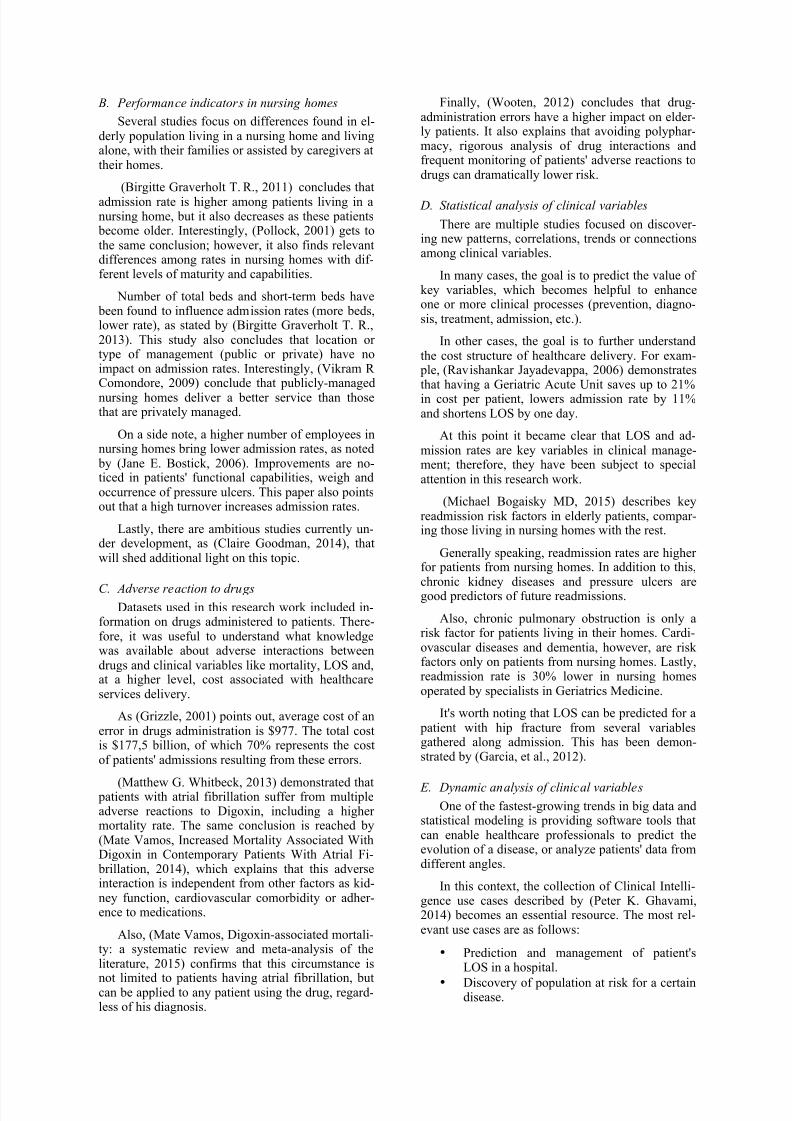
This model was assessed to confirm that it wasreliable and accurate enough from an statistical per-spective. Key model fit indicators displayed by SASand used for this assessment are shown in Figure 1.
D. Conclusions
The model built in SAS was proved to be statis-tically significant and can thus be implemented toaccurately predict mortality in a set of patients.
The confusion matrix depicted below for traindataset confirms that the model was accurate:
Tabla de evento de clasificación
Rol de los datos=TRAIN Objetivo=B_Exitus_Horus Etiqueta objetivo=B_Exitus Ho-rus
Falso Verdadero Falso Verdaderonegativo negativo positivo positivo
8 35 6 24
Rol de los datos=VALIDATE Objeti-vo=B_Exitus_Horus Etiqueta objetivo=B_Exitus Horus
Falso Verdadero Falso Verdaderonegativo negativo positivo positivo
3 11 . 6
Figure 1. SAS diagram.

7/23/2019 Statistical Analysis and Predictive Modeling for Optimization of Geriatrics Healthcare Processes
http://slidepdf.com/reader/full/statistical-analysis-and-predictive-modeling-for-optimization-of-geriatrics 6/12
Figure 2. Model fit indicators.
VII. STATISTICAL MODEL TO PREDICT LENGTH OF
STAY
A. Background
LOS becomes a key clinical variable after an el-derly patient is admitted., because it is closely relat-ed to the amount of resources required to treat this
patient.
For this reason, an attempt was made to build a predictive model that could accurately anticipate the
LOS of a given patient, using information gatheredduring the admission process.
B. Methodology
The SAS diagram shown in the previous sectionwas redesigned to account for this model's require-ments.
Appropriate values for each relevant parameterof SAS nodes included in the diagram have been set
before running the analysis.
Data was split into training set (50%), validationset (40%) and test set (10%). The selected partition-
ing method was Simple Random.The default impute method for interval variables
was set to Mean. No impute method was set forcategorical (discrete) variables nor the target varia-
ble (LOS).
The following options regarding transformationsof variables were set:
• Maximum correlation with target (for inter-val inputs).
• Dummy indicators (for categorical inputs).
• No transformation for target variable.
The following settings were applied to filter in- put variables:
• Maximum missing percentage of 50.
• Maximum class level of 100.
• R-square and Chi-Square values againsttarget variable.
• Unused input was rejected.
• Up to 50 bins for categorical variables.
• Minimum Chi-suare of 3.84.
• Minimum R-square of 0.005.
• Stop R-square of 5.0E-4.
•
Don't include interactions.• Hide rejected and unused variables.
Finally, the following settings were used for theRegression Node:
• Linear regression (aside of transformed var-iables).
• Stepwise selection model.
• Selection criterion: model built in last step.
• Logit as link function.
C.
Obtained results
The resulting model was found to be statisticallysignficant, accounting for 95,23% (R-Square) of thetarget variable's variance, as shown below.
The use of R-Square to assess a model's fit is ex-
tensively documented in section titled "Using r2 tomeasure model fit" in (Deborah Rumsey, 2009).
Model Fit Statistics
R-Square 0.9706 Adj R-Sq 0.9523
AIC 35.6839 BIC 1.5073
SBC 77.0600 C(p) 298.3080
7/23/2019 Statistical Analysis and Predictive Modeling for Optimization of Geriatrics Healthcare Processes
http://slidepdf.com/reader/full/statistical-analysis-and-predictive-modeling-for-optimization-of-geriatrics 7/12
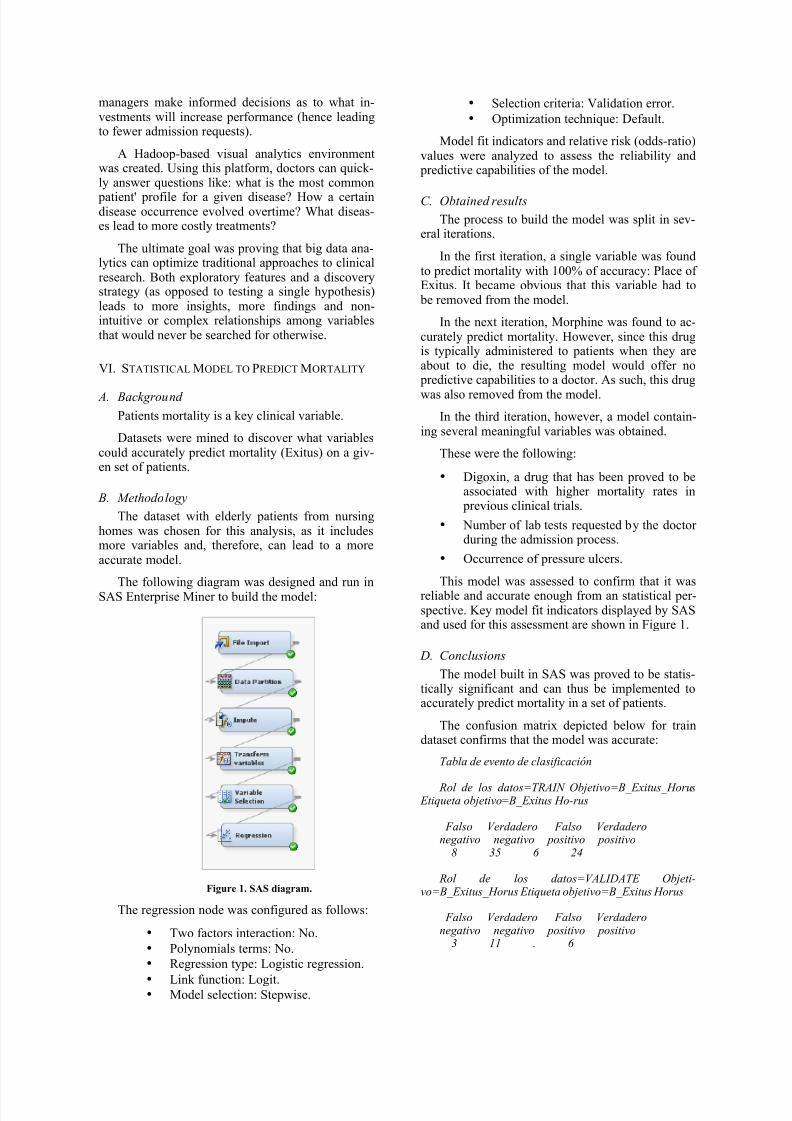
The fragment of SAS output displayed in Figure3 shows the model's coefficients.
The variables related to those coefficients are:
• Previous number of admissions.
• Gender.
•
Diagnoses as acute kidney failure, respirato-ry infection and acute bronchitis.
• Barthel index prior to admission.
• Falls.
• Total amount of administered drugs.
• Need for urinary catheter.
• Infections at hospital.
Other input variables related to drugs as metro-nizadole, fosfomycin, fluoxetine, vildaglipitin, met-amizole, and paracetamol were also found to bestatistically signficant in the model. However, these
were removed from the model because, from a clin-ical perspective, they don't represent a causal rela-tionship but are rather noise from the sample.
D. Conclusions
Prediciting the LOS of an elderly patient admit-ted into a hospital opens up a broad range of fore-casting improvements and demand managementoperational advantages.
Particularly:
• Accurately forecasting availability of beds.
• Predictable costs of patients' treatment.
• Effective workload balancing among clini-cal resources, especially those that becomescarce, as geriatric doctors.
• Enabling doctors to invest the required timeand effort in each patient.
Finally, discovering that a drug (Digoxin) is re-lated to a higher mortality rate reinforces the need toinvest in research on drugs interaction, supporting
pharma industry to produce high quality drugs.
Figure 3. Regression coefficients.
VIII. STATISTICAL MODEL TO PREDICT ADMISSION
R ATES FROM NURSING HOMES
A. Background
Understanding what features of a nursing homelead to higher performance, that is, better quality ofcare and less hospital admissions, constitute a desir-able goal for the medical community.
Top performing nursing homes exhibit loweradmission rates, hence making an efficient use ofthe most expensive health system resources.
B. Methodology
The original SAS diagram was redesigned to ac-count for this model's requirements.
Regression Node was configured as follows:
• Regression type: Linear.
• Link function: Identity link.
• Model selection: Stepwise.

7/23/2019 Statistical Analysis and Predictive Modeling for Optimization of Geriatrics Healthcare Processes
http://slidepdf.com/reader/full/statistical-analysis-and-predictive-modeling-for-optimization-of-geriatrics 8/12
• Entry significance level, Stay significancelevel, Maximum number of steps: defaultvalues.
• Model selection criteria: Validation Error.
Data was split into training set (70%), validation
set (20%) and test set (10%). Default impute meth-od for the variable "Fees" was set to Mean.
"Best" method was set for interval (continuous)variables in the Transform Variables Node, to allowfor a higher correlation with the target.
"Dummy indicators" option was set for categori-cal variales, meaning that flag variables were creat-ed for each category. This technique also allows forhigher correlation with the target.
Lastly, input variables showing a higher correla-tion (R-Square and Chi-square) with the target areselected. It is worth noting that the Regression Node
applies additional selection criteria after this initialselection process.
C.
Obtained results
The transformed variable that represents the in-verse of the number of beds in the nursing home canaccurately predict the admission rate from that nurs-ing home.
The correlation between these two variables can be confirmed through visual inspection using a scat-ter plot, displayed in Figure 4. This chart is deemedappropriate for this purpose in section "4. MarketBasket Analysis", in (Miller, 2014).
Figure 4. Scatter plot showing linear correlation between
variables.
The model can explain up to 86% of the target'svariance. Other indicators as variance analysis, sumof squares and standard error confirm this point.
The equation describing the model, that can beused for predictions with new data, is as follows:
The model includes additional effects: dummyvariables representing geographical locations of the
nursing homes. They are statistically significant andmust be kept in the model, even though their contri-
bution is much lower than the number of beds.
They are the following:
• TI_N_Nursinghome_city1 (Alcobendas)
•
TI_N_ Nursinghome_city15 (Torrelaguna)• TI_N_ Nursinghome _city3 (Brunete)
D. Conclusions
The model built with SAS can accurately predictthe admission rate for a given nursing home, fromthe number of beds and other variables.
With this information, a Geriatric Unit can accu-rately forecast the number of admissions from cur-rently served nursing homes, and make better choic-es with regards to new nursing homes to be servedin the future.
Lastly, these results help nursing homes' manag-ers to make better decisions regarding investmentsgeared towards increasing performance.
IX. EFFICIENCY A NALYSIS OF SPECIALIZED
ASSISTANCE TO NURSING HOMES
A. Background
Programs geared towards providing assistancefrom a geriatrics doctor to nursing homes are beingimplemented in hospitals. The goal is to give bettercare to elderly patients, hence requiring fewer sup-
port from hospitals and, in turn, lowering the cost to
deliver healthcare.The following statistical analysis validates that
these programs can provide the expected return oninvestment.
B. Methodology
Chi-Square test (X^2 statistic) was used to checkfor an statistically significant difference in key clin-ical variables between patients receiving specializedassistance and the control group.
The procedure used for this analysis is docu-mented in section titled "15.3.2. Two-Sample T-
Test" in (Lander, 2014).
C. Obtained results
The following clinical parameters were found toimprove in patients receiving specialized assistance:
• CRF (functional status)• CRM (mental status)• Barthel index• Number of complications (lower)
No statistical differences were found in the fol-lowing parameters:
• Admissions
• Readmissions• LOS
7/23/2019 Statistical Analysis and Predictive Modeling for Optimization of Geriatrics Healthcare Processes
http://slidepdf.com/reader/full/statistical-analysis-and-predictive-modeling-for-optimization-of-geriatrics 9/12
• Survival• Lab tests• Number of administered drugs
D. Conclusions
Elderly patients receiving specialized assistance
exhibit better functional and mental status, less dis-ability and fewer complications during admission.
This means that these patients have better quali-ty of life, which proves that these programs providea true return on investment.
X. VISUALIZATION TOOL FOR EXPLORATORY
A NALYSIS
A. Introduction
The purpose of building a visualization platformis providing domain experts with an effective tool todiscover patterns or relationships among data varia-
bles through exploratory analysis and visual inspec-tion.
In the context of this research work, this devel-opment must be seen as a tool to go beyond reportedfindings and discover new insights in the datasets.
On the other hand, the decision to use Hadoopas the underlying framework was made to ensurethat this tool could scale out to process millions ofclinical records with literally no changes to the cur-rent architecture.
B. Methodology
The tool was built upon the following technolo-gies:
• CDH: Cloudera Hadoop.
• HUE: Hadoop User Experience.
• Solr, a Hadoop component to build searchengines and browse data stored in HDFS.
Installation and configuration activities followedthe procedures described in section "Setting Up theHadoop for Dummies environment" in (Dirk deR-oos, 2014).
The process was split into the following tasks:• Rent a virtual private server (VPS) compat-
ible with Hadoop.
• Install and configure Ubuntu Linux.
• Install CDH.
• Install HUE.
• Upload data in CSV format.
• Run data preparation routines to facilitateingestion by Hadoop.
• Index content with Solr.
• Select variables for visualization.
•
Design filters and charts.
• Implement panels in HUE.
• Create sample use cases.
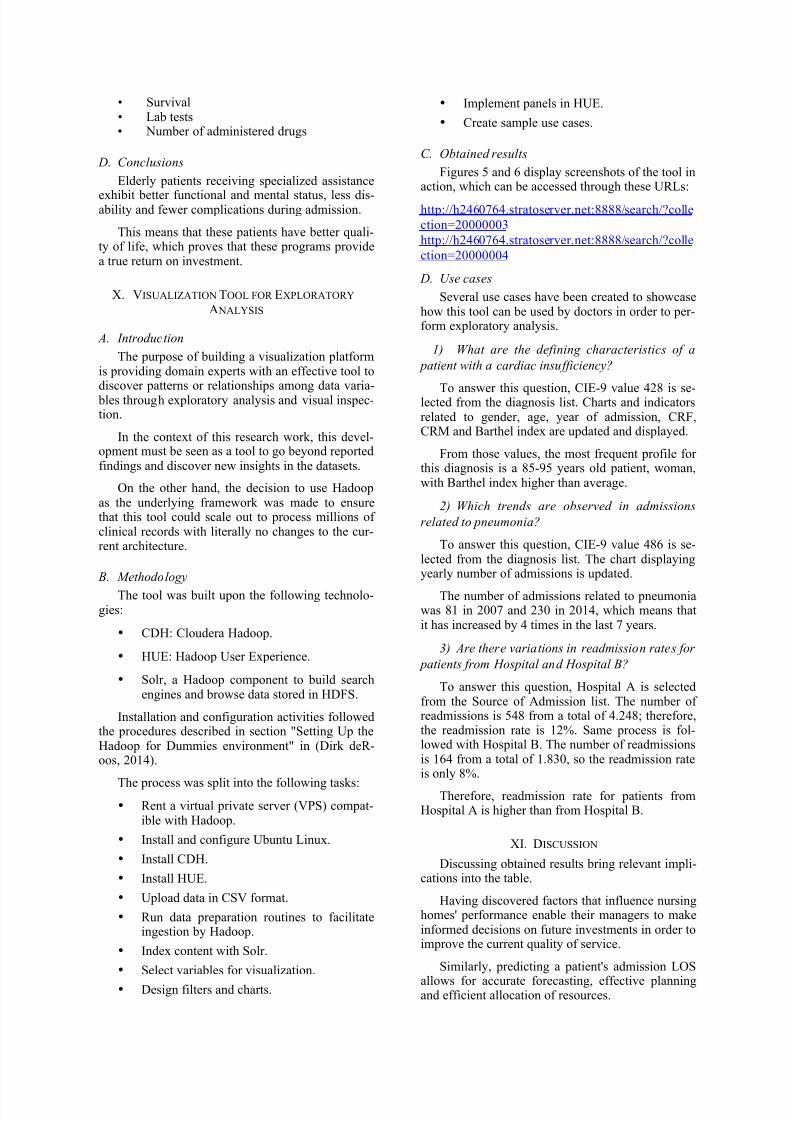
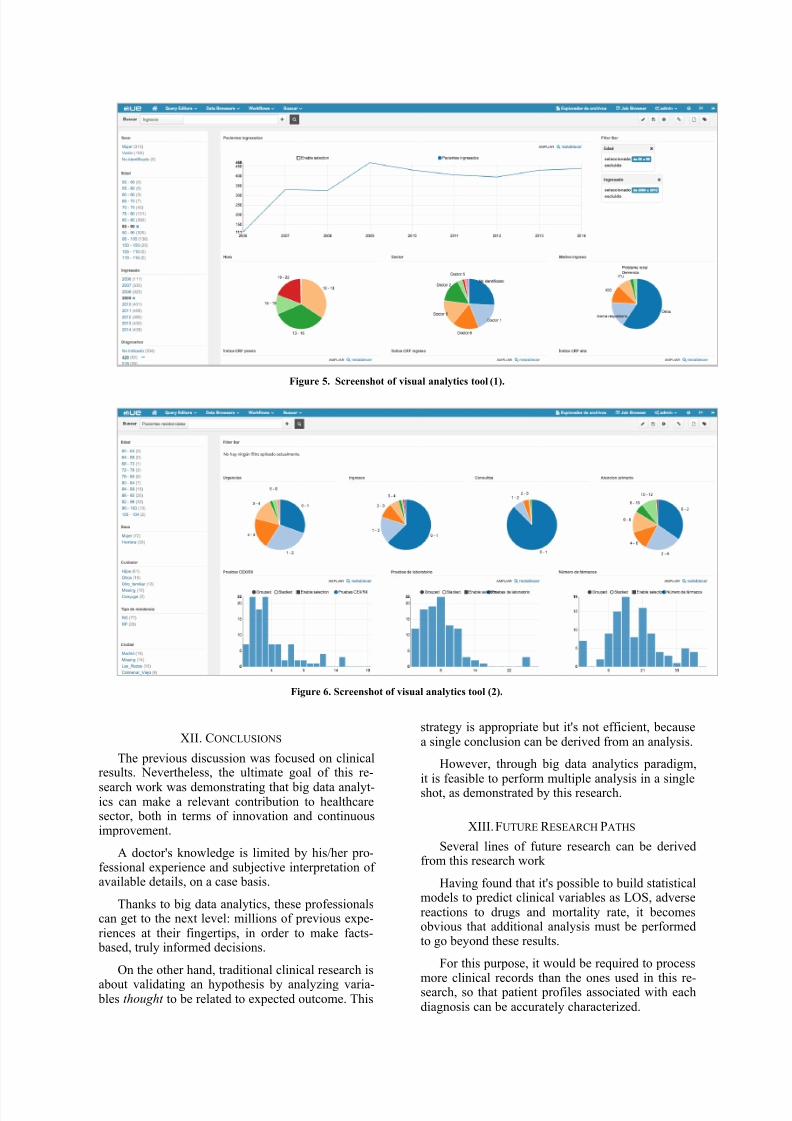
C. Obtained results
Figures 5 and 6 display screenshots of the tool inaction, which can be accessed through these URLs:
http://h2460764.stratoserver.net:8888/search/?collection=20000003
http://h2460764.stratoserver.net:8888/search/?collection=20000004
D. Use cases
Several use cases have been created to showcasehow this tool can be used by doctors in order to per-form exploratory analysis.
1) What are the defining characteristics of a
patient with a cardiac insufficiency?
To answer this question, CIE-9 value 428 is se-lected from the diagnosis list. Charts and indicatorsrelated to gender, age, year of admission, CRF,CRM and Barthel index are updated and displayed.
From those values, the most frequent profile forthis diagnosis is a 85-95 years old patient, woman,with Barthel index higher than average.
2) Which trends are observed in admissions
related to pneumonia?
To answer this question, CIE-9 value 486 is se-lected from the diagnosis list. The chart displayingyearly number of admissions is updated.
The number of admissions related to pneumoniawas 81 in 2007 and 230 in 2014, which means thatit has increased by 4 times in the last 7 years.
3) Are there variations in readmission rates for
patients from Hospital and Hospital B?
To answer this question, Hospital A is selectedfrom the Source of Admission list. The number ofreadmissions is 548 from a total of 4.248; therefore,the readmission rate is 12%. Same process is fol-lowed with Hospital B. The number of readmissionsis 164 from a total of 1.830, so the readmission rateis only 8%.
Therefore, readmission rate for patients fromHospital A is higher than from Hospital B.
XI. DISCUSSION
Discussing obtained results bring relevant impli-cations into the table.
Having discovered factors that influence nursinghomes' performance enable their managers to makeinformed decisions on future investments in order toimprove the current quality of service.
Similarly, predicting a patient's admission LOS
allows for accurate forecasting, effective planningand efficient allocation of resources.
7/23/2019 Statistical Analysis and Predictive Modeling for Optimization of Geriatrics Healthcare Processes
http://slidepdf.com/reader/full/statistical-analysis-and-predictive-modeling-for-optimization-of-geriatrics 10/12
Figure 5. Screenshot of visual analytics tool (1).
Figure 6. Screenshot of visual analytics tool (2).
XII. CONCLUSIONS
The previous discussion was focused on clinicalresults. Nevertheless, the ultimate goal of this re-
search work was demonstrating that big data analyt-ics can make a relevant contribution to healthcaresector, both in terms of innovation and continuousimprovement.
A doctor's knowledge is limited by his/her pro-fessional experience and subjective interpretation ofavailable details, on a case basis.
Thanks to big data analytics, these professionalscan get to the next level: millions of previous expe-riences at their fingertips, in order to make facts-
based, truly informed decisions.
On the other hand, traditional clinical research is
about validating an hypothesis by analyzing varia- bles thought to be related to expected outcome. This
strategy is appropriate but it's not efficient, becausea single conclusion can be derived from an analysis.
However, through big data analytics paradigm,it is feasible to perform multiple analysis in a singleshot, as demonstrated by this research.
XIII. FUTURE R ESEARCH PATHS
Several lines of future research can be derivedfrom this research work
Having found that it's possible to build statisticalmodels to predict clinical variables as LOS, adversereactions to drugs and mortality rate, it becomesobvious that additional analysis must be performedto go beyond these results.
For this purpose, it would be required to process
more clinical records than the ones used in this re-search, so that patient profiles associated with eachdiagnosis can be accurately characterized.
7/23/2019 Statistical Analysis and Predictive Modeling for Optimization of Geriatrics Healthcare Processes
http://slidepdf.com/reader/full/statistical-analysis-and-predictive-modeling-for-optimization-of-geriatrics 11/12
Also, once factors related to higher performancehave been identified for nursing homes, next naturalstep would be to perform a similar exercise withhospitals.
The complexity associated with running thisanalysis for hospitals would be significantly higher,
but obtained results would have crucial relevance inclinical management, as well as dramatic impact onhealthcare system's performance.
ACKNOWLEDGMENT
This research was possible thanks to PhD JavierGómez Pavón, senior doctor and reputated expertand researcher in Geriatrics Medicine.
PhD Beatriz Ares Castro-Conde, senior doctor,also made a great contribution to this research. Shetransformed this project into a formula to strengthena relationship that has proved to be as solid and ev-
er-lasting as this research' results will likely be.Lastly, PhD Pablo Orduña Fernández, Professor
and Researcher in University of Deusto providedcontinuous support to achieve the degree of excel-lence required by a reputated institution like Interna-tional University of La Rioja.
XIV. R EFERENCES
Birgitte Graverholt, L. F. (2014). Reducing hospitaladmissions from nursing homes: a systematicreview . Graverholt et al. BMC Health Services
Research 2014, 14:36 , 8.
Birgitte Graverholt, T. R. (2011). Acute hospitaladmissions among nursing home residents: a
population-based observational study. Graverholt
et al. BMC Health Services Research 2011, 11:126
, 8.
Birgitte Graverholt, T. R. (2013). Acute hospitaladmissions from nursing homes: predictors ofunwarranted variation? Scandinavian Journal of
Public Health, 2013; 41: 359–365 , 8.
Claire Goodman, A. L. (2014). Effective healthcare for older people resident in care homes: theoptimal study protocol for realist review .
Goodman et al. Systematic Reviews 2014, 3:49 , 7.
Deborah Rumsey, P. (2009). Statistics II for
Dummies. New Jersey.
Dirk deRoos, P. C. (2014). Hadoop For Dummies. New Jersey: John Wiley & Sons, Inc.
Garcia, A. E., Bonnaig, J. V., Yoneda, Z. T.,Richards, J. E., Ehrenfeld, J. M., Obremskey, W.T., y otros. (2012). Patient Variables Which May
Predict Length of Stay and Hospital Costs inElderly Patients With Hip Fracture. Journal of
Orthopaedic Trauma: , 4.
Grizzle, F. R. (2001). Drug-Related Morbidity andMortality: Updating the Cost-of-Illness Model. J
Am Pharm Assoc. 2001;41(2) , 7.
Jane E. Bostick, P. A. (2006). Systematic Review
of Studies of Staffing and Quality in NursingHomes. Journal of the American Medical Directors
Association , 10.
Josceli Maria Tenório, A. D. (2011). Artificial
intelligence techniques applied to the developmentof a decision–support system for diagnosing celiacdisease. International Journal of Medical
Informatics , 9.
Lawrence S. Meyers, G. C. (2013). Performing
Data Analysis Using IBM SPSS. New Jersey: JohnWiley & Sons, Inc.
Martin J. Connolly MD, F. F. (2015). The AgedResidential Care Healthcare Utilization Study
(ARCHUS): A Multidisciplinary, ClusterRandomized Controlled Trial Designed to ReduceAcute Avoidable Hospitalizations From Long-
Term Care Facilities. JAMDA 16 (2015) 49-55 , 7.
Mate Vamos, J. W. (2015). Digoxin-associated
mortality: a systematic review and meta-analysis ofthe literature. European Heart Journal , 8.
Mate Vamos, J. W. (2014). Increased MortalityAssociated With Digoxin in Contemporary PatientsWith Atrial Fibrillation. Journal of the American
College of Cardiology , 9.
Matthew G. Whitbeck, R. J. (2013). Increasedmortality among patients taking digoxin—analysisfrom the AFFIRM study. European Heart Journal
(2013) 34, 1481–1488
doi:10.1093/eurheartj/ehs348 , 8.
Michael Bogaisky MD, M. a. (2015). EarlyHospital Readmission of Nursing Home Residentsand Community-Dwelling Elderly Adults
Discharged from the Geriatrics Service of an UrbanTeaching Hospital: Patterns and Risk Factors.Wiley Online Library , 3.
Miller, T. W. (2014). Modeling Techniques in
Predictive Analytics. New Jersey: PearsonEducation Inc.
Ravishankar Jayadevappa, P. S. (2006). HealthResource Utilization and Medical Care Cost ofAcute Care Elderly Unit Patients . VALUE IN
HEALTH, Volume 9, Number 3, 2006 , 7.
Sarma, K. S. (2013). Predictive Analytics with SAS
Enterprise Miner. North Carolina.
Vikram R Comondore, r. P. (2009). Quality of carein for-profit and not-for-profit nursing homes:systematic review and meta-analysis. BMJ
2009;339:b2732 , 15.

7/23/2019 Statistical Analysis and Predictive Modeling for Optimization of Geriatrics Healthcare Processes
http://slidepdf.com/reader/full/statistical-analysis-and-predictive-modeling-for-optimization-of-geriatrics 12/12
Wooten, J. M. (2012). PharmacotherapyConsiderations in Elderly Adults. South Med J.
2012;105(8):437-445. , 8.