statics and dynamics of free and hydrogen-bonded oh groups
TRANSCRIPT

Statics and Dynamics of Free and Hydrogen-Bonded
OH Groups at the Air/Water Interface
Ana Vila Verde,∗,†,¶ Peter G. Bolhuis,∗,† and R. Kramer Campen∗,‡
Van’t Hoff Institute for Molecular Science University of Amsterdam, Amsterdam, PO Box 94157
1090 GD Amsterdam, The Netherlands, and Fritz Haber Institute of the Max Planck Society,
Faradayweg 4–6 14195 Berlin Germany
E-mail: [email protected]; [email protected]; [email protected]
∗To whom correspondence should be addressed†University of Amsterdam‡Fritz Haber Institute of the Max Planck Society¶Currently at the Max Planck Institute of Colloids and Interfaces, Theory and Bio-Systems Department, Wis-
senschaftspark Potsdam-Golm, Am Mühlenberg 1 OT Golm 14476 Potsdam, Germany; also at the University ofMinho, Physics Center, Campus de Gualtar, 4710-057 Braga, Portugal.
1

Abstract
We use classical atomistic molecular dynamics simulations of two water models (SPC/E
and TIP4P/2005) to investigate the orientation and reorientation dynamics of two subpopula-
tions of OH groups belonging to water molecules at the air/water interface at 300 K: those
OH groups that donate a hydrogen-bond (called bonded) and those that do not (called free).
Free interfacial OH groups reorient in two distinct regimes: a fast regime from 0-1 ps and
a slow regime thereafter. Qualitatively similar behavior was reported by others for free OH
groups near extended hydrophobic surfaces. In contrast, the net reorientation of bonded OH
groups occurs at rates similar to bulk water. This similarity in reorientation rate results from
compensation of two effects: decreasing frequency of hydrogen-bond breaking/formation (i.e.
hydrogen-bond exchange) and faster rotation of intact hydrogen-bonds. Both changes result
from the decrease in density at the air/water interface relative to bulk. Interestingly, because
of the presence of capillary waves the slowdown of hydrogen-bond exchange is significantly
smaller than that reported for water near extended hydrophobic surfaces, but it is almost identi-
cal to that reported for water near small hydrophobic solutes. In this sense water at the air/water
interface has characteristics of water of hydration of both small and extended hydrophobic so-
lutes.
Keywords: water structure; water dynamics; water-vapor interface; molecular dynamics simu-
lations; SPC/E water; TIP4P/2005 water
1. Introduction
The chemistry and physics of water at interfaces control a variety of important processes in the
atmosphere, in biology and in devices. Predictive understanding of these processes generally re-
quires knowledge of their molecular level mechanism. In particular we often require an under-
standing of the relationship between the angstrom scale static and dynamic properties of water
(at interfaces) and macroscopic thermodynamic observables. For example, accurate description
of the free energy of adsorption of metal ions at the oxide-water interface requires knowledge of
2
the dielectric constant of interfacial water, and thus of interfacial water structure1,2. Experimental
advances in the last twenty years have revolutionized our ability to quantify equilibrium properties
as well as sub-picosecond structural dynamics of water both in bulk and around small solutes3–7.
Contemporaneous advances in computational power and algorithms have enabled the calculation
of experimental observables with water models of increasing complexity: fixed charge classical
atomistic models, classical polarizable models and ab initio molecular dynamics. Gaining simi-
lar insight into dynamics at extended interfaces has been challenging. On the experimental level
this challenge arises because most techniques applied to the structural dynamics of neat water and
water containing small solutes – IR absorbance, NMR and dielectric relaxation – are not interface-
specific thus their use to study interfacial water generally requires special sample cells to diminish
the much larger signal from water molecules in the bulk. For vibrational spectroscopy this limi-
tation can be overcome by application of the interface-specific, laser-based technique vibrational
sum frequency (VSF) spectroscopy8. In the computational realm, calculation of interfacial water
properties requires significantly larger system sizes and larger sampling times (e.g. simulations
must be of sufficient length that small solutes reach an equilibrium between the bulk and the inter-
face) than those in bulk. It is thus only recently that widespread application of ab initio molecular
dynamics approaches to simple aqueous interfaces has occurred9,10.
Above we have made the case for the importance of understanding the structure and structural
dynamics of interfacial water in general. In this study we address in particular the structure and
structural dynamics of water at the air/water interface. We choose to focus in this manner for
three reasons: several studies have found that water at the air/water interface is strikingly similar
to water near hydrophobic interfaces more generally8,10,11; properties of the air/water interface
control a variety of chemical processes in the atmosphere and in the surface ocean12; from an
experimental perspective its study is easier than that of other water/hydrophobic interfaces.
Following the pioneering VSF spectroscopy work of Shen and coworkers, a variety of compu-
tational and experimental studies have determined that, on average, there are two types of water at
the air/water interface10,13–17. The first type straddles the interface with one non-hydrogen-bonded
3

OH pointing towards the vapor and the other hydrogen-bonded OH pointing into the bulk. The
second donates two hydrogen bonds both of which point approximately towards the bulk. Both
computational approaches and VSF studies suggest that≈ 25% of OH groups at the interface point
towards the vapor and are not hydrogen-bonded. While the average structure of the air/water in-
terface has thus been considerably clarified, its structural dynamics are much less well understood.
Several questions are of interest: do the two types of water at the air/water interface rotate or
translate at different rates or by different mechanisms? Do either their rotation/translation rate or
mechanism differ from water in bulk? As noted above, it is difficult to answer these questions in
experiment, as the methods most often employed to study water structural dynamics in bulk cannot
straightforwardly be used to study the dynamics of water at the air/water interface. Such hurdles
do not exist in simulation, and there have been a variety of studies that describe rotation and trans-
lation of interfacial water using water models of varying complexity9,18–20. Far fewer studies have
focussed on the dynamics and mechanism of hydrogen-bond breaking and reformation and their
relationship to structural dynamics in this environment (our previous combined experimental and
computational study is an exception to this trend8).
Over the last few years the rotation of water in bulk and around small solutes on sub-picosecond
timescales has been shown, principally through computational studies by Hynes, Laage and cowork-
ers, to be non-diffusive: water in these environments rotates via infrequent large amplitude angular
jumps each of which accompanies the breaking of an existing hydrogen-bond and the formation of
a new one involving a new acceptor21,22. In several recent papers the same group has demonstrated
that water at idealized, solid hydrophobic and hydrophilic interfaces appears to also rotate non dif-
fusively and, with the notable exception of one class of OH groups at an idealized hydrophobic
interface, to be slowed relative to rotation in bulk23,24. Recently we and others published a com-
bined polarization resolved, IR pump - vibrational sum frequency probe, computational study of
the structural dynamics of free OH groups at the air/water interface8. In that study we demon-
strated that free OH groups at the air/water interface rotate ≈ 3x faster than bulk water and do
so diffusively8. That study is notable both because it is the first experimental quantification of
4

water rotational dynamics at extended interfaces that is both label-free and considers the nonlinear
optical response, and because the agreement between simulation and experiment obtained without
adjustable parameters lends confidence in our ability to rationalize the experimentally observed
structural dynamics in terms of hydrogen-bond breaking and reformation as well as structural evo-
lution apparent in the simulation.
In our previous study we focused solely on free OH groups because of limitations on probing
interfacial hydrogen-bonded OH groups in pure H2O arising from ultrafast non-radiative energy
transfer. Such limitations are absent from simulation, so here we report an in-depth computa-
tional study of the structure and dynamics of interfacial OH groups, and evaluate differences
between free and hydrogen-bonded ones. Two well-known classical water models (SPC/E and
TIP4P/200525–28) are used here, and lead to similar results. We find that hydrogen-bonded OH
groups at the air/water interface, in contrast to free OH groups, rotate at similar rates as OH groups
in bulk water and do so by a similar non-diffusive jump mechanism. Interestingly, this similar
reorientation rate to bulk water is the result of two competing effects that largely counteract each
other: large amplitude angular jumps (the breaking and formation of new hydrogen-bonds) are less
frequent than in bulk water (slowing rotation) while the rotation of intact hydrogen-bonds between
jumps is more rapid. Both effects can be understood by accounting for the reduced average density
of water near the air/water interface relative to bulk.
The remainder of this paper is organized as follows. In section 2 we describe the computational
methods employed. To understand the ultrafast structural and hydrogen-bond dynamics of OH
groups at the interface we require a quantitative interfacial definition. To build this foundation we
discuss in section 3 the time-averaged density profile and OH orientation at the air/water interface
as a function of water coordination. In section 4 we consider the rotational dynamics of interfacial
water, then discuss the hydrogen-bond dynamics of the hydrogen-bonded OH, and how they differ
from the free, and rationalize the observed changes in rotational and hydrogen-bond dynamics
through extension of the extended jump model previously described by Laage and Hynes21.
5
2. Methods
We performed all-atom molecular dynamics simulations, of SPC/E and TIP4P/2005 water slabs
and water in the bulk, using the molecular dynamics package NAMD25–29. The two water models
are both fixed charge, classical all atom descriptions but differ in the location of charge on the
water molecule. Studying both allows us to conclude, as shown in detail below, that our results are
essentially insensitive to this parameter at the simulated temperature (300 K). The package VMD
–Visual Molecular Dynamics – was used for trajectory visualization and analysis30. Electrostatic
interactions were calculated directly up to 15 Å and using the Particle Mesh Ewald method with
1 Å grid-spacing at larger separation. Van der Waals (VdW) interactions were smoothly switched
to zero between 13 and 15 Å, and long range corrections were not applied. The unusually large cut
off for VdW interactions was chosen because the long range contribution of these interactions is,
in general, necessary for better agreement of interfacial properties such as the surface tension with
experiment31–33. Such long VdW cut offs are required even for systems – such as the air/water in-
terface – where electrostatic interactions dominate34,35. A modified Verlet algorithm with multiple
time stepping was used for integration, with VdW forces calculated every 1 fs, electrostatic forces
every 2 fs and the remaining forces every 10 fs. The SHAKE algorithm was used to fix all bond
lengths. The initial water slabs containing 826 water molecules were created using the water box
plugin in VMD. Both TIP4P/2005 and SPC/E systems were equilibrated for 1 ns in the canonical
ensemble at 300 K. This procedure ensures the formation of a stable water slab, shown in Figure 1.
Production runs, one for each water model, were performed in the microcanonical ensemble for
0.4 ns, with configurations saved every 2 fs. Periodic boundary conditions were used. The average
temperatures during the production runs were TSPC/E = TT IP4P/2005 = 300±5 K. The total energy
drift was < 6×10⁻³%. Unless otherwise indicated, the statistical uncertainty of reported quantities
is given as the standard deviation estimated using block averages over ten time intervals36,37.
6

Figure 1: Geometry of the simulated water slab and coordinate system used during analysis. Thecenter of mass is at z=0. The box dimensions are 30×30×60 Å3.
3. Results: time-averaged properties
Interfacial density and thickness are similar for SPC/E and TIP4P/2005 water
and depend on VdW cut offs
The time-averaged density profile of the water slab measured from its center of mass (at z = 0;
see Figure 1 for the coordinate system used here) is shown in Figure 2 for both water mod-
els. The average density for the bulk region (defined as z < 8 Å) is ρSPC/E = 0.995± 0.008 and
ρT IP4P/2005 = 0.99±0.01 g/cm3. Within statistical uncertainty, both models reproduce the experi-
mental density38 ρ300K = 0.9965 g/cm3. The bulk densities obtained here also agree with reported
values for the SPC/E and TIP4P models, as well as for the polarizable model TIP4P-POL2 for
similar water slab geometries39. In contrast, neither the polarizable water model FLUC-q39 or
density-functional-theory–based ab initio MD employing the BLYP functional reproduce experi-
mental density9,10,20 (although the inclusion of a dispersion correction substantially improves the
AIMD/BLYP approach).
As shown in Figure 2, calculation with either water model produces nearly identical space- and
time-averaged density profiles that smoothly decrease from bulk to zero over approximately 5 Å.
A discussion of the origin of these profiles and the consequences of space- and time-averaging at
the interface is offered below. To compare our interfacial density profiles quantitatively to prior
7

Figure 2: Average density of SPC/E and TIP4P/2005 water at each position in water slab. Thestandard deviation of the density at each z is of order the thickness of the grey line. As indicatedin Figure 1, z = 0 corresponds to the center-of-mass of the water slab.
reports11,40, we fit the data to a hyperbolic tangent,
ρ = a(
1+ tanh(−z− zG
δ
))(1)
where zG indicates the position at which the interfacial density is half of the bulk (i.e. the Gibbs
dividing surface), a is approximately the average density of the liquid plus the vapor, and δ
captures the interfacial thickness. Fitting the data shown in Figure 2 using equation Eq. (1)
gives an interfacial thickness parameter that differs by 7% between models (δSPC/E = 1.49 Å
and δT IP4P/2005 = 1.39 Å) suggesting that differences in charge location between the two models
have a small but measurable impact on interfacial thickness. The influence of the water model on
the interfacial thickness parameter δ is not surprising, as prior work has shown this dependence:
values of δ ranging from 50% smaller to 20% larger than those found here have been reported10,39.
Interestingly, reported values39 of the interfacial thickness parameter δ for SPC/E water, from sim-
ulations at the same temperature and using systems of similar size, are≈4% larger than those found
in this work. This difference likely arises from shorter cut offs (12 Å, instead of 15 Å here) used
for Van der Waals interactions: preliminary simulations (not discussed here) performed by us using
12 Å cut offs also resulted in a 3% increase in δ . These results indicate that models using short Van
8

der Waals cut offs and parameterized to reproduce bulk properties must be carefully evaluated for
their suitability to reproduce the properties of liquid interfaces, particularly in the case of weakly
polar liquids where Van der Waals interactions may be the predominant non-bonded interaction.
Finally, we note that the relative insensitivity of the density profile to charge location on the water
molecule agrees with a prior work demonstrating the relative insensitivity of the surface potential
of the air/water interface to charge mobility (polarizability)41.
The interfacial water population can be identified from time- and space-averaged
density and hydrogen-bond profiles
By definition, interfacial water molecules have fewer neighbors than those in bulk, so one would
expect they form fewer hydrogen-bonds than in the bulk. We quantify this reduction by calculating
the fraction of OH groups that do not donate a hydrogen-bond (i.e. free OH groups) f f OH at each
position in the water slab:
f f OH(z) =〈n f OH(z)〉〈nOH(z)〉
(2)
The average number of free 〈n f OH(z)〉 and total 〈nOH(z)〉 OH groups at each position are calcu-
lated over all saved configurations (200 000). f f OH = 0 when all OH groups at a given position
donate a hydrogen-bond, and one when none do. As might be expected, f f OH depends strongly on
hydrogen-bond criteria. To overcome this inherent ambiguity we here use three criteria, ranging
from strict to loose. Hydrogen bonds are present if the O· · ·O distance is less than and the mini-
mum O-H· · ·O angle is greater than HB1=(3.1 Å,160◦), HB2=(3.5 Å,140◦) or HB3=(4.0 Å,130◦).
HB1 is the strictest criteria, identifying only strong hydrogen-bonds whereas HB3 is the loosest,
capturing also very weakly hydrogen-bonded states.
The dependence of f f OH(z) on hydrogen-bond criteria is illustrated in Figure 3 for an SPC/E
water slab. As expected, the strictest hydrogen-bond criteria (HB1) leads to a much higher fraction
of free OH groups in the bulk and lower differences between the fraction of free OH groups in
the bulk and at the interface than the looser HB2 and HB3 criteria. Despite the large differences
9

in the f f OH(z) for the three hydrogen-bond criteria, all show the same expected trend: f f OH is
significantly higher at the interface than in the bulk presumably because the interface limits the
number of neighbors within hydrogen-bonding distance. A comparison of f f OH for the SPC/E and
TIP4P/2005 models using the HB2 criteria is also shown in Figure 3. Similar to interfacial density,
f f OH is also apparently insensitive to position of charge on fixed charge water models.
Figure 3: Fraction f f OH(z) of free OH groups at each position in the water slab (0 is the center)for SPC/E water, for three hydrogen-bond criteria. For comparison, the fraction of free OH groupsfor TIP4P/2005 water and the HB2 criteria is also shown. The error bars indicate the standarddeviation.
The density and hydrogen-bond profiles presented in Figure 2 and Figure 3 are used to define
the interfacial and bulk regions. Bulk water is defined as the region where z < 8 Å for both
water models, a sufficiently strict criterium to avoid interfacial effects because static and dynamic
properties remain at their bulk values up to z ≈ 10 Å. Similar to the bulk, the interface is also
defined as a 3D slab, but the lower z cutoff delimiting the interfacial region is obtained by imposing
the condition that the fraction of free OH groups (HB2 criteria) is at least 10% larger than the bulk.
These interface criteria were chosen because they yield good agreement between structural and
dynamic properties of interfacial water from simulation and from SFG experiments, as discussed in
more detail below and in a previous publication8. We note, however, that properties of interfacial
water discussed in this paper are not sensitive to small changes in the interface definition (e.g.
increasing the z cutoff for the interface by +1 Å, making the 3D interfacial slab 1 Å thinner,
10

decreases the interfacial mass by 30%, but changes the average angle of the interfacial free OH
groups with the surface normal by only 4%).
These criteria lead to slightly different interface boundaries for the SPC/E and the TIP4P/2005
water models: for SPC/E the interface is the region with z > 10.51 Å; for TIP4P/2005, it is z >
10.32 Å. For both models the interfacial thickness is thus approximately 5 Å. The residence time of
waters at the interface is ≈ 10 ps for both models (see Supporting Information). As the structural
and hydrogen-bond dynamics of interest are 5-10 times faster, we do not add an additional lifetime
criterion to our definition of interfacial water.
Since our eventual interest lies in connecting our results with experiment, we must verify that
our interface definition identifies the same population of water molecules investigated by surface-
specific spectroscopic techniques such as VSF or second harmonic generation (SHG) spectroscopy.
Much prior work at the pure water/air interface has shown that these techniques probe the top two
water layers42–47. These layers are not visible in the density profiles shown in Figure 2 because of
spatial and temporal averaging over surface capillary waves induced by thermal fluctuations11,48,49.
Several methods now exist to filter out the effect of capillary waves11,40,50–52, enabling the calcu-
lation of the intrinsic surface density profiles, i.e., the surface density as a function of the distance
to the top-most water layer. These profiles show two distinct water layers (before reaching bulk
densities) 52, consistent with results from VSF or SHG spectroscopy. The two top-most interfacial
water layers have a thickness of approximately 5 Å. As the time- and space-averaged criteria used
in our work lead to the same interfacial thickness it seems likely that the population of interfacial
water we examine is the same as that probed in either VSF or SHG experiments.
f f OH has been found experimentally, using time averaged VSF spectroscopy, to be ≈ 0.213,53.
While detailed comparison of our computed results to the VSF work is challenging – likely re-
quiring direct calculation of the VSF spectral response and charge rearrangement54 – less strict
comparisons are possible. From the three hydrogen-bond criteria used in this study, HB2 leads to
the best agreement with experiment: we find that 21% (TIP4P/2005) to 24% (SPC/E) of interfacial
OH groups are free. In our more recent work exploring the dynamics of OH groups in their free
11

state at the air/water interface we also found that HB2 allowed for better replication of other ex-
perimental observables8. In the analysis that follows, then, we mostly use the HB2 criteria; when
appropriate we use the other two criteria as well, to facilitate comparison with prior work.
Acceptor-only water molecules at the interface are not abundant
Free OH groups may belong to water molecules where one or both OHs are free. We assess
the magnitude of these two water subpopulations by calculating the fraction of water molecules
with one or two free OH at each position in the water slab. The results using the HB2 criteria,
shown in the Supporting Information, indicate that water molecules with two free OH groups
predominate only in the outer regions of the interface (z > 17 Å). As these regions have extremely
low density, waters with two free OH are not a significant interfacial population. These results are
in quantitative agreement with prior studies using ab initio MD10 and other classical models39.
Both x-ray absorption spectroscopy55 of water microjets and time-averaged VSF spectroscopy of
the air/water interface16 have similarly found that double free OH water molecules do not occur
in significant numbers at the air/water interface. These results are consistent with the findings of
Chandler, Varilly et al.56 which indicate that water molecules evaporate by a rare event in which
one water molecule sticks out of the interface and breaks the final hydrogen-bond.
Interfacial free OH groups preferentially point out of the interface and bonded
ones lie flat
The interface necessarily imposes a preferential orientation of free and hydrogen-bonded OH
groups in the normal direction (OZ; see Figure 1). We characterize this preferential orientation
by computing the probability density, Py(θ), of finding free or bonded OH groups at an angle θ
with the surface normal (see Figure 1 for spherical coordinate system used here):
Py(θ) =
⟨nyOH(θ)
⟩⟨nyOH
⟩δθ
(3)
12

In this expression⟨nyOH(θ)
⟩is the average number of free (y = f ) or bonded (y = b) OH groups
in a given region (interface or bulk) with angle θ relative to the surface normal,⟨nyOH
⟩is the
average total number of free or bonded OH groups in that region and δθ the bin width used in the
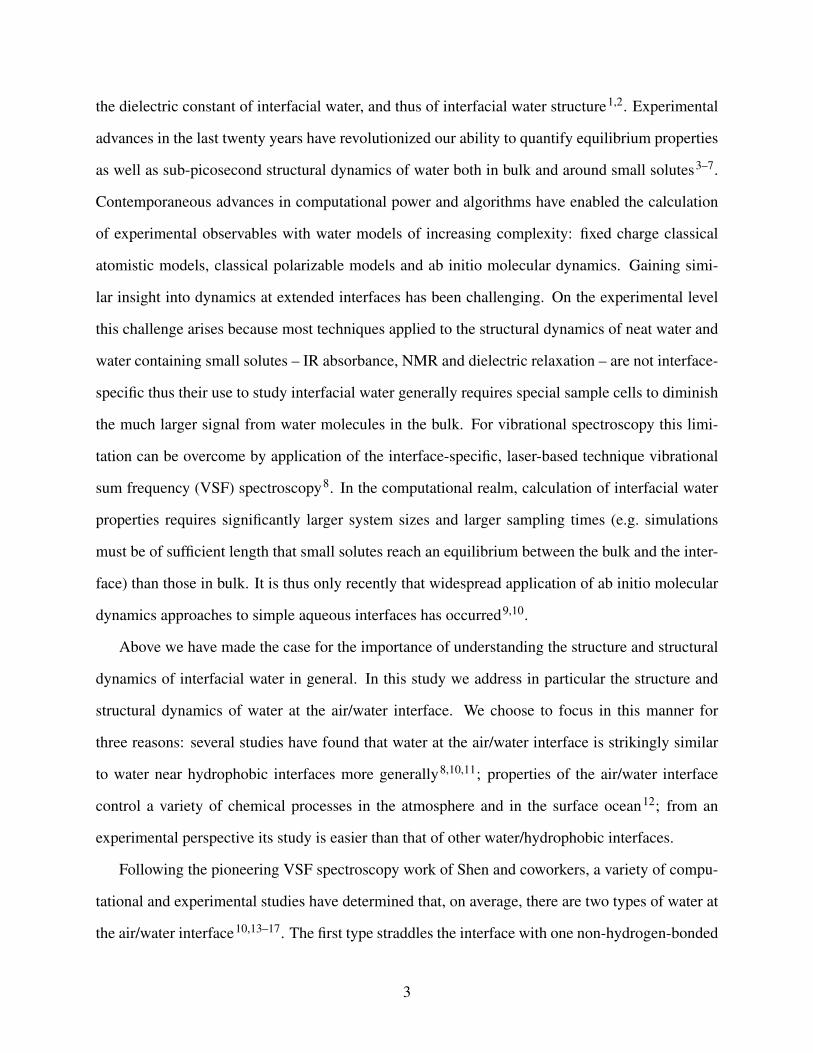
histogram. This probability density is shown in Figure 4(a); the corresponding effective potential
(i.e. free energy landscape)57 Vy(θ) = −kBT ln(Py(θ)/sin(θ)) (shifted so that the minimum for
each curve is zero) is shown in Figure 4(b). These figures indicate that both free and bonded OH
groups at the interface have broad and non–sine-function orientation distributions, with free OH
groups preferentially pointing out of the water slab and hydrogen-bonded OHs preferentially lying
on the interface, in qualitative agreement with early SHG experiments58. The orientation distribu-
tions are almost identical for the two water models: the mode and standard deviation of the distri-
bution of hydrogen-bonded OH groups (HB2 criteria) are θ = 94◦±40◦ (SPC/E) or θ = 93◦±39◦
(TIP4P/2005) (in each case with a significant skewness towards θ > 90◦); the same quantities for
the distribution of free OH groups are θ = 56◦±41◦ (SPC/E) or θ = 57◦±40◦ (TIP4P/2005). Re-
cent AIMD simulations show similar Pf (θ) distributions for the interfacial free OH groups, with
an average θ = 56◦ 10. This agreement is likely coincidental because a different hydrogen-bond
criteria was used in that work and, as shown in the Supporting Information, the shape and max-
imum of the Pf (θ) curves for the free OH groups depend on this parameter. In contrast to the
free OH, the interfacial hydrogen-bonded OH orientation is independent of hydrogen-bond criteria
(see Supporting Information for details). The maximum and width of the orientation distributions
for the interfacial free OH groups quantitatively agree with results from time-resolved VSF exper-
iments8, further confirming that the interface definition used here identifies the same interfacial
population of water molecules as probed in those experiments.
Orientation of interfacial free and bonded OH groups depends on interfacial
position
Prior time-averaged VSF spectroscopy studies of the air/water interface have concluded that the
orientational distribution of the free OH can be well described by a Gaussian distribution centered
13
(a) (b)
Figure 4: (a) Probability density P(θ) and (b) corresponding effective potential V (θ) of interfacialfree or hydrogen-bonded OH groups (HB2 criteria) for SPC/E and TIP4P/2005 water. The statis-tical uncertainty is only shown for the SPC/E model for clarity but is similar for the TIP4P/2005.
at ≈ 30◦ with a relatively narrow width (σ = 15◦)16. Clearly these numbers disagree with the free
OH distribution shown in Figure 4(a); these numbers are also inconsistent with recent results from
time-resolved VSF8 which, as mentioned above, agree well with our simulations. To investigate
the origin of this disagreement we ask if the orientation of all OH groups (free or hydrogen-bonded)
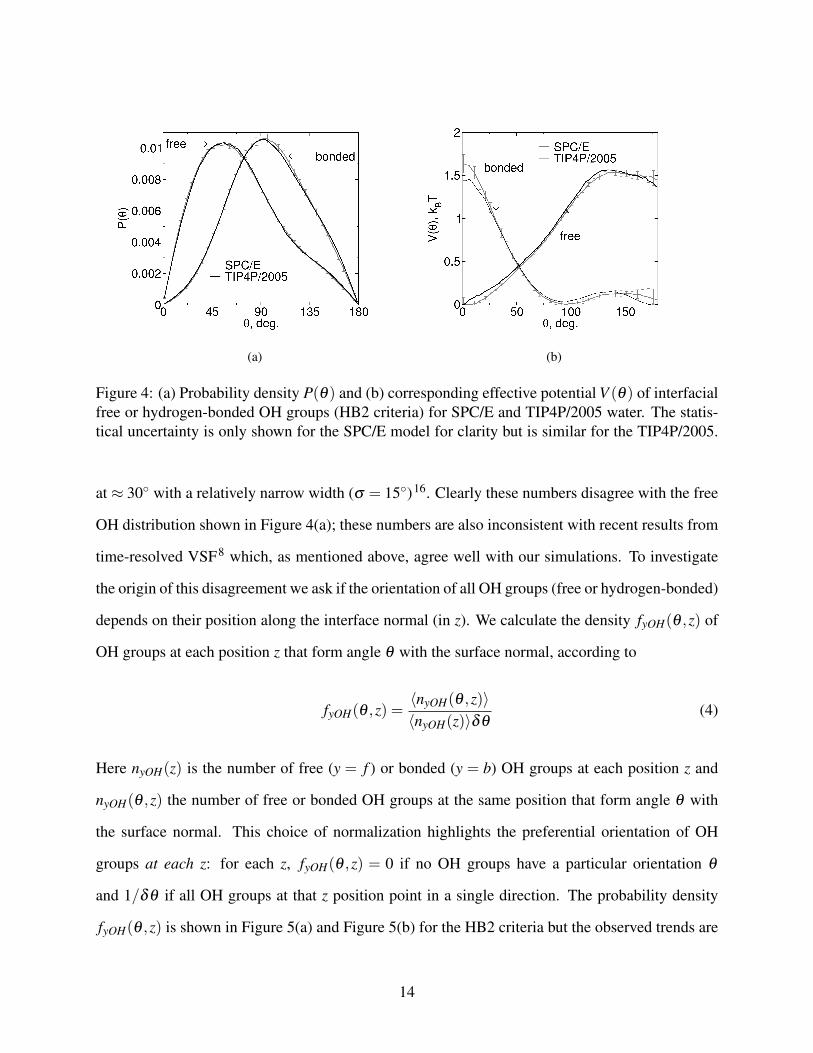
depends on their position along the interface normal (in z). We calculate the density fyOH(θ ,z) of
OH groups at each position z that form angle θ with the surface normal, according to
fyOH(θ ,z) =〈nyOH(θ ,z)〉〈nyOH(z)〉δθ
(4)
Here nyOH(z) is the number of free (y = f ) or bonded (y = b) OH groups at each position z and
nyOH(θ ,z) the number of free or bonded OH groups at the same position that form angle θ with
the surface normal. This choice of normalization highlights the preferential orientation of OH
groups at each z: for each z, fyOH(θ ,z) = 0 if no OH groups have a particular orientation θ
and 1/δθ if all OH groups at that z position point in a single direction. The probability density
fyOH(θ ,z) is shown in Figure 5(a) and Figure 5(b) for the HB2 criteria but the observed trends are
14

robust to changes of hydrogen-bond definition. Inspection of these figures indicates that moving
from bulk towards the interface (increasing z) changes the orientation distribution of OH groups
from broad and isotropic (i.e. a population centered at 90◦ in this spherical coordinate system) to
two narrower distributions, centered at higher values of θ for the bonded OH groups and at low
values for the free OH groups. For example, the mean and standard deviation of θ in the bulk are
90◦±46◦, but the same quantities in an outer interfacial 3D region with upper and lower boundaries
z = 16± 0.125 Å are 122◦± 24◦ for the hydrogen-bonded SPC/E OH groups and 37◦± 22◦ for
the free OH groups. The change in θ of both populations as a function of position in the interface
(z > 10.32 Å for SPC/E water) is in agreement with early computational studies of the air/water
interface18. Similar changes of orientation as a function of position were also observed in recent
studies of water near an extended hydrophobic interface59, as discussed in detail in the Supporting
Information, confirming the (expected) similarity between the air/water and hydrophobic/water
interfaces.
The peak and width of the orientation of the free OH groups from time-averaged VSF (30◦±
15◦) clearly agree much better with those values for the outer free OH groups (37◦±22◦, as shown
above for z= 16 Å) than for the full interfacial free OH population (for SPC/E water, θ = 56◦±41◦
for z > 10.32 Å as discussed above). This suggests that time-averaged VSF studies probe only
the outer OH groups instead of the two outer water layers. Since the timescales over which the
free OH average orientation changes are of order the vibrational dephasing time, time-averaged
VSF measurements preferentially sample longer-lived groups8. We have previously reported that
longer-lived free OH groups have smaller average values of θ and a narrower orientational dis-
tribution (see also the Supporting information); Figure 5(a) shows that OH groups with smaller
average values of θ are in fact closer to the vapor phase. In contrast, time-resolved VSF studies
that sacrifice spectral resolution for greater signal size do not bias towards long-lived interfacial
free OH groups8. The observed agreement between the peak and width of the free OH distributions
shown in Figure 4(a) and results from time-resolved VSF experiments, and between the peak and
width of the distributions of the top-most water molecules and results from time-averaged VSF
15
experiments, indicates that different techniques probe different interfacial water populations.
Movement of free and bonded interfacial OH groups occurs in an effective
potential
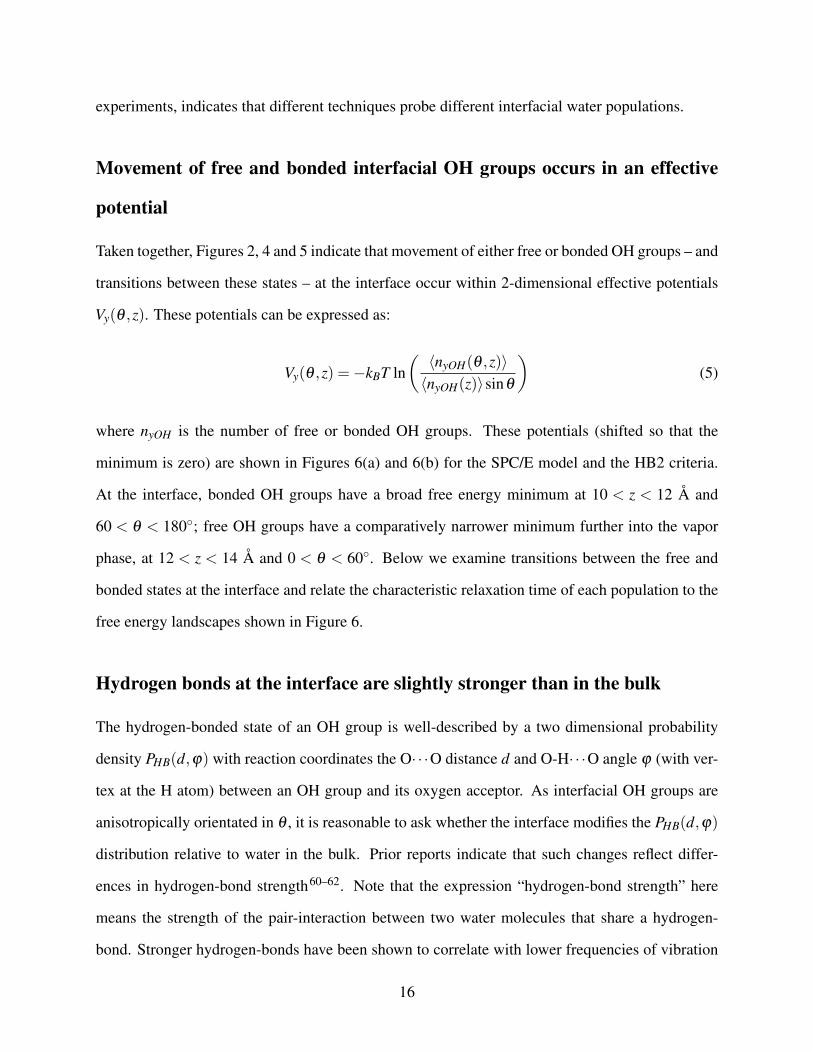
Taken together, Figures 2, 4 and 5 indicate that movement of either free or bonded OH groups – and
transitions between these states – at the interface occur within 2-dimensional effective potentials
Vy(θ ,z). These potentials can be expressed as:
Vy(θ ,z) =−kBT ln(〈nyOH(θ ,z)〉〈nyOH(z)〉sinθ
)(5)
where nyOH is the number of free or bonded OH groups. These potentials (shifted so that the
minimum is zero) are shown in Figures 6(a) and 6(b) for the SPC/E model and the HB2 criteria.
At the interface, bonded OH groups have a broad free energy minimum at 10 < z < 12 Å and
60 < θ < 180◦; free OH groups have a comparatively narrower minimum further into the vapor
phase, at 12 < z < 14 Å and 0 < θ < 60◦. Below we examine transitions between the free and
bonded states at the interface and relate the characteristic relaxation time of each population to the
free energy landscapes shown in Figure 6.
Hydrogen bonds at the interface are slightly stronger than in the bulk
The hydrogen-bonded state of an OH group is well-described by a two dimensional probability
density PHB(d,ϕ) with reaction coordinates the O· · ·O distance d and O-H· · ·O angle ϕ (with ver-
tex at the H atom) between an OH group and its oxygen acceptor. As interfacial OH groups are
anisotropically orientated in θ , it is reasonable to ask whether the interface modifies the PHB(d,ϕ)
distribution relative to water in the bulk. Prior reports indicate that such changes reflect differ-
ences in hydrogen-bond strength60–62. Note that the expression “hydrogen-bond strength” here
means the strength of the pair-interaction between two water molecules that share a hydrogen-
bond. Stronger hydrogen-bonds have been shown to correlate with lower frequencies of vibration
16

(a) (b)
Figure 5: Probability density of (a) free ( f f OH(θ ,z)) and (b) bonded ( fbOH(θ ,z)) SPC/E OH groupsat position z in the water slab which form angle θ with the surface normal. fyOH(θ ,z) is normalizedby the number of free or bonded OH groups at each z, so the lower water density at the interface isnot apparent in these plots. The HB2 criteria was used in both cases.
(a) (b)
Figure 6: Effective potentials Vy(θ ,z)/(kBT ) for (a) free and (b) bonded OH groups. Note thatVy(θ ,z) is normalized by the total number of OH groups in each histogram, so these plots accountfor the lower water density at the interface. The HB2 criteria was used in both cases.
of the O-H bond and with slower rotational dynamics of water for timescales up to 1 ps, but have
no impact on the frequency of hydrogen-bond exchange (i.e. the hydrogen-bond lifetime) or on the
rotational dynamics of water at longer time-scales61.
We compute 2-dimensional (d,ϕ) histograms separately for water pairs in which the central
water molecule is either at the interface or in the bulk, using as distance and angle cut offs the
17

loosest HB criteria (HB3). Employing the loosest H-bond criteria for this purpose suggests that we
will see the largest possible difference between the bulk and interfacial hydrogen-bonded states:
as more weak hydrogen-bonds will be included in the comparison, any differences in the proba-
bility distribution PHB(d,ϕ) due to the population of weak hydrogen-bonds will be detected. The
PHB(d,ϕ) histograms are shown in the Supporting information. We determine the mean µ and the
standard deviation σ of d and ϕ by fitting a bivariate Gaussian distribution to the histograms as
described in the Supporting Information. We find that the mean distance and angle associated with
a hydrogen-bond, shown in Table 1, are similar at the interface and in the bulk for both water mod-
els: µd is less than 0.5% larger and µϕ 0.3% smaller at the interface than in the bulk. As discussed
in further detail in the Supporting Information, these results qualitatively agree with reported ex-
periments and ab initio MD simulations10,39,55,60,63. The lower mean ϕ at the interface observed
here indicates that hydrogen-bonds become more bent, an effect which contributes to weaker in-
terfacial hydrogen-bonds than in the bulk62. In contrast, the larger mean O· · ·O distance for water
at the interface strengthens interfacial hydrogen-bonds relative to bulk ones. This strengthening
occurs because µd at the interface is closer to the O· · ·O distance at the global energy minimum for
a water dimer62 than µd in the bulk. These differences in mean O· · ·O distance and O-H· · ·O an-
gle between bulk and interface have opposing contributions to hydrogen-bond strength, suggesting
that hydrogen-bonds at the interface should have similar strength as in the bulk. Indeed, prior work
by Jedlovszky confirms that interfacial hydrogen-bonds are only slightly stronger than hydrogen-
bonds in bulk, with the interaction energy between SPC/E water molecules at the air/water inter-
face and their hydrogen-bonded neighbors being approximately 10% more negative than in the
bulk60. As mentioned above, prior work by Laage and Hynes has shown that such a small change
in hydrogen-bond strength will not have noticeable effects on the reorientation dynamics of OH
groups61. We conclude that changes in hydrogen-bond strength are not behind the differences be-
tween water at the interface and in the bulk described below either with respect to reorientation
dynamics or frequency of hydrogen-bond exchange.
18

Table 1: Mean and standard deviation of the distance d and angle ϕ , shown as (µd ±σd,µϕ ± σϕ), that characterize the hydrogen-bonded state of an OH group of the SPC/Eand TIP4P/2005 water models.
location SPC/E TIP4P/2005interface (2.792±0.146,162.6±11.2) (2.823±0.143,162.9±11.0)
bulk (2.782±0.142,163.1±10.9) (2.808±0.137,163.4±10.7)
4. Results: reorientational dynamics
Overall reorientational dynamics of OH at the interface is slightly faster than
in the bulk
We characterize the rotational motion of OH groups using a second order rotational autocorrelation
function of the form
P2(τ) = 〈12(3cos2(~u0 ·~uτ)−1
)〉 (6)
where ~u is the unit vector characterizing the orientation of an OH group (with respect to the coor-
dinate frame given in Figure 1) and the average is over all time origins. The function’s maximum,
1, occurs with perfect orientation correlation; its minimum of −0.5 is reached if all OH groups are
orthogonal to their initial orientation; P2 = 0 in the limit of perfect (i.e. isotropic, 3D) decorrela-
tion.64
The reorientation dynamics of OH groups in the bulk and at the interface, as measured by P2,
are shown in Figure 7. The curves include only those OH groups that are at the same location
(interface or bulk) at both t = 0 and t = τ . Inspection of Figure 7 shows several qualitative features
of the dynamics: all curves have an initial non-exponential decay (τ < 0.2 ps; see inset of Figure 7)
followed by a quasi-exponential one. The short-time decay comprises two parts, a very fast decay
(τ < 100 fs) followed by underdamping (100 < τ < 200 fs). These qualitative characteristics of
water dynamics have been previously described in bulk water and (through sampling of a dipole
moment orientational correlation function) at the air/water interface, and appear to be insensitive
to water model39. Over all, reorientational relaxation is slightly faster at the interface than in the
bulk for both models. This conclusion agrees with prior studies, employing a variety of classical
19

Figure 7: Reorientation dynamics of OH groups at the interface or in the bulk for SPC/E andTIP4P/2005 water, as measured by P2(τ). The standard deviation of P2(τ) is of order the thicknessof the lines. The corresponding decay times are given in Table 2. The inset shows the ln(P2)between 0 and 2 ps.
fixed charge (including SPC/E), classical polarizable and AIMD water models that have also found
water at the air/water interface experiences faster reorientational relaxation than water in bulk10,39.
Finally, it is clear that SPC/E water undergoes faster dynamics than TIP4P/2005.
To gain additional insight, we fit the curves in Figure 7 with a biexponential of the form
P2(τ) = aexp(−t/b) + cexp(−t/τr) where b is a fast decay time and τr is the long-time char-
acteristic reorientation decay time. Even though the short-time decay is clearly non-exponential
as shown in the inset of Figure 7, because the non-exponential region is narrow, the biexponential
function results in a good overall fit of the data. The short decay times vary between 0.2 and 0.4 ps,
depending on the water model or position in the water slab, and reflect the expected short-time li-
brational motion of the OH groups. In this work we focus on the long-time reorientation of OH
groups, characterized by the reorientation times given in Table 2. The SPC/E water model leads
Table 2: Reorientation decay times τr (ps) for the two water models, for OH groups either atthe interface or in the bulk. The uncertainty of τr is ±0.01 ps (asymptotic standard error ofthe fit).
location SPC/E TIP4P/2005interface 2.31 2.91
bulk 2.63 3.25
20
to a reorientation time for water in the bulk that compares very well with that for the OD bond in
HOD/H2O obtained from polarization resolved infrared transient absorption, NMR and dielectric
relaxation spectroscopies at 300 K (τr,exp = 2.0−2.5 ps); in contrast, the TIP4P/2005 water model
has somewhat slower reorientation dynamics than indicated by experiment4,67,68. In both models,
and in agreement with most earlier studies, reorientation at the interface is slightly faster than in the
bulk: the interfacial orientational relaxation times are slightly smaller (SPC/E: 12%; TIP4P/2005:
10%) than those in bulk (see Table 2). We note that the decrease in reorientation relaxation times
at the interface relative to the bulk observed here apparently conflicts with the 3-fold decrease
reported for the dipole reorientation times from AIMD simulations10. However, because of the
relatively small system sizes possible in current AIMD simulations, the statistical uncertainty as-
sociated with determining the characteristic time of the dipole orientation autocorrelation function
in that work is large. In the absence of further AIMD simulations it is difficult to conclude whether
these differences are due to differences in the underlying physical representation of water.
We emphasize that even for τ > 0.5 ps the reorientation decay is only quasi-exponential. This
result is consistent with different subpopulations of OH groups reorienting through different mech-
anisms. Such dynamic heterogeneity is expected, both at the interface and in the bulk: in the
bulk, the reorientation of hydrogen-bonded OH groups is known to be well-described by two pro-
cesses21,69 (discussed in more detail below); at the interface, free OH groups experience a dramat-
ically different energy landscape than hydrogen-bonded ones so it it perhaps reasonable that their
dynamics differ from hydrogen-bonded OH groups as well. The origin of dynamic heterogeneity
for water at the interface is discussed in much more detail in the remainder of the paper.
Population of free OH groups is abundant and long-lived only at the interface
To understand the origin of dynamic heterogeneity, it is useful to compare the reorientation mecha-
nism(s) at the interface to bulk: we would like to understand what changes at the interface to cause
changes in water dynamics. Before doing so we briefly wish to clarify what we mean when we
write “the mechanism of water reorientation in the bulk”. The potential problem here is that, as is
21

apparent in the results plotted in Figure 3, both hydrogen-bonded and free OH groups exist in bulk
(although the relative amounts depend on the hydrogen-bond definition). The population of free
OH groups in bulk water has two important characteristics: it is small (as shown above) and it has
much shorter lifetimes than the hydrogen-bonded OH groups (as shown in Table 3 for the SPC/E
water model; see Supporting Information for details of the calculation). It is therefore not surpris-
ing that the reorientational dynamics of bulk OH groups in this environment can be rationalized in
terms of hydrogen-bonded OH groups only21,69. In contrast, at the air/water interface the popu-
lation of free OH groups is significantly larger and these groups have on average longer lifetimes
(Table 3) so, as expected, understanding the loss of orientational correlation of OH groups at the
interface requires that both free and bonded interfacial OH subpopulations are considered.
Table 3: Lifetimes (ps) of free or bonded (HB2 criteria) OH groups for the SPC/E watermodel. The statistical uncertainty of the reported lifetimes is 0.02 ps (asymptotic standarderror of the fit).
free bondedinterface 1.09 3.94
bulk 0.29 4.17
Hydrogen-bond exchange at the air/water interface
The mechanism of hydrogen-bond exchange is identical at the interface or in the bulk
For water in the bulk, Hynes and co-workers have shown21,69 that the loss of orientational corre-
lation is almost entirely due to two processes: large amplitude jumps between stable hydrogen-
bonded states (i.e. hydrogen-bond exchange) and diffusive reorientation of the bonded OH groups
in-between jumps (i.e. the reorientation of the O-H· · ·O system as a whole, called the frame re-
orientation). In what follows we look at these processes for bulk and interfacial hydrogen-bonded
OH groups and evaluate their contribution to the loss of orientation correlation as measured by P2
(Figure 7).
In the bulk, the mechanism of hydrogen-bond exchange involves a simultaneous increase of the
distance between the oxygen donor and the initial (here called “old”) oxygen acceptor (Od · · ·Oo),
22

a decrease in the distance between Od and the new oxygen acceptor (Od · · ·On), and a rapid angular
jump described by angle ϑ (see Supporting Information for a cartoon representation of the process)
during which the rotating OH group breaks its hydrogen-bond with Oo and establishes a new
one with On. We assess how hydrogen-bond exchange at the interface differs from the bulk by
comparing the sequence of events involved in this process (the change in the Od · · ·Oo and Od · · ·On
distances and in angle ϑ ) for hydrogen-bond exchange in both locations. We do so using the
Stable States Picture of reactions70, following Hynes and co-workers21,71: we analyze only jumps
between stable hydrogen-bonded states (defined as those that meet the stringent HB1 criteria)
to avoid recrossing of the free energy barrier between states. We find that the mechanism of
hydrogen-bond exchange is identical at the interface and in the bulk. This is illustrated in the
Supporting Information, where the average and non-averaged trajectories in the angle ϑ and the
distances Od · · ·Oo and Od · · ·On for hydrogen-bond exchange in SPC/E water are shown. Very
similar curves – not shown – are obtained for the TIP4P/2005 model. Clearly, hydrogen-bonded
interfacial OH groups undergo an angular jump during hydrogen-bond exchange that is identical
in every way to that described by OH groups in bulk.
Frequency of hydrogen-bond exchange is slower but O-H· · ·O frame reorientation is faster
at the interface than in the bulk
We show in the Supporting Information that hydrogen-bonded OH groups at the air/water interface
experience an essentially identical large amplitude angular jump as hydrogen-bonded OH groups
in bulk. We now address the question of whether jump frequency or the frame rotation rate changes
between the two environments and whether, if these processes are accounted for properly, they are
responsible for the slightly faster OH reorientation at the interface shown in Figure 7. Hynes and
coworkers21,69 have previously demonstrated that the P2 for water in bulk and around small solutes
can be modeled through application of the Ivanov jump model72 and by assuming that OH rotation
23

between jump events occurs diffusively. The resulting equation is73
1τr
=1
τex
[1− 1
5sin(5∆ϑ
2
)sin(
∆ϑ
2
) ]+ 1τ f
(7)
To actually solve equation Eq. (7) we require ∆ϑ (64◦; see Supporting Information), τex and τ f
from simulation.
Obtaining the frame decay time: In practice τ f is estimated by calculating P2(τ) for the sub-
population of OH groups that at time τ are in the same region (interface or bulk) and donate a
hydrogen-bond (HB1 criteria) to the same acceptor oxygen as at t = 0. Similarly to what was ob-
served for the full reorientation decay shown in Figure 7, the frame reorientation (shown in the Sup-
porting Information) shows a short-time, non-exponential decay followed by a quasi-exponential
regime; the full curve is well-approximated by a biexponential function. As the uncertainty of the
frame decay increases considerably for larger times, the weight of each datapoint in the fit is given
by its associated uncertainty. We find that the short decay times are < 0.5 ps, and are associated
with fast oscillations of the OH groups; the diffusive reorientation of the frame is described by the
longer decay time, τ f . Inspection of the resulting frame decay times (see Table 4) clarifies that
frame reorientation is approximately 20% faster at the interface than in the bulk. The faster frame
reorientation at the interface likely arises from the faster translational dynamics (see Supporting
Information) observed in that region; faster translation facilitates rotational diffusion of O-H· · ·O
as a whole.
Table 4: Frame decay times τ f and hydrogen-bond exchange time τex (ps) for the two watermodels, for OH groups that at t=0 are either at the interface or in the bulk. The uncertaintyof τ f is ±0.04 ps and of τex is ±0.002 ps (asymptotic standard error of the fit).
location SPC/E TIP4P/2005
τ finterface 4.53 5.70
bulk 5.75 7.17
τexinterface 3.779 4.572
bulk 3.163 3.681
Obtaining the time between jumps: We define the characteristic time between jumps τex
24

(also called the jump time) from the cross-correlation function C(τ)
C(τ) = 〈nR(0)nP(τ)〉 (8)
By definition, nR(0) = 1 if a particular OH group donates a stable hydrogen-bond (HB1 criteria)
and belongs either to the interface or the bulk at time zero; nR(0) = 0 otherwise. nP(τ) = 1 from the
instant τ in which the same OH group establishes a different, stable, hydrogen-bond (i.e. absorbing
boundary conditions are used in the product); nP(τ) is zero otherwise. Explicitly requiring that the
product state remains in the same region (interface or bulk) at t = t that it belonged to at t = 0
is not necessary because, since the residence times in the interface or the bulk are larger than the
characteristic time between jumps, that condition is already met. The average is over all non-zero
nR(0). C(τ) has its minimum value of zero at τ = 0 (all original reactant states are still present)
and has a maximum of one at long times, when all original hydrogen-bonds have exchanged. The
jump time τex is the characteristic decay time of C(τ) = 1−exp(−t/τex). Similar to the full and the
frame reorientation decay, this function also shows non-exponential decay at short times followed
by quasi-exponential decay at long times, so we again fit it with a biexponential and take the longer
decay time of the two as τex. The time between jumps for SPC/E water at the interface or in the
bulk extracted from the fits is given in Table 4. Even though the jump mechanism is identical for
water at the interface or in the bulk, jumps at the interface are less frequent than in the bulk by a
factor of τex,int/τex,bulk = 1.2.
Slowdown of hydrogen-bond exchange at the interface is a transition state excluded volume
effect
An increase in the time between jumps was previously observed for water of hydration near small
hydrophobic71 or amphiphilic23,74 solutes and also near larger idealized hydrophobic surfaces59.
Interestingly, the retardation factor for hydrogen-bonded OH groups at the air/water interface is
closer to that observed for water near small hydrophobic solutes (1.2) than for water near extended
25

hydrophobic interfaces (1.8).21,59 In those cases, it was possible to understand the origin of the
slowdown by applying the Transition State Theory formalism to the hydrogen exchange process.
During hydrogen-bond exchange, the system goes from a reactant state (the original hydrogen-
bond) to a product state (a different, stable, hydrogen-bond) via a transition state. For hydrogen-
bond exchange the transition state is the configuration, denoted by †, where Od · · ·Oo =Od · · ·On =
R† and the rotating OH group is half-way between Oo and On (ϑ = 0). For water near solutes, it
was shown that retardation resulted from a decrease in the number of available transition state
configurations as illustrated in Figure 8(a), and the retardation factor could be accurately predicted
from the fraction of excluded transition state configurations, f : τex./τex.,bulk = 1/(1− f ).59,71
An analogous reduction in the available transition state configurations must also occur for ro-
tating waters at the air/water interface due to the termination of the water layer, but our results
indicate that the theoretical retardation factor of 2 associated with a sharp, flat, interface (for which
the excluded volume fraction is 0.5) greatly overestimates the actual value of 1.2. The smaller re-
tardation factor at the air/water interface suggests that the interface’s finite thickness and its lower,
but non-zero, time-averaged density relative to the bulk – depicted in cartoon form in Figure 8(b) –
play a role in the observed rotational slowdown. We thus calculate a theoretical retardation factor
accounting for these interfacial characteristics. For a single OH group that undergoes hydrogen-
bond exchange and is at position z in the interface, the fraction of available transition state con-
figurations f (z) = 1− f (z) (where f is the fractional excluded transition state volume and is also
a function of z) relative to the bulk is calculated as the average density of water on the ring of
possible transition state configurations (here sampled over 180 evenly spaced points on the ring)
and normalized by the bulk water density:
f (z) =∫ 2π
0 ρ(z+R† sin(∆ϑ)cos(ψ))dψ
2πρbulk(9)
The density at each position on the ring, ρ(zring) = ρ(z+ R† sin(∆ϑ)cos(ψ)) (ψ is defined in
Figure 8(b)) is obtained from Eq. (1). Note that this definition of the fraction of available transition
26

state configurations becomes equivalent to that proposed by Hynes and co-workers for the case
of sharp interfaces because under those conditions ρ(zring) is either zero or ρbulk. The average
fraction⟨
f⟩= 1−〈 f 〉 of available transition state configurations at the interface is then the average
of the fraction of available transition state configurations at different heights in the interface, f (z),
weighted by the density at height z:
⟨f⟩=
∫ z fzi
f (z)ρ(z)dz∫ z fzi
ρ(z)dz(10)
where zi is the lower interface boundary (TIP4P/2005 = 10.32 Å; SPC/E = 10.51 Å) and z j = 20 Å
is the upper one. Using Eqs. (9) and (10) we find an average excluded volume⟨
fSPC/E⟩= 0.285
and⟨
fT IP4P/2005⟩= 0.258 which results in a retardation factor 1/
⟨f⟩= 1.40 for the SPC/E model
and 1/⟨
f⟩= 1.34 for TIP4P/2005. The calculated retardation factors agree well with those taken
directly from the characteristic times between jumps (1.2 for both water models, as described
above). The quality of the agreement indicates that the excluded volume model – proposed initially
by Laage and Hynes71 to explain the slowdown of rotation of water near hydrophobic interfaces –
still holds for the case where an interface with non-negligible capillary waves is treated in a time-
and space-averaged manner. These results indicate that the less marked slow down of hydrogen-
bond exchange for water at the air/water interface relative to water at extended hydrophobic/water
interfaces is a direct consequence of larger-amplitude capillary waves at the air/water interface.
Hydrogen-bond exchange alone does not explain faster reorientation decay at the interface
Using the calculated values of ∆ϑ , τex and τ f for the interface and the bulk and Eq. (7) we
can estimate the reorientation time, τr,est., of hydrogen-bonded OH groups in these two loca-
tions. Note that this reorientation time reflects only hydrogen-bond exchange; it does not ac-
count for bonded-to-free transitions that are non-negligible at the interface. For SPC/E water,
these times are τr,int,est. = 2.216± 0.001 ps and τr,bulk,est. = 2.224± 0.001 ps; for TIP4P/2005,
τr,int,est. = 2.733± 0.001 ps and τr,bulk,est. = 2.626± 0.001 ps. The statistical uncertainty of each
27

(a) (b)
Figure 8: The possible transition state configurations for hydrogen-bond exchange between Oo andOd are those on the blue ring defined by the distance Od · · ·On = R† and angle 6 Oo · · ·Od · · ·On =∆ϑ . (a) For waters near a solute (grey sphere), the only available transition state configurationslie on the visible part of the ring. Near a sharp water-solute interface like this, the fraction fof available transition state configurations is the visible part of the ring divided by the total ringperimeter. (b) For waters at a finite thickness interface, the fraction f of available transition stateconfigurations reflects the continuously varying time-averaged water density (here indicated by thelight blue gradient) at different positions in the ring as described in the text.
estimated value was calculated using standard error propagation. Several points can be made by
comparing the modelled reorientation decay times from hydrogen-bond exchange with the directly
measured decay times (shown in Table 2) for the entire OH population at the interface or in the
bulk. First, the modelled reorientation decay times at the interface are similar to the bulk values
(they differ by 0.008 ps for the SPC/E water model and 0.107 ps for TIP4P/2005), despite the large
differences in the characteristic hydrogen-bond exchange and frame decay times (0.5 - 1.5 ps; see
Table 4). This similarity indicates that the faster frame rotation for interfacial hydrogen-bonded
OH groups is largely compensated for by the smaller jump frequency. Second, the modelled decay
times in the bulk differ no more than 0.6 ps from the directly measured decay times (shown in
Table 2), indicating (as expected)21 that the Ivanov model largely explains OH orientational relax-
ation in the bulk. Finally, whereas the directly measured decay times are larger in the bulk, the
modelled ones show the opposite trend for TIP4P/2005 water or are almost identical in the bulk
and at the interface for SPC/E water. If the decay of the interfacial P2 summing over all water
molecules (shown in Figure 7) was dominated, as in bulk, by the reorientation of hydrogen-bonded
28

OH groups we would not expect this discrepancy. These results are consistent, however, with a
scenario in which faster rotating interfacial free OH also contribute to the total interfacial P2. In
a quest for this faster rotating population, we next investigate the reorientational dynamics of the
free OH in more detail.
Reorientation of free OH groups and transitions between free and bonded
states
To examine transitions between free and hydrogen-bonded states we again use the Stable States
Picture of reactions. As mentioned above, stable hydrogen-bonded states are identified using the
HB1 criteria, corresponding to strong hydrogen-bonds. Analogously, stable free states are those
that do not establish even weak hydrogen-bonds; as such they are identified using the HB2 criteria.
Reorientation decay of free, interfacial, OH groups is faster than overall reorientation in the
bulk
The loss of orientation correlation of free OH groups at the interface as quantified by P2(τ) (Eq. (6))
is shown in a logarithmic scale in Figure 9; for comparison, the same plot includes the reorientation
decay for water in the bulk which, as demonstrated above, reflects predominantly the reorientation
of hydrogen-bonded OH groups through frame diffusion and hydrogen-bond exchange. The reori-
entation decay of the free, interfacial, OH groups shows similar features to those already seen in
the reorientation decay of the full interfacial (or bulk) OH populations: an initial fast decay due to
librational motion, underdamping and a subsequent quasi exponential decay. Restricting ourselves
to timescales of structural change (τ > 200 fs), inspection of Figure 9 shows two distinct regimes:
from 0.2 to 1 ps reorientation of the interfacial free OH occurs at a higher rate than for bulk OH (as
indicated by a steeper slope in the log plot) while for times greater than 1 ps it occurs at a compara-
ble rate (the ln(P2) curves for OH groups in the bulk or free OH groups at the interface are almost
parallel). We and others have previously shown using simulation and VSF spectroscopy that this
population of OH groups reorients more rapidly than OH in bulk for time scales up to 1 ps8. Our
29
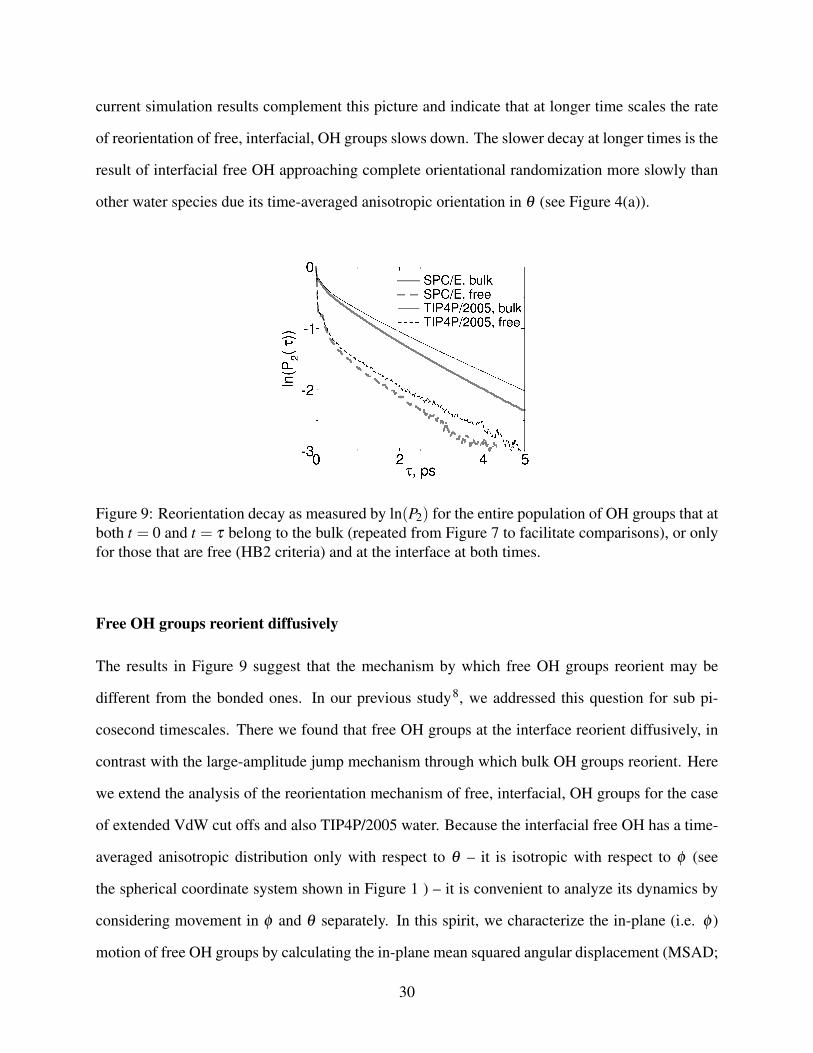
current simulation results complement this picture and indicate that at longer time scales the rate
of reorientation of free, interfacial, OH groups slows down. The slower decay at longer times is the
result of interfacial free OH approaching complete orientational randomization more slowly than
other water species due its time-averaged anisotropic orientation in θ (see Figure 4(a)).
Figure 9: Reorientation decay as measured by ln(P2) for the entire population of OH groups that atboth t = 0 and t = τ belong to the bulk (repeated from Figure 7 to facilitate comparisons), or onlyfor those that are free (HB2 criteria) and at the interface at both times.
Free OH groups reorient diffusively
The results in Figure 9 suggest that the mechanism by which free OH groups reorient may be
different from the bonded ones. In our previous study8, we addressed this question for sub pi-
cosecond timescales. There we found that free OH groups at the interface reorient diffusively, in
contrast with the large-amplitude jump mechanism through which bulk OH groups reorient. Here
we extend the analysis of the reorientation mechanism of free, interfacial, OH groups for the case
of extended VdW cut offs and also TIP4P/2005 water. Because the interfacial free OH has a time-
averaged anisotropic distribution only with respect to θ – it is isotropic with respect to φ (see
the spherical coordinate system shown in Figure 1 ) – it is convenient to analyze its dynamics by
considering movement in φ and θ separately. In this spirit, we characterize the in-plane (i.e. φ )
motion of free OH groups by calculating the in-plane mean squared angular displacement (MSAD;
30

⟨φ(t)2⟩) and comparing it to the full MSAD (
⟨ω(t)2⟩ ) for water in the bulk (see Mazza et al.75,76
and Supporting Information for details of the calculation).77
In the diffusive limit a plot of MSAD vs. time on a log/log scale is linear with a slope of one78.
As shown in Figure 10 for SPC/E water (results for TIP4P/2005 water are almost identical and
so are not shown), for time scales comparable to the lifetime of the bonded or free OH groups at
the interface the MSAD of bulk OH groups,⟨ω(t)2⟩, is, as expected, non-diffusive21,69. Clearly
the in-plane reorientation of the free OH during this time window,⟨φ(t)2⟩, is much closer to the
diffusive regime. This proximity to the diffusive limit indicates that free OH groups at the interface
do not reorient by making fast and large-amplitude jumps in φ , i.e. their reorientation in φ is not
an activated process.
Figure 10: In-plane MSAD⟨φ(t)2⟩ of the free OH groups at the interface and full MSAD
⟨ω(t)2⟩
for all OH groups in the bulk for SPC/E water. The thicker lines illustrate the diffusive limit.
As mentioned above, movement along θ takes place within an effective potential. Under these
conditions, an MSAD plot with a slope of one in a log/log scale is not produced for diffusive mo-
tion. Instead, the MSAD in θ should quickly plateau79, as indeed happens for the interfacial free
OH groups (see our previous study8). However, the nature of the effective potential in θ (and z) for
free OH groups shown in Figure 6(a) suggests that movement in θ of this OH population should be
diffusive: the observed effective potential landscape does not show any free energy barriers (i.e. it
varies monotonically in θ ) and is not very rugged (for the more populated regions of the interface,
31

free energy differences along θ are < 2kBT ). However, comparison of the distributions (Figure 5)
and effective potentials (Figure 6) for free and bonded OH groups, suggests, as mentioned above,
that movement along θ may correlate with transitions between free and bonded states, because free
OH groups point preferentially out of the interface and hydrogen-bonded ones point preferentially
in. If these transitions occur through large amplitude jumps that occur much faster than the char-
acteristic time between jumps, then it is possible that a free energy barrier exists between free and
bonded states and that the movement of free OH groups along θ is not necessarily diffusive at time
scales comparable to that characteristic time. To investigate these issues we examine transitions
between free and hydrogen-bonded states in more detail.
The free-to-bonded transition rate slows down at the interface but the bonded-to-free one
remains identical to bulk
We first investigate trajectories in θ and z associated with free-to-bonded transitions at the inter-
face. Rotation in θ and translation in z are investigated by looking at the distribution of θ angles or
z positions as a function of the time relative to the instant (defined as t = 0) at which a (previously
free) OH group first forms a hydrogen-bond. These distributions are shown in Figure 11 for SPC/E
water and the HB2 criteria; the distribution for TIP4P/2005 water (not shown) is almost identical.
Several points can be made from these distributions. First, changes in hydrogen-bonding state
at the interface correlate with changes in z and θ , in agreement with the free energy landscapes
shown in Figure 6: during a free-to-bonded event OH groups move closer to and reorient into the
bulk. This movement is clearly visible in the transition to larger values of θ and smaller values
of z (i.e. from outer to inner interfacial positions) for t > 0 in Figure 11(a). However, whereas
free-to-bonded transitions involve large-amplitude rotation in θ (in Figure 11(a), from -0.15 to
0.15 ps θ changes on average 35◦), they involve comparatively smaller changes in z (in the same
time interval z changes on average only 0.4 Å). Second, the z and θ distributions before and after
t = 0 substantially overlap, suggesting that changes in hydrogen-bonding state should be largely
diffusive. Third, the actual free-to-bonded event lasts a minimum of 0.3 ps (see Figure 11(a)). As
32
mentioned above, comparison of this time to the characteristic time between successive individual
free-to-bonded (τ f ,b) or bonded-to-free transitions (τb, f ) offers further insight into the mechanism
(diffusive or not) of change of hydrogen-bond state at the interface: if τb, f , τ f ,b are much larger
than 0.3 ps, changes of hydrogen-bond state are activated processes; if the opposite, they are pre-
dominantly diffusive.
We calculate the times τ f ,b and τb, f through a C(τ) function analogous to Eq. (8) but with
different definitions of reactant (free or bonded) and product (bonded or free) states. The functions
C(τ) obtained for free-to-bonded and bonded-to-free transitions are well-fitted by biexponentials,
similarly to what we show above for hydrogen-bond exchange. However, whereas for hydrogen-
bond exchange the exponential with the largest decay time also has the largest amplitude (and so
τex is the largest of the two decay times obtained in the fit) here both exponentials have comparable
amplitudes (see Supporting Information for the fit parameters). For this reason the characteristic
times τ f ,b and τb, f are given by the average of the two decay times obtained from the fit weighed
by the amplitude of each exponential. Inspection of the decay times in Table 5 makes it apparent
that τ f ,b at the interface (0.7-0.8 ps) is larger than but still comparable to the duration of the free-
to-bonded event (0.3 ps) at the interface. This indicates that either the free and bonded states at the
interface are separated by a free energy barrier or that the free state lies at the bottom of a purely
downhill free energy landscape. Below we show the latter situation applies but the free energy
difference between the two states is small so free-to-bonded transitions are still largely diffusive.
For comparison, note that the characteristic time between hydrogen-bond exchanges in the bulk
(3-4 ps; see Table 4) is considerably larger than the duration of the actual hydrogen-bond exchange
event (≈ 0.2 ps; see Supporting Information). This large difference in time scales indicates that
hydrogen-bond exchange is predominantly an activated process, a consequence of the sizable free
energy barrier (4.5 kBT for SPC/E water74) associated with this process.
Comparison of the τ f ,b and τb, f values shown in Table 5 indicates that the bonded-to-free tran-
sition time is almost identical at the interface and the bulk, but the reverse transition time is about
four times longer at the interface than in the bulk. The quasi-independence of τb, f on the posi-
33
tion of the water slab indicates that, even though bonded-to-free transitions at the interface involve
rotation in θ and translation in z, they are barely affected by the effective potentials in θ and z
shown in Figure 6. This apparently unintuitive result is easily understood by looking at the aver-
age trajectories in Figure 11: for a bonded-to-free transition – i.e. going from positive to negative
values of t – z changes little near t = 0 and θ changes mostly after (i.e. for t<0) the breakage of
the hydrogen-bond, so the rate of bonded-to-free transitions must be principally influenced by the
effective potential landscape in the O· · ·O distance and O-H· · ·O angle of the hydrogen-bonded
state. As this landscape is similar at the interface and in the bulk (as inferred from the PHB(d,ϕ)
distributions shown in the Supporting Information and discussed above), τb, f is similar for these
two water populations.
The free energy difference associated with free-to-bonded transitions of long-lived, free, in-
terfacial OH groups is approximately 3kBT
As mentioned above, free-to-bonded transitions become significantly less frequent at the interface
than in the bulk (τ f ,b is longer at the interface). We note also that τ f ,b is not constant throughout
the interface, but instead is larger for OH groups in the outer interfacial layers. This dependence
on interfacial position is clearly visible in Figure 12 which shows the 1−C(τ) function for free-
to-bonded transitions as a function of the position z of the free OH groups at t = 0. The increase in
τ f ,b for free OH groups in the outer interfacial regions is directly related to their average orienta-
tion in θ : as shown in Figure 5(a), free OH groups in the outer interfacial regions are more upright,
having both a narrower orientation distribution and lower average θ ; in the Supporting Information
we show that more upright OH groups have longer lifetimes. The change in free energy barrier,
∆∆G‡, associated with free-to-bonded transitions of free OH groups in the outer interfacial region
(i.e. those that are longer-lived) relative to the bulk can be estimated by determining the τ f ,b for
water molecules initially within a narrow, outer slice of the interface (e.g. for z = 15 Å in Fig-
ure 12), as τ f ,b,z=15/τ f ,b,bulk = exp(∆∆G‡/(kBT )): it is approximately 3kBT . To confirm that the
increase in the rotational free energy barrier of free OH groups is associated with the free energy
34

landscape in (θ ,z) shown in Figure 6(a), we calculate the maximum added energy cost of rotating a
free OH group at z = 15 Å from the free energy minimum (θ = 0) to the position of the nearest free
energy minimum for bonded OH groups (θ ≈> 90◦ in Figure 6(b)) relative to the same rotation in
the bulk. This added cost is also approximately 3kBT , suggesting that the free energy landscape
in (θ ,z) shown in Figure 6(a) should be the principal reason behind the lower free-to-bonded tran-
sition rates at the interface. As the characteristic time for free-to-bonded transitions in the bulk
is very small (< 200 fs, see Table 5), there is no significant energy barrier associated with these
transitions in the bulk. This fact, together with the free energy landscape shown in Figure 6(a),
indicates that free-to-bonded transitions at the interface are, strictly speaking, barrierless; they are
better described as a diffusive escape from a shallow (3kBT ) free energy well.
Table 5: Characteristic time (ps) for free-to-bonded (τ f ,b) and bonded-to-free (τb, f ) transi-tions (HB1 criteria for the bonded state, HB2 criteria for the free state).
location SPC/E TIP4P/2005
τ f ,binterface 0.81 0.73
bulk 0.18 0.16
τb, finterface 0.55 0.61
bulk 0.58 0.67
(a) (b)
Figure 11: Distribution of (a) θ and (b) z at each instant surrounding a free-to-bonded (HB2criteria) transition described by interfacial OH groups of SPC/E water. t = 0 is defined as theinstant at which the (previously free) OH groups first form hydrogen-bonds. The distributions fort < 0 include only free OH groups; for t > 0 they include only bonded ones.
35

Figure 12: 1−C(τ) (with C(τ) defined by Eq. (8)) for free-to-bonded transitions, as a function ofthe position z of free SPC/E OH groups at t = 0.
5. Concluding remarks
At the air/water interface ≈ 75% of OH groups are known to be hydrogen-bonded and point to-
wards the liquid while 25% are free and point towards the vapor. In our previous report we ad-
dressed, through both experiment and computation, the ultrafast reorientational dynamics of the
free OH at timescales ≤ 1 ps8. Here we report simulations that deepen our understanding of the
dynamics of free OH groups for longer time scales and also address the larger, hydrogen-bonded
OH population. We find that, in general, interfacial hydrogen-bonded OH groups rotate with very
similar rates and via the same mechanism as bulk OH groups: for both populations, OH groups
rotate via infrequent large amplitude angular jumps between stable O-H· · ·O complexes and, in
between jumps, collective rotation of those complexes (i.e. frame rotation). While interfacial
hydrogen-bonded OH groups rotate at the same rate as bulk and through the same mechanism,
they experience both faster frame rotation and smaller jump frequency: these two effects counter-
act each other. Both the enhanced frame rotation and the decreased jump frequency are the result
of the decrease in time- and space-averaged density (relative to bulk) at the air/water interface, i.e.,
they are a direct consequence of capillary waves. In contrast, interfacial free OH groups rotate both
more quickly than bulk and diffusively.
Over the past several decades a variety of workers have demonstrated that the structure of wa-
36

ter as measured by local water density fluctuations – whether they be in bulk, near small solutes,
near macromolecular solutes or near extended surfaces – can be used to rationalize the thermody-
namics of solvation and assembly80–90. While this insight is important, it is still fundamentally
descriptive: given a solute of particular structure one cannot predict how it will affect local water
density fluctuations and therefore the thermodynamic properties of its solvation. Recent work by
us and others suggests a way forward: we have previously shown that the rate of density change
occurs (in bulk water and near disaccharides) on the same timescales over which hydrogen-bonds
break and reform74. Similarly, computational studies of protein folding in a variety of systems
make clear that hydrophobic collapse occurs on timescales similar to those of bulk water struc-
tural change6,7,91,92. In a recent study of water near several proteins by Chandler, Garde and
coworkers93, local density fluctuations of water close to certain portions of the protein surface
were found to obey a bimodal distribution with enhanced low density fluctuations. This enhance-
ment was interpreted by the authors to suggest that interfacial water near these portions of the
protein surface was near a dewetting phase transition. A number of prior studies have shown that
waters at hydrophobic interfaces may have one OH group that points towards the adjoining phase
and is, at best, weakly hydrogen-bonded, and one OH group that points towards the liquid and
is strongly hydrogen-bonded to other waters59. In this study we illustrate that, for the air/water
interface (a model hydrophobic interface), the interfacial perturbation of the structural dynamics
of the hydrogen-bonded OH groups is modest. It therefore seems likely that density fluctuations
that require rotating these types of OH groups will be similar to bulk. In contrast, for free OH
groups the interfacial perturbation is large; they rotate both substantially more rapidly and through
a different mechanism than bulk. It therefore seems likely that the sort of density fluctuations re-
quired for dewetting transitions at protein surfaces require protein topology that strongly enhances
the local population of free OH groups.
37
Acknowledgement
AVV thanks Dr. Peter Freddolino for help using the TIP4P/2005 model in NAMD, and Dr. Nils
Becker for useful discussions. This work is part of the research program of the Stichting Fun-
damenteel Onderzoek der Materie with financial support from the Nederlanse Organisatie voor
Wetenschappelijk Onderzoek. We thank SARA Computing and Networking Services (www.sara.nl)
for their support in using the Lisa Compute Cluster.
Supporting Information Available
NAMD-compatible parameter and topology files for TIP4P/2005 water, fraction of water molecules
with one or two free OH groups at each position in the water slab, residence time of waters at the
interface, P(θ) for the three hydrogen-bond criteria, comparison of the orientation of OH groups
at the air/water interface and at the air/hydrophobic interface23 P(θ) of free OH groups as a func-
tion of their lifetime, lifetime of free OH groups as a function of their orientation in θ at t=0, 2D
histograms characterizing the hydrogen-bonded state in terms of the O-H· · ·O angle and the O·O
distance, lifetimes of the free and hydrogen-bonded states, cartoon of the hydrogen-bond exchange
mechanism, distance and angle trajectories associated with hydrogen-bond exchange, frame decay,
mean square displacement plot and calculation of mean square angular displacement, fitting pa-
rameters for free-to-bonded and bonded-to-free transitions. This material is available free of
charge via the Internet at http://pubs.acs.org/.
References
(1) Brown, G.; Henrich, V.; Casey, W.; Clark, D.; Eggleston, C.; Felmy, A.; Goodman, D.;
Gratzel, M.; Maciel, G.; McCarthy, M.; Nealson, K.; Sverjensky, D.; Toney, M.; Zachara, J.
Chem. Rev. 1999, 99, 77–174.
(2) Sverjensky, D. Geochim. Cosmochim. Acta 2005, 69, 225–257.
(3) Rønne, C.; Astrand, P.; Keiding, S. Phys. Rev. Lett. 1999, 82, 2888–2891.
38

(4) Rønne, C.; Keiding, S. R. J. Mol. Liq. 2002, 101, 199–218.
(5) Qvist, J.; Halle, B. J. Am. Chem. Soc. 2008, 130, 10345–10353.
(6) Bakker, H. J. Chem. Rev. 2008, 108, 1456–1473.
(7) Bakker, H. J.; Skinner, J. L. Chem. Rev. 2010, 110, 1498–1517.
(8) Hsieh, C.-S.; Campen, R. K.; Verde, A. C. V.; Bolhuis, P.; Nienhuys, H.-K.; Bonn, M.
Phys. Rev. Lett. 2011, 107, 116102.
(9) Kuo, I.; Mundy, C. Science 2004, 303, 658–660.
(10) Kühne, T. D.; Pascal, T. A.; Kaxiras, E.; Jung, Y. J. Phys. Chem. Lett. 2011, 2, 105–113.
(11) Hantal, G.; Darvas, M.; Partay, L. B.; Horvai, G.; Jedlovszky, P. J. Phys.:Cond. Matter 2010,
22, 284112.
(12) Andreae, M. O.; Crutzen, P. J. Science 1997, 276, 1052–1058.
(13) Du, Q.; Superfine, R.; Freysz, E.; Shen, Y. R. Phys. Rev. Lett. 1993, 70, 2313–2316.
(14) Du, Q.; Freysz, E.; Shen, Y. Science 1994, 264, 826–828.
(15) Richmond, G. Chem. Rev. 2002, 102, 2693–2724.
(16) Gan, W.; Wu, D.; Zhang, Z.; Ran Feng, R.; Wang, H.-F. J. Chem. Phys. 2006, 124, 114705.
(17) Fan, Y.; Chen, X.; Yang, L.; Cremer, P. S.; Gao, Y. Q. J. Phys. Chem. B 2009, 113, 11672–
11679.
(18) Taylor, R. S.; Dang, L. X.; Garrett, B. C. J. Phys. Chem. 1996, 100, 11720–11725.
(19) Kuo, I. F. W.; Mundy, C. J.; McGrath, M. J.; Siepmann, J. I. J. Chem. Theory Comput. 2006,
2, 1274–1281.
39

(20) Baer, M. D.; Mundy, C. J.; McGrath, M. J.; Kuo, I. F. W.; Siepmann, J. I.; Tobias, D. J.
J. Chem. Phys. 2011, 135, 124712.
(21) Laage, D.; Hynes, J. T. J. Phys. Chem. B 2008, 112, 14230–14242.
(22) Laage, D.; Stirnemann, G.; Sterpone, F.; Rey, R.; Hynes, J. T. Annu. Rev. Phys. Chem. 2011,
62, 395–416.
(23) Stirnemann, G.; Sterpone, F.; Laage, D. J. Phys. Chem. B 2011, 115, 3254–3262.
(24) Stirnemann, G.; Castrillón, S. R.-V.; Hynes, J. T.; Rossky, P. J.; Debenedetti, P. G.; Laage, D.
Phys. Chem. Chem. Phys. 2011, 13, 19911–19917.
(25) Berendsen, H. J. C.; Grigera, J. R.; Straatsma, T. P. J. Phys. Chem. 1987, 91, 6269–6271.
(26) Jorgensen, W. L.; Chandrasekhar, J.; Madura, J. D.; Impey, R. W.; Klein, M. L. J. Chem. Phys.
1983, 79, 926–935.
(27) Abascal, J. L. F.; Vega, C. J. Chem. Phys. 2005, 123, 234505.
(28) Alejandre, J.; Chapela, G. A. J. Chem. Phys. 2010, 132, 014701.
(29) Phillips, J. C.; Braun, R.; Wang, W.; Gumbart, J.; Tajkhorshid, E.; Villa, E.; Chipot, C.;
Skeel, R. D.; Kale, L.; Schulten, K. . Comp. Chem. 2005, 26, 1781–1802
(30) Humphrey, W.; Dalke, A.; Schulten, K. J. Mol. Graphics 1996, 14, 33–38.
(31) Smit, B. J. Chem. Phys. 1992, 96, 8639–8640.
(32) Ismail, A. E.; Grest, G. S.; Stevens, M. J. J. Chem. Phys. 2006, 125, 014702.
(33) Janecek, J. J. Phys. Chem. B 2006, 110, 6264–6269.
(34) Alejandre, J.; Tildesley, D. J.; Chapela, G. A. J. Chem. Phys. 1995, 102, 4574–4583.
(35) Trokhymchuk, A.; Alejandre, J. J. Chem. Phys. 1999, 111, 8510–8523.
40

(36) Wood, W. W. In Physics of simple liquids; Temperley, H. N. V., S., R. J., S., R. G., Eds.;
North-Holland publishing company - Amsterdam, 1968; Chapter 5, pp 151–155.
(37) Chitra, R.; Yashonath, S. J. Phys. Chem. B 1997, 101, 5437–5445.
(38) Haynes, W. M., Lide, D. R., Eds. CRC handbook of Chemistry and Physics; CRC press: Boca
Raton, Fl, USA, 2011.
(39) Kuo, I.-F. W.; Mundy, C. J.; Eggimann, B. L.; McGrath, M. J.; Siepmann, J. I.; Chen, B.;
Vieceli, J.; Tobias, D. J. J. Phys. Chem. B 2006, 110, 3738–3746.
(40) Pojjak, K.; Darvas, M.; Horvai, G.; Jedlovszky, P. J. Phys. Chem. C 2010, 114, 12207–12220.
(41) Kathmann, S. M.; Kuo, I.-F. W.; Mundy, C. J.; Schenter, G. K. J. Phys. Chem. B 2011, 115,
4369–4377.
(42) Benjamin, I. Phys. Rev. Lett. 1994, 73, 2083–2086.
(43) Sokahn, B. V. P.; Tildesley, D. J. Mol. Phys. 1997, 92, 625–640.
(44) Morita, A.; Hynes, J. T. Chem. Phys. 2000, 258, 371–390.
(45) Morita, A.; Hynes, J. T. J. Phys. Chem. B 2001, 106, 673–685.
(46) Perry, A.; Neipert, C.; Kasprzyk, C. R.; Green, T.; Space, B.; Moore, P. B. J. Chem. Phys.
2005, 123, 144705–11.
(47) Petersen, P. B.; Saykally, R. J. Annu. Rev. Phys. Chem. 2006, 57, 333–364.
(48) Evans, R. Adv. Phys. 1979, 28, 143–200.
(49) Sedlmeier, F.; Horinek, D.; Netz, R. R. Phys. Rev. Lett. 2009, 103, 136102.
(50) Chacón, E.; Tarazona, P.; Alejandre, J. J. Chem. Phys. 2006, 125, 014709.
(51) Jorge, M.; Jedlovszky, P.; Cordeiro, M. N. D. S. J. Phys. Chem. C 2010, 114, 11169–11179.
41

(52) Willard, A. P.; Chandler, D. J. Phys. Chem. B 2010, 114, 1954–1958.
(53) Liu, W.-T.; Zhang, L.; Shen, Y. R. J. Chem. Phys. 2006, 125, 144711.
(54) Byrnes, S. J.; Geissler, P. L.; Shen, Y. R. Chem. Phys. Lett. 2011, 516, 115–124.
(55) Cappa, C. D.; Smith, J. D.; Wilson, K. R.; Saykally, R. J. J. Phys.:Cond. Matter 2008, 20,
205105.
(56) Varilly, P. S. Fluctuations in Water and their Relation to the Hydrophobic Effect. Ph.D. thesis,
University of California, Berkeley, 2011.
(57) Tuckerman, M. E. Statistical mechanics: theory and molecular simulation; Oxford university
press, 2011.
(58) Goh, M. C.; Hicks, J. M.; Kemnitz, K.; Pinto, G. R.; Heinz, T. F.; Eisenthal, K. B.; Bhat-
tacharyya, K. J. Phys. Chem. 1988, 92, 5074–5075.
(59) Stirnemann, G.; Rossky, P. J.; Hynes, J. T.; Laage, D. Faraday Discuss. 2010, 146, 263–281.
(60) Jedlovszky, P. J. Phys.:Cond. Matter 2004, 16, S5389–S5402.
(61) Laage, D.; Hynes, J. T. Chem. Phys. Lett. 2006, 433, 80–85.
(62) Scott, J. N.; Vanderkooi, J. M. Water 2010, 2, 14–28.
(63) Wilson, K. R.; Schaller, R. D.; Co, D. T.; Saykally, R. J.; Rude, B. S.; Catalano, T.;
Bozek, J. D. J. Chem. Phys. 2002, 117, 7738–7744.
(64) This function has the advantage of being directly measurable from pump-probe spectroscopy
for water in the bulk, allowing for direct comparison between experiment and simulation
in these systems65. The structural dynamics of interfacial OH groups, as sampled in polar-
ization resolved IR pump / VSF probe experiment, sample substantially more complicated
correlation functions66.
42

(65) Lin, Y. S.; Pieniazek, P. A.; Yang, M.; Skinner, J. L. J. Chem. Phys. 2010, 132, 174505.
(66) Gengeliczki, Z.; Rosenfeld, D. E.; Fayer, M. D. J. Chem. Phys. 2010, 132, 244703.
(67) Ludwig, R.; Weinhold, F.; Farrar, T. C. J. Chem. Phys. 1995, 103, 6941–6950.
(68) Bakker, H. J.; Rezus, Y. L. A.; Timmer, R. L. A. J. Phys. Chem. A 2008, 112, 11523–11534.
(69) Laage, D.; Hynes, J. T. Science 2006, 311, 832–835.
(70) Northrup, S. H.; Hynes, J. T. J. Chem. Phys. 1980, 73, 2700–2714.
(71) Laage, D.; Stirnemann, G.; Hynes, J. T. J. Phys. Chem. B 2009, 113, 2428–2435.
(72) Ivanov, E. N. SoV. Phys. JETP 1964, 18, 1041–1045.
(73) In the derivation of Eq. (7) jumps are assumed to be spatially isotropic. This is clearly not the
case at an interface. In this environment, jumps in the XY plane remain isotropic but jumps
in θ are not. However, Figure 4(a) shows that the P(θ) distribution for the hydrogen-bonded
OH groups has a maximum value near 90◦ and low skewness –similar to the sine function that
characterizes an isotropic distribution – indicating that approximating the jump probability
as isotropic should not introduce significant error.
(74) Vila Verde, A.; Campen, R. K. J. Phys. Chem. B 2011, 115, 7069–7084.
(75) Mazza, M. G.; Giovambattista, N.; Starr, F. W.; Stanley, H. E. Phys. Rev. Lett. 2006, 96,
057803.
(76) Mazza, M. G.; Giovambattista, N.; Stanley, H. E.; Starr, F. W. Phys. Rev. E 2007, 76, 031203.
(77) Note that φ and θ are the azimuthal and polar angles of a spherical coordinate system, but ω
is simply the angular distance between any two points at the surface of a sphere.
(78) Berg, H. C. Random Walks in Biology; Princeton University Press: Princeton, New Jersey,
1993.
43
(79) Metzler, R.; Klafter, J. Phys. Rep. 2000, 339, 1–77.
(80) Garde, S.; Hummer, G.; Garcia, A.; Paulaitis, M.; Pratt, L. Phys. Rev. Lett. 1996, 77, 4966–
4968.
(81) Hummer, G.; Garde, S.; Garcia, A.; Pohorille, A.; Pratt, L. Proc. Natl. Acad. Sci. USA 1996,
93, 8951–8955.
(82) Hummer, G.; Garde, S. Phys. Rev. Lett. 1998, 80, 4193–4196.
(83) Lum, K.; Chandler, D.; Weeks, J. J. Phys. Chem. B 1999, 103, 4570–4577.
(84) Huang, D.; Chandler, D. Proc. Natl. Acad. Sci. USA 2000, 97, 8324–8327.
(85) Siebert, X.; Hummer, G. Biochemistry 2002, 41, 2956–2961.
(86) Chandler, D. Nature 2005, 437, 640–647.
(87) Athawale, M. V.; Jamadagni, S. N.; Garde, S. J. Chem. Phys. 2009, 131, 115102.
(88) Acharya, H.; Vembanur, S.; Jamadagni, S. N.; Garde, S. Faraday Discuss. 2010, 146, 353–
365.
(89) Patel, A. J.; Varilly, P.; Chandler, D. J. Phys. Chem. B 2010, 114, 1632–1637.
(90) Patel, A. J.; Varilly, P.; Jamadagni, S. N.; Acharya, H.; Garde, S.; Chandler, D.
Proc. Natl. Acad. Sci. USA 2011, 108, 17678–17683.
(91) Zhou, R.; Huang, X.; Margulis, C.; Berne, B. Science 2004, 305, 1605–1609.
(92) Liu, P.; Huang, X.; Zhou, R.; Berne, B. Nature 2005, 437, 159–162.
(93) Patel, A. J.; Varilly, P.; Jamadagni, S. N.; Hagan, M. F.; Chandler, D.; Garde, S.
J. Phys. Chem. B 2012, 116, 2498–2503.
44

Image for Table of Contents
45