static-content.springer.com10.1007... · web viewbrains were removed 4 h after death. both internal...
TRANSCRIPT

Adori C et al 2015
Critcal role of somatostatin receptor 2 in the vulnerability of the central
noradrenergic system: new aspects in Alzheimer’s disease
SUPPLEMENTARY INFORMATION
Acta Neuropathologica
Csaba Ádori, Laura Glück, Swapnali Barde, Takashi Yoshitake, Gabor G. Kovacs, Jan
Mulder, Zsófia Maglóczky, László Havas, Kata Bölcskei, Nicholas Mitsios, Mathias Uhlén,
János Szolcsányi, Jan Kehr, Annica Rönnbäck, Thue Schwartz, Jens F. Rehfeld, Tibor
Harkany, Miklós Palkovits, Stefan Schulz, Tomas Hökfelt
Correspondence to: Csaba Adori PhD, Department of Neuroscience, Retzius Laboratory,
Karolinska Institutet, Retzius väg 8, 17177 Stockholm, Sweden, E-mail: [email protected] ,
telephone: +46 8 52487097, Fax: +46 8 331692. Tomas Hökfelt MD PhD, Department of
Neuroscience, Retzius Laboratory, Karolinska Institutet, Retzius väg 8, 17177 Stockholm,
Sweden, E-mail: [email protected], telephone: +46 8 52487070, Fax: +46 8 331692;
1
Adori C et al 2015
Methods and Materials
Detailed processing of perfused human brains
Brains were removed 4 h after death. Both internal carotid and vertebral arteries were
cannulated, and the brains were perfused first with physiological saline (1,5 liters in 30 min)
containing 5 ml of heparin, followed by a fixative solution containing 4% paraformaldehyde,
0.05% glutaraldehyde and 0.2% picric acid in 0.1 M PB, pH = 7,4 (4-5 liters in 1.5-2 h).
Brainstem blocks (pons+medulla) were removed after perfusion, were postfixed overnight in
the same fixative solution but without glutaraldehyde [30], and were finally immersed in 10%
sucrose diluted in phosphate-buffered saline (PBS) (pH = 7.4) containing 0.01% sodium azide
(Sigma-Aldrich) and 0.02% Bacitracin (Sigma-Aldrich, St. Louis, MO, USA) (4°C) for 48 h.
The blocks were snap-frozen with CO2 and sectioned at 20 µm in a cryostat (Microm,
Heidelberg, Germany) at the level of LC. The sections were then mounted on SuperFrost Plus
slides (VWR international, Radnor, Pennsylvania).
For immunohistochemistry, the slides were washed in 0.01M PBS and then incubated
with 0.3% H2O2 in 0.01M PBS+0.6% TritonX-100 for 60 minutes. Double-immunostaining
procedure, confocal analysis and micrograph production were performed as described above.
Neuropathological evaluation of human cases applied for qPCR analysis
Formalin fixed, paraffin-embedded tissue blocks (2.5 x 2.0 cm) from the neocortical
areas, hippocampus, basal ganglia, thalamus, brainstem levels, and cerebellum were
evaluated. In addition to Hematoxylin and Eosin, Luxol Fast Blue/nuclear fast red,
Bielschowsky and Gallyas stainings, the following monoclonal antibodies were used for
immunohistochemistry: anti-tau AT8 (pS202, 1:200; Pierce Biotechnology, Rockford, IL,
USA), anti-ubiquitin (1:50,000, Millipore, Temecula, CA, USA), anti--synuclein (1:10,000,
clone 4D6, Signet, Dedham, MA, USA) and anti-A (1:50, clone 6F/3D, Dako, Glostrup,
Denmark). The DAKO EnVision© detection kit (peroxidase/DAB, rabbit/mouse; DAKO)
2

Adori C et al 2015
was used for visualization of antibody reactions. We used the following diagnostic criteria and
stageing: CERAD [20], evaluation of A pathology according to Thal phases [27], stages of
neurofibrillary degeneration according to Braak and colleagues [8,7,3]; in the interpretation of
the level of AD neuropathologic change we also followed recent recommendations [21]. In
addition, we evaluated Lewy body pathology according to the stages proposed by Braak and
collegues [9].
qPCR analysis on human LC micro-punch samples
Total RNA from punched LC samples was extracted using the RNeasy Mini kit
(Qiagen, Dusseldorf, Germany). RNA quality and quantity were determined
spectrophotometrically at 260 and 280 nm with a NanoDrop (Saveen Werner, Limhamn,
Sweden). RNA integrity was analyzed using the Experion automated gel electrophoresis
system (Bio-Rad, Hercules, CA) and only samples that showed RNA integrity number (RIN)
>6 were included in our analysis. Total RNA (200 ng) was reverse transcribed using iScript
Select cDNA synthesis kit (Bio-Rad, Hercules, CA) according to the manufacturer’s
instructions. qPCR was performed in duplicates with equal amount of cDNA (2 ng/ul) added
to each amplification reaction. TaqMan assay for tyrosine hydroxylase (Hs00165941_m1)
was purchased from Applied Biosystems (Carlsbad, CA, USA) and the amplification reaction
was carried out using TaqMan assay master mix (Applied Biosystems, Carlsbad, CA). All
other primers were purchased from Sigma-Aldrich (Suppl. Table 3) and the amplification was
carried out using the SYBR green master mix (Applied Biosystems). Gene expression was
measured by quantitative reverse transcription polymerase chain reaction (qRT-PCR) on an
Applied Biosystems 7000 Real-Time PCR system (Foster City, CA, USA). For each sample,
reactions were set up in duplicates with the following cycling protocol, 95°C for 10 mins, 40
cycles with a 3-step program (95°C for 15 s, 60°C for 30s). Melting curve analysis was
performed for each sample to check for amplification specificity and that the assays have
3

Adori C et al 2015
produced single amplicons. Relative fold changes were calculated by using the comparative
CT method (2-∆∆CT), where CT is the point (cycle) at which the amplification plot crosses the
threshold and ΔΔCT = (ΔCT of the target mRNA − ΔCT of control mRNA).
The amount of target/control gene was normalized to neuron-specific β-III-tubulin
(TUBB3), which served as the reference gene. The analysis was also performed with β-ACTIN
and GAPDH as reference genes with no changes in the final results. There was no correlation
between the amount of total extracted RNA and PMD of samples (data not shown).
Neuropathological evaluation and immunostaining on human temporal cortex TMA samples
Brains were obtained from the Dutch Brain Bank (NBB) (ethical permission number:
EPN 2013/474-31/2). Samples were selected based on amyloid stages [8], NFT Braak stages
[8] and DLB Braak stages [9] (Suppl. Table 4).
TMA slides were immunostained on a BOND-X autostainer (Leica Microsystems,
Wetzlar, Germany). Slides were dewaxed before the 20 min heat induced epitope retrieval
(HIER) in citrate buffer (pH = 6.00). Slides were incubated with rabbit polyclonal antibodies
against SST (1:800) or TH (1:1000) (Suppl. Table 5a) and were developed using a Cy5
tyramide signal amplification (TSA) detection system [1]. Amyloid plaques and
neurofibrillary tangles/dystrophic neurits were visualized by sequential incubation with a
mouse antibodies against -amyloid (aa17-aa24, 1:200, Covance; fluorescein-TSA) and PHF-
tau (AT8, 1:10.000, Therma Scientific; Cy3-TSA), respectively, preceded by a short heat
induced antibody removal step that does not affect TSA binding. Autofluorescence was
quenched by dipping the slides in a 70% ethanol solution containing 1% Sudan black. Slides
were mounted with ProLong Gold antifade mounting medium containing DAPI.
SST, amyloid- and tau-PHF immunostainings were quantified by densitometry with
the application of Image J 1.37V software (threshold method), as described before [2].
4
Adori C et al 2015
The Sstr knockout/LacZ knockin mice
The generation of Sstr2 knockout/LacZ knockin mice has been described in detail
[4,5]. Briefly, a gene targeting construct was engineered in an Sstr2 genomic clone by
replacing the Sstr2 coding sequence with a promoterless lacZ reporter gene. This construct
was electroporated into the 129/Ola embryonic stem cell line HM-1. Correctly targeted clones
were identified by G418 resistance and Southern blot analysis. Chimeric mice were generated
by blastocyst injection and germline transmission achieved by breeding chimeras to C57BL/6
(Babraham Institute Small Animal Facility, Cambridge, UK). The Sstr2lacZ allele was then
backcrossed onto the C57BL/6 background for a further five generations by using male and
female Sstr2+/lacZ mice alternately. Reverse transcriptase polymerase chain reaction (RT-PCR)
analysis demonstrated a complete lack of Sstr2 expression in Sstr2lacZ/lacZ mice, whereas lacZ
expression was present in Sstr2+/lacZ and Sstr2lacZ/lacZ mice.
Ssrt1 knockout/LacZ knockin mice were purchased from Jax mice (strain name:
B6.129P2-Sstr1tm1Dgen/J, stock number: 005844; http://jaxmice.jax.org/strain/005844.html).
This targeted mutant was created and characterized by Deltagen, Inc (San Francisco, CA,
USA) (detailed phenotypic analysis is reported at:
http://www.informatics.jax.org/external/ko/deltagen/623.html). The construct insert is
reported to be "SA-IRES-lacZ-Neo555G/Kan." Upon arrival at The Jackson Laboratory, these
mice had been backcrossed at least 7 generations to C57BL/6 mice. Wild type (WT) animals
were used from the colony 000664 C57BL/6J (Jackson Laboratory) strain. In Sst1
knockout/LacZ knockin mice widespread sstr1lacZ immunostainig was found in the neocortex,
while no any staining was found in the WT animals (Suppl. Fig. 1b).
The generation of the Sstr4 lacZ allele was essentially carried out as described for
Sstr2 lacZ animals [14]. Homozygous Sstr4lacz/lacZ and WT (Sstr4+/+) littermates were generated
by intercrossing Sstr4+/lacZ mice from the 10th generations of backcross mice. No sstr4 mRNA
5
Adori C et al 2015
was detectable in the Sst4lacZ mice, whereas lacZ was expressed. Also, in Sstr4 knockout/LacZ
knockin mice widespread sstr4lacZ immunostainig was found in the neocortex, while no
staining was found in the WT animals (Suppl. Fig. 1c).
Immunohistochemical and documentation procedures
Mice were deeply anesthetized using sodium pentobarbital (60 mg/kg i.p.). They were
perfused via the ascending aorta with 20 mL of Tyrode’s buffer (37°C), followed by 20 mL of
a mixture of 4% paraformaldehyde (PFA) and 0.2% picric acid diluted in 0.16 M phosphate
buffer (PB) (pH 6.9) (Zamboni fixative) [11], and 50 mL of the same fixative at 4°C. The
brains were dissected out and postfixed in the same fixative for 120 min at 4°C, and finally
immersed in 10% sucrose in phosphate-buffered saline (PBS) (pH 7.4) containing 0.01%
sodium azide (Sigma-Aldrich) and 0.02% Bacitracin (Sigma-Aldrich) (4°C) for 48 h. All
brains were snap-frozen with CO2 and sectioned at 20 µm in a cryostat (Microm, Heidelberg,
Germany) at numerous brain levels. The sections were then mounted on SuperFrost Plus
slides (VWR international, Leuven, Belgium).
For single-immunostaining and for the first step of double-stainings, sections were
washed in PBS and incubated overnight at 4°C with primary antibodies in 0.01M PBS
containing 0.3% TritonX-100, 0.02% bacitracin and 0.01% sodium-azide (Suppl. Table 5a:
list of antibodies). To visualize the immunoreactivity the sections were processed using a
commercial kit (PerkinElmer Life Science, Boston, MA) based on tyramide signal
amplification (TSA) [1]. Briefly, the sections were washed in TNT buffer (0.1 M Tris-HCl,
pH 7.5; 0.15 M NaCl; 0.05% Tween 20) for 15 min, incubated with TNB buffer (0.1 M Tris-
HCl, pH 7.5; 0.15 M NaCl; 0.5% Dupont Blocking Reagent, PerkinElmer) for 30 min at room
temperature (RT), and incubated with a swine anti-rabbit, donkey anti-mouse or anti-chicken
IgGs/IgY, coupled to horseradish peroxidase (HRP) (DAKO, Glostrup, Denmark or Jackson
Immunoresearch Europe, Suffolk, UK) diluted 1:200 (anti-rabbit, anti-chicken) or 1:1,000
6

Adori C et al 2015
(anti-mouse) in TNB buffer for 45 min (more details about the secondary abs are provided in
Suppl. Table 4b). The sections were washed in TNT buffer and incubated in a biotinyl
tyramide-fluorescein (BT-FITC) conjugate (PerkinElmer) diluted 1:100 in amplification
diluent for 10 min at RT. After the immunoreactions, sections were coverslipped using 2.5%
DABCO in glycerol (Sigma). The sections were examined and photographed using a Nikon
Eclipse E600 fluorescence microscope with objective lenses 4x, 10x and 20x (Nikon, Tokyo,
Japan) equipped with appropriate filters and ORCA-ER, C4742-80 digital camera using
Hamamatsu Photonics Wasabi 150 software (Hamamatsu Photonics K.K., System Division,
Hamamatsu City, Japan).
Double-labeling and confocal analysis procedures
For double labeling, immunostained sections were extensively washed in 0.01M PBS
and incubated again overnight or two nights at 4oC with new primary antibodies in 0.01M
PBS (Suppl. Table 5a). After washing in 0.01M PBS, the sections were incubated with
rhodamine-conjugated anti-rabbit, anti-sheep or anti-guinea pig IgG secondary antibodies,
Cy3-conjugated anti-mouse IgG secondary antibodies or FITC-conjugated anti-mouse IgG
secondary antibodies (Jackson Immunoresearch Europe; more details about the secondary abs
are provided in Suppl. Table 5b) at a dilution of 1:150 (Cy3), or 1:80 (rhodamine and FITC)
in 0.01M PBS for 90 min. Sections were then coverslipped using 2.5% DABCO in glycerol
(Sigma) and examined with a Zeiss LSM 510 Meta confocal-system installed on a Zeiss
Axioplan 2 microscope equipped with x10 (N.A. 0.45), x20 (N.A. 0.75), and x100 oil (N.A.
1.40) objectives. The FITC labeling was excited using the 488 nm argon laser and its signal
detected using the HQ 530/60 emission filter. For the detection of rhodamine and Cy3, the
543 nm HeNe laser in combination with HQ 590/70 emission was used. Digital images from
the microscopy were slightly modified to optimize for brightness, and contrast using ZEN
2011 (Carl Zeiss Microimaging GmbH, Jena, Germany) and Adobe Photoshop 7.0 software
7

Adori C et al 2015
(Adobe Systems, San Jose, CA), so as to best represent the immunohistochemistry observed
at the microscope.
Morphometry
Cell body counting and determination of mean somatic surface area
For each experimental animal (8-month-old, N = 3), 4–4 sections were analyzed on
four different rostro-caudal levels of the locus coeruleus (LC). The sections were
immunostained for tyrosine hydroxylase (TH) and counterstained with TO-PRO®-3 nucleic
acid staining with far-red fluorescence. Two optically layered micrographs were taken
(bilaterally) in each section using Zeiss LSM 510 Meta confocal-system. All micrographs
included five-six 3 μm thick, optical layers and all of them were taken using x20 objective
and an x1.3 optical zoom. Then, the optical layers were merged with the Image J software
(version 1.37; NIH, Bethesda, MD). The brightness/contrast and sharpness of the merged
micrographs were slightly adjusted in each color channel. The LC was outlined precisely and
its surface area (m2) was measured by the Image J software in each merged micrograph. The
counting of cells was performed on screen by the same observer in all cases. Only TH-
immunoreactive (IR) neurons with clearly visible nuclei were considered. Finally, the number
of cells was calculated to cell no/mm2 values. Also, the Image J software was applied to
precisely outline the TH-IR LC neurons with TO-PRO®-3-positive nucleus and to determine
the mean somatic surface area in each neuron (area/perimeter, m2/cell).
Densitometry of TH-IR fibers and counting of individual swollen varicosities and fiber
clusters
Two-week, 1-, 2-, 4- and 8-month-old WT and Sstr2-/- animals (N = 4-5) were used in
order to quantitatively determine the time-course of noradrenergic axonal degeneration.
Whole mouse brain coronal sections, immunostained for TH, at the level of Bregma -5 to -4,
where captured on a Vslide slide scanning microscope (Metasystems, Alltlussheim, Germany)
8

Adori C et al 2015
equipped with 2.5x, 5x , 10x and 20x objectives and filter sets for DAPI (EX350/50 -
EM470/40), FITC (EX493/16 – EM527/30), Cy3 (EX546/10 – EM580/30), Cy3.5 (EX581/10
– EM617/40) and Cy5 (EX630/20 – 647/long pass). Whole microscope slides were scanned at
2.5x, and tissue was detected based on the Hoechst 33342 signal. After generating a position
map, entire brain sections were scanned at three different exposure times (intensity levels)
using a 20x objective and FITC filter. Individual fields of view images were stitched and
channel grey scale images with high resolution were extracted (35,000x20,000 pixels). The
large stitched files were further managed by the MetaViewer software (version V2.0104.3;
Meta System Gmbh). In order to count the aberrant fiber structures, randomly selected from
one-side fronto-parietal cortex of each section at the lowest intensity, stitched micrographs
were outlined and the area (m2, converted to mm2) was determined. The average outlined
area was 3.049 mm2 / section. Then, the regions of interests (ROI: fronto-parietal regions)
were cut, and the files were opened with Adobe Photoshop 7.0 software (Adobe Systems).
The brightness/contrast of pictures was slightly adjusted, and the number of (i) single swollen
varicosities/intervaricose connections and (ii) aberrant fiber clusters were determined by the
same observer on screen as described before [2]. The description of these structures is
reported in the Results (Fig. 7, Suppl. Fig. 3, legends).
To determine the TH-IR fiber density, the longest exposure time (highest intensity)
stitched micrographs were applied. Four snapshot pictures were obtained (0.473 mm2 each,
1.9 mm2 altogether) from each outlined fronto-parietal cortex region by the Metaviewer
software. Then, the micrographs were opened by the Image J 1.37v software, and
brightness/contrast was properly adjusted. As swollen axons are represented by multiple
pixels after image correction, and as this might disturb the precision of the densitometry
analysis, we applied a 1-pixel algorithm using the Image J 1.37v. In this case, the pathway of
the axons was skeletonized (assigned by a virtually 1-pixel wide skeleton), and the number of
9
Adori C et al 2015
these pixels was proportional to the axonal length in the micrographs and independent of the
axon thickness.
Semiquantitative score of aberrant noradrenergic structures
The spatial pattern of the degenerative fiber processes was semiquantitatively assessed by a
four-grade score on numerous rostro-caudal levels of three 4-month- and three 8-month-old
brains immunostained for the norepinephrine transporter (NET) (0: no apparent sign of
degeneration; + no cluster, few individual swollen varicosities; ++ few clusters, many
individual swollen neurites; +++ many clusters, many individual swollen neurites).
In situ hybridization
The following oligoprobes were used: (i) Oligoprobe complementary to nucleotides
1332-1367 of the mouse TH mRNA; access. no. NM_009377) [13]. (ii) Galanin probe
mixture: oligoprobes complementary to nucleotides 427-459, 361-393, 241-273, 152-199 and
487-519 of the rat galanin mRNA with 100%, 93%, 100%, 95% and 88% homology to the
nucleotides 441-481, 387-415, 263-295, 176-214 and 509-540 of the mouse galanin mRNA
sequences, respectively; access no. NM_010253.3.
The oligonucleotides were labeled at the 3’ end using terminal deoxynucleotidyl-
transferase (Amersham, Buckinghamshire, UK) with [-33P]dATP (NEN, Boston, MA) to a
specific activity of 1–4 x 10⁶ cpm/ng oligonucleotide. The labeled oligoprobes were purified
through ProbeQuant G-50 Micro Columns (Amersham). Sections were hybridized as
described previously [26,10]. Briefly, air-dried sections were incubated in a hybridization
cocktail (50% formamide, 4x SSC; 1x Denhardt’s solution 1% sarcosyl; 0.02 M PB; 10%
dextran sulfate; 500 g/mL 0.02 M PB) in a humidified chamber for 16–18 h at 42oC. After
hybridization the sections were washed in 1x SSC for 4 x 15 minat 55oC and for 30 min at
RT, then air-dried and dipped into Kodak NTB 2 (Kodak, Rochester, NY) and diluted 1:1
with water. After exposure at 4oC for 10, 21, 30 days to TH or galanin mix, respectively, the
10
Adori C et al 2015
slides were developed in Kodak D19, fixed in Kodak Unifix, and mounted in glycerol-PB. For
specificity control adjacent sections were incubated with an excess (x100) of unlabeled probe.
The expression levels of TH and galanin expression in LC were quantified using an
image analysis system (Nikon Microphot-MX microscope equipped with a dark-field Heim
fiberoptic condenser, LQ1600). To determine the mRNA expression of individual cells,
photomicrographs were taken (20x objective) with a digital camera, ORCA-ER, C4742-80
(Hamamatsu Photonics K.K.) using Hamamatsu Photonics Wasabi 150 software. For each
experimental animal, 5–5 sections were analyzed at five different rostro-caudal levels of the
the LC. The density of silver grains was measured over the cell bodies with the Image J
software (version 1.37; NIH). In case of TH or galanin expression, all positive cells were
analyzed in the LC (two micrographs from each section, bilaterally). The threshold was
adjusted to the background signal level, the area in question was selected, and the mean grey
density was automatically calculated with respect to the surface area of the selected section.
The mean grey density values reflect the mRNA expression of the cell.
HPLC measurement of monoamines
The brain tissue samples (1-10 mg) were mixed at a ratio of 1:10 (w/v) with 0.2 M
perchloric acid (Merck, Darmstadt, Germany) including 100 µM EDTA-2Na (Dojindo,
Kumamoto, Japan) and were homogenized in a glass-pestle micro-homogenizer on ice.
Then,the homogenates were kept on ice for 30 min and centrifuged for 15 min at 12,000 g at 4
°C. The supernatants were carefully aspirated and mixed with 1 M Na-acetate (Sigma), pH 3,
at a ratio 5:1 (v/v) and filtered through a 0.22 µm centrifugal filter for 4 min at 12,000 g at 4
°C. The filtrates were stored at -80 °C pending analysis.
Concentrations of noradrenaline (NA), dopamine (DA) and 5-hydroxytryptamine (5-
HT) in the brain tissue samples were determined by HPLC with electrochemical detection as
described elsewhere [17]. Briefly, the HPLC system consisted of a HTEC500 unit (Eicom,
11

Adori C et al 2015
Kyoto, Japan), and a CMA/200 Refrigerated Microsampler (CMA Microdialysis, Stockholm,
Sweden) equipped with a 20 uL loop and operating at +4°C. The potential of the glassy
carbon working electrode was +450 mV versus the Ag/AgCl reference electrode. The
separation was achieved on a 200 x 2.0 mm Eicompak CAX column (Eicom). The mobile
phase was a mixture of methanol (Sigma) and 0.1 M phosphate buffer (pH 6.0) (30:70, v/v)
containing 40 mM potassium chloride (Sigma) and 0.13 mM EDTA-2Na. The chromatograms
were recorded and integrated by use of a computerized data acquisition system Clarity,
Prague, Czech Republic). The detection limit (signal-to-noise ratio = 3) for NA, DA and 5-HT
was 0.05 nM, that is, 0.75 fmol in 15 uL injected onto the column respectively.
The chromatograms were recorded and integrated by use of the computerized data
acquisition system Clarity (DataApex).
Supplementary Discussion
SI-D1 Interestingly, septum and hypothalamus, two regions known to have noradrenergic
innervation predominantly from the ventral noradrenergic bundle (A1, 2, 5, 7) [24,18], exhibit
a less serious degeneration than neocortex and hippocampus (Hippo), two regions with a
‘pure’ LC NA innervation [23,25]. This suggests that mainly, or perhaps exclusively, the LC
projections are affected by the degeneration process. In fact, the LC projection is much more
sensitive for DSP-4 toxicity than fibers from the ventral noradrenergic bundle. Notably, the
brain micro-environment of fibers (e.g. availability of trophic factors, glial supporting) may
also influence the degenerative processes.
SI-D2 However, the decrease of NA levels likely precedes the fiber degeneration, at least in
the hippocampus, where lower amounts of NA were recorded without significant alterations
in fiber density at 2 weeks-of-age.
12

Adori C et al 2015
SI-D3 E.g. in the free-choice exploration test the mice showed a high avoidance reaction
together with low exploratory activity, reflecting a neophobic reaction. In the open field test a
lack of habituation was established [31].
13

Adori C et al 2015
Supplementary figure legends
Supplementary Figure 1 Specificity of immunohistochemical staining and genetic labeling of
three SST receptors (a) The prominent sstr2lacZ immunostaining in the frontal cortex (FCtx)
L4-6 in Sstr2-/- animals is in a good agreement with the SST2a receptor immunostaining of the
wild type (WT). (b) Abundant sstr1lacZ staining is found in the FCtx L2-3 and L5 in the Sstr1-/-
animals but not in WT. (c) Widespread sstr4lacZ staining is found in the FCtx L4-6 and less
frequently also in the L1-3 in the Sstr4-/- animals but not in the WT. (d) High power confocal
analysis of sstr2lacZ double-stained with the pyramidal cell marker SMI32: neuronal nuclei and
some cytoplasmic spheroids (arrows) are strongly stained, but the entire cell bodies and
dendrites are also moderately immunopositive. Scale bars: 300 µm in a applies to a-c; 25 µm
in d.
Supplementary Figure 2 Detailed morphological characterization and confocal analysis of
aberrant noradrenergic structures in Sstr2-/- mice (a) Normal varicose noradrenergic fiber
indicated by asterisks. (b) Aberrant noradrenergic fiber with enlarged-swollen and highly
immunoreactive varicosities (arrows). (c) Noradrenergic fiber with enlarged varicosities
(arrows) and also with thickened intervaricose connections. (d) Premature aberrant fiber
cluster with enlarged-swollen varicosities. Higher magnification of the boxed swollen
structure is shown in G. (e–f) ‘Loose’ aberrant fiber clusters including swollen varicosities
and debris-like structures. (g–h) High power, 0.5-m-thick optical layer micrographs from the
boxed areas in D and F, respectively. Large swollen varicosities mostly have a homogenous
fine structure even with high resolution but in some cases a fragmented fine structure can be
discerned. (i) Aberrant fiber cluster with aggregates of swollen varicosities (box). (j–k)
‘Matured’, compact clusters of swollen varicosities and debris-like structures.
The plate shows different stages of a slow and progressive axonal degeneration process:
Enlarged individual varicosities (b-c), ‘loose’ (d-i) and compact (j-k) clusters.
14

Adori C et al 2015
a-c: One-month-old Sstr2-/- mouse, FCtx, TH immunostaining; d-k: 8-month-old Sstr2-/-
mouse, FCtx, TH immunostaining. a-f and i-k: merged micrographs of 0.5-m-thick optical
layers along the Z-stack (merged from 40-45 layers), TH immunostaining; g-h: high power
single 0.5 m optical layer. Scale bars: 25 µm in a, applies to a, b and c; 100 µm in d, applies
to d, e, f, i, j and k; 20 µm in g, applies to g and h.
Supplementary Figure 3 Sstr2-/- mice do not exhibit amyloid deposits (a–b) Amyloid
deposits in the subiculum of a 15-month-old male homozygous TgAPParc transgenic mouse
visualized by ‘82E1’ N-terminus (A1) end-specific antibody or by ‘OC’ amyloid antibody
recognizing fibrils and soluble fibrillar oligomers (b). (c–d) In contrast, 4-month-old Sstr2-/-
mice do not exhibit any staining for 82E1 (c) and OC (d) amyloid antibodies. (e–f) Higher
magnification of the Sstr2-/- parietal cortex immunostained with 82E1 (e) or OC antibodies (f).
Scale bar: 1000 m in d applies to a-d; 500 µm in f applies to e-f.
Supplementary references
15

Adori C et al 2015
1. Adams JC (1992) Biotin amplification of biotin and horseradish peroxidase signals in histochemical stains. J Histochem Cytochem 40:1457-1463
2. Adori C, Ando RD, Szekeres M, Gutknecht L, Kovacs GG, Hunyady L, Lesch KP, Bagdy G (2011) Recovery and aging of serotonergic fibers after single and intermittent MDMA treatment in Dark Agouti rat. The Journal of comparative neurology 519:2353-2378. doi:10.1002/cne.22631
3. Alafuzoff I, Arzberger T, Al-Sarraj S, Bodi I, Bogdanovic N, Braak H, Bugiani O, Del-Tredici K, Ferrer I, Gelpi E, Giaccone G, Graeber MB, Ince P, Kamphorst W, King A, Korkolopoulou P, Kovacs GG, Larionov S, Meyronet D, Monoranu C, Parchi P, Patsouris E, Roggendorf W, Seilhean D, Tagliavini F, Stadelmann C, Streichenberger N, Thal DR, Wharton SB, Kretzschmar H (2008) Staging of neurofibrillary pathology in Alzheimer's disease: a study of the BrainNet Europe Consortium. Brain pathology 18:484-496. doi:10.1111/j.1750-3639.2008.00147.x
4. Allen JP, Canty AJ, Schulz S, Humphrey PP, Emson PC, Young HM (2002) Identification of cells expressing somatostatin receptor 2 in the gastrointestinal tract of Sstr2 knockout/lacZ knockin mice. The Journal of comparative neurology 454:329-340. doi:10.1002/cne.10466
5. Allen JP, Hathway GJ, Clarke NJ, Jowett MI, Topps S, Kendrick KM, Humphrey PP, Wilkinson LS, Emson PC (2003) Somatostatin receptor 2 knockout/lacZ knockin mice show impaired motor coordination and reveal sites of somatostatin action within the striatum. Eur J Neurosci 17:1881-1895
6. Benoit R, Bohlen P, Brazeau P, Ling N, Guillemin R (1980) Isolation and characterization of rat pancreatic somatostatin. Endocrinology 107:2127-2129. doi:10.1210/endo-107-6-2127
7. Braak H, Alafuzoff I, Arzberger T, Kretzschmar H, Del Tredici K (2006) Staging of Alzheimer disease-associated neurofibrillary pathology using paraffin sections and immunocytochemistry. Acta neuropathologica 112:389-404. doi:10.1007/s00401-006-0127-z
8. Braak H, Braak E (1991) Neuropathological stageing of Alzheimer-related changes. Acta neuropathologica 82:239-259
9. Braak H, Del Tredici K, Rub U, de Vos RA, Jansen Steur EN, Braak E (2003) Staging of brain pathology related to sporadic Parkinson's disease. Neurobiology of aging 24:197-211
10. Dagerlind A, Friberg K, Bean AJ, Hökfelt T (1992) Sensitive mRNA detection using unfixed tissue: combined radioactive and non-radioactive in situ hybridization histochemistry. Histochemistry 98:39-49
11. De Martino C, Zamboni L (1967) Silver methenamine stain for electron microscopy. J Ultrastruct Res 19:273-282
12. Fischer T, Nagel F, Jacobs S, Stumm R, Schulz S (2008) Reassessment of CXCR4 chemokine receptor expression in human normal and neoplastic tissues using the novel rabbit monoclonal antibody UMB-2. PLoS One 3:e4069. doi:10.1371/journal.pone.0004069
13. Grima B, Lamouroux A, Blanot F, Biguet NF, Mallet J (1985) Complete coding sequence of rat tyrosine hydroxylase mRNA. Proceedings of the National Academy of Sciences of the United States of America 82:617-621
14. Helyes Z, Pinter E, Sandor K, Elekes K, Banvolgyi A, Keszthelyi D, Szoke E, Toth DM, Sandor Z, Kereskai L, Pozsgai G, Allen JP, Emson PC, Markovics A, Szolcsanyi J (2009) Impaired defense mechanism against inflammation, hyperalgesia, and airway hyperreactivity in somatostatin 4 receptor gene-deleted mice. Proc Natl Acad Sci U S A 106:13088-13093. doi:10.1073/pnas.0900681106
15. Horikoshi Y, Sakaguchi G, Becker AG, Gray AJ, Duff K, Aisen PS, Yamaguchi H, Maeda M, Kinoshita N, Matsuoka Y (2004) Development of Abeta terminal end-specific antibodies and sensitive ELISA for Abeta variant. Biochemical and biophysical research communications 319:733-737. doi:10.1016/j.bbrc.2004.05.051
16. Kayed R, Head E, Sarsoza F, Saing T, Cotman CW, Necula M, Margol L, Wu J, Breydo L, Thompson JL, Rasool S, Gurlo T, Butler P, Glabe CG (2007) Fibril specific, conformation dependent antibodies recognize a generic epitope common to amyloid fibrils and fibrillar oligomers that
16

Adori C et al 2015
is absent in prefibrillar oligomers. Molecular neurodegeneration 2:18. doi:10.1186/1750-1326-2-18
17. Kehr J YT (2006) Monitoring brain chemical signals by microdialysis, vol 6. In: Encyclopedia of Sensors. American Scientific Publishers, USA,
18. Lindvall O, Stenevi U (1978) Dopamine and noradrenaline neurons projecting to the septal area in the rat. Cell Tissue Res 190:383-407
19. Markey KA, Kondo H, Shenkman L, Goldstein M (1980) Purification and characterization of tyrosine hydroxylase from a clonal pheochromocytoma cell line. Molecular pharmacology 17:79-85
20. Mirra SS, Heyman A, McKeel D, Sumi SM, Crain BJ, Brownlee LM, Vogel FS, Hughes JP, van Belle G, Berg L (1991) The Consortium to Establish a Registry for Alzheimer's Disease (CERAD). Part II. Standardization of the neuropathologic assessment of Alzheimer's disease. Neurology 41:479-486
21. Montine TJ, Phelps CH, Beach TG, Bigio EH, Cairns NJ, Dickson DW, Duyckaerts C, Frosch MP, Masliah E, Mirra SS, Nelson PT, Schneider JA, Thal DR, Trojanowski JQ, Vinters HV, Hyman BT, National Institute on A, Alzheimer's A (2012) National Institute on Aging-Alzheimer's Association guidelines for the neuropathologic assessment of Alzheimer's disease: a practical approach. Acta neuropathologica 123:1-11. doi:10.1007/s00401-011-0910-3
22. Morales MA, Holmberg K, Xu ZQ, Cozzari C, Hartman BK, Emson P, Goldstein M, Elfvin LG, Hokfelt T (1995) Localization of choline acetyltransferase in rat peripheral sympathetic neurons and its coexistence with nitric oxide synthase and neuropeptides. Proceedings of the National Academy of Sciences of the United States of America 92:11819-11823
23. Nygren LG, Olson L (1977) A new major projection from locus coeruleus: the main source of noradrenergic nerve terminals in the ventral and dorsal columns of the spinal cord. Brain research 132:85-93
24. Palkovits M, Zaborszky L, Feminger A, Mezey E, Fekete MI, Herman JP, Kanyicska B, Szabo D (1980) Noradrenergic innervation of the rat hypothalamus:experimental biochemical and electron microscopic studies. Brain research 191:161-171
25. Samuels ER, Szabadi E (2008) Functional neuroanatomy of the noradrenergic locus coeruleus: its roles in the regulation of arousal and autonomic function part I: principles of functional organisation. Curr Neuropharmacol 6:235-253. doi:10.2174/157015908785777229
26. Schalling M, Seroogy K, Hökfelt T, Chai SY, Hallman H, Persson H, Larhammar D, Ericsson A, Terenius L, Graffi J, et al. (1988) Neuropeptide tyrosine in the rat adrenal gland--immunohistochemical and in situ hybridization studies. Neuroscience 24:337-349
27. Thal DR, Rub U, Orantes M, Braak H (2002) Phases of A beta-deposition in the human brain and its relevance for the development of AD. Neurology 58:1791-1800
28. Theodorsson-Norheim E, Hemsen A, Lundberg JM (1985) Radioimmunoassay for neuropeptide Y (NPY): chromatographic characterization of immunoreactivity in plasma and tissue extracts. Scandinavian journal of clinical and laboratory investigation 45:355-365
29. Theodorsson E, Rugarn O (2000) Radioimmunoassay for rat galanin: immunochemical and chromatographic characterization of immunoreactivity in tissue extracts. Scandinavian journal of clinical and laboratory investigation 60:411-418
30. Toth K, Eross L, Vajda J, Halasz P, Freund TF, Magloczky Z (2010) Loss and reorganization of calretinin-containing interneurons in the epileptic human hippocampus. Brain : a journal of neurology 133:2763-2777. doi:10.1093/brain/awq149
31. Viollet C, Vaillend C, Videau C, Bluet-Pajot MT, Ungerer A, L'Heritier A, Kopp C, Potier B, Billard J, Schaeffer J, Smith RG, Rohrer SP, Wilkinson H, Zheng H, Epelbaum J (2000) Involvement of sst2 somatostatin receptor in locomotor, exploratory activity and emotional reactivity in mice. Eur J Neurosci 12:3761-3770
17

Adori C et al 2015
age gender cause of death clinical neurological symptoms brainstem neuropathology
PMD
Case 1 77 female COPD – Heart failure No neurological symptoms No major alteration 4h
Case 2 61 female Atherosclerosis; Anterior Myocardial infarct
Schizophrenia, no other neurological symptoms
No major alteration 4h
Supplementary Table 1 Clinical data of human cases; the brains were applied for SST2a/TH immunohistochemistry.
18

Adori C et al 2015
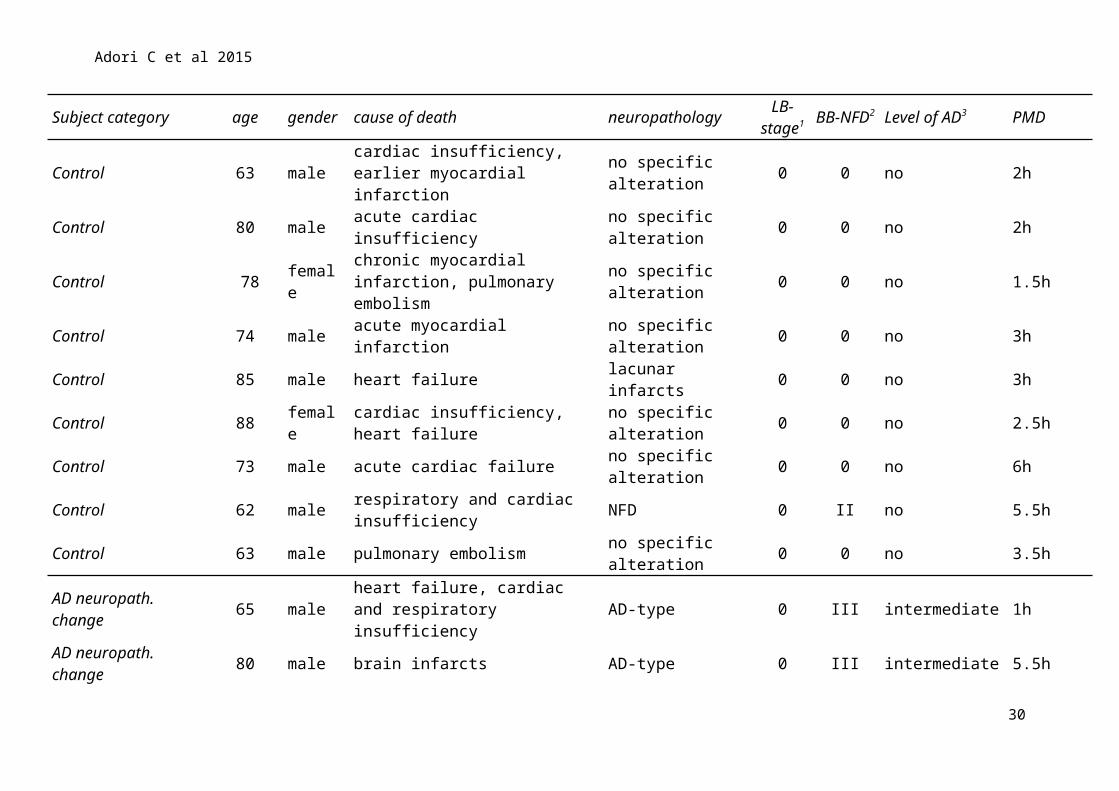
Subject category age gender cause of death neuropathology LB-stage1
BB-NFD2 Level of AD3 PMD
Control 63 male cardiac insufficiency, earlier myocardial infarction no specific alteration 0 0 no 2h
Control 80 male acute cardiac insufficiency no specific alteration 0 0 no 2h
Control 78 female chronic myocardial infarction, pulmonary embolism no specific alteration 0 0 no 1.5h
Control 74 male acute myocardial infarction no specific alteration 0 0 no 3hControl 85 male heart failure lacunar infarcts 0 0 no 3hControl 88 female cardiac insufficiency, heart failure no specific alteration 0 0 no 2.5hControl 73 male acute cardiac failure no specific alteration 0 0 no 6hControl 62 male respiratory and cardiac insufficiency NFD 0 II no 5.5hControl 63 male pulmonary embolism no specific alteration 0 0 no 3.5h
AD neuropath. change 65 male heart failure, cardiac and respiratory insufficiency AD-type 0 III intermediate 1h
AD neuropath. change 80 male brain infarcts AD-type 0 III intermediate 5.5hAD neuropath. change 78 female brain haemorrhage AD-type 0 IV intermediate 5.5hAD neuropath. change 64 male myocardial infarction AD-type 0 III intermediate 6hAD neuropath. change 80 male cardio-respiratory insufficiency AD-type, SVD 3 III intermediate 4.5hAD 72 female acute myocardial infarction AD-type 0 V high 4h
AD 81 female cardiovascular-respiratory insufficiency AD-type 0 VI high 5h
AD 89 female cardiovascular-respiratory insufficiency
AD-type+lacunar infarcts 0 V high 1.5h
AD 86 female cardiovascular-respiratory insufficiency AD-type 0 VI high 4.5h
AD 81 male heart failure, cardiogen shock AD-type 0 VI high 5hAD 83 male respiratory and cardiac insufficiency AD-type 0 VI high 6h
AD 74 male cardiovascular-pulmonary insufficiency AD-type 0 VI high 5.5h
19

Adori C et al 2015
20

Adori C et al 2015
Supplementary Table 2 Clinical and neuropathological data of human cases; the brains were applied for LC micro-punch, a subsequent RNA
extraction, and qPCR analysis. AD: Alzheimer’s disease; SVD: small vessel disease associate with hypertension; LB-stage: Lewy-body
pathology staged according to Braak1 [9]; BB-NFD: neurofibrillary degeneration staged according to Braak and Braak2 [8]; level of AD
represents the ‘‘ABC’’ score for level of AD neuropathologic change3 [21]. All cases with "intermediate" level of AD were associated with Thal
phase 3 Abeta plaque depositions."
21

Adori C et al 2015
Gene Accession no Forward primer Reverse primer Amplicon Size
SSTR2 NM_001050 GAAAAGCAAAGATGTCACAC ATTGAGGTCAAATGGAATGG 169 bpDBH NM_000787 AGGAGATGTGTGTCAACTAC TTGTTGAACCTGTTGATGAG 118 bpMAP2 NM_002374 GAAGATTTACTTACAGCCTCG GGTAAGTTTTAGTTGTCTCTGG 172 bpTUBB3 NM_0006086 GCGTCTACTACAACGAGG ACTCTGACCAAAGATGAAATTG 143 bpGAL NM_015973 GAAGATGACATGAAACCAGG TTGAGATGCAAGAAAGACAG 95 bpGALR3 NM_003614 CCAGAACATTTCACTGGAC AGGAAGATTAGGGCAAAGAC 75 bp-ACTIN NM_001101 CCCAGCCATGTACGTTGCTA TCACCGGAGTCCATCACGAT 65 bpGAPDH NM_002046 CAAATTCCATGGCACCGTC TCTCGCTCCTGGAAGATGGT 62 bp
Supplementary Table 3 Primer sequences used for qPCR. For the amplification of tyrosine hydroxylase (TH), a TaqMan assay
(Hs00165941_m1, Applied Biosystems) was used.
22

Adori C et al 2014
Subject category age gender LB-stage1 BB-NFD2 Amyloid deposit
stage3 PMD
Control 93 male n/a I 0 5hControl 79 female 0 I 0 10hControl 81 female 0 I 0 4hControl 83 male 1 I A 5hControl 79 male 1 I A 6hControl 76 male 0 0 0 7hControl 83 male n/a I B 6hControl 91 female 0 I B 4hControl 83 female 0 I B 5hAD 83 female 0 VI C 5hAD 83 male n/a VI C 6hAD 74 male n/a VI C 8hAD 96 female 0 VI C 5hAD 88 male n/a VI C 5hAD 71 male n/a VI C 7hAD 77 male n/a VI C 7h
Supplementary Table 4 Neuropathological data of human cases; the brains were applied for
tissue microarray immunostaining. LB-stage: Lewy-body pathology staged according to [9]1;
BB-NFD: neurofibrillary degeneration staged according to [8]2; amyloid deposit stages
according to [8]3.
23

Adori C et al 2014
Supplementary Table 5a List and specification of primary antibodies used in the study.
24
Type of antibody Dilution for IHC with TSA+ amplification
Dilution for normal fluorescent IHC
Source Cat. No. or reference
ß-galactosidase (bGAL) Mouse monoclonal 1:20,000 1:2,000 Promega Z3781ß-galactosidase (bGAL) Chicken polyclonal 1:20,000 1:2,000 Abcam AB9361
Rabbit monoclonal 1:100 - Stefan Schulz [12] (UMB1)Tyrosine hydroxylase (TH) Rabbit polyclonal 1:8,000 - Keith E Markey [19]Tyrosine hydroxylase (TH) Sheep polyclonal - 1:500 Millipore/Chemicon AB1542Noradrenaline transporter (NET) Rabbit polyclonal 1:1,000 - Jan Mulder HPA004057Dopamine ß-hydroxylase (DBH) Rabbit polyclonal 1:8,000 - Neuromics RA24600Neuropeptide Y (NPY) Rabbit polyclonal 1:8,000 - Anette Theodorsson [28]
Rabbit polyclonal 1:8,000 1:800 Robert Benoit [6]Rabbit polyclonal 1:8,000 1:800 Elvar Theodorsson [29]Rabbit polyclonal 1:8,000 1:800 Wako 019-19741
Glial fibrillar acidic protein (GFAP) Rabbit polyclonal 1:8,000 1:800 SIGMA G2969Tryptophan hydroxylase (TpH) Sheep polyclonal 1:1,000 1:200 Millipore/Chemicon AB1541Choline-acetyl-transferase (ChAT) Mouse monoclonal 1:5,000 1:500 Boyd K Hartman [22]Dopamin transporter (DAT) Rat polyclonal 1:4,000 - Millipore/Chemicon MAB369Antibody against amyloid fibrils, ‘OC’ Rabbit polyclonal 1:5,000 - Charles Glabe [16]Antibody against A1, ‘82E1’ Mouse monoclonal 1:1,000 - IBL 10326; [15]SMI32 (nonphosphorilated neurofilament H) Mouse monoclonal - 1:2,000 Sternberger monoclonals SMI32P
Adori C et al 2014
Application Secondary antibody concentration Source/cat. no.
IHC with TSA+ amplification Swine anti rabbit IgG-HRP 1:200 DAKO, P0399Donkey anti mouse IgG-HRP 1:1,000 Jackson Immunoresearch, 713-035-150Donkey anti rat IgG-HRP 1:200 Jackson Immunoresearch, 712-036-150Donkey anti chicken IgG-HRP 1:200 Jackson Immunoresearch, 703-035-155Rabbit anti sheep-HRP 1:200 DAKO, P0163
Normal fluorescent IHC Donkey anti-rabbit IgG-rhodamine red 1:80 Jackson Immunoresearch, 711-296-152Donkey anti-mouse IgG-Cy3 1:150 Jackson Immunoresearch, 715-165-151Donkey anti-sheep IgG-rhodamine red 1:80 Jackson Immunoresearch, 713-295-147Donkey anti-chicken IgG -rhodamine red 1:80 Jackson Immunoresearch, 703-296-155Donkey anti-mouse-FITC 1:80 Jackson Immunoresearch, 715-095-150Donkey anti-chicken IgG-FITC 1:80 Jackson Immunoresearch, 703-095-155
Supplementary Table 5b List and specification of secondary antibodies used in the study.
25

Adori C et al 2014
Supplementary Table 6 Detailed statistical data of ANOVA analyses on Sstr2-/- mice and their WT littermates. Significant effects are indicated
with bold typing. Results of Post-hoc analyses are provided in the Results (in appropriate figures + figure legends).
26
Subject of analysis Analysis Variables Parameters F+df values P values (main effect)
HPLC measurement of NA levels 3-wayANOVA
age (2w, 4m); region (FPCtx, CPu, Hippo); genotype (WT, Sstr2-/-)
Age F(1,48) = 192.3218 P < 0.000001Region F(2,48) = 12.9269 P = 0.000032Genotype F(1,48) = 99.0746 P < 0.000001Age*region F(2,48) = 14.4726 P = 0.000012Age*genotype F(1,48) = 65.0154 P < 0.000001Region*genotype F(2,48) = 16,4340 P = 000004Age*region*genotype F(2,48) = 9.7222 P = 0.000285
Noradrenerg fiber density measurements in the FPCtx 2-wayANOVA
age (2w, 1m, 2m, 4m, 8m); genotype (WT, Sstr2-/-)
Age F(4,25) = 3.713 P = 0.016654Genotype F(1,25) = 89.535 P < 0.000001Age*genotype F(4,25) = 5.269 P = 0.003221
Counting of ‘individual swollen varicosities/intervaricose connections’ in Sstr2-/--s
One-way ANOVA
age (2w, 1m, 2m, 4m, 8m) Age F(4,12) = 13.9102 P = 0.000185
Counting of ‘fiber clusters’ in Sstr2-/--s One-way ANOVA
age (2w, 1m, 2m, 4m, 8m) Age F(4,12) = 16.82961 P = 0.000073
Adori C et al 2014
Examined gene Ct values normalized for: F+df values
P values (main effect)
SSTR2 TUBB3 F(2,16)=4.67 P=0.0279-ACTIN F(2,16)=8.88 P=0.0025GAPDH F(2,16)=3.81 P=0.0477
MAP2 TUBB3 F(2,16)=5.58 P=0.0144-ACTIN F(2,16)=11.35 P=0.0006GAPDH F(2,16)=7.68 P=0.0036
TH TUBB3 F(2,16)=1.26 P=0.3091-ACTIN F(2,16)=0,24 P=0.786GAPDH F(2,16)=4.07 P=0.0372
DBH TUBB3 F(2,16)=0.019 P=0.9809-ACTIN F(2,16)=0.852 P=0.4429GAPDH F(2,16)=0.15 P=0.8602
GAL TUBB3 F(2,16)=0.22 P=0.8010-ACTIN F(2,16)=1,963 P=0.167GAPDH F(2,16)=0.07 P=0.9323
GALR3 TUBB3 F(2,16)=1.75 P=0.211-ACTIN F(2,16)=0.72 P=0.5025GAPDH F(2,16)=3.52 P=0.0528
Supplementary Table 7 Detailed statistical data of one-way ANOVA analyses on human
qPCR data (fold changes). Variables: patient group; control, AD Braak III-IV, AD Braak V-
VI. Significant effects are indicated with bold typing. Results of Post-hoc analyses are
provided in Figure 2 legend.
27

Adori C et al 2014
Supplementary Figure 1
28

Adori C et al 2014
Supplementary Figure 2
29
Adori C et al 2014
Supplementary Figure 3
30