statewide travel demand models - ncdot model user groups... · statewide travel demand models:...
TRANSCRIPT

Statewide Travel Demand Models:Statewide Travel Demand Models:Applications & BenefitsApplications & Benefits
North Carolina Model Users Group North Carolina Model Users Group May 13, 2009May 13, 2009

Presentation OverviewPresentation Overview
• Statewide Modeling History/Background
• Application of statewide models• Benefits
Statewide Modeling Statewide Modeling History/BackgroundHistory/Background
• 1st STDM – KY developed in 1976 in Planpac, supported by extensive data collection
• Next generation – the ISTEA/corridor study inspired about 10 models including KY, MI, IN, WI
• Explosion of TDMs in 21st century –close to 30 now
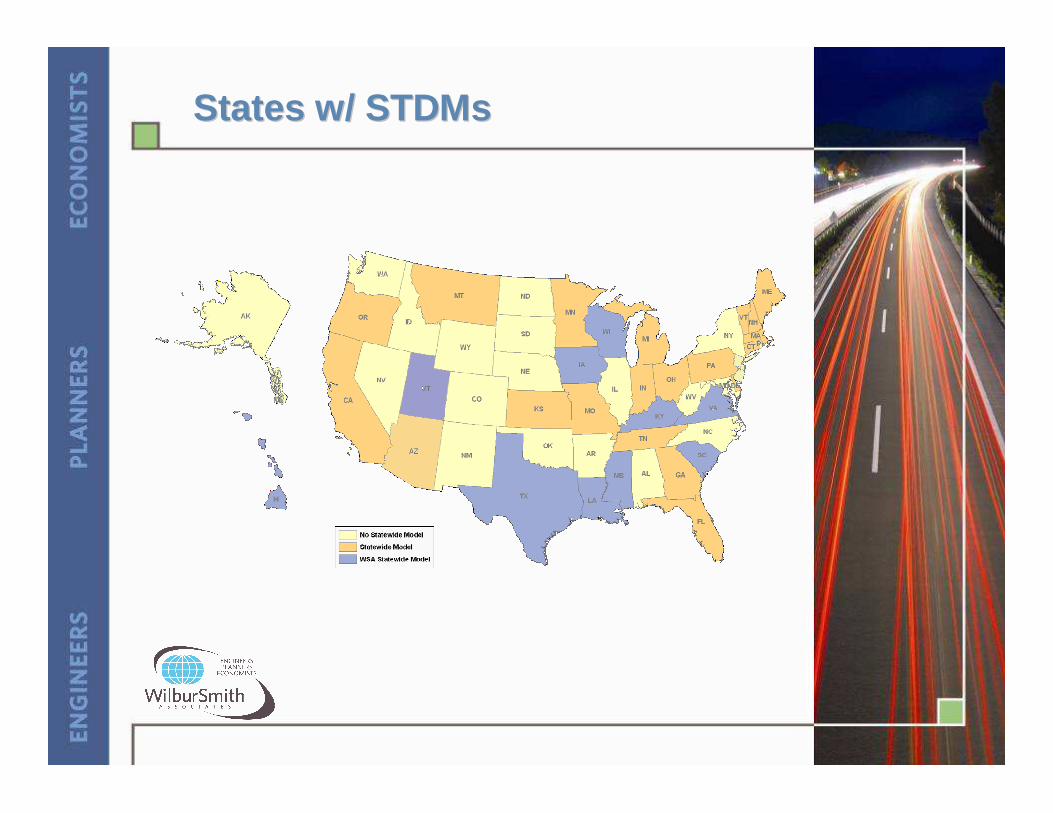
States w/ States w/ STDMsSTDMs
STDM MilestonesSTDM Milestones
• 1999 Statewide Modeling Conferencehttp://www.fhwa.dot.gov/planning/statewide/swtravel.pdf
• Formation of TRB Statewide Travel Forecasting subcommitteehttp://www.uwyo.edu/statewideplanning/StatewideForecasting.html
• 2004 Peer Exchange in Long Boat Key: e-circular:http://onlinepubs.trb.org/Onlinepubs/circulars/ec075.pdf
• Statewide Modeling synthesis:http://onlinepubs.trb.org/Onlinepubs/nchrp/nchrp_syn_358.pdf
• 2008 Statewide modeling track at TRB Atlanta statewide planning conference

Statewide Modeling ApplicationsStatewide Modeling Applications
• Corridor studies• Urban model support• Freight studies• Toll studies• Tool development• LRTPs• Emergency/evacuation analysis• HSR• Systems analysis• Special problems

STDM Applications: Corridor StudiesSTDM Applications: Corridor Studies
• Statewide models can be used to study large multi-regional corridors• Long corridors may extend beyond MPO
model boundaries• Interstates are impacted by a high
number of long distance trips• Examples of corridors studied by
statewide models include: I-66, I-69, I-10, I-74 to I-71 and Memphis River Bridge study.
• Possible NC corridors: I-40, I-85, I-95

II--66 Corridor in KY66 Corridor in KY
II--66 Corridor66 Corridor
• ISTEA high priority corridor (1991 – one of 21 corridors)
• Original nation-wide corridor had a B/C < 1.00• KY Congressman Hal Rogers persuade Congress
to fund a KY-only version of I-66• Impetus to update KY STM in 1996-1998• Model in MINUTP, used feedback to REMI model
for generating employment & population• KY corridor makes heavy use of existing roads• Somerset Bypass section is under construction• I-66 protestors in Lexington Office

II--69 Corridor69 Corridor
II--69 Corridor69 Corridor
• ISTEA corridor, reaches between Indianapolis to San Antonio
• Had national B/C > 1.00• Each state having independent studies• KY using existing Parkways & upgrading (better
ramps, new signs)• I-69 only generated about 3,000 additional
trips/day (beyond existing parkways)• All Western KY projects were re-evaluated to
account for I-69 impact• Flaw of I-69 studies to date have been lack of
analytical connectivity

II--71 to I71 to I--74 Corridor74 Corridor
II--71 to I71 to I--74 Corridor74 Corridor
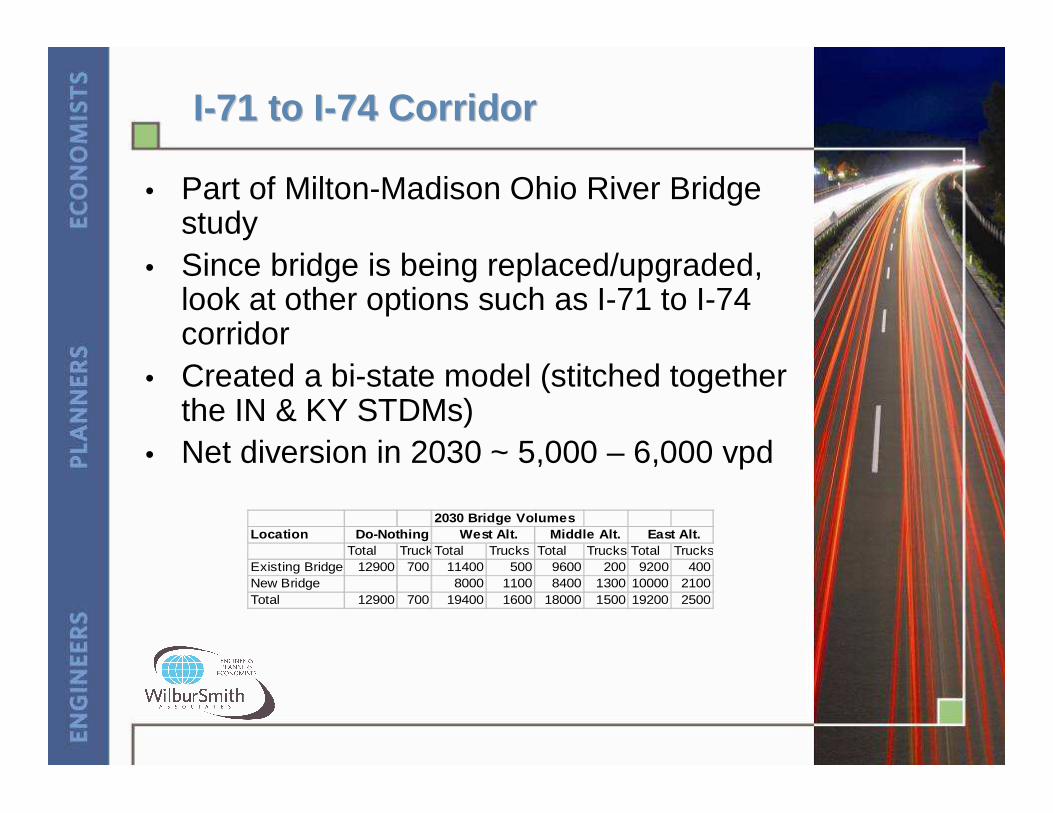
• Part of Milton-Madison Ohio River Bridge study
• Since bridge is being replaced/upgraded, look at other options such as I-71 to I-74 corridor
• Created a bi-state model (stitched together the IN & KY STDMs)
• Net diversion in 2030 ~ 5,000 – 6,000 vpd
2030 Bridge VolumesLocation Do-Nothing West Alt. Middle Alt. East Alt.
Total TrucksTotal Trucks Total Trucks Total TrucksExisting Bridge 12900 700 11400 500 9600 200 9200 400New Bridge 8000 1100 8400 1300 10000 2100Total 12900 700 19400 1600 18000 1500 19200 2500
New Memphis BridgeNew Memphis Bridge

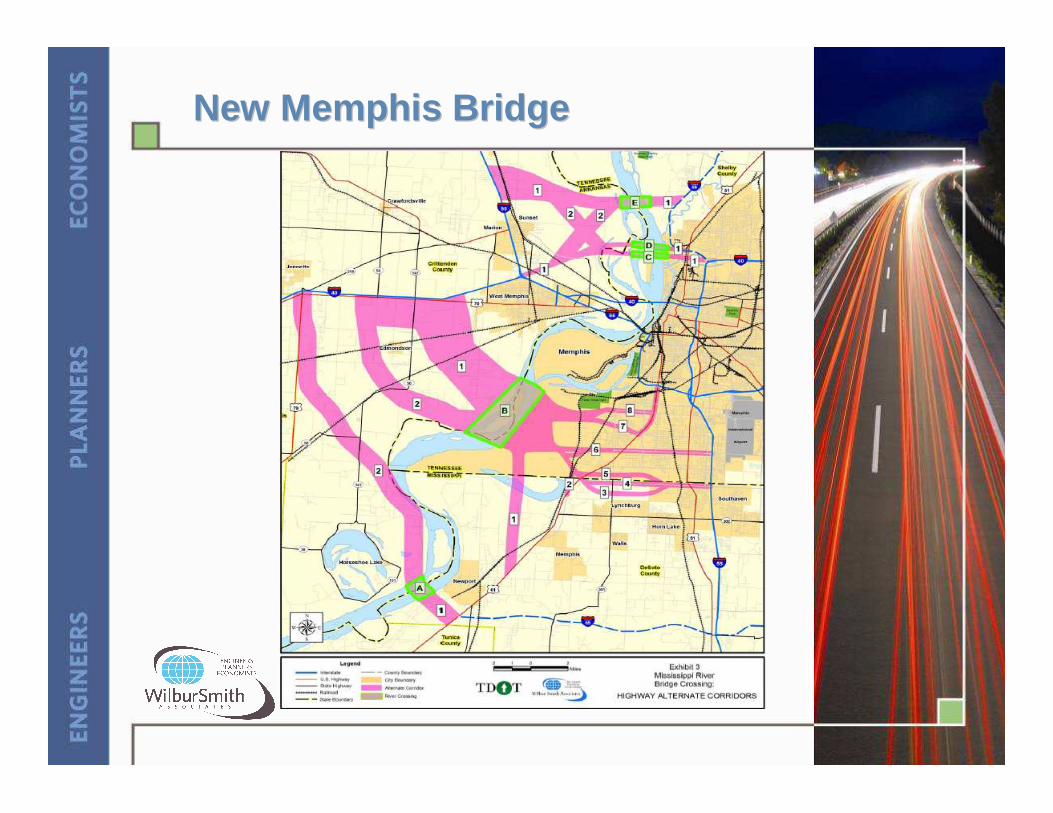
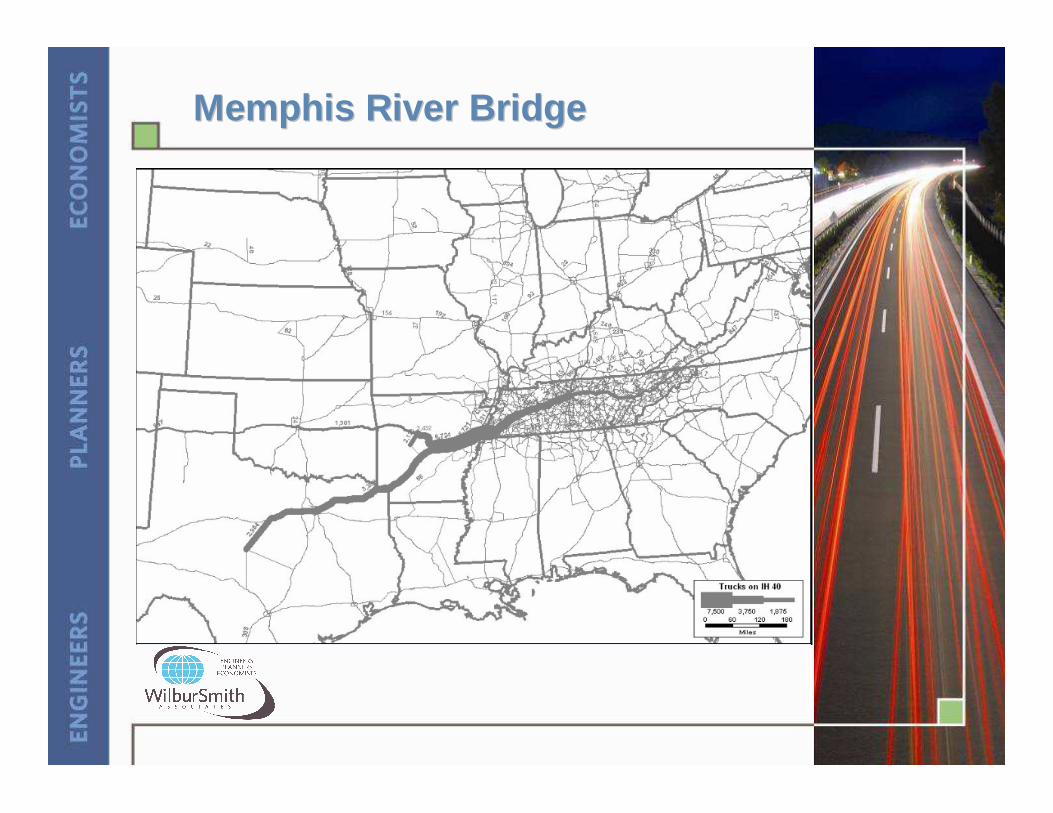
New Memphis River Bridge New Memphis River Bridge
• Need to look at numerous bridge alternatives• TN STDM was used because:
• Existing Memphis model had a very week West Memphis component
• Needed to assess impact of new I-69 impact
• Disaggregate zones, no validation, select link analysis, VMT/VHT production

New Memphis River Bridge New Memphis River Bridge
Memphis River BridgeMemphis River Bridge

II--10 Corridor10 Corridor

II--10 Corridor Study10 Corridor Study
• Earlier I-10 study between CA & FL• AZ DOT looking at alternatives in 110-mile
corridor roughly between Phoenix and Tucson
• No STDM available, therefore used sketch planning techniques (manual gravity)
• Forecasts were “good enough” to warrant another more detailed study

II--10 Corridor: AZ STDM Network10 Corridor: AZ STDM Network
II--10/AZ STDM10/AZ STDM
• Lessons learned:
• Get the right tool for the job• Figure out what is needed and work
backwards• In this case
• Need more QA/QC (check out CCs)
• Need commodity flow data to handle truck data better
• Use greater network detail and TAZ detail
STDM Applications: Urban Model STDM Applications: Urban Model Support and DevelopmentSupport and Development
• Statewide models can support the development and maintenance of urban models
• Forecast external trips for MPO models• Develop freight movements through the
MPO area • Statewide models can also be a valuable
resource for regional model development
• Network extension• TAZ system expansion
• Statewide models can be useful to create subarea models for more detailed analysis

Urban SupportUrban Support

Urban SupportUrban Support
• Determination of EE & EI trips for Lauderdale County, MS model using MS STM
• Created trip matrix from STDM for Lauderdale County
• Calculated EE trips
• STM has 21 county-level EE stations• More accurate on higher level ADT
roads• Compared to NCHRP 365 procedures

Urban Support: Truck TripsUrban Support: Truck Trips

Urban Support: Truck TripsUrban Support: Truck Trips
• LAMTPO model (Morristown, TN)• EE truck trips taken from TN STDM• Internal truck trips used QRS Freight• Relatively easy to enhance with more data
collection & validation

STDM Applications: Freight ModelingSTDM Applications: Freight Modeling
• The unique characteristics of freight make it ideally suited to analysis by a statewide model• Freight trips can be extremely long• National networks can make freight entry
into the State more precise• Truck and commodity models can take
advantage of national databases• Some models make use of or are looking
into intermodal freight networks (truck, rail, pipeline, airway, sea lanes, etc.)
• Truck divergence to rail
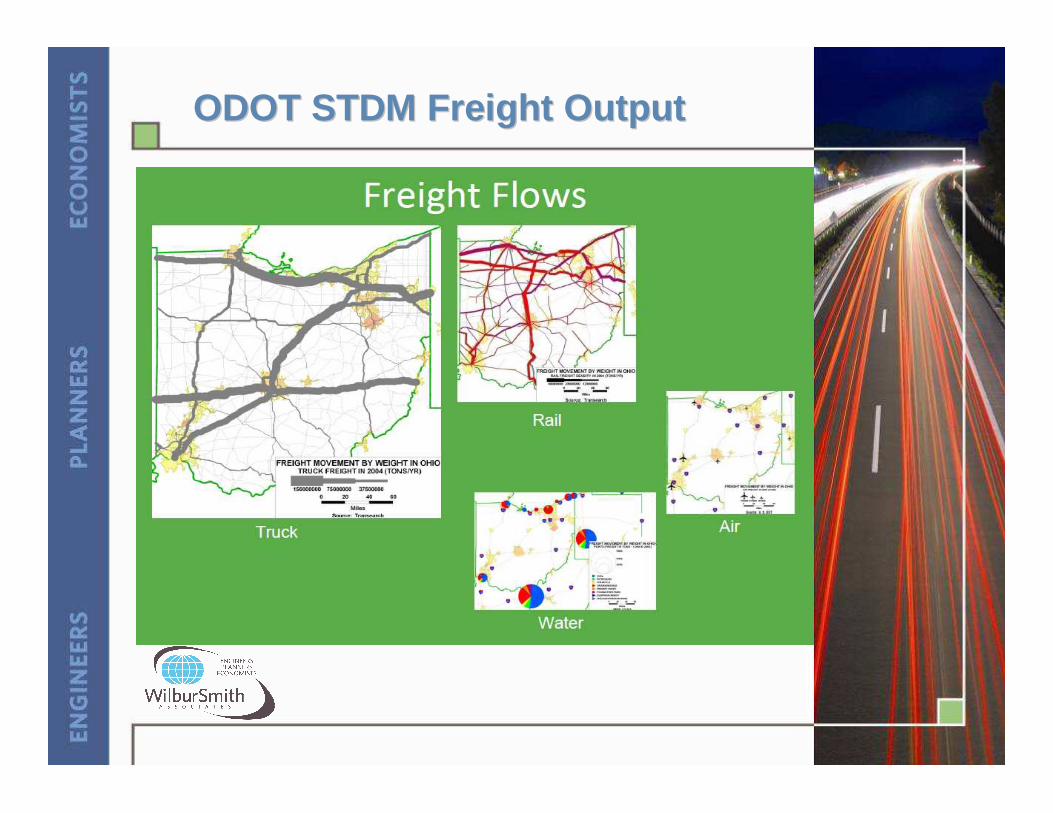
ODOT STDM Freight OutputODOT STDM Freight Output

ODOT STDM Freight OutputODOT STDM Freight Output
STDM Applications: Toll ModelingSTDM Applications: Toll Modeling
• Toll feasibility modeling and revenue forecasting can be enhanced by a statewide model
• Estimates travel demand for rural segments and potential toll bridges
• Analyze potential expanded statewide toll systems
• Some future toll corridors may be completely beyond existing model boundaries

Texas Statewide Analysis Model Texas Statewide Analysis Model ApplicationApplication
Preliminary & Reasonable Corridor Alternatives
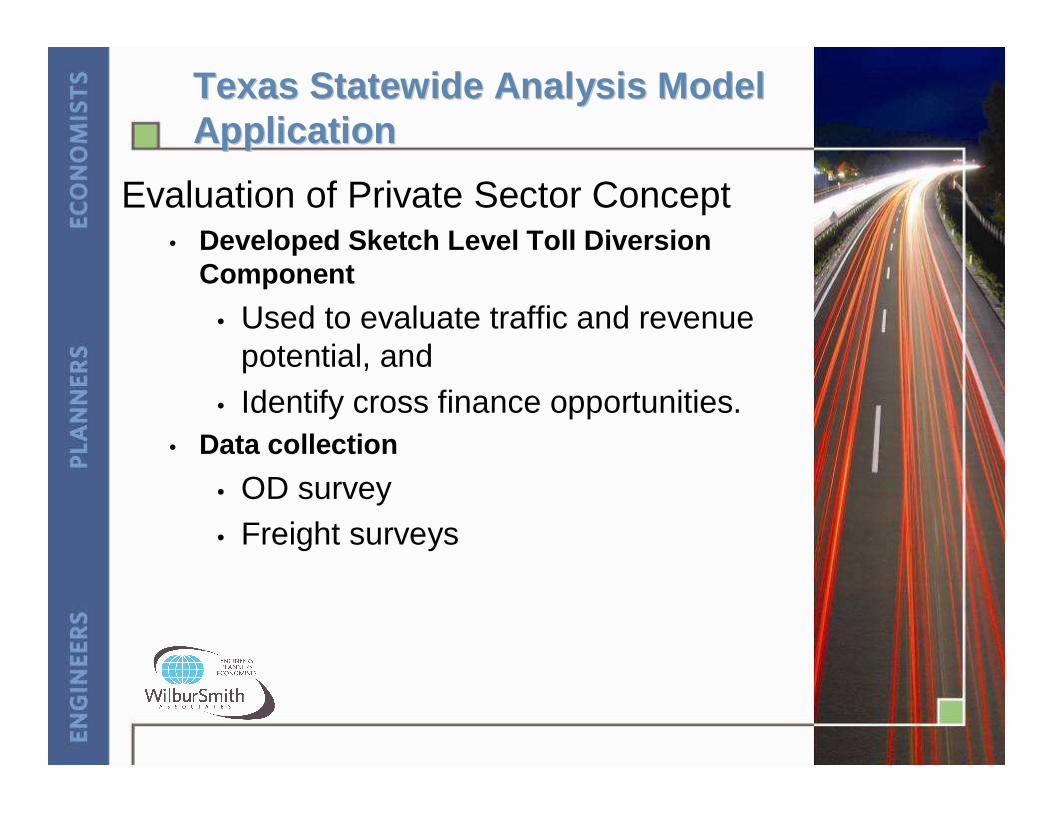
Texas Statewide Analysis Model Texas Statewide Analysis Model ApplicationApplication
Evaluation of Private Sector Concept• Developed Sketch Level Toll Diversion
Component
• Used to evaluate traffic and revenue potential, and
• Identify cross finance opportunities.• Data collection
• OD survey• Freight surveys
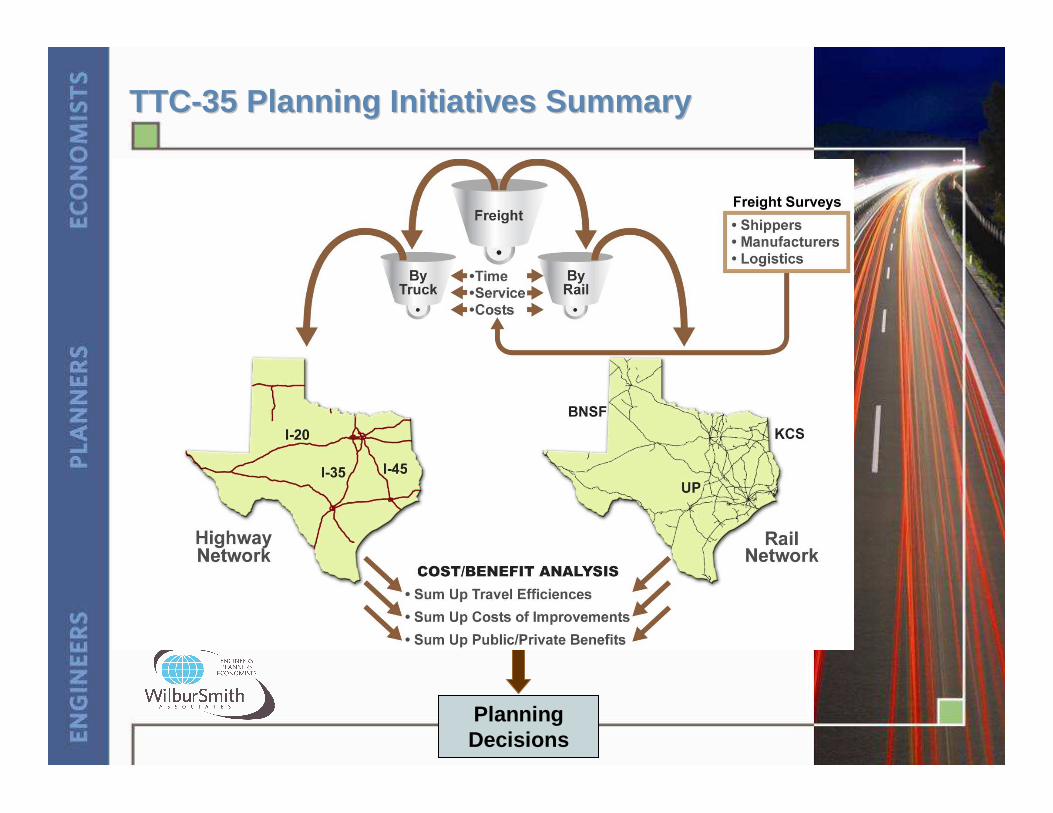
TTCTTC--35 Planning Initiatives Summary35 Planning Initiatives Summary
Planning Decisions

STDM Applications: Information STDM Applications: Information Tools DevelopmentTools Development
• Statewide model data can be used to develop information systems and analysis tools
• Statewide models have extensive input and output data at the statewide level
• Commodity Information System can identify freight generation and flows
• User benefits analyses can estimate the economic benefits of program mixes on a regional, multi-regional, and statewide scale

Integrated Mapping/GISIntegrated Mapping/GISIntegrated Mapping/GIS
View and Analyze Scenario Modeling ResultsView and Analyze Scenario Modeling ResultsView and Analyze Scenario Modeling Results
Productions/ Attractions
Zonal Movements
Network Flows
GIS Services
STDM Applications: Project STDM Applications: Project PrioritizationPrioritization
• These models can also assist in prioritizing statewide systems plans
• Critical capacity deficiencies can be identified and compared throughout the state
• Improvement program project mixes can be tested and compared simultaneously throughout the state
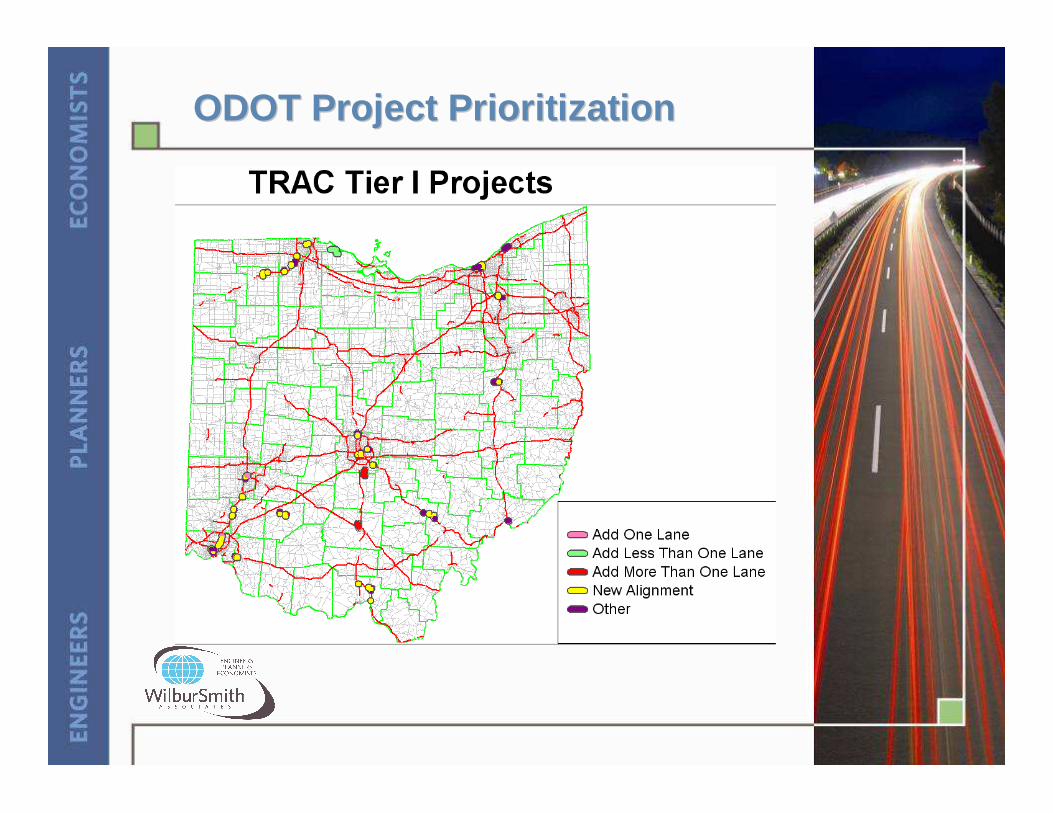
ODOT Project PrioritizationODOT Project Prioritization
STDM Applications: Emergency STDM Applications: Emergency AnalysisAnalysis
• Many emergency scenarios have impacts which extend beyond the immediate urban area
• Evacuation models can use statewide models as a starting point
• Measure impacts to travel due to a catastrophic event
• Bridge collapse
• Rockslide
• Road closures due to multi-day forest fire events
Florida Evacuation StudyFlorida Evacuation Study
• As a peninsula, Florida can expect a hurricane to approach from any direction
• Every region in Florida needs to be able to accurately estimate clearance times for evacuations
• Growth Management legislation requires a consistent methodology and data set throughout Florida
• Statewide model used as the foundation for the evacuation highway network
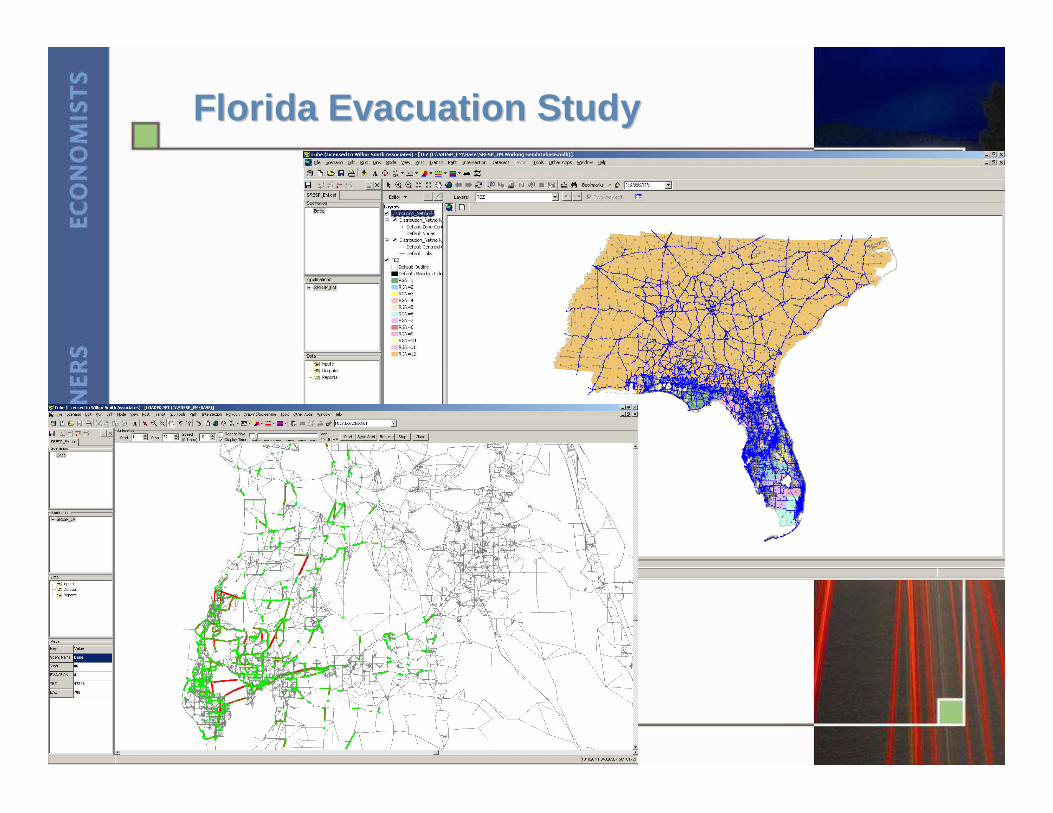
Florida Evacuation StudyFlorida Evacuation Study
Systems AnalysisSystems Analysis
• Evolving/new STDM applications include:
• Air Quality/carbon footprint scenario analysis
• Travel time indices (the TTI measures such as travel time index)
• VMT analysis – may be useful combined with an economic tool tie-in
STDM Applications: Passenger RailSTDM Applications: Passenger Rail
• Passenger rail systems can be modeled
• High Speed Rail corridors can run the length of an entire state and/or pass through multiple states
• Commuter Rail corridors are usually regional, but may also be interregional
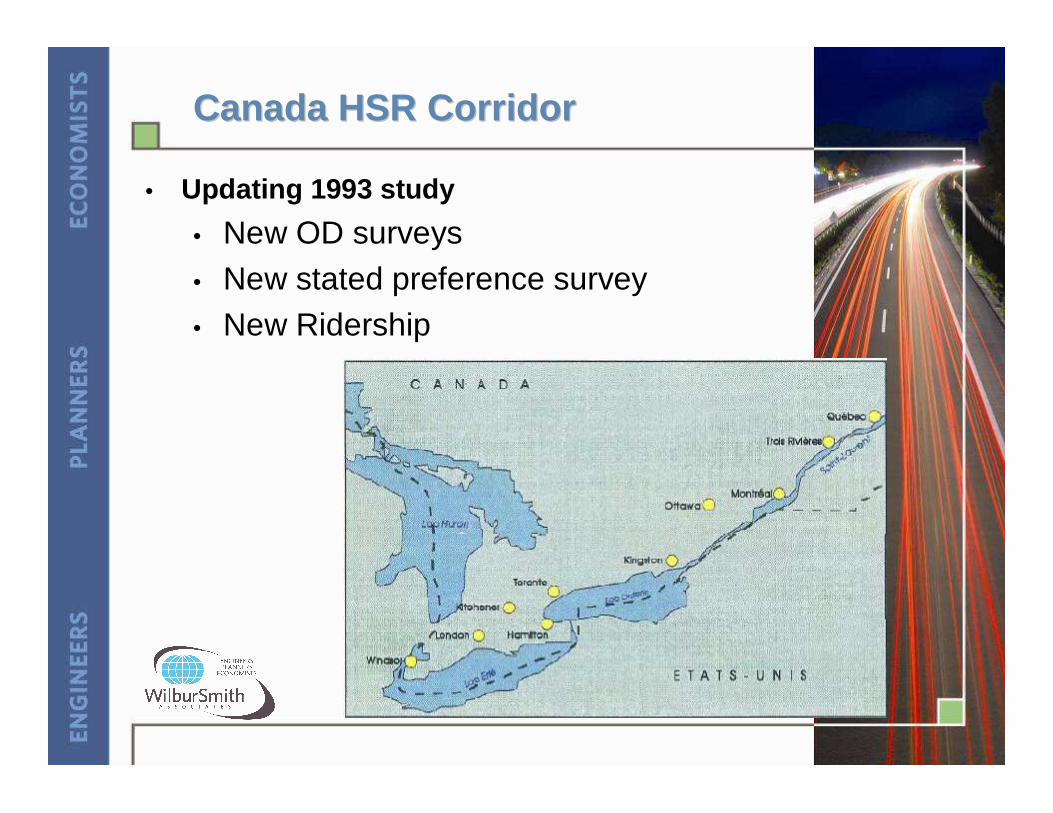
Canada HSR CorridorCanada HSR Corridor
• Updating 1993 study
• New OD surveys• New stated preference survey• New Ridership

Canada HSR NetworkCanada HSR Network
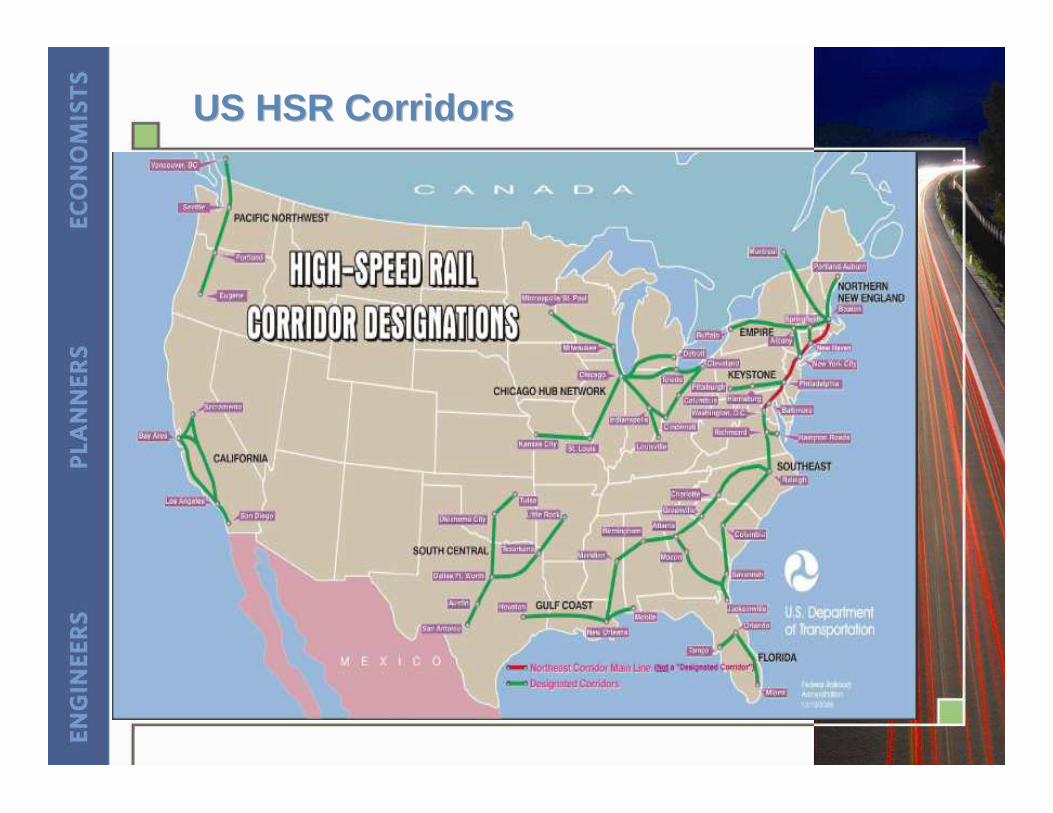
US HSR CorridorsUS HSR Corridors
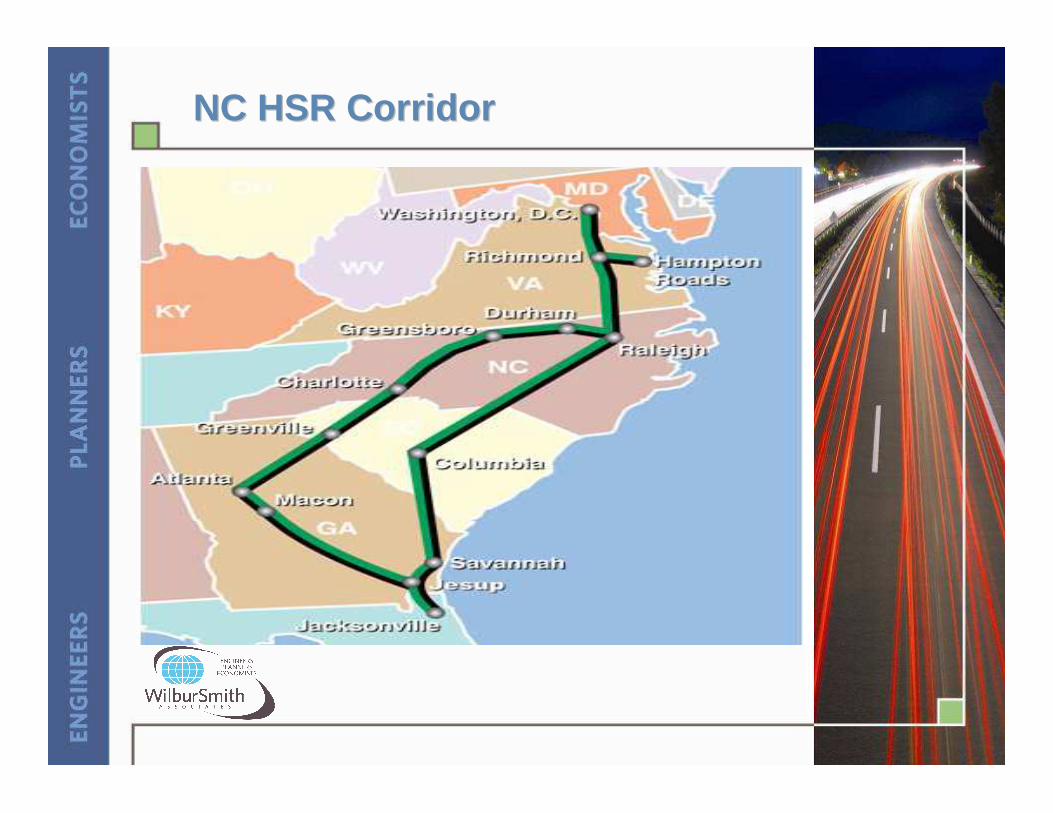
NC HSR CorridorNC HSR Corridor

NC HSR Corridor InfoNC HSR Corridor Info
• Overview• Southeast High-Speed Rail Corridor consists of a
number of segments covering all the South Atlantic States Transportation have begun to implement on an incremental basis.
• Plans show that with up to 110 mph speeds, trip times of two hours (Washington-Richmond) and four and one-half hours (Richmond-Charlotte) would be feasible.
• Status• Virginia and North Carolina, together with the FHWA
and FRA, in October 2002 completed a Tier I Environmental Impact Statement (EIS) and selected a route from Washington, DC to Charlotte,
• NC employing the abandoned CSX “S” line between Petersburg, VA, and Norlina, NC.
• Pat Simmons, Director of NC DOT Rail Division is the point person.
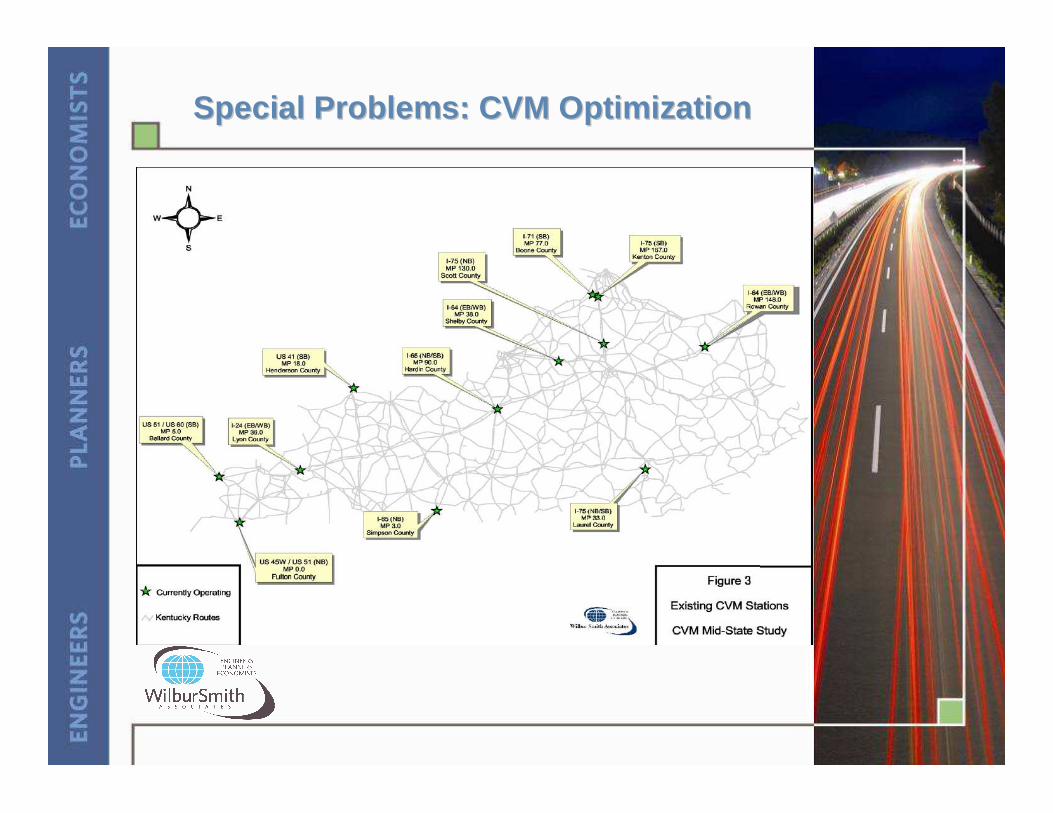
Special Problems: CVM OptimizationSpecial Problems: CVM Optimization
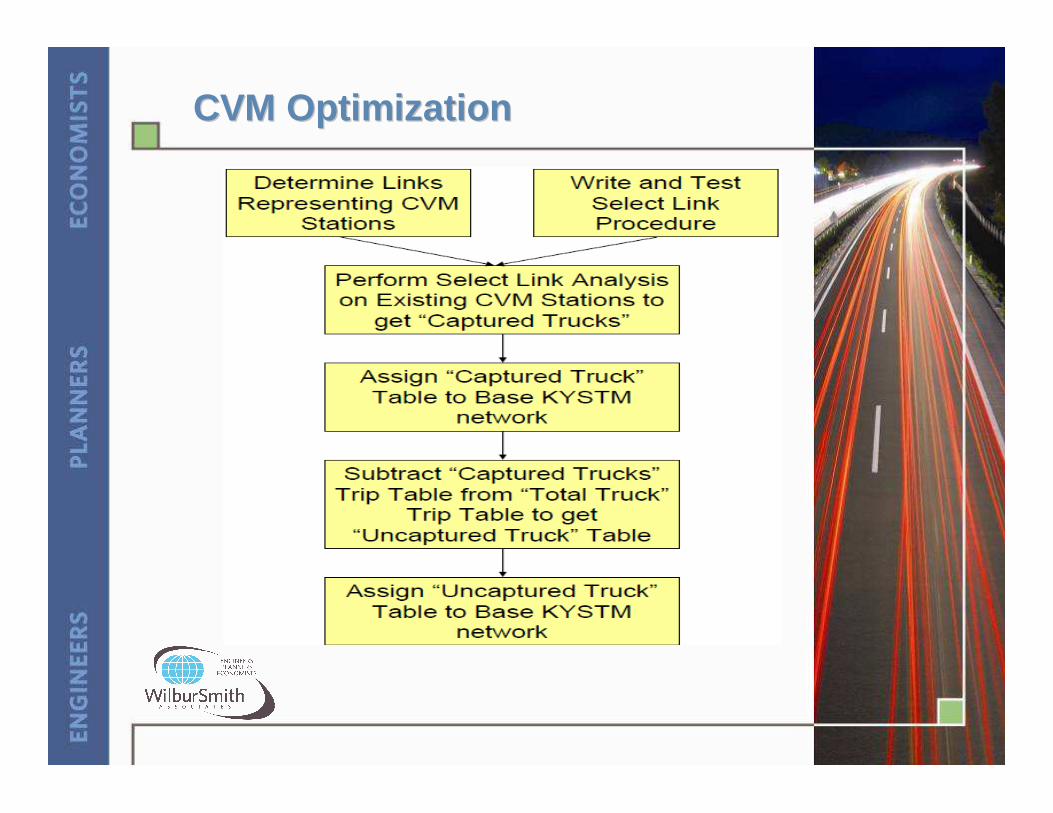
CVM OptimizationCVM Optimization

CVM OptimizationCVM Optimization
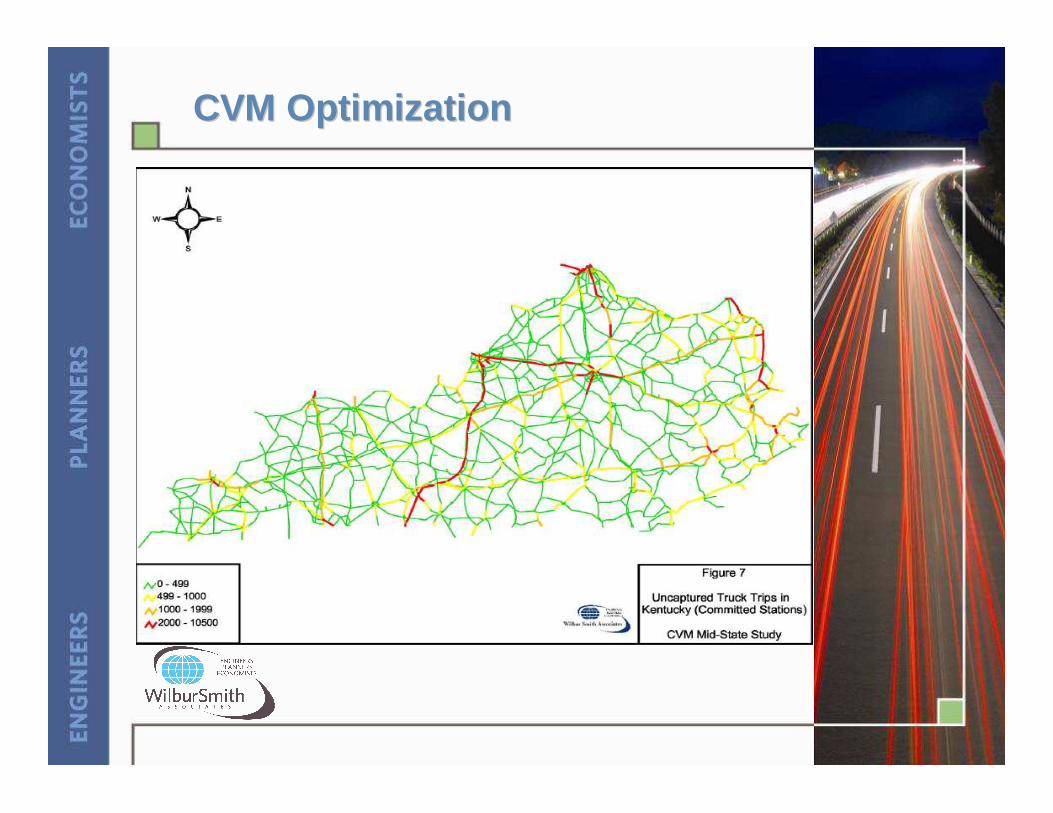
CVM OptimizationCVM Optimization
STDM BenefitsSTDM Benefits
• Statewide model benefits include:
• Comprehensive modeling data at a statewide level
• Socioeconomic Data• Highway Networks
• Ability to measure flows throughout the state and even outside the state
• County to county
• City to city• MPO to MPO
STDM BenefitsSTDM Benefits
• Statewide model benefits (cont.):
• Captures long distance travel behavior• Freight
• Tourists• Pass through trips
• Can incorporate data from neighboring states
• Fills in the gaps between urban area models for long corridors
• Can create subarea models as needed

STDM BenefitsSTDM Benefits
• Statewide model benefits (cont.):
• Statewide trip tables can be used for passenger rail analysis
• Can include variable target years so that scenario year data can be interpolated on the fly for any year
• Relatively high levels of accuracy for inter-urban segments of major arterials and freeways
• Captures rural trip making activity

STDM BenefitsSTDM Benefits
• Cost of STDM development and maintenance is a very small part of major project costs.
• $1,000,000 - $2,000,000• There really is not a viable alternative for the
analysis of:
• Projects that border other states• Include long distance truck trips• Have intercity corridors.

STDM ConsSTDM Cons
• Statewide model Cons include:
• Lower levels of accuracy in the urban areas and on lower order facilities
• May require extensive data collection efforts depending on what is desired
ConclusionConclusion
• STDMs have a wide range of potential applications.
• STDMs have many benefits and are cost effective.
• Questions & comments:[email protected] & [email protected]