statewide data standards to support current and … · final project report . ... like to thank hal...
TRANSCRIPT

STATEWIDE DATA STANDARDS TO SUPPORT CURRENT AND FUTURE
STRATEGIC PUBLIC TRANSIT INVESTMENT
Final Project Report
PROJECT SPR 803


STATEWIDE DATA STANDARDS TO SUPPORT CURRENT AND FUTURE STRATEGIC PUBLIC TRANSIT INVESTMENT
Final Project Report
PROJECT SPR 803
by
J. David Porter, PhD, Phillip Carleton, Sylvan Hoover, Ben Fields School of Mechanical, Industrial and Manufacturing Engineering
Oregon State University Corvallis, Oregon 97331
for
Oregon Department of Transportation Research Section
555 13th Street NE, Suite 1 Salem OR 97301
and
Federal Highway Administration 1200 New Jersey Avenue SE
Washington, DC 20590
April 2018


i
Technical Report Documentation Page
1. Report No.FHWA-OR-RD-18-13
2. Government Accession No. 3. Recipient’s Catalog No.
4. Title and SubtitleStatewide Data Standards to Support Current and Future StrategicPublic Transit Investment
5. Report Date
April 2018
6. Performing Organization Code
7. Author(s)J. David Porter, PhD, Phillip Carleton, Sylvan Hoover, Ben FieldsSchool of Mechanical and Industrial Engineering204 Rogers Hall Oregon State University, Corvallis, OR 97331
8. Performing Organization Report No.
9. Performing Organization Name and AddressOregon Department of TransportationResearch Section555 13th Street NE, Suite 1Salem, OR 97301
10. Work Unit No. (TRAIS)
11. Contract or Grant No.SPR 803
12. Sponsoring Agency Name and AddressOregon Dept. of TransportationResearch Section and Federal Highway Admin. 555 13th Street NE, Suite 1 1200 New Jersey Ave, SE Salem, OR 97301 Washington, DC 20590-0003
13. Type of Report and PeriodCovered
Final Report
14. Sponsoring Agency Code
15. Supplementary Notes
16. AbstractSignificant progress has been made in recent years in reporting and using public transit service data. With the creation and widespread use of the General Transit Feed Specification (GTFS) data standard, there has been a significant increase in the functionality and enhancements to the utility of transit service data (e.g., GTFS-realtime, Google Maps transit, NextBus, Remix, etc.). While these advancements have been instrumental in advancing the understanding and usage of transit service data, the utility of public transit ridership data has lagged behind due to the lack of a standard data format with which to store and report the information. To address this shortcoming and to improve the value of the massive amounts of ridership data already being collected, this research has developed a new public transit ridership data standard called GTFS-ride. GTFS-ride is the result of a close collaboration among the Oregon Department of Transportation, Oregon State University, and many stakeholders in the public transit sector. In addition to the development of GTFS-ride, this research has yielded a suite of web-based software tools to support its initial implementation and use. 17. Key WordsRidership; data standard
18. Distribution Statement
19. Security Classification (ofthis report)
Unclassified
20. Security Classification(of this page)Unclassified
21. No. of Pages106
22. Price
Technical Report Form DOT F 1700.7 (8-72) Reproduction of completed page authorized Printed on recycled pap

ii

iii
SI* (MODERN METRIC) CONVERSION FACTORS APPROXIMATE CONVERSIONS TO SI UNITS APPROXIMATE CONVERSIONS FROM SI UNITS
Symbol When You Know
Multiply By To Find Symbol Symbol When You
Know Multiply
By To Find Symbol
LENGTH LENGTH in inches 25.4 millimeters mm mm millimeters 0.039 inches in ft feet 0.305 meters m m meters 3.28 feet ft yd yards 0.914 meters m m meters 1.09 yards yd mi miles 1.61 kilometers km km kilometers 0.621 miles mi
AREA AREA
in2 square inches 645.2 millimeters squared mm2 mm2 millimeters squared 0.0016 square inches in2
ft2 square feet 0.093 meters squared m2 m2 meters squared 10.764 square feet ft2 yd2 square yards 0.836 meters squared m2 m2 meters squared 1.196 square yards yd2 ac acres 0.405 hectares ha ha hectares 2.47 acres ac mi2 square miles 2.59 kilometers squared km2 km2 kilometers squared 0.386 square miles mi2
VOLUME VOLUME fl oz fluid ounces 29.57 milliliters ml ml milliliters 0.034 fluid ounces fl oz gal gallons 3.785 liters L L liters 0.264 gallons gal ft3 cubic feet 0.028 meters cubed m3 m3 meters cubed 35.315 cubic feet ft3 yd3 cubic yards 0.765 meters cubed m3 m3 meters cubed 1.308 cubic yards yd3
NOTE: Volumes greater than 1000 L shall be shown in m3.
MASS MASS oz ounces 28.35 grams g g grams 0.035 ounces oz lb pounds 0.454 kilograms kg kg kilograms 2.205 pounds lb
T short tons (2000 lb) 0.907 megagrams Mg Mg megagrams 1.102 short tons (2000 lb) T
TEMPERATURE (exact) TEMPERATURE (exact)
°F Fahrenheit (F-32)/1.8 Celsius °C °C Celsius 1.8C+32 Fahrenheit °F
*SI is the symbol for the International System of Measurement

iv

v
ACKNOWLEDGEMENTS
The authors would like to thank the Rail and Public Transit Section and the Research Section of the Oregon Department of Transportation (ODOT) for their support of this project. We would like to thank Hal Gard (project champion) and the members of the project Technical Advisory Committee Matthew Barnes, Jamey Dempster, Jin Ren, Kathy Holmes, Grant Humphries, and Doug Pilant. Finally, we would also like to thank Josh Roll of the ODOT Research Section for managing the project.
DISCLAIMER
This document is disseminated under the sponsorship of the Oregon Department of Transportation and the United States Department of Transportation in the interest of information exchange. The State of Oregon and the United States Government assume no liability of its contents or use thereof.
The contents of this report reflect the view of the authors who are solely responsible for the facts and accuracy of the material presented. The contents do not necessarily reflect the official views of the Oregon Department of Transportation or the United States Department of Transportation.
The State of Oregon and the United States Government do not endorse products of manufacturers. Trademarks or manufacturers’ names appear herein only because they are considered essential to the object of this document.
This report does not constitute a standard, specification, or regulation.

vi

vii
TABLE OF CONTENTS
1.0 EXECUTIVE SUMMARY .............................................................................. 1
2.0 INTRODUCTION ............................................................................................ 7
2.1 REPORT OBJECTIVE AND AUDIENCE .................................................................... 7
2.2 REPORT ORGANIZATION .......................................................................................... 8
3.0 LITERATURE REVIEW AND AGENCY SURVEY ................................... 9
3.1 STATE OF THE ART REVIEW .................................................................................... 9
3.2 STATE OF THE PRACTICE REVIEW ....................................................................... 17
4.0 DEVELOPMENT OF THE RIDERSHIP DATA STANDARD ................. 35
4.1 MAJOR COMPONENTS OF GTFS-RIDE ................................................................. 35
4.2 ITERATIVE UPDATES OF GTFS-RIDE ................................................................... 38
4.3 FINAL DRAFT RELEASE OF GTFS-RIDE .............................................................. 38
4.4 GTFS-RIDE EXTRA COMPONENTS AND DOCUMENTATION........................... 41
5.0 DEVELOPMENT OF SOFTWARE SUPPORT TOOLS .......................... 43
5.1 DEVELOPING TECHNICAL AND FUNCTIONAL REQUIREMENTS ................. 43
5.2 DEVELOPING THE WEB-BASED SOFTWARE SUITE ......................................... 43
6.0 CONCLUSIONS AND FUTURE WORK ................................................... 49
7.0 REFERENCES ............................................................................................... 51
APPENDIX A: TRANSIT AGENCY QUESTIONNAIRE ............................. A-1
APPENDIX B: LIST OF RESPONDENTS ....................................................... B-1
APPENDIX C: GTFS-RIDE DATA STANDARD ........................................... C-1
APPENDIX D: SOFTWARE REQUIREMENTS ........................................... D-1
APPENDIX E: REPORT DEFINITIONS ......................................................... E-1

viii
LIST OF TABLES
Table 3-1: APC and AFC Technologies Reviewed in Literature .................................................. 12 Table 3-2: Products commonly used to automatically collect ridership data ............................... 27 Table 4-1: Transit Stakeholders .................................................................................................... 38 Table 6-1: GTFS-ride project element locations ........................................................................... 49
LIST OF FIGURES
Figure 1-1: GTFS-ride Project Elements ........................................................................................ 4 Figure 1-2: GTFS vs. GTFS-ride files relationships ....................................................................... 5 Figure 3-1: Flow and Logic Structure of the Questionnaire ......................................................... 18 Figure 3-2: Map of Oregon Transit Agency Responses ................................................................ 21 Figure 4-1: GTFS vs. GTFS-ride files relationships ..................................................................... 40 Figure 4-2: Additional components and supporting documentation of GTFS-ride ...................... 42 Figure 5-1: WebHub User Interface .............................................................................................. 45 Figure 5-2: WebHub File Editor ................................................................................................... 46 Figure 5-3: WebHub Report Panel ................................................................................................ 47

1
EXECUTIVE SUMMARY
As the overall population of the United States grows, the most rapid growth is seen in urban and suburban areas. Following this same trend, the demand for public transit services is increasing across the nation. Transit service providers, state transportation agencies, metropolitan planning organizations, technology vendors, and other stakeholders will be expected to create effective solutions to address the continuing challenges created by this growth trend. Furthermore, these solutions will have to be based on decision making driven by accurate, real-world data.
Despite advancements in the analysis and visualization of the supply side, large information gaps remain in the understanding of the demands imposed on the transit system. In particular, the ridership data needed to set policy, develop plans, and prioritize investments in the State of Oregon is often not easily available and/or not in a useful standard format. This is mainly due to the fact that transit agencies vary widely in their ability to provide sufficient quantities of high-quality ridership data, and what can be provided is too often of little use due to a high level of aggregation, broad scope, sparsity, errors, and lack of standardization.
The inconsistencies in the availability, format, and quality of ridership data make it very difficult (if not impossible) for ODOT and entities with an interest in multi-agency transit networks to make effective and informed decisions to address challenges presented by growing transit demands. Therefore, this project developed a comprehensive (yet flexible) public transit ridership data standard called GTFS-ride. GTFS-ride was designed to improve the processes of ridership data collection, management, reporting, and analysis. Web-based software tools were developed to support the core functionality of GTFS-ride.
This report documents the findings of a comprehensive review performed on the current state of the art and state of the practice of transit ridership data, the creation of GTFS-ride to facilitate open ridership data, and the development of web-based tools to support the use of GTFS-ride. The breadth of products resulting from this project are depicted in Figure 1-1.
Summary of Current State of Ridership Data Art and Practice
The review of the current state of ridership data revealed clear opportunities for improvement and growth. The amount and resolution of ridership data collected across agencies varies, and many still collect data using infrequent and/or inaccurate means.
Providing smaller agencies with approachable, affordable, and useful means to collect, manage, and analyze ridership data would address one of the clearest deficits revealed by the review. At present, the varying types of services provided and the limited resources available to smaller agencies appear to have slowed the adoption of precision automated ridership data collection, making access to ridership data further impeded. The existing literature shows many opportunities for advancing ridership data, with promise from new technologies and methods and guidance for implementing proven processes.

2
Summary of GTFS-ride
GTFS-ride is an open ridership data standard employing elements of GTFS to describe the state of the transit network. Elements common to GTFS users allow agencies to easily connect their published schedule data to ridership data. The connections between elements of the two standards can be seen in Figure 1-2.
GTFS-ride was drafted following the review of current ridership data art and practice. The initial draft was shared with government and industry stakeholders for a process of iterative improvements. GTFS-ride is hosted as a GitHub repository. The data standard was publicly released in September 2017 with interested parties able to engage with the standard thru its GitHub repository.
In addition to the data standard, the GitHub repository includes information for the use of the standard as well as instructions for standard modification when beneficial to users. GTFS-ride is designed as an open standard to support transit community involvement and data standard utility.
Summary of Web-based Tools Developed to Support GTFS-ride
A web-based software suite was developed to assist users in the implementation of GTFS-ride. The tools are separated into two main components: the WebHub, a website designed to facilitate a database of GTFS-ride feeds and generate analyses from the data; and transitfeed-ride, a modification of Google’s GTFS feed validation tool specifically designed to validate GTFS-ride feeds. All code for the two software components are readily available on GitHub.
Conclusions and Opportunities for Future Work
Through the development of the GTFS-ride data standard, supporting protocols and documentation, and a suite of supporting web-based, open source software tools, the goals for this project outlined at its outset have been achieved.
The availability of GTFS-ride now provides transit agencies with a standardized method to store and report collected ridership data. With continued adoption and use of GTFS-ride, it may be possible to base effective operational and strategic decisions on real world transit demand data. Also, with the enabling of new possibilities for analysis comes the opportunity to improve the transit services offered and to increase the demand for such improved services. As standard adoption continues, stakeholders should, at a minimum, see improved consistency and quality in their current ridership data practices.Table 3-1 Since GTFS-ride is the result of a collaborative development process, it is anticipated that it can achieve significant adoption and have a lasting impact on the statewide Oregon public transit system. A major future undertaking is to facilitate an even broader adoption and scope by engaging a larger number of transit agencies not only in Oregon, but also across the U.S. and the world.
There are many opportunities for future work to expand on the effectiveness of both GTFS-ride and its supporting software tools, and these improvements are likely to increase the attractiveness of implementing the standard into practical operation. There is now an opportunity to expand the

3
understanding of transit agencies’ current ridership data practices and formats as they relate to adopting GTFS-ride. It is recognized that transit agencies may face challenges to convert their current ridership data into GTFS-ride compliant data. Addressing these challenges and developing guidelines and tools for the initial adoption of GTFS-ride is an opportunity which would likely greatly increase the positive impact of this project.

4
Figure 1-1: GTFS-ride project elements
SPR 803: Ridership Data Standard
GTFS-rideRidership Data Standard
GTFS-rideSupporting Elements
GTFS-rideSupport Software
GTFSFiles
GTFS-rideFiles
GTFS-rideExample Datasets
GTFS-rideWiki
GTFS-rideChange Process
GTFS-rideChanges Discussion Forum
GTFS-rideFeed Validator
GTFS-rideWeb Database
GTFS-rideReports
GTFS-rideData Entry/Edit/Import/
Export
GTFS-ride Software Tools Website
reference.md
GTFS-ride GitHub Repository
GTFS-ride ChangesGoogle Group
transitfeed-ride GitHub Repository
GTFS-rideSoftware Tutorial Videos
YouTube.com

5
Figure 1-2: GTFS vs. GTFS-ride files relationships

6

7
INTRODUCTION
As the overall population of the United States is growing, so too is the demand for public transit services. According to the Bureau of Transportation Statistics (2016), transit demand (as measured through passenger miles traveled) increased by over 8% in the United States between 2010 and 2014. Transit service providers, state transportation agencies, metropolitan planning organizations, technology vendors, and other stakeholders will be expected to create effective solutions to address the continuing challenges created by this growth trend. Furthermore, to be effective, these solutions will need to be based on decision driven by accurate, real-world data.
The Oregon Department of Transportation (ODOT) understands that successful performance analysis, service planning, and investment allocation of transit systems hinges on data availability and reliability. As such, ODOT has been forward-thinking in developing new tools to simplify and standardize the analysis of complex transit service supply networks. One example is the open-source, web-based Transit Network Analysis Software Tool which fuses the General Transit Feed Specification (GTFS) data feeds of over 60 Oregon fixed-route transit service providers with various other relevant data sets (e.g., US census, Park & Ride, employment, and Title VI data) (Porter et al., 2016).
Despite advancements in the analysis and visualization of the supply side of transit networks, large information gaps remain in understanding the demands imposed on transit systems. In particular, the ridership data needed to set policy, develop plans, and prioritize investments in the State of Oregon is often not easily available and/or is not in a useful, standard format. This is mainly due to the fact that transit agencies vary widely in their ability to provide sufficient quantities of high-quality ridership data. What can be provided is too often of little use due to a high level of aggregation, broad scope, sparsity, errors, and a lack of standardization.
REPORT OBJECTIVE AND AUDIENCE
This document is the final report for the ODOT research project SPR 803 titled “Statewide Data Standards to Support Current and Future Strategic Public Transit Investment.” The primary goal of this research project was to create a public transit ridership data standard for all Oregon public transit agencies who’s aim is to improve data collection, storage, sharing, reporting, and analysis. To facilitate the implementation and use of the developed public transit ridership data standard, this project had the accompanying goals to (1) develop the protocols to manage and disseminate the standard, and to (2) create supporting open-source, web-based tools for stakeholders who adopt the standard. The primary objective of this report is to document the processes used and the results obtained by the project research team in the effort to reach these project goals.
The main audience for this report is the ODOT project sponsors and supporting members of the Technical Advisory Committee (TAC). Other intended audiences include industry stakeholders (e.g., state transportation agencies, transit agencies, regional planners, modelers, vendors, etc.)

8
and academic researchers. Reviewers of this report will be able to view the full development process, follow the justification for project decisions, understand the project outputs, and begin to use the public transit ridership data standard and supporting tools.
REPORT ORGANIZATION
This report, to a large extent, follows the logical and chronological steps undertaken by the project research team, and follows in form to the tasks outlined in the project’s work plan document. As such, this report fully documents the project team’s research and development activities at a broad conceptual level. The detailed specifics of individual project elements are found in their respective online locations (e.g., ridership data standard details at https://github.com/ODOT-PTS/GTFS-ride/blob/master/spec/en/reference.md). It should be noted that the bulk of the material contained in Chapter 3.0 was previously reported as a part of this project’s Interim Report and is included here for completeness and context.
The remainder of this report is organized as follows. Chapter 3.0 presents a state-of-the-art literature review on ridership data collection methods, opportunities, and limitations, followed by the results of an online questionnaire that are useful to understand how Oregon transit agencies (and a select number of transit agencies in the United States and abroad) collect, organize, and utilize ridership data (i.e., the state-of-practice). Chapter 4.0 details the iterative, stakeholder-involved data standard development process and the major features of the final ridership data standard. Chapter 5.0 documents the process and results of developing the web-based software tools in support of the data standard. Finally, Chapter 6.0 reports on the conclusions of the research project and on the opportunities and recommendations for future work.

9
LITERATURE REVIEW AND AGENCY SURVEY
STATE OF THE ART REVIEW
Federal funding allocated to transit agencies in the United States may be impacted by ridership. Therefore, the vast majority of agencies must employ some form of ridership data collection. While there are existing federal requirements for ridership data reporting, these requirements are relatively lenient with regards to the required level of resolution, quality, and detail (Federal Transit Administration, 2016). As expected, this fact leads to the use of a wide range of data collection methods by transit agencies. Many transit agencies have a strong desire to go beyond the basic reporting requirements and collect more detailed passenger counts, as demand estimation and forecasting is a significant component of their planning processes (Boyle, 1998).
The state of art review is organized into three sections. Section 3.1.1 examines current research in ridership data collection methods, whereas Section 3.1.2 examines current research in methods for employing ridership data to improve transit understanding and service. Section 3.1.3 discusses the current state of open availability of various types of public transportation data. Finally, Section 3.1.4 presents a summary of the main findings of the state of the art review.
3.1.1 Developments in Ridership Data Collection
Understating the research on ridership data collection methods, opportunities, and limitations is an important first step in the process of using transit ridership data.
The research in transit ridership data collection is fairly well established, as it spans several decades and has maintained its relevancy. Prior work has been reported in many different areas including a comprehensive review of already established automatic passenger counter (APC) practices (Hodges, 1985); an investigation of the use of off-the-shelf pressure sensor mats and software to test improved passenger counting and classification (Greneker et al., 1996); and more recently, the utilization of on-board security cameras to validate trip counts obtained through other methods (Kirby, 2016). While the specific technologies and methods employed may vary among transit agencies, ridership data is generally derived from passenger counts determined by some combination of manual counting, farebox data, and APCs (Boyle, 1998).
Strathman and Hopper (1991) noted that APCs hold significant advantages over manual counting in that APCs can produce greater quantities of more disaggregate data that can be more readily available, at lower cost, and with improved accuracy. Boyle (1998) also noted that manual counting is very labor intensive and time consuming, thus introducing random errors and a “burnout” factor that may affect the reliability of the data.
While APCs can address the issues pertaining to manual data collection, inconsistencies in their operation often require larger amounts of data to be screened out, thus requiring larger samples sizes and standard plans for sampling and validation (Strathman and Hopper, 1991). For instance, Kimpel et al. (2003) found that up to 35% of APC data is rejected. These known APC

10
issues contribute to some agencies being satisfied with their manual counting procedures and not seeing enough incentive to move away from manual counting (Boyle, 1998). Most of the literature, however, focuses on the automated methods. Therefore, the following two sections highlight seminal and recent literature on ridership collection methods based on APCs and fareboxes.
3.1.1.1 Automatic Passenger Counters
Advents in technology have allowed for a transition in transit from predominantly manual counting to a greatly increased adoption of APC technology (Boyle, 1998). APCs utilize a host of technologies to detect passenger boardings and alightings, including infrared (IR) light beam cells, laser scanners, IR cameras, piezoelectric mats, microwave radars, switching mats, video cameras, Bluetooth and Wi-Fi Sensors, radio frequency identification (RFID) “smart cards,” and vehicle air suspension pressure sensors. Table 3-1 summarizes these technologies as they appear in the literature.
APCs that utilize IR beam technology and switching mats have long been studied (Greneker et al., 1996; Hodges, 1985), and several sources in the literature provide guidance to practitioners about their implementation and use (Boyle, 2008; Federal Transit Administration, 2016; Fihn and Finndahl, 2011). Although these two types of APCs are considered old technologies, they are relatively inexpensive (i.e., less than $500) and can provide finer levels of detail on the data collected when compared to manual counts (Bauer et al., 2011). However, these types of APCs cannot resolve certain instances accurately (e.g., simultaneous boardings or a mother carrying a child) and require regular calibration and validation which can be a challenge for transit agencies with limited resources (Boyle, 2008; Federal Transit Administration, 2016). A validation case study performed by TriMet in Portland, OR, showed that the data collected with IR camera-based APCs requires post processing and validation to address over- and under-counting (Strathman et al., 2005).
Applications of APCs that utilize video technology for data collection are now taking advantage of recently developed video data processing techniques. For example, a project currently underway with the North Carolina Department of Transportation is investigating the use of new processing algorithms to count passenger trips collected with pre-existing transit vehicle security cameras (Kirby, 2016). Another study conducted in China used cameras mounted above the doors of buses to count crowds of passengers attempting to simultaneously enter a bus. Clustering algorithms designed to separate out individual passengers from a crowd by tracking feature trajectories were employed to analyze the video data and produced passenger counts with an accuracy of 96.5% (Yang et al., 2010). Yahiaoui et al. (2010) showed that using two video cameras at different angles to produce a three-dimensional image of bus entryways could yield high accuracy (i.e., 97%) and reliability in passenger counts. García-Bunster and Torres-Torriti (2008) suggested an alternative approach which uses a camera mounted at a bus stop coupled with a specialized density-based algorithm to count the passengers as they wait on the bus. The results show that passengers could be detected with an accuracy of 94.1% with the proposed method.

11
A variety of wireless technologies have also been used as the basis of operation of APCs. A case study conducted in Seattle demonstrated the feasibility of using Bluetooth-based and Wi-Fi-based APCs combined with GPS data to link boarding and alighting data to specific individuals (Dunlap et al., 2016). While this study showed that origin-destination estimation via this data collection approach is quite feasible, there are still limitations which prohibit its successful implementation. More specifically, since not all passengers are likely to carry the required technology so that they can be detected, it would not be effective at providing complete and accurate counts. Kostakos et al. (2013) reached similar conclusions in their study, which also used Bluetooth-based APCs (i.e., only 12.8% of passengers carried discoverable devices), and they also particularly noted the privacy concerns that arise with the use of wireless technologies.

12
Table 3-1: APC and AFC Technologies Reviewed in Literature
TECHNOLOGY
ARTICLE
Pressure Sensitive
Mats IR Light
Beam IR
Camera Video
Camera Bluetooth WiFi
RFID Smart Cards
Air Suspension
Pressure Dunlap et al. (2016) X X
Kirby (2016) X Kostakos et al. (2013) X X
Kotz et al. (2015) X X X Kuutti (2012) X X X X
Peterson et al. (2013) X Bauer et al. (2011) X X Oberli et al. (2010) X
Yahiaoui et al. (2010) X Yang et al. (2010) X
Bunster and Torriti (2008) X
Strathman (2005) X Boyle (1998) X X
Greneker et al. (1996) X
Strathman (1989) Hodges (1985) X X

13
A novel approach to passenger counting which monitors the air pressure of the ride suspension system of a transit vehicle was recently proposed by Kotz et al. (2015). This study found that inferring the vehicle’s mass through pressure changes and translating this result into a passenger load was feasible and produced passenger counts that were 97.6% accurate. The researchers also noted that this method provided opportunities to generate additional information such as passenger load distributions throughout the vehicle cabin. The method was, however, sensitive to deviations from the assumed average passenger mass and to bus kneeling events.
Newly emerging technologies and methods will likely play a role in in the advancement of APC-based passenger data collection approaches, even if they do not replace the tried and tested current methods (i.e., IR beam, IR camera, and pressure sensitive mats). In particular, the rapidly advancing research on autonomous vehicle technology is making a compelling case for automation in public transit (Polzin, 2016). In probable future scenarios where public transit vehicles become fully autonomous, APCs will need to play an increased roll in ridership data collection.
3.1.1.2 Farebox Counting
Passenger counts are often derived from farebox data. With the increasing adoption of automated fare collection (AFC) through the use of RFID enabled “smart cards,” transit agencies have been able to collect richer data than APCs often allow. For instance, in addition to stop-level boardings and alightings, smart cards can hold passenger specific information, such as transfer status, rider ID, fare type, and rider category (Pelletier et al., 2011).
There have been many advantages of adopting AFC systems noted in the literature, including reduced boarding times, reduced driver workload, flexible and creative fare structures, and reduced costs (Pelletier et al., 2011). In a field test conducted by Peterson (2013), it was found that using RFID smart cards with a medium detection range allowed recording passenger boardings with an average accuracy of 88%. However, after a lifecycle cost analysis was performed, it was found that the economic advantages of such a system would be dependent on ridership levels and the fare structures in place for different rider types (i.e., free student or discounted fare riders vs. full-fare riders). Similarly, Oberli et al. (2010) found that an average accuracy of up to 91% is achievable with RFID smart cards, but that accurate detection was highly dependent on the specific location of the smart card, such as being held by the passenger in their hand versus being located in a wallet or a backpack.
3.1.2 Innovative Uses and Analysis of Ridership Data
The goal of ridership data collection and dissemination is to be able to apply that data. Application examples include resource optimization, meeting reporting requirements, and providing advocacy resources. However, the depth of data available may limit the scope of the analyses and applications that are feasible. Most of the prior research discussed in this section focuses on extracting useful syntheses from limited available data through prediction and extrapolation. It is notable that the areas of study in this type of research seem to be selected

14
somewhat sporadically. Current research consistently looks at datasets of local or regional transit agencies, not attracting input from transit agencies outside of the geographic focus of the study. The nature of the ridership data is unique to the study, so generalization is not often discussed nor is it easily applied between different data sets.
Predicting ridership data from external sources provides a means of estimating ridership in the absence of empirically collected data. Chu et al. (2004) developed mathematical constraints to improve the estimation capabilities of prior models for average weekday boardings. Their results showed that the newly developed constraints improved the accuracy of the estimates by 54%. Chu et al. (2006) further expanded their model by developing a framework released as the Transit Boardings Estimation and Simulation Tool (T-BEST). Dill et al. (2013) utilized transit service, land use, and socio-demographic characteristics to predict stop-level ridership using data from three Oregon transit agencies (i.e., TriMet, Lane Transit District, and Rogue Valley Transit District). Their regression model worked well in predicting stop-level ridership in more urban environments, with transit service characteristics (i.e., transfer stops, transit centers, proximity to other stops, Park & Ride services, service headways, and service coverage hours) being the category of independent variables having the most impact.
Development of models to predict behavior can compensate for a lack of data. With limited data at hand, the need to extrapolate models from the data becomes vital. With the most standard digitally deployed technologies being automated fare collection (AFC) and automated vehicle location (AVL), a desire exists to learn more about ridership from that data. Nassir et al. (2011) attempted to model origins and destinations of riders using AFC and AVL data. The model was validated against APC data, with 98% of model transactions matching APC recordings. By validating models, additional data can be derived from what is collected.
Attempts to extrapolate data are evolving rapidly as the means of data collection increase. Transit Cooperative Research Program (TCRP) Synthesis 66 provides a summary of ridership forecasting techniques as of 2006 (Boyle, 2006). While this TCRP synthesis report is now over a decade old, the main challenges identified are still unresolved: lack of data, inconsistent collection methods across agencies, and an evolving modeling base of knowledge. Barabino et al. (2014) proposed a framework to be applied to buses to allow transit agencies to better manage their data and use them beneficially. The proposed framework provides for ingesting APC data, cleaning and verifying the data, and presenting the data in a profile beneficial to transit agencies.
Ensuring validity is one of the most significant challenges when analyzing large volumes of stop-level ridership data. Therefore, quality assurance (QA) methods are key to ensuring that the data being ingested for reporting and modeling is valid. Saavedra (2010) applied a new approach to QA where 612,000 stop-level records were examined, and as many as 85,680 (i.e., 14%) failed the QA measures. The fault in the data was associated largely with poor passenger balancing algorithms (i.e., processes to correct APC counting errors) or inaccurate APC equipment. Poor quality schedule data contributed to weak AVL-APC data. A core concern related to ridership data was revealed in this study, i.e., ridership data collection methods cannot be solely relied upon as a data source. Reliable means of QA are also necessary to ensure proper reporting and planning.

15
Once ridership data has a high assurance of accuracy, applications of the data may benefit transit services. The gains seen from the analysis of ridership data include improved efficiency, more accurate reporting, and new understandings of ridership. Reddy et al. (2009) detail how New York City Transit (NYCT) developed analyses based on an AFC system to infer origin-destination data and to determine mile calculations using schedule-driven, shortest-path algorithms. NYCT successfully retained a Federal Transit Administration-approved sampling methodology for Section 15 reporting while improving understanding of system use.
Like NYCT, the Utah Transit Authority sought to resolve new transit data from existing collection systems. Fayyaz et al. (2016) developed a model to predict dwell time (i.e., the amount of time a bus is at a bus stop) by analyzing other variables such as time used by cash payments and prepaid passes. They developed a genetic algorithm and regression-based modeling approach and validated their model empirically on a single bus route. They also suggested that their model can be transferred to other systems equipped with APCs to improve service optimization and performance assessments.
To highlight the gains possible with sound analysis of ridership data, application studies often attempt to evolve the perception of how an effectively functioning transportation system might operate. Changes to transit service or changes to the environment surrounding a service can impact the utilization of public transportation for both existing and potential riders. To determine how ridership is gained or lost, Trepanier (2010) analyzed smart card fare collection data from the Societe de transport de l’Outaouais (STO) where more than 80% of riders use their smart cards for fare payment. Trepanier (2009) used the same data source to show the effectiveness of using smart card data “to measure transit supply and demand indicators.” These gains and losses can be used to justify or disprove the analysis and applications discussed above.
The prediction, analysis, and application of ridership data will continue to evolve. Key to this work will be valid and consistent data collected through increasingly automated means.
3.1.3 Advancements in Transportation Data Standards and Open Data
The movement for the public availability of transit data is occurring globally, but challenges faced in providing data to the public slow expansion. To evolve data availability, effectively published standards should include supporting communities of developers to further both the applicability and the adoption of open transit data standards.
The quintessential open transit data standard is the General Transit Feed Specification (GTFS). Originally established as a partnership between Google and TriMet, GTFS is a transit data specification with global adoption. Two key components to its success are its immediate utility through Google’s Transit and its ongoing adaptation initially centered on an online Google Groups forum (moderated by Google) and later on GitHub. The access the public had to Google’s Transit (Google Maps Transit, 2016) for planning their public transit trips incentivized transit agencies to provide data about their network in a format compliant with GTFS. The ongoing adaptation through publicly accessible forums has allowed transit agencies globally to contribute to the standard in ways that allow further adoption by diverse agencies.

16
An example of both the adaptation and adoption of GTFS is a project conducted in Mexico City (Eros et al., 2014). Mexico City’s transit system included vehicle types and schedules not originally accommodated by GTFS. However, by engaging the online GTFS community and implementing the necessary adaptations for their network, they were able to apply GTFS.
Two transit agencies recently discussed their approaches to working with and providing open transit data. Chandesris and Remy (2016) investigated applying open transit data within the French transit system. Their primary challenges were associating the collected data with human activities, achieving benefits by providing and applying the data in real time, and interweaving what has been learned from working with the rail system to other transit modes. The Massachusetts Bay Transit Authority and the Massachusetts Department of Transportation are developing methods to better provide their data to the public (Paget-Seekins and Tribone, 2016). Their primary challenges were aggregating data to protect privacy, choosing the best protocols for data distribution, assuring data quality, and the specific logistical decisions associated with large datasets.
A comprehensive review of the current state of open data within transit agencies globally can be found in TCRP Synthesis 115 (Schweiger, 2015). In TCRP Synthesis 115, four key lessons were learned in the development of open transit data:
• Data quality and accuracy are critical to the success of an open data program.
• Open data are not free.
• Recognize that opening data will create changes within and external to the agency.
• Engagement and developing relationships with developers is key to success as well.
Applying the lessons of other open transit data standards will be key to the success of an open ridership data standard.
3.1.4 State of Art Summary
The literature synthesized in Section 3.1 reveals that different areas of ridership data collection, analysis, and accessibility are being researched. However, they do not follow a structured or concise approach.
The state of data collection in current literature seeks to evolve accurate means of collecting ridership data by leveraging combinations of proven methods with rapidly advancing sensing technologies and increasing computational power. These methods include numerous optical, physical, electromagnetic, and analytic options. While there exist promising developments in improving ridership data collection, no one method has yet proven to be the de facto solution or dominant strategy. Evidence also exists that the methods to collect ridership data are expanding, and with each new advancement, the structure of the data collected may change. Therefore, the methods to manage and analyze ridership data must also advance to guarantee access to a breadth of data in usable formats, thus facilitating their broad application.

17
Although the methods for distributing and making ridership data accessible are still new, development of a standard is key for proliferation. The growth experienced by GTFS is a good example to follow. Standardizing data formats (e.g., CSV, XML, etc.) and content across formats (e.g., passenger counts, fare types, etc.) will support the development of advances in the collection, analysis, and distribution of ridership data.
STATE OF THE PRACTICE REVIEW
A state of the practice review was conducted to gain an understanding of how Oregon transit agencies (and a select number of transit agencies in the United States and abroad) collect, organize, and utilize ridership data. The main instrument to collect information to prepare this review was an online questionnaire developed by the research team in consultation with the ODOT Technical Advisory Committee (TAC). The online questionnaire was designed, distributed, and analyzed through the web-based survey platform Qualtrics. After all the responses to the online questionnaire were received, additional data was gathered through direct follow up with questionnaire respondents and through general web searches. The main objective of conducting a state of the practice review was to inform and direct the development of the requirements, structures, and functions of the public transit ridership data standard.
In the next sections, the structure, distribution, and results of 33 questions presented to transit agencies both in Oregon and out-of-state are presented and analyzed. Section 3.2.1 describes the structure and synthesis of thought that informed the development of the questionnaire, as well as the method used to identify target agencies, contact the agencies, and provide agencies access to the questionnaire. Section 3.2.2 presents the results of the questionnaire. Finally, Section 3.2.3 presents a summary of the findings of the state of the practice review.
3.2.1 Online Questionnaire
3.2.1.1 Structure of the Questionnaire
The TCRP Synthesis 77 report (Boyle, 2008) was used as the foundation for the questions included in the online questionnaire. Then, its scope and content were refined and tailored to the specific needs of this project through an interactive process with the TAC.
The final online questionnaire distributed to transit agencies can be found in Appendix A. The instrument was composed of a total of 33 questions. The first question asked for the name of the transit agency and the service being reported on, while the last five questions collected contact information about the respondent to facilitate a follow up (if needed). The remaining 27 questions were specifically designed to elucidate current practices related to ridership data while balancing the desire for rich and complete information with the need to achieve clarity and brevity to accommodate the intended respondents.
As depicted in Figure 3-1, the online questionnaire centered on the main components of ridership data (i.e., collection, management, analysis, and use) with a focus on the specific tools and methods utilized in practice. The goal was to compose a complete

18
picture of the lifecycle of ridership data as it exists in practice among the transit agencies contacted, which varied in size and availability of resources to dedicate to these tasks.
Figure 3-1: Flow and Logic Structure of the Questionnaire
Service Types(Three questions)
Service Types(Three questions)
Agency Name and Size
(Two questions)
Agency Name and Size
(Two questions)
Open-Ended Non-Fixed-Route
Collection Practices(One question)
Open-Ended Non-Fixed-Route
Collection Practices(One question)
Fixed-Route Collection Resolution
(One question)
Fixed-Route Collection Resolution
(One question)
Open-Ended Fixed-Route Resolution if
“other” selected(One question)
Open-Ended Fixed-Route Resolution if
“other” selected(One question)
Data Availability by Type and Frequency
(One question)
Data Availability by Type and Frequency
(One question)
Ridership Data and Detail Collection
Methods(Two questions)
Ridership Data and Detail Collection
Methods(Two questions)
Automated Methods and Practices
(Five questions)
Automated Methods and Practices
(Five questions)
Additional Collection Methods and Details
(Three questions)
Additional Collection Methods and Details
(Three questions)
Data Management Details
(Six questions)
Data Management Details
(Six questions)
Data Uses, Validation, and
Analysis Methods(Three questions)
Data Uses, Validation, and
Analysis Methods(Three questions)
Data Reporting Requirements and
Practices(Three questions)
Data Reporting Requirements and
Practices(Three questions)
Open-Ended Request for Additional
Information and Follow-Up Contacts
(Two questions)
Open-Ended Request for Additional
Information and Follow-Up Contacts
(Two questions)
Follow-Up Contact Information
(Four questions)
Follow-Up Contact Information
(Four questions)
STARTSTART
ENDEND

19
3.2.1.2 Process to Identify Respondents
In coordination with the TAC, a total of 138 Oregon transit agencies/services were identified as potential respondents to the online questionnaire. An initial list of contacts from each of the six transit regions (i.e., Region 1, Region 2a, Region 2b, Region 3, Region 4, and Region 5) was generated from a spreadsheet provided by ODOT. The initial list was expanded with additional contacts provided by the Oregon regional transit coordinators for each transit region (RTCs).
Nine out-of-state transit agencies were also identified as potential respondents. These out-of-state transit agencies were targeted because of their recognition of having excellent performance. Six of the out-of-state transit agencies operate in the United States, and three operate overseas. For the U.S. based agencies, this performance was calculated by a third party using data available through the National Transportation Database (NTD) and country specific transit data was used to calculate the performance of the overseas targeted agencies.
Finally, a broad invitation was posted on Google-hosted Transit Developers forum. It is important to mention that there were no preconceived notions as to how many potential respondents could be reached through this outlet. However, this forum has many participants whose roles relate to public transit, so it was also targeted as a potential source for participants.
3.2.1.3 Inviting Respondents
In total, 147 individuals identified as having a role with a transit agency/service were directly invited to respond to the online questionnaire.
Potential respondents in each of the six Oregon transit regions were invited to participate via a personalized email message sent through the Qualtrics platform. For the out-of-state transit agencies, a specific contact person was identified (if possible) and personalized email invitations were also sent to these individuals through the Qualtrics platform. Any updated out-of-state contacts were sent a personalized invitation via regular email.
Finally, an anonymous link alongside an explanatory post was submitted to the Google Group Transit Developers, an active forum for those involved with transit data and software development.
3.2.1.4 Final Number of Respondents
A total of 66 transit agencies/services responded to the online questionnaire with different levels of completion and validity. From these, 53 responses were considered reasonably complete and valid giving a response rate of 36%. Out the 53 responses, 47 were provided by the Oregon transit agencies/services listed in Appendix B. The geographical location of the 47 Oregon-based transit agencies/services is marked by a blue dot in Figure 3-2.

20
The out-of-state transit agencies/services that responded to the online questionnaire were Blacksburg (Virginia) Transit, RTC of Southern Nevada, San Diego Metropolitan Transit System, King County Metro (Seattle, WA), Community Transit (Snohomish County, WA), and Transport of London. An additional 13 responses were received through an anonymous link which can be understood as stemming from the posting to the Google group forum. It is important to note that the responses received from users of the Google group forum were not accounted for in the calculation of the response rate of the online questionnaire.

21
Figure 3-2: Map of Oregon Transit Agency Responses

22
3.2.2 Results
When interpreting the results presented in this section, it is important to note that while there were 53 questionnaires that were considered reasonably complete and valid, many individual questions had a much smaller response count. Therefore, the corresponding response percentages reflect only those respondents that were considered as having answered the question appropriately. Furthermore, many text-based answers had high variability. Often these open-ended questions were not addressed as expected, and only the meaningful responses were included in the analysis. Occasionally (and only in very clear cases), certain responses were assumed if the context of other questions made the intended answer obvious. Illustrative charts depicting the data reported in this section can also be found in the Interim Report accessible at https://github.com/ODOT-PTS/GTFS-ride/blob/master/wiki/GTFS-ride_InterimReport/.
3.2.2.1 Size and Composition of Fleet
A total of 47 transit agencies/services operating in Oregon reported on the size and composition of their fleets. Regarding fleet size, the smallest is one vehicle (i.e., Burns Paiute – Tribal Transit Services) and the largest is composed of 1,052 vehicles (i.e., TriMet).
Of Oregon respondents, 39 transit agencies/services (i.e., 83%) own all the vehicles they operate. In contrast, four transit agencies/services (i.e., 8.5%) contract all the vehicles in their fleet. Four transit agencies/services (i.e., 8.5%) reported operating a mixed fleet. It was also found that 45 transit agencies/services (i.e., 95.7%) have a fleet size between one and 80 vehicles. Only two transit agencies/services in Oregon (i.e., 4.3%) have a fleet size larger than 80 vehicles.
Six out-of-state transit agencies/services reported on the size and composition of their fleets. Their fleet sizes range from 66 to 9,400 vehicles. Four transit agencies/services (all operating in the United States) own 100% of the vehicles in their fleet. In contrast, Transport of London contracts 100% of its vehicles. Only one transit agency/service (also located in the United States) reported operating a mixed fleet.
3.2.2.2 Type of Service Area
A total of 47 transit agencies/services operating in Oregon reported on the type of area they serve (i.e., rural, urban, or both). Of Oregon respondents, 29 transit agencies/services (i.e., 61.7%) provide services only in rural areas, four (i.e., 8.5%) serve only urban areas, and 14 (i.e., 29.8%) provide services in both rural and urban areas.
Six out-of-state transit agencies/services reported on the type of area they serve. Two of these transit agencies/services provide services only in urban areas (i.e., 33.3%) and four (i.e., 66.7%) provide services in both rural and urban areas.
3.2.2.3 Type of Service
A total of 47 transit agencies/services operating in Oregon reported on the type of service they provide (i.e., fixed route, non-fixed route, or both). Of this group, six transit

23
agencies/services (i.e., 12.8%) only provide fixed route service, and 13 (i.e., 27.7%) only provide non-fixed route service. In contrast, 28 (i.e., 59.6%) of transit agencies/services provide a combination of fixed route and non-fixed route services.
Six out-of-state transit agencies/services reported on the type of area they serve. Of these transit agencies/services, one provides only fixed route service (i.e., 16.7%) and five (i.e., 66.7%) provide a combination of fixed route and non-fixed route services.
3.2.2.4 Levels of Ridership Data Collection – Fixed Route Modes
A total of 31 transit agencies/services operating in Oregon reported on the levels of ridership data collection they perform. There were seven possible answers for the level of ridership data collection (i.e., “Stop,” “Segment,” “Trip,” “Route,” “System,” “Other,” and “N/A”) for the following 13 fixed route modes:
• Bus
• Commuter Bus
• Bus Rapid Transit
• Trolleybus
• Vanpool
• Ferryboat
• Commuter Rail
• Hybrid Rail
• Heavy Rail
• Light Rail
• Streetcar Rail
• Monorail/Automated Guideway
• Aerial Tramway
Among these 31 Oregon transit agencies/services, the fixed route modes for which ridership data are collected at more levels are “Bus” and “Commuter Bus.” Very little ridership data collection efforts were reported for the fixed route modes “Vanpool,” “Hybrid Rail,” “Light Rail,” “Streetcar Rail,” “Bus Rapid Transit,” and “Trolleybus,” whereas no ridership data collection efforts were reported for the fixed route modes “Ferryboat,” “Commuter Rail,” “Heavy Rail,” “Monorail/Automated Guideway,” and “Aerial Tramway.” Of the “Bus” and “Commuter Bus” modes, the majority of transit agencies/services reported collecting fixed-route service ridership data predominantly at the route level, followed in frequency by trip and stop levels.
The six transit agencies/services located outside of Oregon reported that the modes for which ridership data are collected at more levels are “Bus,” “Commuter Bus,” and “Bus Rapid Transit.” Very little ridership data collection efforts were reported for the fixed route modes “Vanpool,” “Trolleybus,” “Ferryboat,” “Light Rail,” “Streetcar Rail,” and “Aerial Tramway,” whereas no ridership data collection efforts were reported for the modes “Commuter Rail,” “Hybrid Rail,” “Heavy Rail,” and “Monorail/Automated Guideway.” The majority of transit agencies/services in this group reported collecting “Bus” service ridership data most commonly at the stop level, followed in frequency by trip, route, and system levels.

24
3.2.2.5 Levels of Availability of Ridership Data – Fixed Route Modes
A total of 44 transit agencies/services operating in Oregon reported on the availability of the ridership data they collect. There were seven possible answers for ridership data frequency (i.e., “Daily,” “Weekly,” “Monthly,” “Quarterly,” “Annually,” “As Needed,” and “N/A”) associated with the following levels of ridership data:
• System ridership
• Route-level ridership
• Route segment ridership
• Stop-level boardings/alightings
• Performance measures
• Schedule adherence
• Running Times
All 44 transit agencies/services in Oregon have system-level ridership data available on some basis. Although having stop-level boardings/alightings data available at some level seems to be common among transit agencies/services in Oregon, 13 out of 38 respondents (i.e., 34.2%) indicated not having this level of ridership data available at all. With the exception of running times, all six out-of-state transit agencies/services have ridership data available more often at different levels.
3.2.2.6 Methods of Ridership Data Collection
A total of 43 transit agencies/services operating in Oregon reported on the methods utilized to collect ridership data. In the online questionnaire, respondents were presented with four possible main answers (in the form of checkboxes) including “Automated passenger counters (APC),” “Registering fareboxes,” “Handheld data collection units (e.g. Mobile Data Terminals - MDT),” and “Driver's trip log.” A fifth option, in the form of an open-ended textbox, was also provided.
A driver’s trip log is the dominant ridership data collection method used by 33 (i.e., 76.7%) transit agencies/services in Oregon. In contrast, only eight respondents (i.e., 18.6%) reported using MDTs and five (i.e., 11.6%) reported using registering fareboxes or APCs. Other methods to collect ridership data were reported by a very small percentage of Oregon transit agencies/services.
For the out-of-state transit agencies/services, five out of six transit agencies/services (i.e., 83.3%) reported using APCs as the main method to collect ridership data. Also of note is that a larger portion of out-of-state respondents (i.e., 50%) reported using “Registering Fareboxes,” which can also be thought of as an automated data collection method.
The types of data collection methods used more frequently by different transit agencies/services relative to their fleet size (both in Oregon and out-of-state) was another finding of note in this section of the questionnaire. Large and medium size transit agencies/services reported using APCs and registering fareboxes much more frequently than smaller size transit agencies/services. In contrast, the use of driver’s trip logs is more

25
common in small transit agencies/services when compared to larger transit agencies/services.
3.2.2.7 Collection of Ridership Data Supplementary Details
A total of 43 transit agencies/services operating in Oregon provided more details about which types of supplementary details of ridership they collect. In the online questionnaire, respondents were presented with multiple checkbox selections representing potential supplementary details of ridership including “Wheelchairs,” “Fare Types,” “Special Rider Types,” “GPS Coordinates,” “Timestamps,” “Bicycles,” “Transfer Status,” and “Other Medical or Mobility Devices.” A final option, in the form of an open-ended textbox, was also provided.
Of Oregon transit agencies/services, 29 respondents (i.e., 67.4%) reported collecting wheelchair-related data, while 25 (i.e., 58.1%) reported collecting fare types. Also, special rider types (i.e., 49.5%) and data on other types of medical or mobility devices (i.e., 37.2%) were reported as common types of supplementary ridership collected. Other interesting categories supplied by respondents included data on rider car sickness and needed caregivers or assistants. However, only one instance of each was reported and (in context) these responses were in regard to demand response transit or paratransit services. It is important to mention that six transit agencies/services in Oregon (i.e., 14%) do not collect supplementary ridership information.
All six out-of-state transit agencies/services respondents reported collecting GPS coordinates and timestamps. For comparison purposes, only 20.9% of Oregon transit agencies/services reported collecting GPS coordinates and 18.6% reported collecting timestamps.
In this part of the online questionnaire, respondents were also asked to elaborate on how supplementary details of ridership are collected. Once again, “Driver Trip Log” was reported as the dominant collection method by Oregon transit agencies/services (i.e., 84.6%), while automated systems (i.e., “AVL or APC” and “Other Automated Systems”) were the most prevalent methods utilized by out-of-state agencies (i.e., 66.7% for both). However, it should be noted that this particular open-ended sub-question had a relatively low response rate from both Oregon and out-of-state agencies (i.e., 29.5% and 50%, respectively).
3.2.2.8 Automated Ridership Data Collection
The use of APCs by transit agencies/services was addressed through a series of questions aimed at gaining a deeper understanding of their adoption and implementation.
As previously reported in Section 3.2.2.6, only five out of 47 Oregon transit agencies (i.e., 10.6%) reported using APCs. These five transit agencies are TriMet, Salem Area Mass Transit District, Rogue Valley Transportation District (RVTD), Hood River County Transportation District, and Corvallis Transit System (CTS).

26
Respondents were then asked about the percentage of their fleet that is equipped with APCs. Again, the same five transit agencies in Oregon provided a non-zero or non-blank response. Only CTS reported having 100% of their fleet equipped with APCs. However, TriMet has 100% of its bus fleet and 50% of its light rail fleet equipped with APCs. It is interesting to note that the fleets of almost all the out-of-state respondents are equipped (to some extent) with APC technology. The sole exception is Transit for London, but this respondent has the largest fleet size at 9,400 vehicles.
A follow-up question was posed specifically for those agencies reporting some APC adoption (i.e., less than 100%) to learn how the APC equipped vehicles are chosen to service routes. Of the seven transit agencies/services (in and out-of-state) that responded to this question, two respondents have no need for a specific plan (mainly due to high enough proportion of APC equipped vehicles). Each other respondent employed their own method. For example, one method mentioned was to maximize route coverage, another was to meet specific collection needs, and another was a simple random assignment.
Anticipating a low adoption of APC technology in Oregon, especially among the smaller transit agencies/services, an open-ended question was posed to find which barriers might exist to a transit agency/service when implementing APC technology on their fleet. The results for this question show that from 34 Oregon agencies/services that responded to this question, 20 (i.e., 58.8%) cited financial resources as the main barrier. Other barriers cited included a perception of APCs being unnecessary (i.e., 20.6%) and concerns about APC accuracy (i.e., 14.7%). Several respondents cited agency-specific strategic or logistical constraints such as the timing of capital replenishment cycles or being unsure of demand response APC integration. Three of the five (i.e., 60%) out-of-state transit agencies/services also cited financial resources as a barrier to the adoption of APC technology.
One question asking what combinations of automated and manual methods are used to collect ridership data had low response counts for both Oregon and out-of-state transit agencies/services (i.e., five and three, respectively). The common theme among these responses was that manual counts or surveys are often used in conjunction with automated methods (e.g., APC, AFC, and scheduling software) to validate the automated method.
Information was also collected regarding the specific manufacturers and models of the device(s) and/or software utilized to automatically collect ridership data. Most products were only mentioned once, but INIT’s IRMA APC and Route Match software were each mentioned by three out of 12 (i.e., 25%) of the respondents (both in and out-of-state). Table 3-2 lists the various technologies mentioned in three different categories (i.e., APC/AFC, Mobile Data Terminals, and Software).

27
Table 3-2: Products Commonly Used to Automatically Collect Ridership Data APC/AFC Mobile Data Terminals (MDTs) Software
• Dilax • Iris IRMA • INIT IRMA • IVT • Connexionz, Inc. APC
Contractor • Genfare Odyssey Farebox
• DDS Wireless Vector9000 • DDS Wireless mSlate • Mentor Ranger • Samsung GT-N8913 • Unspecified Tablet
• UTA APC Software
• Route Match • Ecolane
Additionally, respondents were asked to explain any differences in their ridership data collection practices that may have occurred in the past three years. While this question was aimed at further revealing any recent trends in the practice of ridership data collection, the response rate was very low (i.e., only five Oregon agencies responded). The items of note are that three Oregon transit agencies/services have transitioned from paper-based collection methods to an increased used of MDTs and two out-of-state agencies have increased their use of APCs.
3.2.2.9 Uses of Surveys and Sampling for Ridership Data
The final two questions regarding ridership data collection focused on the uses of alternate collection methods to infer ridership. More specifically, respondents were asked about their use of manual surveys and sampling methods to estimate ridership. These questions were both structured alike, each with four sub-questions relating to the frequency of use, sample size, proportion of trips studied, and estimation methods.
The results reveal that these questions were likely not applicable to many agencies as evidenced by only a small quantity of appropriate responses. With regards to the use of survey methods, five complete responses were collected from Oregon transit agencies/services and only one response was assessed as complete from an out-of-state respondent. A small number of additional responses to certain sub-questions were deemed appropriate and included in the analysis. It is worth noting that no response provided details on the use of surveys to estimate ridership. While two respondents (i.e., 40%) stated they estimate in general terms, the other respondents were using surveys for other purposes.
In regard to ridership sampling, only two appropriate responses were recorded. This seems to indicate that statistical sampling is only minimally performed among Oregon transit agencies/services. Many agencies commented on their daily 100% ridership counts with manual methods, and several other agencies repeated the same responses provided to the previous question regarding ridership surveys. Both cases were excluded and not considered here as statistical sampling. One agency, King County Metro in the Seattle metropolitan area, used daily random sampling for rider data collection in their large vanpool fleet. Northeast Oregon Public Transit used quarterly ride-along manual count sampling to note ridership trends, but not to estimate ridership counts.

28
3.2.2.10 Transit Agency Staff Resources for Ridership Data
An agency will require some dedication of staff resources to make ridership data available. The questionnaire asked the question, “What is the total employee FTE [full time equivalent] allocated to the collection and management of ridership data?”
Due to some clear outliers in the responses, a filter based on FTE-to-fleet-size was established and applied. Based on this filter, respondents with a FTE-to-fleet-size ratio greater than one standard deviation from the mean were eliminated. The result was a mean FTE-to-fleet size ratio of 0.092 (e.g., an agency with 100 vehicles in their fleet would have approximately 9 FTE allocated to the collection and management of ridership data). This value appears high, and if agencies with fewer than 100 vehicles in their fleet are excluded, the mean ratio drops to 0.004 (i.e., less than 1/20th the ratio after only the standard deviation filter was applied, and translating to a 100-vehicle fleet having .4 FTE allocated to the collection and management of ridership data).
These results seem to suggest that there exists a baseline of resources required for ridership data management and analysis, and that such is disproportionately burdensome on smaller transit agencies.
3.2.2.11 Ridership Data Transfer Methods
In instances where ridership data is collected by means of an electronic device such as automated passenger counters, registering fareboxes, or mobile data terminals, transit agencies must transfer this raw ridership data from the electronic collection devices for storage and further analysis.
When asked how raw ridership data is transferred from electronic collection devices to storage, 27 transit agencies/services in Oregon reported utilizing digital means to accomplish this task. The most common means was “Real-time dynamic or periodic remote retrieval” with eight transit agencies/services (i.e., 29.6%) currently using this approach. The prevalence of remote retrieval in Oregon is very similar to that seen with out-of-state agencies (i.e., 28.6%).
A plurality of transit agencies/services in Oregon (i.e., 11 out of 27 or 40.7%) were unsure as to the means of data transfer. For Oregon respondents, this does appear to correlate to smaller fleet sizes. The greatest proportion of unknown data retrieval methods is from agencies with 11-20 vehicles in their fleet followed by agencies whose fleets have 1-10 vehicles.
3.2.2.12 Ridership Data Storage Location
The storage location of ridership data is influenced by the fleet size of the transit agency. Local hardcopy storage was reported as preferred by 33.3% of respondents whose fleet includes 10 vehicles or less. This is the most common means for storage for transit agencies/services of that size alongside local network storage. Local hardcopy storage is still used by some transit agencies/services with 11 to 20 vehicles in their fleet, but it is no longer the most common method. No transit agencies/services with more than 21

29
vehicles employ local hardcopy storage. It was also shown that the use of local network storage continually increases with the size of an agency’s fleet, with a low of 33.3% for agencies with 10 or fewer vehicles to a high of 60% for agencies with more than 300 vehicles in their fleet.
3.2.2.13 Ridership Data Storage Format
A total of 37 Oregon transit agencies/services reported on the format in which they store their ridership data. Excel spreadsheets were the predominant data storage medium used by Oregon transit agencies/services (i.e., 62.2%) compared to 40% for out-of-state transit agencies/services. Out-of-state transit agencies/services preferred the use of relational databases much more (i.e., 100% vs. 21.6%) when compared to Oregon transit agencies/services.
The difference in storage format does not appear as significant when examining fleet size. Transit agencies/services with a fleet size of fewer than 300 vehicles consistently reported the use of Excel spreadsheets and specialized software. It is only for transit agencies/services with fleet sizes of greater than 300 vehicles where Excel is present in fewer than 25% of responses.
3.2.2.14 Ridership Data Access
A total of 34 Oregon transit agencies responded to the question of whether their ridership data is considered private or open, with 11 (i.e., 32%) indicating that their ridership data was considered open. This compares favorably to the results obtained from out-of-state transit agencies/services, which show that 20% consider their data open.
The fleet size of a transit agency/service was not shown to be a significant contributor of ridership data being considered open by a transit agency/service. Fleets with 81 to 300 vehicles only had two responses, both of which had private data, but with such a small sample size, it is difficult to draw conclusions.
The online questionnaire also allowed a text response for respondents to elaborate about the “openness” of their ridership data. In categorizing responses, transit agencies/services that described their data as “open” but that required significant administrative action to access it, had their process classified as private. This is likely due to the fact that the online questionnaire did not provide a specific definition of open data. In keeping with accepted intent of open standards and data, accessibility is a key consideration in determining status.
3.2.2.15 Ridership Data Uses and Employment
A total of 14 categorical uses of ridership data were recorded. Twelve of these were multiple choice options and two were developed from text responses. The twelve uses presented to survey responses as a multiple choice list included:
• Demonstrate overall system change

30
• Help identify least and most productive routes
• Identify candidate stops for elimination
• Determine maximum passenger loads
• Monitor schedule adherence and running times
• Calculate performance measures
• Adjust schedules (add/delete trips, change headways)
• Adjust running times, Revise routings
• Determine locations for shelters or other facilities
• Compile National Transportation Database (NTD) reports
• Validate travel demand models
• Transit service planning for transit oriented development
Oregon transit agencies use ridership data to validate travel demand models and to secure generic funding more often than out-of-state transit agencies/services. The latter use was gleaned from the textual responses provided by Oregon transit agencies. However, out-of-state transit agencies/services used ridership data more frequently for all of the other purposes than Oregon transit agencies/services. No noteworthy difference was observed with ridership data use as agency size varied.
3.2.2.16 Ridership Data Processing Steps
Thirty-three Oregon transit agencies/services provided 77 responses for steps taken to process their ridership data. The responses (i.e., “Compare with fare revenue,” “Look for unexplained variations across trips,” “Compare totals across days,” “Rely on the professional judgment of planner’s schedules,” “Use an automated program to analyze data,” “Compare boarding/alighting totals and adjust as needed,” and “Compare with manual counts”) were answered evenly throughout transit agencies of differing sizes. On average, 11 agencies responded to using each of the processing steps.
3.2.2.17 Ridership Data Analysis Tools
Oregon transit agencies/services provided 35 responses for analysis tools used. Of those responses, nine (i.e., 25.7%) use staff analysis and eight (i.e., 22.9%) use Excel. The remaining responses (i.e., “Unknown,” “Ecolane,” “RouteMatch,” “Transit Ace,” “NTD reporting,” “Access,” “ArcMap,” “SAS,” “SQL,” “Adept,” “TBEST,” and “Ride Express”) were marked by three or fewer agencies. No significant differentiation was observed between transit agencies/services with different fleet sizes.

31
3.2.2.18 Ridership Data Reporting Requirements
Oregon transit agencies/services provided 44 responses for reporting requirements of ridership data. Of those responses, 12 (i.e., 27.3%) report to NTD, 10 (i.e., 22.7%) to state government, and eight (i.e., 18.2%) for internal use. The remaining responses (i.e., “Partner organizations,” “City government,” “County government,” “Regional government,” and “Grant funding”) were used by four or fewer agencies. No significant differentiation was observed between transit agencies/services of different fleet sizes.
3.2.2.19 NTD Validation for Ridership Data
A total of 22 Oregon transit agencies/services responded regarding the steps taken with their ridership data for purposes of NTD validation. Of Oregon respondents, 10 (i.e., 45%) indicated that they were unsure about what steps were taken to validate their data for NTD reporting, and some indicated not knowing the purpose or process of NTD validation. This may be because not all respondents would necessarily be NTD reporters, but it indicates a disparity in knowledge regarding NTD procedures amongst those identified as transit agencies/services for the online questionnaire.
A large number of “Unknown” responses about methods of NTD data validation were tied to smaller Oregon transit agencies/services. This may be due to the fact that ODOT and the FTA provide the NTD validation service for these agencies. No transit agencies/services with a fleet size larger than 81 vehicles responded as not knowing their NTD validation methods.
Out-of-state transit agencies/services rely mostly on historical comparison for their NTD validation methods, which is also the most common recorded method of active NTD comparison provided by Oregon transit agencies/services. Once Oregon respondents with unknown validation methods are removed, Oregon and out-of-state transit agencies/services employ validation methods at similar rates.
3.2.3 State of Practice Summary
3.2.3.1 State of Ridership Data Quality and Collection
For Oregon transit agency/service respondents, the majority of ridership data is collected for bus and commuter bus modes at low resolution levels (i.e., route and trip levels), with a more moderate amount of higher resolution stop-level data collection. The generally larger out-of-state agency respondents report a higher proportion of stop-level ridership data collection, but also note relatively high proportions of route, trip, and system level ridership data.
For Oregon transit agencies/services, route- and system-level ridership data was reported as mostly available on a daily basis, while fewer reported having stop-level data on a daily basis. Conversely, out-of-state agencies show a higher proportion of daily stop-level boarding and alighting data availability than in-state agencies. A ridership data standard would likely benefit those currently collecting high-resolution data frequently, and

32
possibly motivate and direct those agencies who would like to improve the quality of their collected ridership data.
As depicted in Figure 3-1 (see section 3.2.1.1), 12 out of 33 questions of the questionnaire concentrate on developing a better understanding of issues associated with data collection and other related concerns. In present practice, the lack of automated ridership data collection means was clear, especially for smaller, rural, and/or non-fixed route agencies/services. The majority of agencies and service providers still rely on manual ridership data collection and cite presently unaddressed hurdles which prevent them from adopting automated means. While some smaller transit agencies/service did comment that automated data collection is not currently warranted or practical, several others expressed interest in exploring the option if it were more feasible under existing constraints. There was a trend noted in some agencies of increasing use of MDTs, AFC systems, and specialized transit software. Again, a ridership data standard would help provide guidance and direction to agencies interested in advancing their data collection practices and methods or in updating their data collection technology.
3.2.3.2 State of Ridership Data Analysis
In present practice, the degrees of ridership data analysis are highly correlated with the size of the fleet and the availability of resources at the different transit agencies. With regards to this ridership data category, the following key trends are noted:
• Agencies with the largest fleets have dedicated systems and resources for analysis and planning, while agencies of smaller scales often rely on staff experience and spreadsheets for planning decisions.
• Compared to larger agencies, smaller agencies report greater staff resources (relative to the size of the agency) being put toward ridership data analysis.
• As smaller agencies are dedicating more resources while still not adopting more advanced analysis, reducing the barriers for smaller agencies advancing their ridership data techniques should advance the state of their ridership data analysis significantly.
The development of a ridership data standard would support larger agencies by easing the sharing of ridership data with interested parties (much as occurred with GTFS) and reducing some barriers for smaller agencies by allowing common analysis services amongst such agencies.
3.2.3.3 State of Ridership Data Availability
The state of data availability and management closely mirrors that of data analysis. There does not yet exist a widely used ridership data standard. Therefore, collection of responses from agencies was undertaken with the understanding that the distribution method of ridership data employed by each agency may be unique. With regards to ridership data availability, the following key trends are noted:

33
• Oregon agencies have a greater rate than out-of-state respondents for open ridership data, but 68% of Oregon agencies still consider their ridership data private.
• There does not exist a shared understanding amongst Oregon transit agencies of the requirements of open ridership data.
Increasing the number of transit agencies releasing their data will benefit analysis and planning, and providing a data standard for distribution would simplify use of the data.

34

35
DEVELOPMENT OF THE RIDERSHIP DATA STANDARD
This chapter documents the development of the fixed-route transit ridership data standard known as GTFS-ride. The development of GTFS-ride was heavily informed by the analysis of the survey results collected for the current state of practice. GTFS-ride development was also influenced by the understanding of the value of storing a transit network description with ridership data. Given that nearly every transit provider in Oregon has published a description of their transit network through a GTFS feed, GTFS was seen as a familiar and well implemented data standard to use as another pillar for the development of GTFS-ride that would directly connect ridership data to the associated state of the transit network. This association of a precise description of the transit network state with its ridership makes ridership data more valuable and avoids possible loss of network context over time.
It should be noted that GTFS-ride was developed to target fixed-route transit services. While a demand-response, transit service data standard known as GTFS-flex is available at some agencies, GTFS-flex would not be compliant for use in conjunction with GTFS-ride to record demand response transit ridership because GTFS-flex augments the GTFS feed. In contrast, GTFS-ride uses GTFS as a basis. For example, GTFS-flex does not require stop_sequence to be included in stop_times.txt, but a correspondence to this field is a required component in the board_alight.txt file of GTFS-ride. It is probable that the GTFS-ride standard could be updated in the near future to support the use of GTFS-flex, or other related demand response transit data. Through the change process described in Section 4.3 and with explicit allowances and careful review for other potential conflicts, future versions of GFTS-ride could be expanded if such functionality and flexibility could be beneficial.
MAJOR COMPONENTS OF GTFS-RIDE
In its current form, GTFS-ride extends the core GTFS standard by incorporating five additional files for transit agencies to reflect their ridership information. Each additional file in GTFS-ride serves a specific purpose and contains ridership-specific fields. Every field in a given file was chosen and formatted with considerations such as benefit of inclusion, availability of data, and efficiency of format. It is important to note that the approach of adding additional files (instead of adding fields to existing GTFS files) was chosen to maintain the integrity of the GTFS standard.
Through the review of the survey results of the current state of practice, a picture was formed of the capabilities and interests of transit agencies and other stakeholders. Early drafts of GTFS-ride were shared between the project team and sponsors seeking feedback on the preliminary files, as well as the proposed fields and formats.
Eventually, five files were specified and developed to extend the GTFS standard, creating the GTFS-ride data standard which addresses the identified key elements of ridership data and

36
desired analysis capability. These five files are board_alight.txt, trip_capacity.txt, rider_trip.txt, ridership.txt, and ride_feed_info.txt.
4.1.1 GTFS-ride File board_alight.txt
The GTFS-ride file board_alight.txt was created to address the needs of transit agencies with stop-level, non-individualized ridership data. Transit agencies with vehicles equipped with APC technology are likely to collect ridership data that is well suited for board_alight.txt, but any agency with stop-level data may use this file. This file could also be used by transit agencies with station-level ridership data collection (e.g., a bus rapid transit system where ridership data is collected through gates at a station rather than with an on-board APC). Data easily connected to stop-level ridership (e.g., bike counts, ramp usage, etc.) were also included as fields to ease associations between ridership and other service-related measures.
As an additional feature of board_alight.txt, there are optional fields to indicate ridership counts that were outside of the originally associated active GTFS feed, or to indicate GTFS scheduled services that were canceled. These options are intended to allow for a rich and complete description of an agency’s ridership, even in instances of deviation from the scheduled services originally described in GTFS. However, it should be noted that any services added (i.e., trips or stops) not originally specified in GTFS for which an agency would like to report ridership in board-alight.txt will need to be specified first in the appropriate GTFS feed files (e.g., trips.txt, stops.txt, etc.). Otherwise, the ridership data corresponding to the added services cannot be included for analysis and reporting.
4.1.2 GTFS-ride File trip_capacity.txt
The GTFS-ride file trip_capacity.txt was created to assist transit agencies in relating ridership counts to the capacity of the transit vehicle for utilization and efficiency analysis. The capacity of a transit vehicle may be specified for a given trip using “trip_id”, or at the agency-wide level by using “agency_id”. Using the ridership data contained in trip_capacity.txt in combination with one of the GTFS-ride files that contains ridership counts (e.g., board_alight.txt, ridership.txt, or rider_trip.txt) will allow analysis of ridership relative to system capacities. As a further option for detailed information, capacities can also be further specified as either “standing” or “seated.” Following the capability in board_alight.txt, bike and wheelchair capacity fields are also provided to allow for more detailed analysis options.
4.1.3 GTFS-ride File rider_trip.txt
The GTFS-ride file rider_trip.txt was created to address the needs of transit agencies which collect data on individual riders. Transit agencies that employ AFC technology are likely to collect data well suited for rider_trip.txt. The ridership data fields included in rider_trip.txt (e.g., associated boarding and alighting times) were selected to enhance the unique analysis possibilities that exist with individualized ridership data. The individualized ridership data collected through AFC technologies (e.g., smart cards, RFID, and NFC) allows for the association of data to both a particular rider and to other details of a specific rider trip (e.g., fares paid, rider types, and accompanying devices by stops for time of day and day of week). For

37
example, with smart card scanning upon alighting, origin-destination pair associations are possible (although it is believed that no Oregon transit agencies currently collect this data).
The data reported in rider_trip.txt enables other potentially interesting analyses such as counts of senior riders by trips, counts of transfer riders by stops, quantile categorization for the destinations of disabled riders, etc. These examples only highlight the possibilities enabled through the data fields in rider_trip.txt, but currently, the availability of such detailed rider data is quite low.
4.1.4 GTFS-ride File ridership.txt
The GTFS-ride file ridership.txt was created to be inclusive of transit agencies that do not have the capability (or the resources) to collect stop-level ridership data consistently. At its highest level, the data contained in ridership.txt can represent system-wide ridership for any specified time period up to the entire GTFS feed active range. As all surveyed transit agencies held some interest in ridership data collection despite widely varying means, ridership.txt can be employed to reflect ridership data that is currently collected by a transit agency at any level (e.g., stop, trip, route, or system) and for any temporal settings (e.g., hour of day, day of week, daily, weekly, monthly, etc.)
One useful feature of ridership.txt is that special temporal aggregations are possible though including an existing “service_id”, or by creating a unique range defined through binary “day-of-week” selection fields. The GTFS-ride file ridership.txt also allows aggregation of ridership counts for specific elements in a transit system (e.g., stops combined with trips through “stop_id” and “trip_id”, respectively) to allow publication of ridership data that may hold specific interest (e.g., ridership at a stop closest to a state fair during its operation). It is anticipated that ridership.txt will be the most widely used file of the GTFS-ride set of files due to its flexibility in allowing the inclusion of data at many levels and through its enabling of unique analysis opportunities with customized aggregations.
4.1.5 GTFS-ride File ride_feed_info.txt
The GTFS-ride file ride_feed_info.txt includes data to describe the location of ridership data through the field “ride_files”, which indicates which ridership data files are employed in the GTFS-ride feed. The GTFS-ride file ride_feed_info.txt also helps to associate the GTFS-ride feed to the originating GTFS feed (i.e., the version of the GTFS feed reported by the field “feed_version”).
The GTFS-ride file ride_feed_info.txt was created as a corollary to the GTFS file feed_info.txt. While the GTFS file feed_info.txt is optional, it is helpful for associating the state of the transit network at the time the ridership data was collected. Without the “feed_start_date” and “feed_end_date” fields populated, the GTFS feed is assumed active only for the date range specified in calendar.txt or calendar_dates.txt.

38
ITERATIVE UPDATES OF GTFS-RIDE
Following the iterative development of the initial draft of the GTFS-ride ridership data standard between the project team and the ODOT TAC, additional input was requested from a select group of stakeholders in the public transit sector. Some of the stakeholders in this select group were identified through suggestions from previous contacts, whereas others were selected based on their high levels of development and involvement in the public transit sector as noted in publications, online forum activity, and questionnaire responses. Additionally, all questionnaire respondents who had indicated a willingness for further involvement with the project through their responses were also invited to review and comment on the initial draft data standard.
The stakeholders who participated and contributed to the validation and further development of the ridership data standard are shown in Table 4-1.
Table 4-1: Transit Stakeholders Organization Location
Trillium Solutions, Inc. Portland, Oregon Metro Transit Minneapolis–Saint Paul,
MN Volpe National Transportation Systems Center Cambridge, Massachusetts Tri-County Metropolitan Transportation District (TriMet) Portland, Oregon Massachusetts Bay Transportation Authority Boston, Massachusetts Community Transit Snohomish County, WA King County Metro Seattle, Washington UrbanLabs LLC Seattle, Washington San Diego Metropolitan Transit System San Diego, California Transport for London London, United Kingdom Blacksburg Transit Blacksburg, Virginia Remix San Francisco, California
As shown in Table 4-1, the group of stakeholders was very diverse, both geographically and with regard to their respective roles in the public transit sector. The stakeholders also varied greatly in the extent of their involvement and the amount of feedback they provided.
FINAL DRAFT RELEASE OF GTFS-RIDE
The result of the iterative development process was a final draft of the GTFS-ride ridership data standard on September 6, 2017. The complete and official first release of the GTFS-ride ridership data standard can be viewed online at the project’s GitHub repository (https://github.com/ODOT-PTS/GTFS-ride).
The primary constituent of GTFS-ride is a text file titled reference.md which describes in detail the required and optional data fields and files, and the formatting and presentation requirements needed to constitute a valid GTFS-ride data set. The file reference.md was structured to resemble the GTFS reference.md in order to appear familiar to those already using the GTFS standard.

39
The specific components of GTFS-ride in reference.md (i.e., those not also included in the GTFS standard) are included in Appendix C. Figure 4-1 depicts the high-level relationships between the files specific to the GTFS-ride ridership data standard and the files carried over from the GTFS standard.
The final draft release of the GTFS-ride ridership data standard was accomplished through several means and channels. After receiving sponsor validation and authorization, a plan for releasing GTFS-ride to the general public and interested parties was enacted. Several groups were individually contacted by the OSU project team members, including survey respondents, data standard development reviewers, and selected interested parties. A broader press release prepared by OSU and ODOT was used to announce the release of GTFS-ride to the national transit and academic communities, as well as through the Google Transit Developers Group forum. Additionally, other parties were informed by ODOT of the data standard’s release through web postings and government email distributions.
Any future updates to any portion of the first release of the GTFS-ride ridership data standard will follow an official change process and be communicated through official channels, all of which are described as part of the standard in the GitHub repository (https://github.com/ODOT-PTS/GTFS-ride/blob/master/CHANGES.md).

40
Figure 4-1: GTFS vs. GTFS-ride files relationships

41
GTFS-RIDE EXTRA COMPONENTS AND DOCUMENTATION
Several additional components and supporting documentation were developed either as official portions of the GTFS-ride ridership data standard, or as unofficial supporting elements. These elements of the GTFS-ride ridership data standard (along with the software components of the project) and their relationships are depicted in Figure 4-2.
The additional components and supporting documentation depicted in Figure 4-2 can be accessed via the GitHub repository and include the change request process, a user wiki, and example datasets. The GitHub repository also includes information on the data standard’s authorship and copyright. These items are intended to aid potential standard users at public and private transit agencies in better understanding and adopting GTFS-ride.
To encourage discussion about GTFS-ride and to generate ideas and/or suggestions for possible changes, an unofficial forum was also created using Google Groups (https://groups.google.com/forum/#!forum/gtfs-ride-changes). This forum is only intended to serve as a common place for discussing ideas and issues, and not as part of the official change request process.

42
Figure 4-2: Additional components and supporting documentation of GTFS-ride
SPR 803: Ridership Data Standard
GTFS-rideRidership Data Standard
GTFS-rideSupporting Elements
GTFS-rideSupport Software
GTFSFiles
GTFS-rideFiles
GTFS-rideExample Datasets
GTFS-rideWiki
GTFS-rideChange Process
GTFS-rideChanges Discussion Forum
GTFS-rideFeed Validator
GTFS-rideWeb Database
GTFS-rideReports
GTFS-rideData Entry/Edit/Import/
Export
GTFS-ride Software Tools Website
reference.md
GTFS-ride GitHub Repository
GTFS-ride ChangesGoogle Group
transitfeed-ride GitHub Repository
GTFS-rideSoftware Tutorial Videos
YouTube.com

43
DEVELOPMENT OF SOFTWARE SUPPORT TOOLS
In the initial project planning phase, it was determined that a key component to the success of any transit ridership data improvement project would be to provide support for a data standard. The support envisioned would be that which would increase the standard’s potential, both for implementation/use and for its practical usefulness at a broad range of transit agencies and industry stakeholders. To accomplish this goal, the project team and sponsors decided that a suite of web-based, open-source software tools should be developed.
DEVELOPING TECHNICAL AND FUNCTIONAL REQUIREMENTS
The process for creating the technical and functional requirements of the suite of software tools to be developed included a series of discussions and refinements among project team members, as well as consultations with the project sponsors at ODOT. As the consensus for software requirements was reached, a formalized depiction of the tools was then described in a technical memorandum which is included in Appendix D.
This technical memorandum details the agreed upon functional and technical requirements for the three main components of the software tool suite (i.e., GTFS-ride validation, web-based data entry, and reporting), and describes the development timeline and work distribution among project members. It was determined that the validation tool for GTFS-ride feeds should allow a user to check a completed set of GTFS-ride feed files for adherence to the requirements stipulated in the data standard, and then provide the necessary warnings and alerts for found issues. It was further decided that the existing GTFS validation tool from Google would be leveraged to build the GTFS-ride validation tool. This enabled the inclusion of its full functionality and only the additional validation needed for GTFS-ride specific files, fields, and relationships would be needed.
The functionality required for the data entry component was described as the need for users to be able to upload/import existing and correctly formatted data; manually enter and create files for collected data; edit uploaded data; and export completed GTFS-ride feeds. The functional requirements for the reporting component were described as the need to allow users to query data and generate useful reports from GFTS-ride feeds. It was also decided that these two main functional components (i.e., data entry and reporting) of the software tool suite would be supported with an online user interface and web-hosted relational database system to allow for ease of use and navigation and collective data storage and management, respectively.
DEVELOPING THE WEB-BASED SOFTWARE SUITE
A web-based software suite was developed to assist users in the implementation of GTFS-ride. The tools are separated into two main components: the WebHub (i.e., a website designed to

44
facilitate a database of GTFS-ride feeds and generate analyses from the data), and transitfeed-ride (i.e., a fork of GTFS’s transitfeed repository with the GTFS feed validation tool modified to validate GTFS-ride feeds). All the code for the two software components are readily available on GitHub (see Table 6-1). Tutorial videos for the suggested user interaction with this suite of software tools were also created, and are available on GitHub (see Table 6-1).
5.2.1 WebHub
The WebHub is an open-source web-interface for GTFS-ride users to generate, edit, upload, and analyze GTFS-ride feeds. The site uses the Java programming language for backend operations, Apache tomcat for web server operations, PostgreSQL for database management, and HTML, JavaScript, CSS for the user interface. The website is hosted on an Amazon Web Services (AWS) Elastic Cloud Compute t2.micro instance, whereas the database is hosted in an AWS Relational Database Service (RDS) db.t2.micro instance. AWS was selected as the backend host due to its reputation for reliability, ease of component management, and ability to scale as may prove necessary for future expansion. The t2.micro instances employed for development are the smallest and least expensive AWS offerings, allowing development costs to be kept low. The instances can be scaled as WebHub traffic demands without structural changes to the design.
5.2.1.1 The WebHub User Interface
The WebHub User Interface was designed to facilitate the management and analysis of GTFS-ride feeds. The user interface uses HTML, Javascript, and CSS to define how the user interacts with the dynamic elements of the WebHub. The main interface for the WebHub is depicted in Figure 5-1. The interface displays six menu options including “Home”, “Validation”, “Data Entry”, “Reports”, “About”, and “Contact.” As the names imply, each menu option provides user access to that specific aspect of the WebHub.

45
Figure 5-1: WebHub user interface
5.2.1.2 GTFS-ride Data Import, Update, and Export
The data management functionality is a key component of the WebHub. After selecting the “Data Entry” menu option, the user is presented with an interface to load, edit, and create GTFS-ride feeds. Data communications between the user, server, and database system are managed using Java and the Java Database Connection (JDBC) driver to interact with a PostgreSQL database hosted as an AWS RDS instance. Users can interface with the database in three ways:
1. Upload
• Users can upload a GTFS feed, a partial GTFS-ride feed, or a complete GTFS-ride feed into the WebHub database.
• For GTFS-ride files not included in the transit agency’s original upload, the “Create” page can be used to upload the missing files in a .csv file format with the correct column headers, which is then confirmed and loaded into the system for further processing/edits.
2. Update
• After the files are loaded into the system, edits may be made to a GTFS-ride file using the built-in WebHub text editor depicted in Figure 5-2.
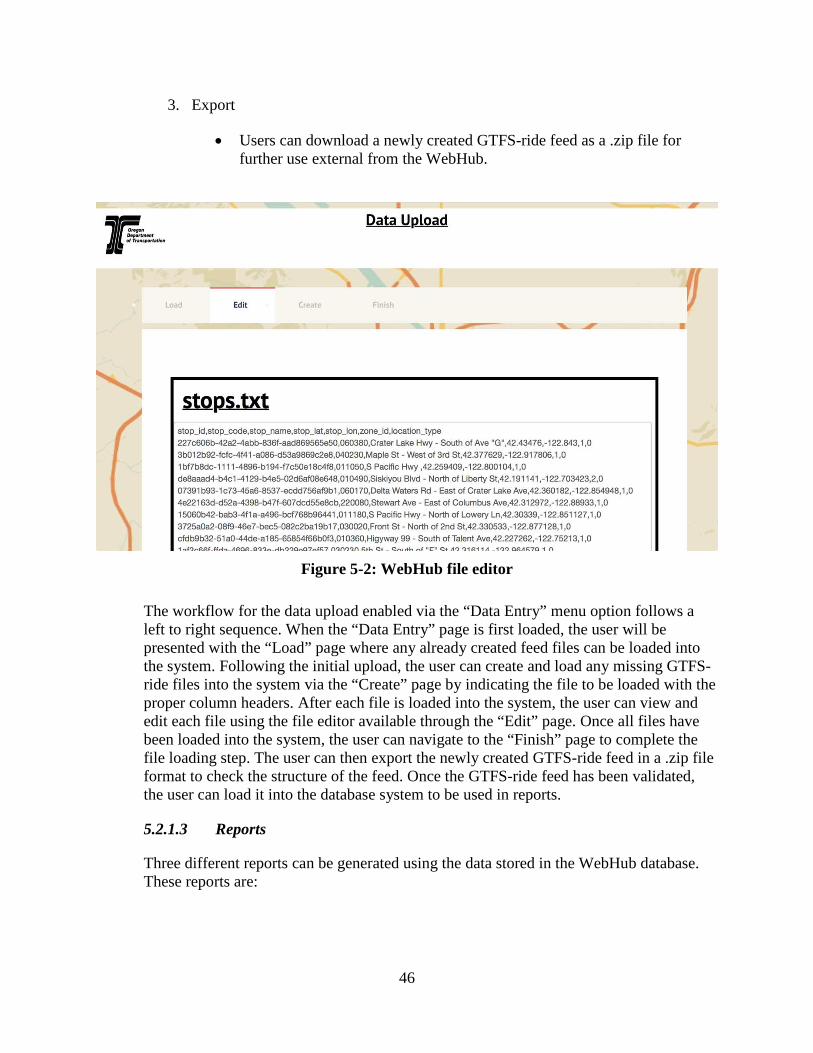
46
3. Export
• Users can download a newly created GTFS-ride feed as a .zip file for further use external from the WebHub.
Figure 5-2: WebHub file editor
The workflow for the data upload enabled via the “Data Entry” menu option follows a left to right sequence. When the “Data Entry” page is first loaded, the user will be presented with the “Load” page where any already created feed files can be loaded into the system. Following the initial upload, the user can create and load any missing GTFS-ride files into the system via the “Create” page by indicating the file to be loaded with the proper column headers. After each file is loaded into the system, the user can view and edit each file using the file editor available through the “Edit” page. Once all files have been loaded into the system, the user can navigate to the “Finish” page to complete the file loading step. The user can then export the newly created GTFS-ride feed in a .zip file format to check the structure of the feed. Once the GTFS-ride feed has been validated, the user can load it into the database system to be used in reports.
5.2.1.3 Reports
Three different reports can be generated using the data stored in the WebHub database. These reports are:

47
• Aggregate Ridership Report
• Performance Report
• Density Report
The report generation tool analyzes and formats data to be output in an easily understood PDF. The JavaScript library PDFMake is used to produce the reports. More details about the specific data fields included in each report are included in Appendix E.
A user can create reports based on a selected agency, report type, aggregation level, and start/end time. The main interface for the report builder in WebHub is depicted in Figure 5-3. Once each option is selected, the user can press the generate button to create a PDF report.
Figure 5-3: WebHub report panel
5.2.2 The GTFS-ride Validation Software Tool
As the name implies, the GTFS-ride validation software tool is used to validate the content and structure of a transit agency’s GTFS-ride feed. All source code for this software component is hosted in the GitHub repository ODOT-PTS/transitfeed-ride and is an extended fork of Google’s transitfeed repository. A Python script in the main directory of the repository (i.e., feedvalidator_ride.py) is the main GTFS-ride feed validation script. This Python script is a modified version of Google’s GTFS feed validation script found in the transitfeed library under the name feedvalidator.py.
The GTFS-ride validation software tool extends Google’s GTFS feed validator with modules for each GTFS-ride file that are used (within the main script) for checking file relationships. The feed validator may be run in Python from the command line with provided instructions. Windows OS users may download and run the executable file feedvalidator_ride.exe. The

48
Windows executable file allows users to drag-and-drop the GTFS-ride feed for validation. Other elements of Google’s transitfeed library have not been modified to be compatible with GTFS-ride.

49
CONCLUSIONS AND FUTURE WORK
Through the development of the GTFS-ride data standard, supporting protocols and documentation, and a suite of supporting web-based, open source software tools, the goals for this project outlined at its outset have been achieved. Table 6-1 shows the online locations for each of the project elements referenced in Figure 1-1. The availability of GTFS-ride now provides transit agencies with a standardized method to store and share collected ridership data.
Table 6-1: GTFS-Ride Project Element Locations Project Element Online Location
Data standard GitHub repository http://github.gtfs-ride.org/ Specifications http://spec.gtfs-ride.org/ Examples https://github.com/ODOT-PTS/GTFS-
ride/tree/master/spec/en/examples Wiki http://wiki.gtfs-ride.org/ Change process https://github.com/ODOT-PTS/GTFS-
ride/blob/master/CHANGES.md Changes discussion group http://changes.gtfs-ride.org/ Feed validation tool http://validation.gtfs-ride.org/ WebHub user website http://webhub.gtfs-ride.org/ WebHub source code https://github.com/ODOT-PTS/WebHub WebHub tutorial videos http://www.gtfs-ride.org/videos.html
The value of a data standard comes with broad commitment to its use. Transit agencies need to see enough value in GTFS-ride to transition away from familiar methods of collecting, storing and analyzing ridership data and toward investment in GTFS-ride. Sofware developers, as well as vendors of APC systems, fare systems, and analysis tools, need to support GTFS-ride by making it easy to use and clear to see benefits. Funding organizations need to adjust grant programs and procurement guidance to nudge transit agencies toward the use of GTFS-ride and to incentivize software vendors to support the standard.
Continued investment in easy-to-use open source software tools will help build the initial value proposition for GTFS-ride. These software tools will ideally provide benefits to transit agencies, from the highly sophisticated to those with more limited technical resources. Software tools also need to support the interests of funding and planning organizations, as well as facilitate easy incorporation and support for GTFS-ride into third party software tools. With continued adoption and use of GTFS-ride, regional and statewide organization will be better positioned to better understand transit demand across transit agencies and to improve modeling, analyzing, and reporting on transit networks. These organizations will also be able to develop more effective policies and make more informed investment decisions.

50

51
REFERENCES
Barabino, B., Di Francesco, M., & Mozzoni, S. (2014). An offline framework for handling automatic passenger counting raw data. IEEE Transactions on Intelligent Transportation Systems, 15(6), 2443-2456.
Bauer, D., Ray, M., & Seer, S. (2011). Simple sensors used for measuring service times and counting pedestrians: Strengths and weaknesses. Transportation Research Record: Journal of the Transportation Research Board, (2214), 77-84.
Boyle, D. K. (2006). TCRP synthesis 66: Fixed-route transit ridership forecasting and service planning methods. Washington, D.C.: Transportation Research Board, National Research Council.
Boyle, D. K. (2008). TCRP synthesis 77: Passenger counting systems. Washington, D.C.: Transportation Research Board, National Research Council.
Boyle, D. K. (1998). TCRP synthesis 29: Passenger counting technologies and procedures. Washington, D.C.: Transportation Research Board, National Research Council.
Bureau of Transportation Statistics. (2016). Passenger travel facts and figures 2016. Washington, D.C.: U.S. Department of Transportation.
Chandesris, M., & Remy, A. (2016). New (big) data for mobility knowledge and management. some experiences and open challenges. Paper presented at the Transit Data 2016: 2nd International Workshop on Automated Data Collection Systems, Northeastern University, Boston, Massachusetts.
Chu, X. (2004). Ridership models at the stop level. (Final Report No. NCTR-473-04, BC137-31). Tampa, FL: National Center for Transit Research (NCTR).
Chu, X., Polzin, S. E., Pendyala, R. M., Siddiqui, N. A., & Ubaka, M. (2007). Framework of modeling and forecasting stop-level transit patronage. Paper presented at the Transportation Research Board 86th Annual Meeting, (07-1632)
Dill, J., Schlossberg, M., Ma, L., & Meyer, C. (2013). Predicting transit ridership at the stop level: The role of service and urban form. Paper presented at the 92nd Annual Meeting of the Transportation Research Board, Washington, DC.
Dunlap, M., Li, Z., Henrickson, K., & Wang, Y. (2016). Estimation of origin and destination information from Bluetooth and wi-fi sensing for transit. Paper presented at the Transportation Research Board 95th Annual Meeting, (16-6837)

52
Eros, E., Mehndiratta, S., Zegras, C., Webb, K., & Ochoa, M. (2014). Applying the general transit feed specification to the global south: Experiences in Mexico City, Mexico—and beyond. Transportation Research Record: Journal of the Transportation Research Board, (2442), 44-52.
Fayyaz, S., Kiavash, S., Liu, X. C., & Porter, R. J. (2016). A genetic-algorithm and regression-based model for analyzing fare payment structure and transit dwell time. Paper presented at the Transportation Research Board 95th Annual Meeting, (16-4815)
Federal Transit Administration, Office of Budget and Policy. (2016). 2016 NTD policy manual. Washington, D.C.: U.S. Department of Transportation. Retrieved from https://www.transit.dot.gov/sites/fta.dot.gov/files/docs/Report%20Year%202016%20Policy%20Manual_1.pdf
Fihn, J., & Finndahl, J. (2011). A framework for how to make use of an automatic passenger counting system. (Master’s Thesis). Uppsala University, Uppsala, Sweden.
García-Bunster, G., & Torres-Torriti, M. (2008). Effective pedestrian detection and counting at bus stops. Paper presented at the Robotic Symposium, 2008. LARS'08. IEEE Latin American, 158-163.
Google Maps Transit. Accessed on 2 Dec. 2016. https://maps.google.com/landing/transit/index.html
Greneker, E., Murphy, K., Johnson, B., & Rausch, E. (1996). Improved passenger counter and classification system for transit operations. (Technical report). Washington DC: Transportation Research Board of The National Academies.
Hodges, C. C. (1985). Automatic passenger counter systems: The state of the practice. final report. (No. DOT-I-87-36). Washington, D.C: Office of Planning Assistance, Urban Mass Transportation Administration.
Kimpel, T., Strathman, J., Griffin, D., Callas, S., & Gerhart, R. (2003). Automatic passenger counter evaluation: Implications for national transit database reporting. Transportation Research Record: Journal of the Transportation Research Board, (1835), 93-100.
Kirby, J. (2016). Using security cameras to count transit passengers. (Project Abstract). North Carolina State University, Raleigh, NC. (FHWA/NC/2017-16). Retrieved from https://trid.trb.org/view.aspx?id=1424438
Kostakos, V., Camacho, T., & Mantero, C. (2013). Towards proximity-based passenger sensing on public transport buses. Personal and Ubiquitous Computing, 17(8), 1807-1816.
Kotz, A. J., Kittelson, D. B., & Northrop, W. F. (2015). Novel vehicle mass-based automated passenger counter for transit applications. Transportation Research Record: Journal of the Transportation Research Board, (2536), 37-43.

53
Kuutti, J. (2012). A test setup for comparison of people flow sensors (Licentiate's Thesis). Aalto University, Espoo, Finland.
Nassir, N., Khani, A., Lee, S., Noh, H., & Hickman, M. (2011). Transit stop-level origin-destination estimation through use of transit schedule and automated data collection system. Transportation Research Record: Journal of the Transportation Research Board, (2263), 140-150.
Oberli, C., Torres-Torriti, M., & Landau, D. (2010). Performance evaluation of UHF RFID technologies for real-time passenger recognition in intelligent public transportation systems. IEEE Transactions on Intelligent Transportation Systems, 11(3), 748-753.
Paget-Seekins, L., & Tribone, D. (2016). Releasing data to the public: APIs, dashboards, and data policy. Paper presented at the Transit Data 2016: 2nd International Workshop on Automated Data Collection Systems, Northeastern University, Boston, Massachusetts.
Pelletier, M., Trépanier, M., & Morency, C. (2011). Smart card data use in public transit: A literature review. Transportation Research Part C: Emerging Technologies, 19(4), 557-568.
Peterson, D. (2013). Effortless passenger identification system: Final report. transit IDEA project 70. Washington D.C.: Transportation Research Board, National Research Council.
Polzin, S. E. (2016). Implications to public transportation of emerging technologies. University of South Florida: National Center for Transit Research.
Porter, J. D., Kim, D. S., Ghanbartehrani, S., Mohseni, A. & Barahimi, P. (2016). Transit network analysis software tool wiki. Retrieved from https://tnasoftwaretool.engr.oregonstate.edu/TNAtoolAPI-Webapp/wiki/#!index.md
Reddy, A., Lu, A., Kumar, S., Bashmakov, V., & Rudenko, S. (2009). Entry-only automated fare-collection system data used to infer ridership, rider destinations, unlinked trips, and passenger miles. Transportation Research Record: Journal of the Transportation Research Board, (2110), 128-136.
Saavedra, M. R. (2010). An automated quality assurance procedure for archived transit data from APC and AVL systems (Master’s Thesis). University of Waterloo, Waterloo, Ontario, Canada.
Schweiger, C. L. (2015). TCRP synthesis 115: Open data: Challenges and opportunities for transit agencies. Transportation Research Board, National Research Council.
Strathman, J. G., & Hopper, J. R. (1991). Evaluation of automatic passenger counters: Validation, sampling, and statistical inference. Transportation Research Record no. 1308, Public Transit Research: Rail, Bus, and New Technology, (1308), 69-77.

54
Strathman, J., Kimpel, T., & Callas, S. (2005). Validation and sampling of automatic rail passenger counters for national transit database and internal reporting at TriMet. Transportation Research Record: Journal of the Transportation Research Board, (1927), 217-222.
Trépanier, M., & Morency, C. (2010). Assessing transit loyalty with smart card data. Paper presented at the 12th World Conference on Transport Research. Lisbon, Portugal.
Trépanier, M., Morency, C., & Agard, B. (2009). Calculation of transit performance measures using smartcard data. Journal of Public Transportation, 12(1), 5.
Yahiaoui, T., Khoudour, L., & Meurie, C. (2010). Real-time passenger counting in buses using dense stereovision. Journal of Electronic Imaging, 19(3), 031202-031202-11.
Yang, T., Zhang, Y., Shao, D., & Li, Y. (2010). Clustering method for counting passengers getting in a bus with single camera. Optical Engineering, 49(3), 037203-037203-10.

APPENDIX A
TRANSIT AGENCY QUESTIONNAIRE


A - 1
ODOT SPR 803 This questionnaire will help the Oregon DOT and OSU researchers better understand your transit ridership data collection, storage, sharing, reporting, and analysis. Please answer each relevant question to the best of your knowledge. Please leave blank any question(s) that may not pertain to your transit agency or services. We thank you in advance for your support in answering this questionnaire. 1. Agency and Service(s) Name: 2. Number of vehicles in fleet:
Owned (1) Contracted (2)
3. Type of Area Served (select all that apply): Urban (1) Rural (2) 4. What services are operated? Fixed and non-fixed route (1) Only fixed route (2) Only non-fixed route (3)
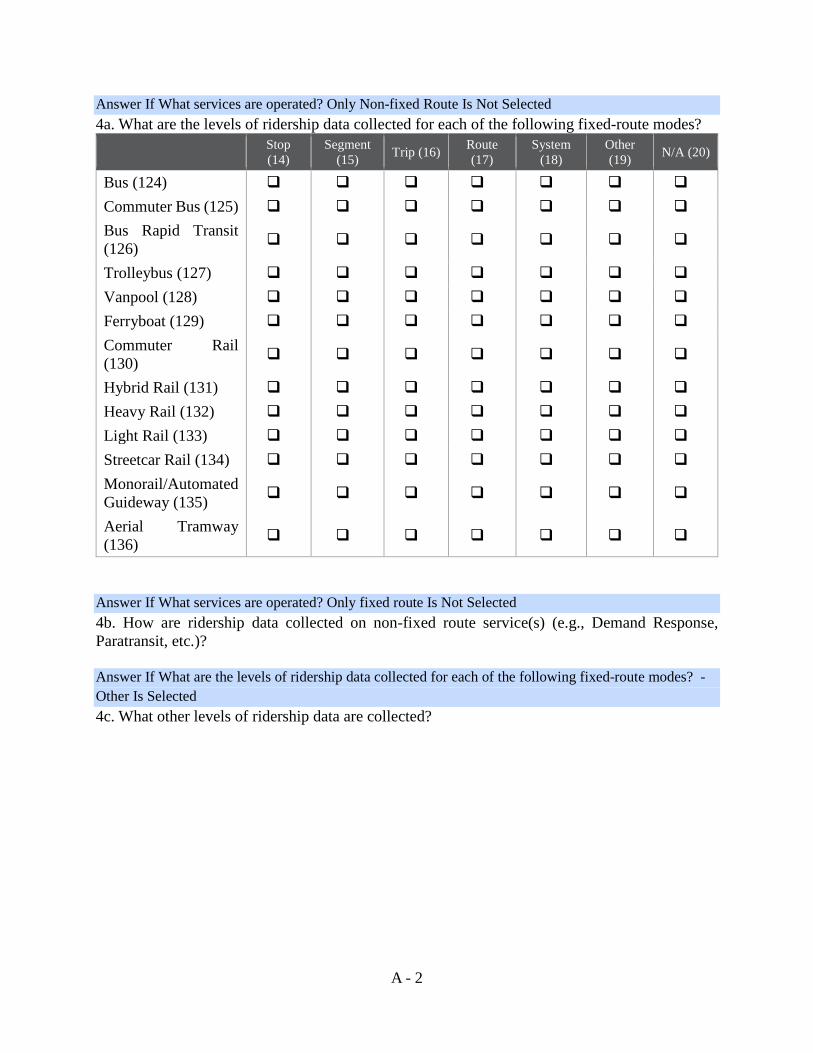
A - 2
Answer If What services are operated? Only Non-fixed Route Is Not Selected 4a. What are the levels of ridership data collected for each of the following fixed-route modes?
Stop (14)
Segment (15) Trip (16) Route
(17) System
(18) Other (19) N/A (20)
Bus (124) Commuter Bus (125) Bus Rapid Transit (126)
Trolleybus (127) Vanpool (128) Ferryboat (129) Commuter Rail (130)
Hybrid Rail (131) Heavy Rail (132) Light Rail (133) Streetcar Rail (134) Monorail/Automated Guideway (135)
Aerial Tramway (136)
Answer If What services are operated? Only fixed route Is Not Selected 4b. How are ridership data collected on non-fixed route service(s) (e.g., Demand Response, Paratransit, etc.)? Answer If What are the levels of ridership data collected for each of the following fixed-route modes? - Other Is Selected 4c. What other levels of ridership data are collected?

A - 3
5. Please indicate the availability of data for each of the following items.
Daily (1)
Weekly (2)
Monthly (3)
Quarterly (4)
Annually (5)
As Needed
(6) N/A (7)
System ridership (1) Route-level ridership (2)
Route segment ridership (3)
Stop-level boardings/alightings (4)
Performance measures (5)
Schedule adherence (6)
Running Times (7) 6. How are ridership data collected? Select all that apply. Automated passenger counters (APC) (1) Registering fareboxes (2) Handheld data collection units (e.g. Mobile Data Terminals - MDT) (3) Driver's trip log (4) Other: (please explain) (5) ____________________ 7. Which supplementary details about ridership data are collected in addition to counts? Timestamps (2) GPS coordinates (3) Fare types (4) Transfer status (5) Special Rider Types (6) Bicycles (7) Wheelchairs (8) Other medical or mobility devices (9) Other details (please specify) (10) ____________________ Please describe how the selected details are collected: (11) ____________________ No supplementary details collected (1) 8. What percentage of the fleet (i.e., owned and subcontracted) is equipped with APCs? ______ Owned (1) ______ Subcontracted (2)

A - 4
9. If not all vehicles in the fleet are equipped with APCs, how are the APC-equipped vehicles assigned to service runs? 10. What barriers, if any, does your organization see to implementing APC devices? 11. If combinations of automated and manual methods are used, please describe how each is used? 12. If automated methods are used, what are the manufacturers and models of the devices? 13. If manual surveys are conducted to collect ridership data, please answer the following questions:
How often are these surveys conducted? (1) How many surveys are handed out? (2) On what proportion of trips or routes do you apply these surveys? (3) How are the survey data used to estimate ridership? (4)
14. If sampling methods are employed as an alternative to detailed ridership counts, please answer the following questions:
How often are these samples taken? (1) What is the sample size? (2) On what proportion of trips or routes do you perform sampling? (3) How are the sample data used to estimate ridership? (4)
15. If the process(es) by which your agency collects ridership data have changed in the last three years, could you please explain the differences? 16. What is the total employee FTE allocated to the collection and management of ridership data? 17. How are the raw ridership data transferred from electronic collection devices to storage? Direct downlink with a physical connection (1) Retrieval at garage without a physical connection (2) Real-time dynamic or periodic remote retrieval (3) Removable storage medium (i.e., diskette, memory stick, memory card, etc.) (4) Other: (please explain) (5) ____________________ 18. How are the raw and/or processed data physically stored (e.g., network drive, cloud storage, memory stick, files in filing cabinet, etc.)?

A - 5
19. In what formats are ridership data stored? Comma Separated Values (CSV) (1) Excel spreadsheet (2) Relational database (3) Specialized software (4) Handwritten ledger (5) Other: (please specify) (6) ____________________ 20. Are the ridership data considered open data or considered private to the agency? 21. If ridership data are made available to the public, please provide a URL. 22. What processing steps are needed to edit and validate collected ridership data? Compare with fare revenue (1) Look for unexplained variations across trips (2) Compare totals across days (3) Rely on the professional judgment of planner’s schedules (4) Use an automated program to analyze data (5) Compare boarding/alighting totals and adjust as needed (6) Compare with manual counts (7) Other: (please explain) (8) ____________________ 23. What are the purposes for which ridership data are collected and used at your agency? Select all that apply. Demonstrate overall system change (1) Help identify least and most productive routes (2) Identify candidate stops for elimination (3) Determine maximum passenger loads (4) Monitor schedule adherence and running times (5) Calculate performance measures (6) Adjust schedules (add/delete trips, change headways) (7) Adjust running times, Revise routings (8) Determine locations for shelters or other facilities (9) Compile National Transportation Database (NTD) reports (10) Validate travel demand models (11) Transit service planning for transit oriented development (12) Other: (please explain) (13) ____________________ 24. What methods and/or software tools are used to analyze collected ridership data?

A - 6
25. What ridership data reporting requirements (internal and external) currently exist for your agency? 26. What are the resolution, frequency, and supplementary details required for reporting? 27. For NTD reporters, please describe any steps that are taken to validate ridership data for NTD reporting purposes. 28. Please provide any additional information that will aid in better understanding how your agency/service collects, stores, shares, reports, and analyzes ridership data. 29. Are you willing to provide contact information for possible follow-up questions? Yes (1) No (2) Answer If Are you willing to provide contact information for possible follow-up questions? Yes Is Selected 30. Contact name: Answer If Are you willing to provide contact information for possible follow-up questions? Yes Is Selected 31. Preferred method of contact: Telephone (1) E-mail (2) Answer If Are you willing to provide contact information for possible follow-up questions? Yes Is Selected 32. Contact telephone: Answer If Are you willing to provide contact information for possible follow-up questions? Yes Is Selected 33. Contact e-mail:

APPENDIX B
LIST OF RESPONDENTS


B - 1
OREGON TRANSIT AGENCIES/SERVICES
AGENCY NAME 1 Basin Transit Service 2 Benton County Rural and Special Transportation 3 Blue Star Charters and Tours 4 Burns Paiute - Tribal Transit Services 5 Central Oregon Breeze 6 Central Oregon Intergovernmental Council 7 City of Albany, Albany Transit System 8 City of Hermiston Senior & Disabled Taxi Ticket Program 9 City of Lebanon Dial-a-Bus
10 City of Pendleton 11 City of Sandy, Transit 12 Clackamas County Social Services, Mt Hood Express 13 Community Action Program of East Central Oregon, Door to Door non-emergent medical
transportation 14 Community Connection of Northeast Oregon 15 Community Connection of Wallowa County 16 Confederated Tribes of the Umatilla Indian Reservation/Kayak Public Transit 17 Coos County Area Transit Service District 18 Corvallis Transit System 19 Douglas County 20 Ecoshuttle 21 Gilliam County Transportation 22 Grant County Transportation District 23 Hood River County Transportation District 24 Josephine Community Transit, Josephine County - fixed route, commuter route, demand
response and paratransit 25 Klamath Basin Senior Citizens' Center 26 Lake County Public Transit 27 Lane Transit District E&D Services 28 Lincoln County Transit 29 Malheur Council on Aging & Community Services 30 Mid-Columbia Council of Governments 31 MTR Western 32 Northeast Oregon Public Transit 33 Opportunity Foundation of Central Oregon 34 South Metro Area Regional Transit (SMART) 35 Rogue Valley Transit District (RVTD) 36 Salem Area Mass Transit District (Cherriots, CARTS, CherryLift, West Salem Connector,
and RED Line) 37 Senior Citizens of Sweet Home, Inc. (Linn Shuttle) Linn Shuttle, Sweet Home Dial-A-Bus,
Linn County DD transportation 38 Sherman County Community Transportation

B - 2
AGENCY NAME 39 South Lane Wheels 40 Sunset Empire Transportation 41 TAC Transportation, Inc. 42 The Klamath Tribes-Transportation 43 The Loop Morrow County Transportation 44 Tillamook County Transportation District 45 TriMet 46 Warm Springs Transit 47 Wheeler County Community Transportation
OUT-OF-STATE TRANSIT AGENCIES/SERVICES
AGENCY NAME
1 Blacksburg Transit, a division of the Town of Blacksburg 2 Community Transit, Snohomish County, WA 3 King County Metro 4 RTC of Southern Nevada 5 San Diego Metropolitan Transit System 6 Transport For London

APPENDIX C
GTFS-RIDE DATA STANDARD


C - 1
GTFS-ride Version as of September 6, 2017. This document explains the types of files that comprise a GTFS-ride dataset and defines the fields used in all of those files. The bolded files are those unique to GTFS-ride. They are not included in standard GTFS.
Table of Contents
1. Term Definitions 2. Feed Files 3. File Requirements 4. Field Definitions
o board_alight.txt o trip_capacity.txt o rider_trip.txt o ridership.txt o ride_feed_info.txt
Term Definitions
Retrieved from GTFS https://github.com/google/transit/blob/master/gtfs/spec/en/reference.md
This section defines terms that are used throughout this document.
• Field required - The field column must be included in your feed, and a value must be provided for each record. Some required fields permit an empty string as a value. To enter an empty string, just omit any text between the commas for that field. Note that 0 is interpreted as "a string of value 0", and is not an empty string. Please see the field definition for details.
• Field optional - The field column may be omitted from your feed. If you choose to include an optional column, each record in your feed must have a value for that column. You may include an empty string as a value for records that do not have values for the column. Some optional fields permit an empty string as a value. To enter an empty string, just omit any text between the commas for that field. Note that 0 is interpreted as "a string of value 0", and is not an empty string.
• Dataset unique - The field contains a value that maps to a single distinct entity within the column. For example, if a route is assigned the ID 1A, then no other route may use that route ID. However, you may assign the ID 1A to a location because locations are a different type of entity than routes.

C - 2
Feed Files
This specification includes the following files along with their associated content. Bolded files are unique to GTFS-ride, while the rest reference GTFS files. GTFS-ride follows, and by default adopts, changes in GTFS files already specified in GTFS-ride. If a new file is added to GTFS, its inclusion in GTFS-ride will follow the change process specified for any change to GTFS-ride. More information on the GTFS files may be found at https://github.com/google/transit/blob/master/gtfs/spec/en/reference.md.
Filename Required Defines
agency.txt Required One or more transit agencies that provide the data in this feed.
stops.txt Required Individual locations where vehicles pick up or drop off passengers.
routes.txt Required Transit routes. A route is a group of trips that are displayed to riders as a single service.
trips.txt Required Trips for each route. A trip is a sequence of two or more stops that occurs at a specific time.
stop_times.txt Required Times that a vehicle arrives at and departs from individual stops for each trip.
calendar.txt Required Dates for service IDs using a weekly schedule. Specify when service starts and ends, as well as days of the week where service is available.
calendar_dates.txt Optional Exceptions for the service IDs defined in the calendar.txt file. If calendar.txt includes ALL dates of service, this file may be specified instead of calendar.txt.
fare_attributes.txt Optional Fare information for a transit organization's routes.
fare_rules.txt Optional Rules for applying fare information for a transit organization's routes.
shapes.txt Optional Rules for drawing lines on a map to represent a transit organization's routes.
frequencies.txt Optional Headway (time between trips) for routes with variable frequency of service.
transfers.txt Optional Rules for making connections at transfer points between routes.
feed_info.txt Optional Additional information about the feed itself, including publisher, version, and expiration information.

C - 3
Filename Required Defines
board_alight.txt Optional Tracks boardings/alightings along with associated information at stop-level.
trip_capacity.txt Optional Provides the capability to identify the capacities of vehicles used to provide service.
rider_trip.txt Optional Includes anonymized data about specific riders' trip.
ridership.txt Optional Provides the capability to supply ridership counts at various levels of aggregation.
ride_feed_info.txt Required Information specific to the source and attributes of the additional ridership files.
File Requirements
Retrieved from GTFS https://github.com/google/transit/blob/master/gtfs/spec/en/reference.md
The following requirements apply to the format and contents of your files:
• All files in a General Transit Feed Spec (GTFS) feed must be saved as comma-delimited text.
• The first line of each file must contain field names. Each subsection of the Field Definitions section corresponds to one of the files in a transit feed and lists the field names you may use in that file.
• All field names are case-sensitive. • Field values may not contain tabs, carriage returns or new lines. • Field values that contain quotation marks or commas must be enclosed within quotation
marks. In addition, each quotation mark in the field value must be preceded with a quotation mark. This is consistent with the manner in which Microsoft Excel outputs comma-delimited (CSV) files. For more information on the CSV file format, see http://tools.ietf.org/html/rfc4180. The following example demonstrates how a field value would appear in a comma-delimited file:
• Original field value: Contains "quotes", commas and text • Field value in CSV file: "Contains ""quotes"", commas and text"
• Field values must not contain HTML tags, comments or escape sequences. • Remove any extra spaces between fields or field names. Many parsers consider the
spaces to be part of the value, which may cause errors. • Each line must end with a CRLF or LF linebreak character. • Files should be encoded in UTF-8 to support all Unicode characters. Files that include the
Unicode byte-order mark (BOM) character are acceptable. Please see the Unicode FAQ for more information on the BOM character and UTF-8.
• Zip the files in your feed.

C - 4
Field Definitions
Only files unique to GTFS-ride are defined below. Definitions for all other files may be found at https://github.com/google/transit/blob/master/gtfs/spec/en/reference.md
board_alight.txt
File: Optional
Field Name Required Details
trip_id Required The trip_id contains an ID that uniquely identifies a trip.
stop_id Required The stop_id contains an ID that uniquely identifies a stop.
stop_sequence Required The stop_sequence identifies the order of the stops for a particular trip. Matches stop_sequence in stop_times.txt. Non-negative integer.
record_use Required
The record_use field indicates the purpose of this record. Data in the fields schedule_relationship, boardings, and alightings should correspond to the selection for record_use.
* 0 - Entry contains complete ridership counts for the associated stop_id in the field(s) boardings and/or alightings as available.
* 1 - Entry contains no ridership counts, but contains service cancellation data in schedule_relationship.
schedule_relationship Optional
The schedule_relationship field identifies whether service was scheduled and operated, or scheduled but not operated, or operated but not scheduled. If a trip is added it must have a trip_id that is not scheduled to run on that day and is unique among trips added on that day.
* 0 - Service was scheduled and operated. * 1 - Whole scheduled trip was cancelled.
* 2 - Whole scheduled trip was cancelled, but replaced with an added trip.
* 3 - Trip ran but this stop_time was cancelled.

C - 5
Field Name Required Details
* 4 - Trip ran but this stop_time was cancelled, but replaced with a different stop.
* 5 - Whole trip was added. * 6 - Whole trip was added as a replacement. * 7 - This stop_time was added to a scheduled trip.
* 8 - This stop_time was added to a scheduled trip, replacing something cancelled.
boardings Optional
The boardings field contains the number of boardings at (or nearest to, in the case of boardings between stops) the associated stop_id as collected by either automated or manual methods. Non-negative integer.
alightings Optional
The alightings field contains the number of alightings at (or nearest to, in the case of alightings between stops) the associated stop_id as collected by either automated or manual methods. Non-negative integer.
current_load Optional
The current_load field contains the calculated percentage current load of a vehicle at the identified stop. The state at which current_load is measured, is specified by load_type; if no value is given in load_type, current_load is arriving load. Non-negative integer.
load_type Optional
The load_type field specifies the state (arriving or departing) at which current_load is measured. If no value is given, current_load indicates arriving load
* 0 - Arriving. * 1 - Departing.
rack_down Optional
The rack_down field indicates whether an external bike rack was deployed or remained down at the associated stop_id. This field should be used in conjunction with bike_boardings and bike_alightings if complete bike boarding and alighting counts are available.
* 0 - Bike rack retracted and/or stowed.

C - 6
Field Name Required Details * 1 - Bike rack deployed and/or in use.
bike_boardings Optional
The bike_boardings field contains the total count of bike boardings at the identified stop and trip. This value represents both bikes racked externally and bikes brought inside the passenger compartment. Non-negative integer.
bike_alightings Optional
The bike_alightings field contains the total count of bike alightings at the identified stop and trip. This value represents both bikes racked externally and bikes brought inside the passenger compartment. Non-negative integer.
ramp_used Optional
The ramp_used field indicates whether a ramp or lift was used at the associated stop_id. This field should be used in conjunction with ramp_boardings and ramp_alightings if complete ramp/lift boarding and alighting counts are available.
* 0 - No ramp/lift used. * 1 - Ramp/lift deployed.
ramp_boardings Optional The ramp_boardings field contains the total count of ramp or lift deployed boardings at the identified stop_id. Non-negative integer.
ramp_alightings Optional The ramp_alightings field contains the total count of ramp or lift deployed alightings at the identified stop_id. Non-negative integer.
service_date Optional The service_date field contains the date of the associated boarding and/or alighting data at the identified stop. The format is YYYYMMDD.
service_arrival_time Optional The service_arrival_time field contains the time of the actual arrival at the identified stop. The format is HH:MM:SS.
service_departure_time Optional The service_departure_time field contains the time of the actual departure from the identified stop. The format is HH:MM:SS.
source Optional The source field contains the collection method of the associated data.

C - 7
Field Name Required Details * 0 - Manual. * 1 - APC. * 2 - AFC. * 3 - Model estimation. * 4 - Mixed source.
trip_capacity.txt
File: Optional
Field Name Required Details
agency_id Optional
The agency_id field contains the ID of the agency associated with the capacity data. This value is referenced from the agency.txt file. Use this field when you are providing data from more than one agency.
trip_id Optional
The trip_id field contains an id that uniquely identifies a trip. If an agency has only one type of vehicle, or operated only one type of vehicle on the given service_date, it can leave trip_id blank to specify the capacity of all trips with one record.
service_date Optional
The service_date field contains the date of the trip. If an agency has only one type of vehicle, or only ever operates one type of vehicle on the given trip, it can leave service_date blank to specify the capacity of all dates with one record. The format is YYYYMMDD.
vehicle_description Optional
The vehicle_description field contains the additional information about the vehicle(s) associated with agency_id, trip_id, and/or service_date needed for analysis or reporting.
seated_capacity Optional The seated_capacity field contains the number of passenger seats. Non-negative integer.
standing_capacity Optional The standing_capacity field contains the maximum number of standees according to agency policy. Non-negative integer.

C - 8
Field Name Required Details
wheelchair_capacity Optional The wheelchair_capacity field contains the maximum number of wheelchairs vehicle will accommodate. Non-negative integer.
bike_capacity Optional The bike_capacity field contains the maximum number of bikes vehicle will accommodate. Non-negative integer.
rider_trip.txt
File: Optional
Field Name Required Details
rider_id Required The rider_id field contains the ID of a unique rider. The rider_id is dataset unique.
agency_id Optional
The agency_id field contains the ID of the agency associated with the unique rider. This value is referenced from the agency.txt file. Use this field when you are providing data from more than one agency.
trip_id Optional
The trip_id field contains the ID of the trip associated with the unique rider, if this is known. If trip_id is empty, then the rider may have taken one of several trips, or several possible chains of trips, to travel between the origin and the destination.
boarding_stop_id Optional The boarding_stop_id field contains the ID of the boarding stop associated with the unique rider.
boarding_stop_sequence Optional
The boarding_stop_sequence field identifies the order of the stop referenced boarding_stop_id within a particular trip. Matches stop_sequence in stop_times.txt. Non-negative integer.
alighting_stop_id Optional The alighting_stop_id field contains the ID of the alighting stop associated with the unique rider.
alighting_stop_sequence Optional
The alighting_stop_sequence field identifies the order of the stop referenced alighting_stop_id within a particular trip. Matches stop_sequence in stop_times.txt. Non-negative integer.

C - 9
Field Name Required Details
service_date Optional The service_date field contains the date of the boarding associated with the unique rider.
boarding_time Optional
The boarding_time field contains the time of the boarding associated with the unique rider. If the trip_id is included, boarding_time represents the time that the rider boarded the vehicle. It must be between service_arrival_time and service_departure_time, inclusive, of the trip’s stop in board_alight.txt if applicable. If the trip_id is not included, boarding_time represents the time that the rider entered the transit network.
alighting_time Optional
The alighting_time field contains the time of the alighting associated with the unique rider. If the trip_id is included, alighting_time represents the time that the rider exited the vehicle. It must be between service_arrival_time and service_departure_time, inclusive, of the trip’s stop in board_alight.txt if applicable. If the trip_id is not included, alighting_time represents the time that the rider left the transit network.
rider_type Optional The rider_type field contains information on the rider type of the unique rider.
* 0 - No special rider type. * 1 - Senior. * 2 - Child. * 3 - Student. * 4 - Youth. * 5 - Disabled. * 6 - Military. * 7-13 - Custom categories.
rider_type_description Optional The rider_type_description field contains specific descriptions of the employed rider types (e.g., Senior - 65 and older, Child - 12 and under, etc.)
fare_paid Optional The fare_paid field contains the amount of the fare paid by the unique rider.

C - 10
Field Name Required Details
transaction_type Optional The transaction_type field indicates what entitled the customer to the trip.
* 0 - customer paid cash/credit/debit. * 1 - customer used stored value or tokens. * 2 - customer used a transfer. * 3 - customer used a pass. * 4 - customer used a promotional coupon. * 5 - trip is a free trip. * 6 - customer was never charged the fare. * 7 - customer was charged a fare but did not pay. * 8 - Other.
fare_media Optional The fare_media field indicates what media was used to pay the fare.
* 0 - Not applicable or unknown. * 1 - Cash.
* 2 - Paper transfer, single-use paper ticket, or token.
* 3 - Paper flash pass (visual inspection). * 4 - Software flash pass (visual inspection). * 5 - Proof-of-payment receipt * 6 - Magnetic strip card, agency-issued. * 7 - RFID or smart card, agency-issued * 8 - Magnetic strip card, open payment. * 9 - RFID or smart card, open payment
accompanying_device Optional
The accompanying_device field contains information on any accompanying mobility, medical, or assistance devices or aides of the unique rider.

C - 11
Field Name Required Details * 0 - No accompanying devices or aides. * 1 - Accompanying bike. * 2 - Accompanying wheelchair. * 3 - Accompanying medical device. * 4 - Accompanying service animal. * 5 - Accompanying personal care attendant. * 6 - Other accompanying device.
transfer_status Optional The transfer_status field contains the transfer status of the unique rider.
* 0 - rider is not a transfer * 1 - rider is a transfer
ridership.txt
File: Optional
Field Name Required Details
total_boardings Required
The total_boardings field contains the total count (not a daily average) of all boardings for the identified service or stops for the period indicated. A record without a stop_id should have both total_boardings and total_alightings, and they should be equal; a record with a stop_id must have at least one of the two. Non-negative integer.
total_alightings Required
The total_alightings field contains total count (not a daily average) of all alightings for the identified service or stops for the period indicated. A record without a stop_id should have both total_boardings and total_alightings, and they should be equal; a record with a stop_id must have at least one of the two. Non-negative integer.
ridership_start_date Required The ridership_start_date field contains the date of the start of the ridership count. The date format is YYYYMMDD.

C - 12
Field Name Required Details
ridership_end_date Required The ridership_end_date field contains the date of the end of the ridership count. ridership_end_date may be the same date or later than ridership_start_date.
ridership_start_time Optional The ridership_start_time field contains the time of the start of the ridership count on the date specified in ridership_start_date. The time format is HH:MM:SS.
ridership_end_time Optional
The ridership_end_time field contains the time of the end of the ridership count on the date specified in ridership_end_date. If ridership_start_date and ridership_end_date are the same, ridership_end_time must be later than ridership_start_time.
service_id Optional
The service_id field contains an ID that uniquely identifies a set of dates over which to aggregate ridership. This value is referenced from the calendar.txt file. The ridership_start_date to ridership_end_date date range must fully contain the date range specified for the associated service_id through the start_date and end_date fields of calendar.txt. Use this field to indicate aggregation of ridership over day-of-the-week sets preexisting in GTFS service IDs. To aggregate over custom day-of-the-week sets within the ridership_start_date to ridership_end_date date range, use the following binary date selection fields.
monday Optional
The monday field contains a binary value that indicates whether or not ridership for all Mondays within the given date range is included in the aggregate counts.
* 0 - Monday ridership is not included in the ridership counts.
* 1 - Monday ridership is included in the ridership counts.
tuesday Optional
The tuesday field contains a binary value that indicates whether or not ridership for all Tuesdays within the given date range is included in the aggregate counts.

C - 13
Field Name Required Details
* 0 - Tuesday ridership is not included in the ridership counts.
* 1 - Tuesday ridership is included in the ridership counts.
wednesday Optional
The wednesday field contains a binary value that indicates whether or not ridership for all Wednesdays within the given date range is included in the aggregate counts.
* 0 - Wednesday ridership is not included in the ridership counts.
* 1 - Wednesday ridership is included in the ridership counts.
thursday Optional
The thursday field contains a binary value that indicates whether or not ridership for all Thursdays within the given date range is included in the aggregate counts.
* 0 - Thursday ridership is not included in the ridership counts.
* 1 - Thursday ridership is included in the ridership counts.
friday Optional The friday field contains a binary value that indicates whether or not ridership for all Fridays within the given date range is included in the aggregate counts.
* 0 - Friday ridership is not included in the ridership counts.
* 1 - Friday ridership is included in the ridership counts.
saturday Optional
The saturday field contains a binary value that indicates whether or not ridership for all Saturdays within the given date range is included in the aggregate counts.
* 0 - Saturday ridership is not included in the ridership counts.

C - 14
Field Name Required Details
* 1 - Saturday ridership is included in the ridership counts.
sunday Optional The sunday field contains a binary value that indicates whether or not ridership for all Sundays within the given date range is included in the aggregate counts.
* 0 - Sunday ridership is not included in the ridership counts.
* 1 - Sunday ridership is included in the ridership counts.
agency_id Optional The agency_id field contains an ID that uniquely identifies an agency. This value is referenced from the agency.txt file.
route_id Optional The route_id field contains an ID that uniquely identifies a route. This value is referenced from the routes.txt file.
direction_id Optional The direction_id field contains an ID that identifies the direction of travel for a trip. This value is referenced from the trips.txt file.
trip_id Optional The trip_id field contains an ID that uniquely identifies a trip. This value is referenced from the trips.txt file.
stop_id Optional The stop_id field contains an ID that uniquely identifies a stop. This value is referenced from the stops.txt file.
ride_feed_info.txt
File: Required
Field Name Required Details
ride_files Required The ride_files field indicates the files containing valid ridership data.
* 0 - board_alight * 1 - rider_trip * 2 - ridership

C - 15
Field Name Required Details * 3 - board_alight and rider_trip * 4 - board_alight and ridership * 5 - rider_trip and ridership * 6 - board_alight, rider_trip, and ridership
ride_start_date Optional
The ride_start_date field indicates the earliest date for the ridership data contained in the fileset. The date may match or be later than the feed_start_date of feed_info.txt. The date format is YYYYMMDD.
ride_end_date Optional
The ride_end_date field indicates the latest date for the ridership data contained in the fileset. It must be later than the ride_start_date and either match or be earlier than the feed_end_date of feed_info.txt.
gtfs_feed_date Optional
The gtfs_feed_date indicates the date the GTFS files contained in the GTFS-ride fileset were fetched as the current GTFS feed. If feed_version is not included in feed_info.txt, gtfs_feed_date allows association of GTFS files to when they were supplied as current.
default_currency_type Optional
The default_currency_type defines the default currency used as payment. Please use the ISO 4217 alphabetical currency codes which can be found at the following URL: http://en.wikipedia.org/wiki/ISO_4217.
ride_feed_version Optional
The ride_feed_version is a feed publisher string used to determine the sequence of feed publication. It can be used to represent the most current data for feeds covering the same period.

C - 16

APPENDIX D
SOFTWARE REQUIREMENTS


D - 1
SPR 803: STATEWIDE DATA STANDARDS TO SUPPORT CURRENT AND FUTURE STRATEGIC PUBLIC TRANSIT INVESTMENT
Technical Memorandum for Task #4:
Develop functional and technical requirements of the open source, web-based software tools to support the public transit ridership standard.
INTRODUCTION The objective of this technical memorandum is to communicate the planned functional and technical requirements of the open source, web-based software tools to support the public transit ridership standard known as GTFS-ride. While some transit agencies may have other means of managing their ridership data, the proposed suite of software tools shall provide all the necessary data management functionality in compliance with GTFS-ride in one location. DESCRIPTION OF SOFTWARE TOOLS The software tools described in this document will provide users with a centralized platform to validate GTFS-ride feeds, input ridership data, and export GTFS-ride compliant ridership data. It is anticipated that the software tools will also provide basic analysis, visualization, and query capabilities to fit the needs of different stakeholders.
1. GTFS-ride Feed Validation
Functional Requirements. The GTFS-ride feed validation software tool suite shall: • Allow users to validate the structure and data contained in a custom GTFS-ride feed
for adherence to the GTFS-ride data standard.
Technical Requirements. The GTFS-ride feed validation software tool shall: • Leverage the existing transitfeed python library developed by Google to validate
GTFS feeds. • Add the necessary functionality to the transitfeed python library to validate GTFS-
ride feeds. • Where practical support easy capacity to integrate future third party updates of GTFS
validation code with GTFS-ride functionality. • Allow users to invoke the GTFS-ride feed validation software tool using the command
line (for consistency with the operation of Google’s GTFS feed validation tool). • Present validation results via an HTML-based report.
Development Timeline. Two months.
Work Distribution.
• Software Development: Benjamin Fields.

D - 2
• Development of Test Data: Sylvan Hoover and Phillip Carleton. • Functional Testing: Sylvan Hoover, Phillip Carleton, and Benjamin Fields.
2. Manual Data Input
Functional Requirements. The Manual Data Input software tool shall:
• Guide users through a structured data entry process when providing GTFS-ride compliant ridership data.
• Allow users to easily enter GTFS-ride compliant ridership data regardless of the size of the transit agency (i.e., small, medium, and large) and the complexity/completeness of the ridership data.
• Support editing of data (at least the “ride” elements). • Correctly instantiate the GTFS-ride compliant ridership data entered by users into a
database management system. Technical Requirements. The Manual Data Input software tool shall:
• Present a user-friendly web based template to enter GTFS-ride compliant ridership data developed using HTML, CSS, and JavaScript.
• Allow the export of GTFS-ride compliant ridership datasets in a comma delimited text format.
Development Timeline. Four months.
Work Distribution. • Software Development: Benjamin Fields. • User Interface Design: Sylvan Hoover and Phillip Carleton. • Functional Testing: Sylvan Hoover, Phillip Carleton, and Benjamin Fields.
3. Data Management and Analysis
Functional Requirements. The Data Management and Analysis software tool shall: • Archive GTFS data and GTFS-ride compliant data in a central, web-based repository. • Provide users with the ability to run queries and generate simple reports using the data
contained within the system. • Provide capacity to handle and report on multiple GTFS-ride feeds for a single agency
as a continuous record of ridership over time and across feeds. • Provide capacity to handle and report on multiple agencies, i.e., reports that aggregate
data across agencies.
Technical Requirements. The Data Management and Analysis software tool shall: • Store GTFS data and GTFS-ride compliant data in using a database management
system that guarantees referential integrity.

D - 3
• Employ a user-friendly, web-based interface developed using HTML, CSS, and JavaScript to allow basic analysis, visualization, and querying of GTFS-ride compliant data.
• Manage the execution of queries to the database management system and the data returned by these queries using the Java programming language.
Development Timeline. Four months. Work Distribution.
• Software Development: Benjamin Fields. • Database Design: Sylvan Hoover and Phillip Carleton. • User Interface Design: Sylvan Hoover and Phillip Carleton. • Functional Testing: Sylvan Hoover, Phillip Carleton, and Benjamin Fields.

D - 4

APPENDIX E
REPORT DEFINITIONS

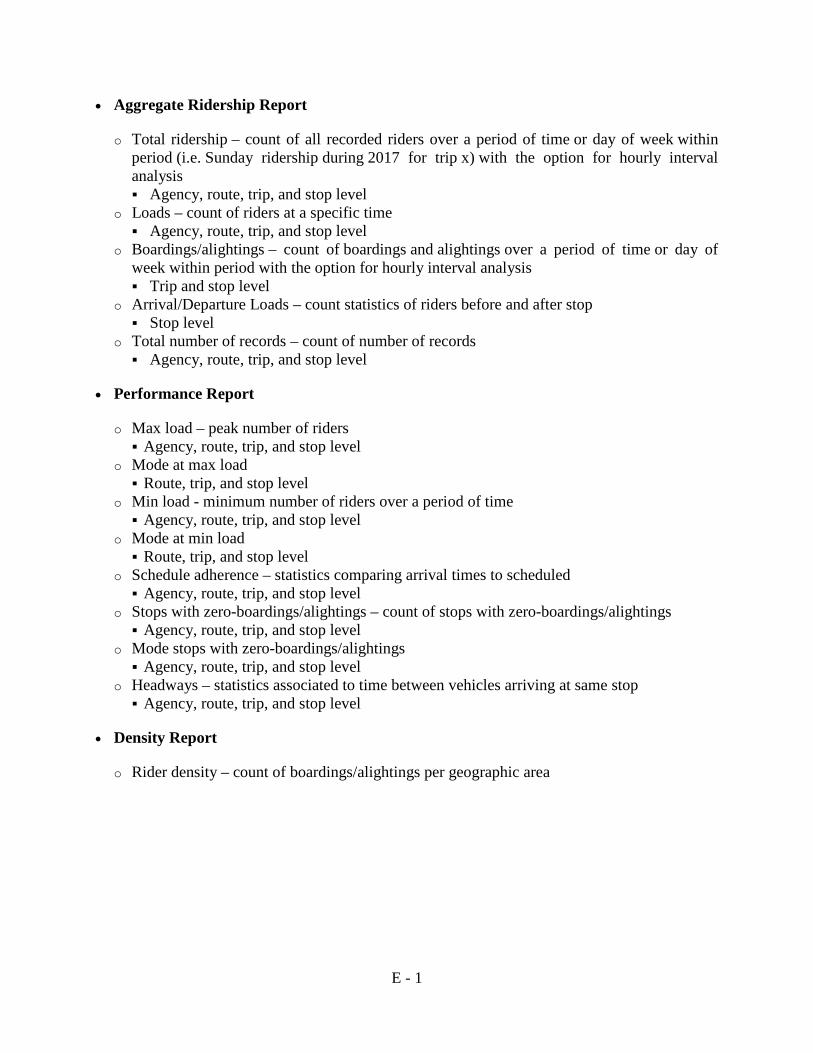
E - 1
• Aggregate Ridership Report
o Total ridership – count of all recorded riders over a period of time or day of week within period (i.e. Sunday ridership during 2017 for trip x) with the option for hourly interval analysis Agency, route, trip, and stop level
o Loads – count of riders at a specific time Agency, route, trip, and stop level
o Boardings/alightings – count of boardings and alightings over a period of time or day of week within period with the option for hourly interval analysis Trip and stop level
o Arrival/Departure Loads – count statistics of riders before and after stop Stop level
o Total number of records – count of number of records Agency, route, trip, and stop level
• Performance Report
o Max load – peak number of riders Agency, route, trip, and stop level
o Mode at max load Route, trip, and stop level
o Min load - minimum number of riders over a period of time Agency, route, trip, and stop level
o Mode at min load Route, trip, and stop level
o Schedule adherence – statistics comparing arrival times to scheduled Agency, route, trip, and stop level
o Stops with zero-boardings/alightings – count of stops with zero-boardings/alightings Agency, route, trip, and stop level
o Mode stops with zero-boardings/alightings Agency, route, trip, and stop level
o Headways – statistics associated to time between vehicles arriving at same stop Agency, route, trip, and stop level
• Density Report
o Rider density – count of boardings/alightings per geographic area