statement 10: australian government udget … · revaluation of equity investments -7,075 -6,693...
TRANSCRIPT

10-1
STATEMENT 10: AUSTRALIAN GOVERNMENT BUDGET FINANCIAL STATEMENTS
Consistent with the Charter of Budget Honesty Act 1998 (the Charter), the Government has produced a single set of financial statements for the Australian Government general government sector (GGS), the public non-financial corporations (PNFC) sector, the total non-financial public sector (NFPS) and the public financial corporations (PFC) sector. The financial statements comply with both Australian Bureau of Statistics’ (ABS) accrual Government Finance Statistics (GFS) and Australian Accounting Standards (AAS), with departures disclosed. These statements are:
• an operating statement, including other economic flows, which shows net operating balance and net lending/borrowing (fiscal balance);
• a balance sheet, which also shows net worth, net financial worth, net financial liabilities and net debt; and
• a cash flow statement, which includes the calculation of the underlying cash balance.
In addition to these general purpose statements, notes to the financial statements are required. These notes include a summary of accounting policies, disaggregated information and other disclosures required by AAS.
The statements reflect the policy that ABS GFS remains the basis of budget accounting policy, except where the Government applies AAS because it provides a better conceptual basis for presenting information of relevance to users of public sector financial reports.
The Australian, State and Territory governments have an agreed framework — the Uniform Presentation Framework (UPF) — for the presentation of government financial information on a basis broadly consistent with the Australian Accounting Standards Board standard AASB 1049. The budget financial statements are consistent with the requirements of the UPF.
In accordance with the UPF requirements, this Statement also contains an update of the Australian Loan Council Allocation.


10-3
CONTENTS
Statement 10: Australian Government Budget Financial Statements .. 10-5 Notes to the general government sector financial statements ................................. 10-20
Appendix A: Financial reporting standards and budget concepts ......10-33
Appendix B: Australian Loan Council Allocation ..................................10-41

10-5
STATEMENT 10: AUSTRALIAN GOVERNMENT BUDGET FINANCIAL STATEMENTS
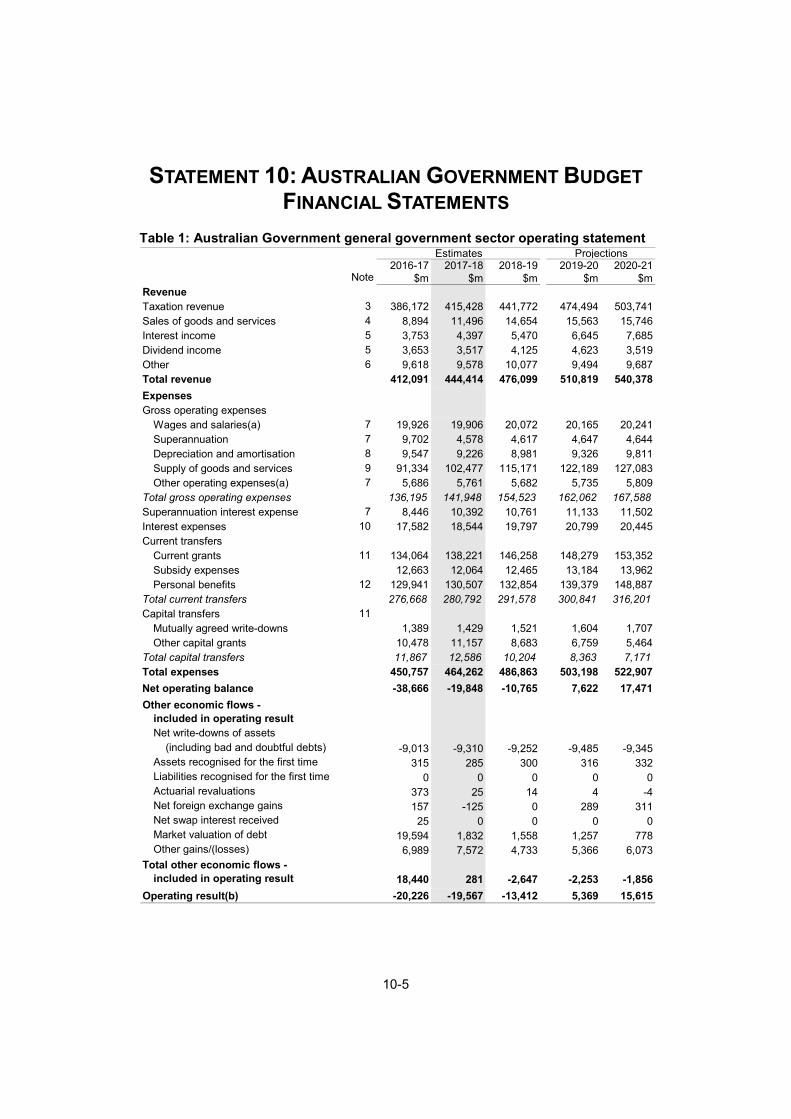
Table 1: Australian Government general government sector operating statement Estimates Projections
2016-17 2017-18 2018-19 2019-20 2020-21Note $m $m $m $m $m
RevenueTaxation revenue 3 386,172 415,428 441,772 474,494 503,741Sales of goods and services 4 8,894 11,496 14,654 15,563 15,746Interest income 5 3,753 4,397 5,470 6,645 7,685Dividend income 5 3,653 3,517 4,125 4,623 3,519Other 6 9,618 9,578 10,077 9,494 9,687Total revenue 412,091 444,414 476,099 510,819 540,378ExpensesGross operating expenses
Wages and salaries(a) 7 19,926 19,906 20,072 20,165 20,241Superannuation 7 9,702 4,578 4,617 4,647 4,644Depreciation and amortisation 8 9,547 9,226 8,981 9,326 9,811Supply of goods and services 9 91,334 102,477 115,171 122,189 127,083Other operating expenses(a) 7 5,686 5,761 5,682 5,735 5,809
Total gross operating expenses 136,195 141,948 154,523 162,062 167,588Superannuation interest expense 7 8,446 10,392 10,761 11,133 11,502Interest expenses 10 17,582 18,544 19,797 20,799 20,445Current transfers
Current grants 11 134,064 138,221 146,258 148,279 153,352Subsidy expenses 12,663 12,064 12,465 13,184 13,962Personal benefits 12 129,941 130,507 132,854 139,379 148,887
Total current transfers 276,668 280,792 291,578 300,841 316,201Capital transfers 11
Mutually agreed write-downs 1,389 1,429 1,521 1,604 1,707Other capital grants 10,478 11,157 8,683 6,759 5,464
Total capital transfers 11,867 12,586 10,204 8,363 7,171Total expenses 450,757 464,262 486,863 503,198 522,907Net operating balance -38,666 -19,848 -10,765 7,622 17,471Other economic flows -
included in operating resultNet write-downs of assets (including bad and doubtful debts) -9,013 -9,310 -9,252 -9,485 -9,345Assets recognised for the first time 315 285 300 316 332Liabilities recognised for the first time 0 0 0 0 0Actuarial revaluations 373 25 14 4 -4Net foreign exchange gains 157 -125 0 289 311Net swap interest received 25 0 0 0 0Market valuation of debt 19,594 1,832 1,558 1,257 778Other gains/(losses) 6,989 7,572 4,733 5,366 6,073
Total other economic flows - included in operating result 18,440 281 -2,647 -2,253 -1,856
Operating result(b) -20,226 -19,567 -13,412 5,369 15,615
Statement 10: Australian Government Budget Financial Statements
10-6
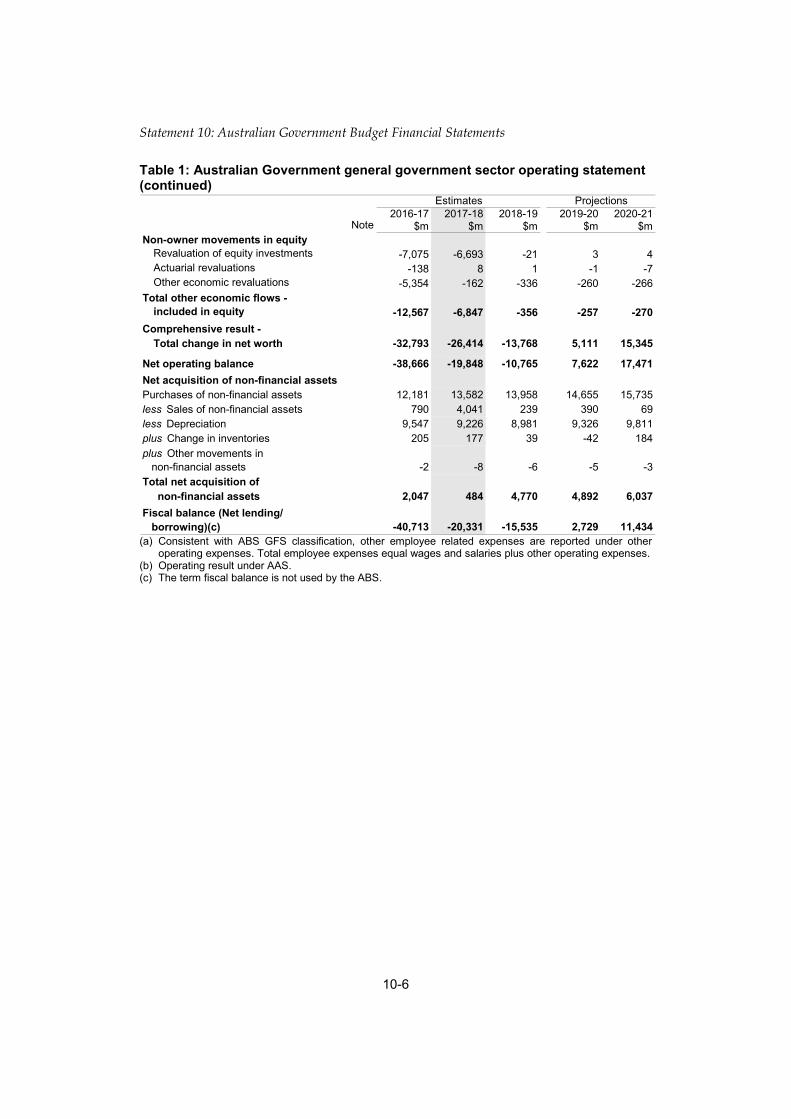
Table 1: Australian Government general government sector operating statement (continued)
2016-17 2017-18 2018-19 2019-20 2020-21Note $m $m $m $m $m
Non-owner movements in equityRevaluation of equity investments -7,075 -6,693 -21 3 4Actuarial revaluations -138 8 1 -1 -7Other economic revaluations -5,354 -162 -336 -260 -266
Total other economic flows - included in equity -12,567 -6,847 -356 -257 -270
Comprehensive result - Total change in net worth -32,793 -26,414 -13,768 5,111 15,345
Net operating balance -38,666 -19,848 -10,765 7,622 17,471Net acquisition of non-financial assetsPurchases of non-financial assets 12,181 13,582 13,958 14,655 15,735less Sales of non-financial assets 790 4,041 239 390 69less Depreciation 9,547 9,226 8,981 9,326 9,811plus Change in inventories 205 177 39 -42 184plus Other movements in non-financial assets -2 -8 -6 -5 -3Total net acquisition of non-financial assets 2,047 484 4,770 4,892 6,037Fiscal balance (Net lending/ borrowing)(c) -40,713 -20,331 -15,535 2,729 11,434
Estimates Projections
(a) Consistent with ABS GFS classification, other employee related expenses are reported under other
operating expenses. Total employee expenses equal wages and salaries plus other operating expenses. (b) Operating result under AAS. (c) The term fiscal balance is not used by the ABS.

Statement 10: Australian Government Budget Financial Statements
10-7
Table 2: Australian Government general government sector balance sheet Estimates Projections
2016-17 2017-18 2018-19 2019-20 2020-21Note $m $m $m $m $m
AssetsFinancial assets
Cash and deposits 3,408 3,411 3,452 3,991 4,179Advances paid(a) 13 54,073 72,083 88,567 101,390 93,622Investments, loans and placements 14 181,854 170,989 174,267 183,656 194,589Other receivables 13 49,736 54,322 57,163 59,468 60,263Equity investments(a)
Investment in other public sector entities 48,126 44,323 46,128 48,660 52,157Equity accounted investments 366 479 566 592 544Investments - shares 43,440 47,905 52,481 56,190 60,018
Total financial assets 381,003 393,511 422,625 453,947 465,373
Non-financial assets 15Land 10,296 10,215 10,119 9,834 9,877Buildings 25,795 25,883 26,593 27,455 28,295Plant, equipment and infrastructure 72,022 74,595 77,825 81,782 86,510Inventories 8,482 8,349 8,072 7,713 7,585Intangibles 7,912 8,711 9,440 9,699 9,818Investment properties 164 164 164 164 164Biological assets 49 49 49 49 49Heritage and cultural assets 11,439 11,412 11,382 11,351 11,302Assets held for sale 227 227 144 144 144Other non-financial assets 111 103 97 92 89
Total non-financial assets 136,497 139,709 143,885 148,282 153,834Total assets 517,500 533,220 566,510 602,230 619,207LiabilitiesInterest bearing liabilities
Deposits held 217 217 217 217 217Government securities 546,915 584,562 624,701 646,987 641,691Loans 16 15,685 15,065 14,955 15,066 15,216Other borrowing 1,609 1,569 1,527 1,482 1,435
Total interest bearing liabilities 564,426 601,414 641,399 663,752 658,559

Statement 10: Australian Government Budget Financial Statements
10-8
Table 2: Australian Government general government sector balance sheet (continued)
2016-17 2017-18 2018-19 2019-20 2020-21Note $m $m $m $m $m
Provisions and payablesSuperannuation liability 17 174,989 181,303 187,684 194,069 200,416Other employee liabilities 17 18,180 18,560 18,950 19,408 19,825Suppliers payable 18 5,659 5,874 5,915 5,902 5,879Personal benefits provisions and payables 18 13,189 13,552 14,007 14,348 14,439Subsidies provisions and payables 18 451 439 441 447 433Grants provisions and payables 18 11,537 10,589 10,051 10,604 9,976Other provisions and payables 18 20,763 19,599 19,938 20,466 21,100
Total provisions and payables 244,768 249,915 256,988 265,244 272,068Total liabilities 809,194 851,329 898,387 928,996 930,627
Net worth(b) -291,695 -318,109 -331,877 -326,766 -311,421Net financial worth(c) -428,191 -457,818 -475,762 -475,048 -465,255Net financial liabilities(d) 476,317 502,141 521,889 523,709 517,412Net debt(e) 325,091 354,931 375,112 374,715 366,169
Estimates Projections
(a) Due to the implementation of the 2015 ABS GFS Manual, Australia’s subscriptions to the International
Development Association and the Asian Development Fund were reclassified in the 2017-18 Budget from ‘advances paid’ to ‘equity investments’ on the balance sheet.
(b) Net worth is calculated as total assets minus total liabilities. (c) Net financial worth equals total financial assets minus total liabilities. (d) Net financial liabilities equals total liabilities less financial assets other than investments in other public
sector entities. (e) Net debt equals the sum of deposits held, government securities, loans and other borrowing, minus the
sum of cash and deposits, advances paid and investments, loans and placements.

Statement 10: Australian Government Budget Financial Statements
10-9
Table 3: Australian Government general government sector cash flow statement(a)
Estimates Projections2016-17 2017-18 2018-19 2019-20 2020-21
$m $m $m $m $mCash receipts from operating activitiesTaxes received 377,201 404,302 430,747 463,195 492,488Receipts from sales of goods and services 8,786 11,497 14,600 15,511 15,694Interest receipts 3,003 3,233 3,840 4,442 4,898Dividends and income tax equivalents 5,820 3,996 3,637 4,323 4,829Other receipts 8,695 9,104 9,004 8,614 8,344Total operating receipts 403,505 432,133 461,829 496,085 526,253Cash payments for operating activitiesPayments for employees -27,918 -28,553 -29,061 -29,508 -30,042Payments for goods and services -90,127 -101,003 -113,055 -120,159 -125,302Grants and subsidies paid -157,615 -161,202 -166,915 -166,894 -172,160Interest paid -15,251 -16,589 -17,562 -18,163 -20,404Personal benefit payments -132,186 -133,463 -134,709 -140,895 -149,839Other payments -5,464 -5,369 -5,289 -5,320 -5,393Total operating payments -428,560 -446,179 -466,592 -480,938 -503,140Net cash flows from operating activities -25,055 -14,046 -4,763 15,147 23,113
Cash flows from investments in non-financial assetsSales of non-financial assets 2,219 1,361 671 822 69Purchases of non-financial assets -11,979 -13,506 -13,817 -14,695 -15,765Net cash flows from investments in non-financial assets -9,760 -12,145 -13,146 -13,872 -15,696Net cash flows from investments in
financial assets for policy purposes -16,246 -22,221 -19,212 -16,077 4,252Cash flows from investments in
financial assets for liquiditypurposes
Increase in investments -30,734 10,475 -3,118 -6,771 -7,711Net cash flows from investments in financial assets for liquidity purposes -30,734 10,475 -3,118 -6,771 -7,711Net cash receipts from financing activities Borrowing 84,770 41,366 43,368 25,163 0Other financing 73 0 0 0 0Total net cash receipts from financing activities 84,843 41,366 43,368 25,163 0
Net cash payments for financing activitiesBorrowing 0 0 0 0 -357Other financing -3,279 -3,427 -3,088 -3,051 -3,413Total net cash payments for financing activities -3,279 -3,427 -3,088 -3,051 -3,771
Net cash flows from financing activities 81,565 37,939 40,280 22,112 -3,771
Net increase/(decrease) in cash held -230 3 41 539 188
Statement 10: Australian Government Budget Financial Statements
10-10
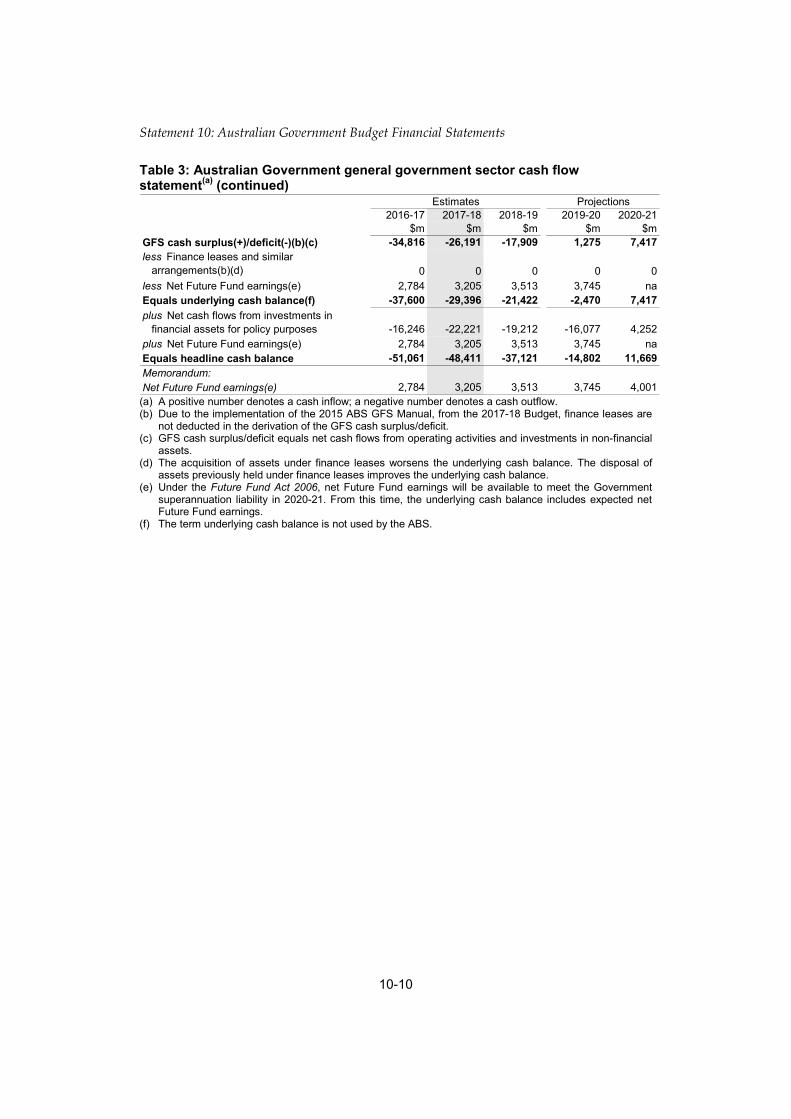
Table 3: Australian Government general government sector cash flow statement(a) (continued)
Estimates Projections2016-17 2017-18 2018-19 2019-20 2020-21
$m $m $m $m $mGFS cash surplus(+)/deficit(-)(b)(c) -34,816 -26,191 -17,909 1,275 7,417less Finance leases and similar arrangements(b)(d) 0 0 0 0 0less Net Future Fund earnings(e) 2,784 3,205 3,513 3,745 naEquals underlying cash balance(f) -37,600 -29,396 -21,422 -2,470 7,417plus Net cash flows from investments in financial assets for policy purposes -16,246 -22,221 -19,212 -16,077 4,252plus Net Future Fund earnings(e) 2,784 3,205 3,513 3,745 naEquals headline cash balance -51,061 -48,411 -37,121 -14,802 11,669Memorandum:Net Future Fund earnings(e) 2,784 3,205 3,513 3,745 4,001
(a) A positive number denotes a cash inflow; a negative number denotes a cash outflow. (b) Due to the implementation of the 2015 ABS GFS Manual, from the 2017-18 Budget, finance leases are
not deducted in the derivation of the GFS cash surplus/deficit. (c) GFS cash surplus/deficit equals net cash flows from operating activities and investments in non-financial
assets. (d) The acquisition of assets under finance leases worsens the underlying cash balance. The disposal of
assets previously held under finance leases improves the underlying cash balance. (e) Under the Future Fund Act 2006, net Future Fund earnings will be available to meet the Government
superannuation liability in 2020-21. From this time, the underlying cash balance includes expected net Future Fund earnings.
(f) The term underlying cash balance is not used by the ABS.
Statement 10: Australian Government Budget Financial Statements
10-11
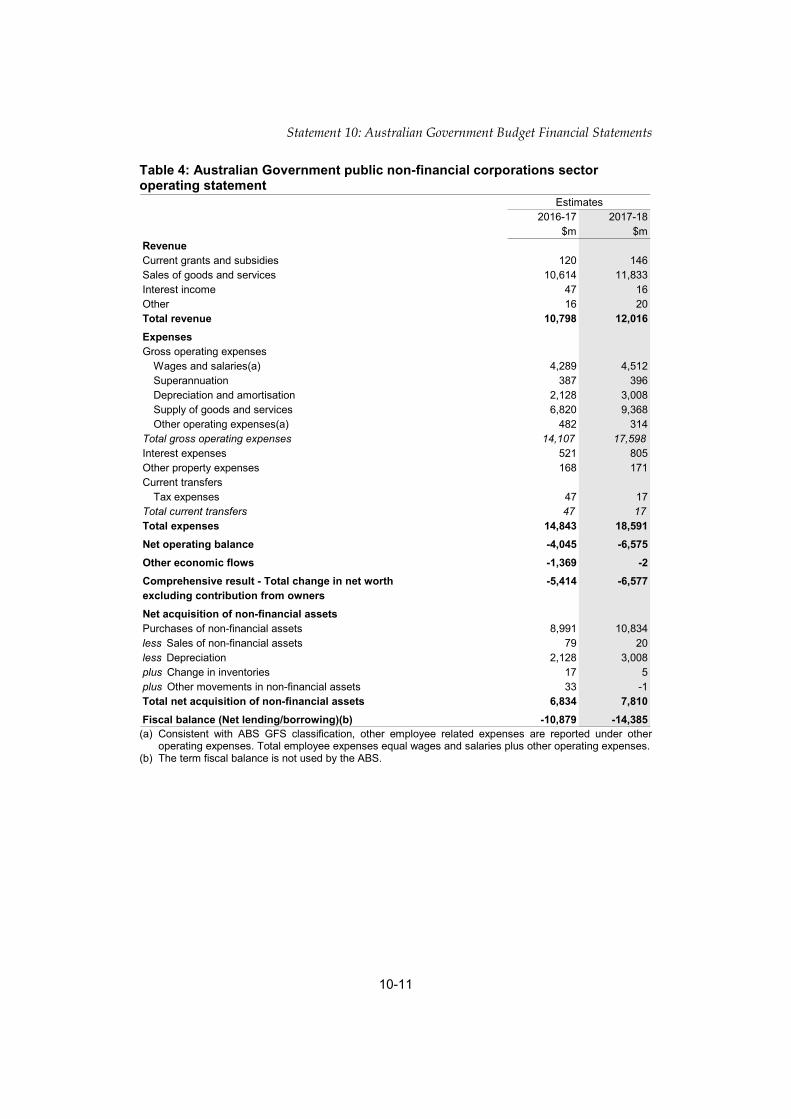
Table 4: Australian Government public non-financial corporations sector operating statement
Estimates2016-17 2017-18
$m $mRevenueCurrent grants and subsidies 120 146Sales of goods and services 10,614 11,833Interest income 47 16Other 16 20Total revenue 10,798 12,016ExpensesGross operating expenses
Wages and salaries(a) 4,289 4,512Superannuation 387 396Depreciation and amortisation 2,128 3,008Supply of goods and services 6,820 9,368Other operating expenses(a) 482 314
Total gross operating expenses 14,107 17,598Interest expenses 521 805Other property expenses 168 171Current transfers
Tax expenses 47 17Total current transfers 47 17Total expenses 14,843 18,591Net operating balance -4,045 -6,575Other economic flows -1,369 -2Comprehensive result - Total change in net worth -5,414 -6,577excluding contribution from ownersNet acquisition of non-financial assetsPurchases of non-financial assets 8,991 10,834less Sales of non-financial assets 79 20less Depreciation 2,128 3,008plus Change in inventories 17 5plus Other movements in non-financial assets 33 -1Total net acquisition of non-financial assets 6,834 7,810Fiscal balance (Net lending/borrowing)(b) -10,879 -14,385
(a) Consistent with ABS GFS classification, other employee related expenses are reported under other operating expenses. Total employee expenses equal wages and salaries plus other operating expenses.
(b) The term fiscal balance is not used by the ABS.

Statement 10: Australian Government Budget Financial Statements
10-12
Table 5: Australian Government public non-financial corporations sector balance sheet
Estimates2016-17 2017-18
$m $mAssetsFinancial assets
Cash and deposits 2,412 1,670Investments, loans and placements 528 475Other receivables 1,624 1,933Equity investments 400 382
Total financial assets 4,963 4,460Non-financial assets
Land and other fixed assets(a) 30,464 38,947Other non-financial assets(a)(b) 3,049 3,238
Total non-financial assets 33,513 42,185Total assets 38,476 46,645LiabilitiesInterest bearing liabilities Deposits held 5 5 Advances received 286 286
Loans 2,391 11,441Other borrowing 6,225 7,800
Total interest bearing liabilities 8,907 19,533Provisions and payables
Superannuation liability 46 46Other employee liabilities 1,639 1,616Other provisions and payables(b) 5,687 6,957
Total provisions and payables 7,372 8,619Total liabilities 16,278 28,152Shares and other contributed capital 22,198 18,493Net worth(c) 22,198 18,493Net financial worth(d) -11,315 -23,692Net debt(e) 5,967 17,388
(a) The estimate for intangible produced assets has now been reclassified from land and other fixed assets to other non-financial assets to provide consistency across sectors.
(b) Excludes the impact of commercial taxation adjustments. (c) Under AASB 1049, net worth is calculated as total assets minus total liabilities. Under ABS GFS, net
worth is calculated as total assets minus total liabilities minus shares and other contributed capital. The AASB 1049 method is used in this table.
(d) Under AASB 1049, net financial worth equals total financial assets minus total liabilities. Under ABS GFS, net financial worth equals total financial assets minus total liabilities minus shares and other contributed capital. The AASB 1049 method is used in this table.
(e) Net debt equals the sum of interest bearing liabilities (deposit held, advances received, loans and other borrowing), minus the sum of cash and deposits and investments, loans and placements.

Statement 10: Australian Government Budget Financial Statements
10-13
Table 6: Australian Government public non-financial corporations sector cash flow statement(a)
Estimates2016-17 2017-18
$m $mCash receipts from operating activitiesReceipts from sales of goods and services 11,388 12,337GST input credit receipts 673 862Other receipts 136 152Total operating receipts 12,197 13,350Cash payments for operating activitiesPayments to employees -5,188 -5,134Payment for goods and services -7,732 -10,918Interest paid -487 -762GST payments to taxation authority 0 0Other payments -47 -17Total operating payments -13,454 -16,831Net cash flows from operating activities -1,257 -3,481Cash flows from investments in non-financial assetsSales of non-financial assets 86 20Purchases of non-financial assets -6,290 -7,997Net cash flows from investments in non-financial assets -6,204 -7,977Net cash flows from investments in financial assets
for policy purposes 0 0Cash flows from investments in financial assets
for liquidity purposesIncrease in investments 48 145Net cash flows from investments in financial assets
for liquidity purposes 48 145Net cash flows from financing activitiesBorrowing (net) -83 8,979Other financing (net) 7,518 1,761Distributions paid (net) -169 -170Net cash flows from financing activities 7,267 10,571Net increase/(decrease) in cash held -146 -741Cash at the beginning of the year 2,558 2,412Cash at the end of the year 2,412 1,670Net cash from operating activities and investments in
non-financial assets -7,461 -11,457Distributions paid -169 -170GFS cash surplus(+)/deficit(-)(b) -7,629 -11,627
(a) A positive number denotes a cash inflow; a negative number denotes a cash outflow. (b) Due to the implementation of the 2015 ABS GFS Manual, from the 2017-18 Budget, finance leases are
not deducted in the derivation of the GFS cash surplus/deficit.

Statement 10: Australian Government Budget Financial Statements
10-14
Table 7: Australian Government total non-financial public sector operating statement
Estimates2016-17 2017-18
$m $mRevenueTaxation revenue 386,125 415,041Sales of goods and services 18,468 22,316Interest income 3,782 4,267Dividend income 3,485 3,346Other 9,634 9,598Total revenue 421,496 454,568ExpensesGross operating expenses
Wages and salaries(a) 24,215 24,418Superannuation 10,088 4,974Depreciation and amortisation 11,676 12,234Supply of goods and services 97,114 110,833Other operating expenses(a) 6,168 6,075
Total gross operating expenses 149,261 158,534Superannuation interest expense 8,446 10,392Interest expenses 18,084 19,204Current transfers
Current grants 134,064 138,221Subsidy expenses 12,543 11,548Personal benefits 129,941 130,507
Total current transfers 276,548 280,276Capital transfers 11,867 12,586Total expenses 464,207 480,991Net operating balance -42,711 -26,423Other economic flows 8,527 103Comprehensive result - Total change in net worth -34,184 -26,320Net acquisition of non-financial assets Purchases of non-financial assets 21,172 24,415less Sales of non-financial assets 868 4,062less Depreciation 11,676 12,234plus Change in inventories 222 183plus Other movements in non-financial assets 30 -8Total net acquisition of non-financial assets 8,881 8,293Fiscal balance (Net lending/borrowing)(b) -51,592 -34,716
(a) Consistent with ABS GFS classification, other employee related expenses are reported under other operating expenses. Total employee expenses equal wages and salaries plus other operating expenses.
(b) The term fiscal balance is not used by the ABS.

Statement 10: Australian Government Budget Financial Statements
10-15
Table 8: Australian Government total non-financial public sector balance sheet Estimates
2016-17 2017-18$m $m
AssetsFinancial assets
Cash and deposits 5,819 5,081Advances paid 53,787 71,798Investments, loans and placements 182,382 171,463Other receivables 51,206 56,098Equity investments 68,489 73,045
Total financial assets 361,683 377,486Non-financial assets
Land and other fixed assets 158,497 169,402Other non-financial assets 11,513 12,492
Total non-financial assets 170,010 181,894Total assets 531,693 559,380LiabilitiesInterest bearing liabilities
Deposits held 223 223Advances received 0 0Government securities 546,915 584,562Loans 18,075 26,507Other borrowing 7,834 9,369
Total interest bearing liabilities 573,047 620,661Provisions and payables
Superannuation liability 175,034 181,349Other employee liabilities 19,819 20,176Other provisions and payables 57,133 56,853
Total provisions and payables 251,986 258,378Total liabilities 825,032 879,039Shares and other contributed capital 22,198 18,493Net worth(a) -293,340 -319,659Net financial worth(b) -463,350 -501,553Net debt(c) 331,059 372,319 (a) Under AASB 1049, net worth is calculated as total assets minus total liabilities. Under ABS GFS, net
worth is calculated as total assets minus total liabilities minus shares and other contributed capital. The AASB 1049 method is used in this table.
(b) Under AASB 1049, net financial worth equals total financial assets minus total liabilities. Under ABS GFS, net financial worth equals total financial assets minus total liabilities minus shares and other contributed capital. The AASB 1049 method is used in this table.
(c) Net debt equals the sum of deposits held, advances received, government securities, loans and other borrowing, minus the sum of cash and deposits, advances paid and investments, loans and placements.
Statement 10: Australian Government Budget Financial Statements
10-16
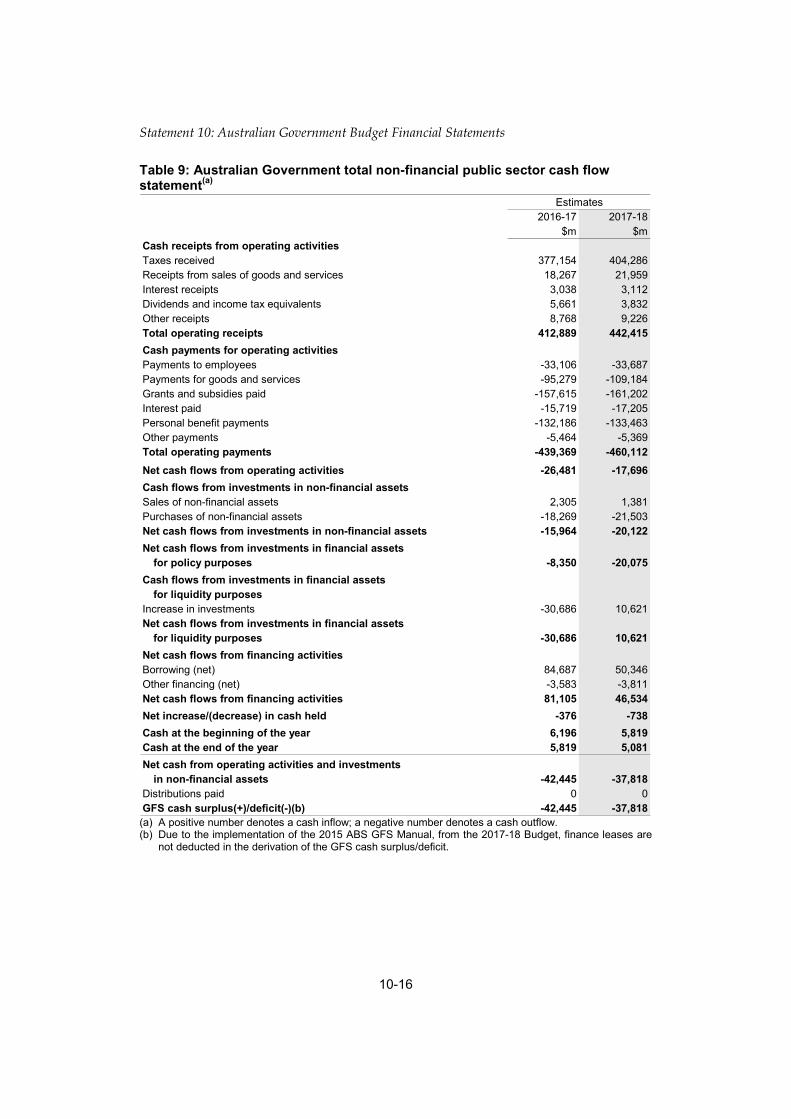
Table 9: Australian Government total non-financial public sector cash flow statement(a)
Estimates2016-17 2017-18
$m $mCash receipts from operating activitiesTaxes received 377,154 404,286Receipts from sales of goods and services 18,267 21,959Interest receipts 3,038 3,112Dividends and income tax equivalents 5,661 3,832Other receipts 8,768 9,226Total operating receipts 412,889 442,415Cash payments for operating activitiesPayments to employees -33,106 -33,687Payments for goods and services -95,279 -109,184Grants and subsidies paid -157,615 -161,202Interest paid -15,719 -17,205Personal benefit payments -132,186 -133,463Other payments -5,464 -5,369Total operating payments -439,369 -460,112Net cash flows from operating activities -26,481 -17,696Cash flows from investments in non-financial assetsSales of non-financial assets 2,305 1,381Purchases of non-financial assets -18,269 -21,503Net cash flows from investments in non-financial assets -15,964 -20,122Net cash flows from investments in financial assets
for policy purposes -8,350 -20,075Cash flows from investments in financial assets
for liquidity purposesIncrease in investments -30,686 10,621Net cash flows from investments in financial assets
for liquidity purposes -30,686 10,621Net cash flows from financing activitiesBorrowing (net) 84,687 50,346Other financing (net) -3,583 -3,811Net cash flows from financing activities 81,105 46,534Net increase/(decrease) in cash held -376 -738Cash at the beginning of the year 6,196 5,819Cash at the end of the year 5,819 5,081Net cash from operating activities and investments
in non-financial assets -42,445 -37,818Distributions paid 0 0GFS cash surplus(+)/deficit(-)(b) -42,445 -37,818
(a) A positive number denotes a cash inflow; a negative number denotes a cash outflow. (b) Due to the implementation of the 2015 ABS GFS Manual, from the 2017-18 Budget, finance leases are
not deducted in the derivation of the GFS cash surplus/deficit.
Statement 10: Australian Government Budget Financial Statements
10-17
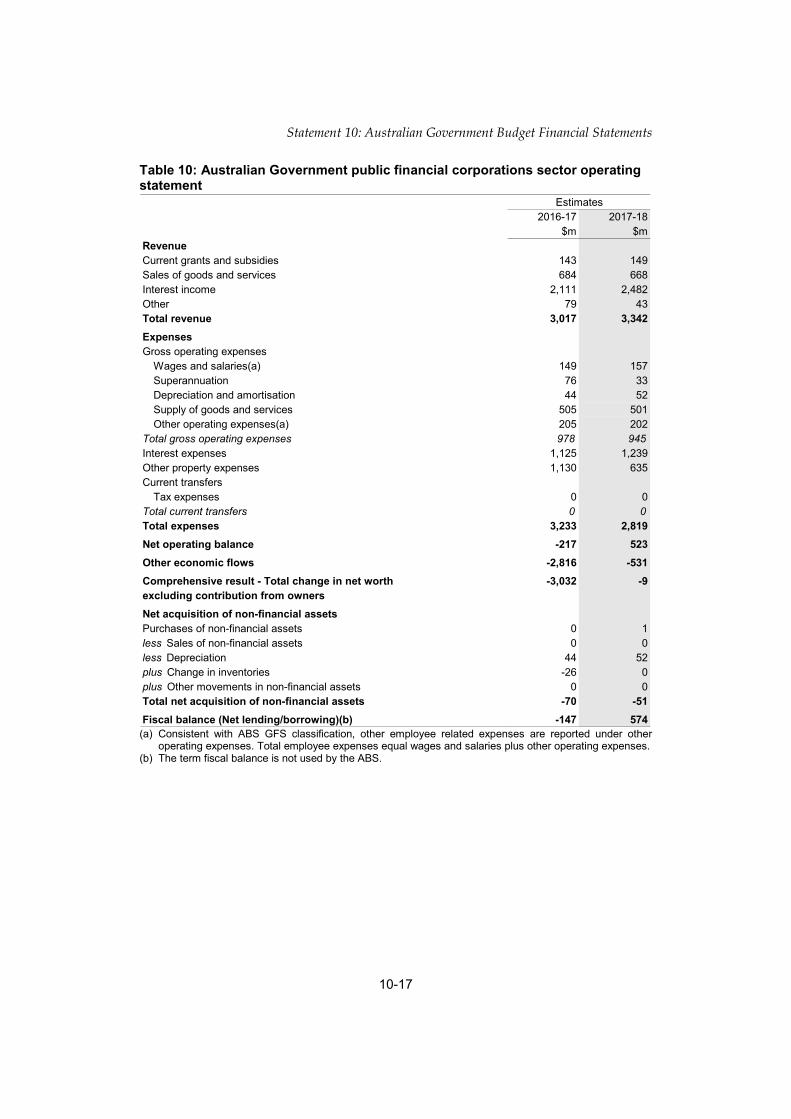
Table 10: Australian Government public financial corporations sector operating statement
Estimates2016-17 2017-18
$m $mRevenueCurrent grants and subsidies 143 149Sales of goods and services 684 668Interest income 2,111 2,482Other 79 43Total revenue 3,017 3,342ExpensesGross operating expenses
Wages and salaries(a) 149 157Superannuation 76 33Depreciation and amortisation 44 52Supply of goods and services 505 501Other operating expenses(a) 205 202
Total gross operating expenses 978 945Interest expenses 1,125 1,239Other property expenses 1,130 635Current transfers
Tax expenses 0 0Total current transfers 0 0Total expenses 3,233 2,819Net operating balance -217 523Other economic flows -2,816 -531Comprehensive result - Total change in net worth -3,032 -9excluding contribution from ownersNet acquisition of non-financial assetsPurchases of non-financial assets 0 1less Sales of non-financial assets 0 0less Depreciation 44 52plus Change in inventories -26 0plus Other movements in non-financial assets 0 0Total net acquisition of non-financial assets -70 -51Fiscal balance (Net lending/borrowing)(b) -147 574
(a) Consistent with ABS GFS classification, other employee related expenses are reported under other operating expenses. Total employee expenses equal wages and salaries plus other operating expenses.
(b) The term fiscal balance is not used by the ABS.

Statement 10: Australian Government Budget Financial Statements
10-18
Table 11: Australian Government public financial corporations sector balance sheet(a)
Estimates2016-17 2017-18
$m $mAssetsFinancial assets
Cash and deposits 538 528Investments, loans and placements 180,437 180,080Other receivables 232 227Equity investments 396 396
Total financial assets 181,604 181,230Non-financial assets
Land and other fixed assets(b) 772 767Other non-financial assets(b)(c) 99 97
Total non-financial assets 871 865Total assets 182,475 182,095LiabilitiesInterest bearing liabilities Deposits held 150,451 150,451
Borrowing 6,902 7,025Total interest bearing liabilities 157,354 157,476Provisions and payables
Superannuation liability 684 684Other employee liabilities 1,422 1,422Other provisions and payables(c) 1,272 777
Total provisions and payables 3,378 2,883Total liabilities 160,732 160,360Shares and other contributed capital 21,744 21,735Net worth(d) 21,744 21,735Net financial worth(e) 20,872 20,870Net debt(f) -23,622 -23,131
(a) Assumes no valuation or currency movement. (b) The estimate of intangible produced assets has now been reclassified from land and other fixed assets
to other non-financial assets to provide consistency across sectors. (c) Excludes the impact of commercial taxation adjustments. (d) Under AASB 1049, net worth is calculated as total assets minus total liabilities. Under ABS GFS, net
worth is calculated as total assets minus total liabilities minus shares and other contributed capital. The AASB 1049 method is used in this table.
(e) Under AASB 1049, net financial worth equals total financial assets minus total liabilities. Under ABS GFS, net financial worth equals total financial assets minus total liabilities minus shares and other contributed capital. The AASB 1049 method is used in this table.
(f) Net debt equals the sum of deposits held and borrowing, minus the sum of cash and deposits and investments, loans and placements.
Statement 10: Australian Government Budget Financial Statements
10-19
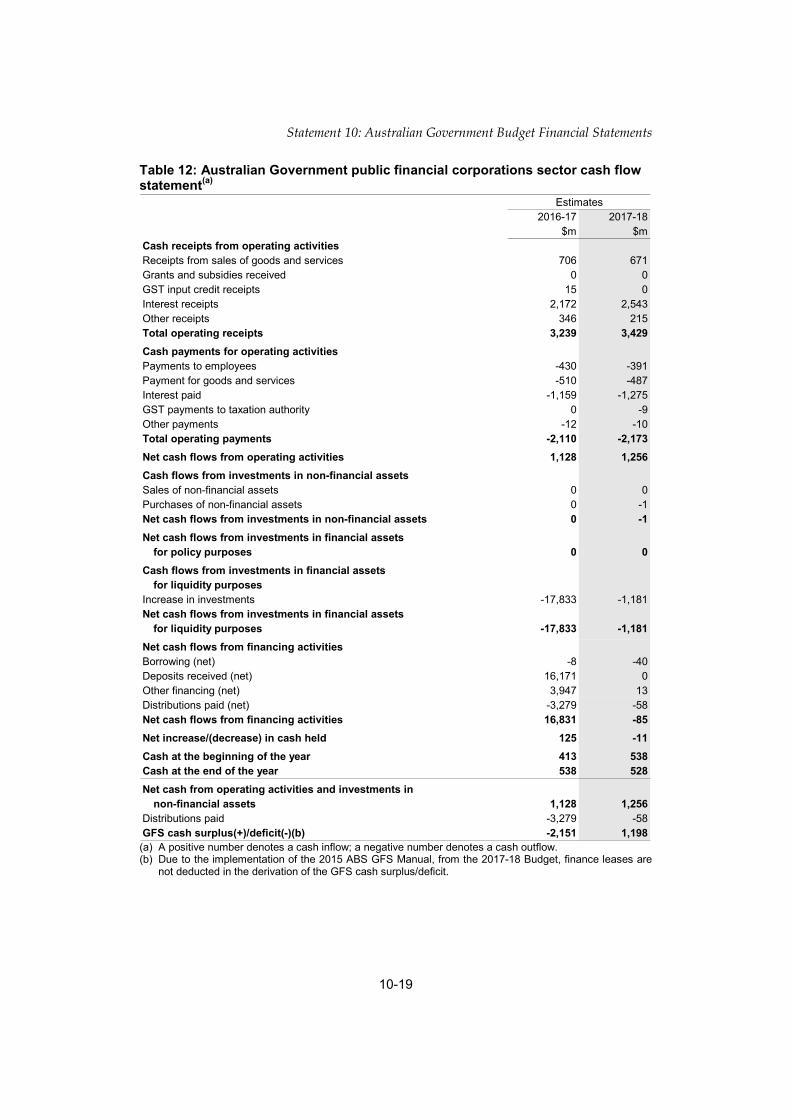
Table 12: Australian Government public financial corporations sector cash flow statement(a)
Estimates2016-17 2017-18
$m $mCash receipts from operating activitiesReceipts from sales of goods and services 706 671Grants and subsidies received 0 0GST input credit receipts 15 0Interest receipts 2,172 2,543Other receipts 346 215Total operating receipts 3,239 3,429Cash payments for operating activitiesPayments to employees -430 -391Payment for goods and services -510 -487Interest paid -1,159 -1,275GST payments to taxation authority 0 -9Other payments -12 -10Total operating payments -2,110 -2,173Net cash flows from operating activities 1,128 1,256Cash flows from investments in non-financial assetsSales of non-financial assets 0 0Purchases of non-financial assets 0 -1Net cash flows from investments in non-financial assets 0 -1Net cash flows from investments in financial assets
for policy purposes 0 0Cash flows from investments in financial assets
for liquidity purposesIncrease in investments -17,833 -1,181Net cash flows from investments in financial assets
for liquidity purposes -17,833 -1,181Net cash flows from financing activitiesBorrowing (net) -8 -40Deposits received (net) 16,171 0Other financing (net) 3,947 13Distributions paid (net) -3,279 -58Net cash flows from financing activities 16,831 -85Net increase/(decrease) in cash held 125 -11Cash at the beginning of the year 413 538Cash at the end of the year 538 528Net cash from operating activities and investments in
non-financial assets 1,128 1,256Distributions paid -3,279 -58GFS cash surplus(+)/deficit(-)(b) -2,151 1,198
(a) A positive number denotes a cash inflow; a negative number denotes a cash outflow. (b) Due to the implementation of the 2015 ABS GFS Manual, from the 2017-18 Budget, finance leases are
not deducted in the derivation of the GFS cash surplus/deficit.
Statement 10: Australian Government Budget Financial Statements
10-20
NOTES TO THE GENERAL GOVERNMENT SECTOR FINANCIAL STATEMENTS
Note 1: External reporting standards and accounting policies The Charter of Budget Honesty Act 1998 (the Charter) requires that the Budget be based on external reporting standards and that departures from applicable external reporting standards be identified.
The external standards used for budget reporting purposes are:
• the Australian Bureau of Statistics’ (ABS) accrual Government Finance Statistics (GFS) publication, Australian System of Government Finance Statistics: Concepts, Sources and Methods, 2015 (cat. no. 5514.0), which in turn is based on the International Monetary Fund (IMF) accrual GFS framework;1 and
• the Australian Accounting Standards (AAS), issued by the Australian Accounting Standards Board (AASB), which includes International Financial Reporting Standards (IFRS) as adopted in Australia and the public sector specific standard AASB 1049 Whole of Government and General Government Sector Financial Reporting.
The financial statements have been prepared on an accrual basis that complies with both ABS GFS and AAS, except for departures disclosed at Note 2. A more detailed description of the AAS and ABS GFS frameworks, in addition to definitions of key terms used in these frameworks, can be found in Appendix A. Detailed accounting policies, as well as a set of notes and other disclosures, as required by AAS, are disclosed in the annual Consolidated Financial Statements.
Fiscal reporting focuses on the general government sector (GGS). The GGS provides public services that are mainly non-market in nature and for the collective consumption of the community, or involve the transfer or redistribution of income. These services are largely financed through taxes and other compulsory levies, user charging and external funding. This sector comprises all government departments, offices and some other bodies. In preparing financial statements for the GGS, all material transactions and balances between entities within the GGS have been eliminated.
The Government’s key fiscal aggregates are based on ABS GFS concepts and definitions, including the ABS GFS cash surplus/deficit and the derivation of the underlying cash balance and net financial worth. AASB 1049 requires the disclosure of other ABS GFS fiscal aggregates, including net operating balance, net lending/borrowing (fiscal balance) and net worth. In addition to these ABS GFS
1 From 1 July 2017, the 2015 ABS GFS Manual replaces the 2005 ABS GFS Manual (current at
the time of publication). The 2015 ABS GFS Manual has been updated to incorporate the changes included by the International Monetary Fund outlined in its IMF GFS Manual 2014.
Statement 10: Australian Government Budget Financial Statements
10-21
aggregates, the Uniform Presentation Framework (UPF) requires disclosure of net debt, net financial worth and net financial liabilities.
AASB 1049 and the UPF also provide a basis for reporting of the public non-financial corporations (PNFC) and public financial corporations (PFC) sectors and the total non-financial public sector (NFPS).
AASB 1049 requires disaggregated information, by ABS GFS function, for expenses and total assets to be disclosed where they are reliably attributable. ABS GFS does not require total assets to be attributed to functions. In accordance with ABS GFS, disaggregated information for expenses and net acquisition of non-financial assets by function is disclosed in Statement 6: Expenses and Net Capital Investment. In accordance with the UPF, purchases of non-financial assets by function are also disclosed in Statement 6.
AASB 1055 requires major variances between original budget estimates and outcomes to be explained in the financial statements. Explanations of variations in fiscal balance, revenue, expenses, net capital investment, cash flows, net debt, net financial worth and net worth since the Mid-Year Economic and Fiscal Outlook 2016-17 (MYEFO) are disclosed in Statement 3: Fiscal Strategy and Outlook, with decisions taken since the MYEFO disclosed in Budget Paper No. 2 Budget Measures 2017-18. All policy decisions taken between the 2016-17 Budget and the 2016-17 MYEFO are disclosed in Appendix A of the MYEFO.
Details of the Australian Government’s GGS contingent liabilities are disclosed in Statement 9: Statement of Risks.
Note 2: Departures from external reporting standards
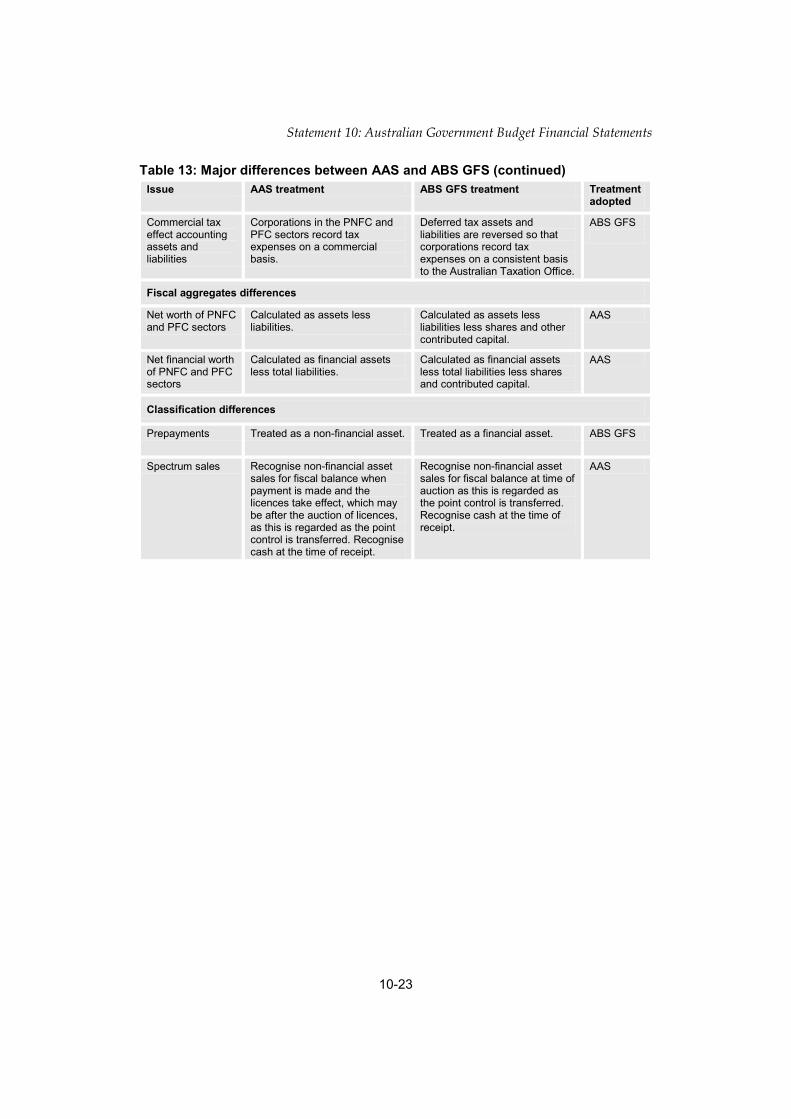
The Charter requires that departures from applicable external reporting standards be identified. The major differences between AAS and the ABS GFS treatments of transactions are outlined in Table 13.
AASB 1049 requires AAS measurement of items to be disclosed on the face of the financial statements with reconciliation to ABS GFS measurement of key fiscal aggregates, where different, in notes to the financial statements. Differences from the AAS measurement of items outlined above and reconciliation have not been included as they would effectively create different measures of the same aggregate.
Further information on the differences between the two systems is provided in the ABS publication Australian System of Government Finance Statistics: Concepts, Sources and Methods, 2015 (cat. no. 5514.0).

Statement 10: Australian Government Budget Financial Statements
10-22
Table 13: Major differences between AAS and ABS GFS Issue AAS treatment ABS GFS treatment2 Treatment
adopted
Circulating coins — seigniorage
The profit between the cost and sale of circulating coins (seigniorage) is treated as revenue.
Circulating coins is treated as a liability, and the cost of producing the coins is treated as an expense.
AAS
Valuation of loans Loans at amortised cost are valued using discounted cash flows at the contractual interest rate. Changes in the valuation of loans are treated as an expense.
Loans are valued using discounted cash flows at the market interest rate. Changes in the valuation of loans are treated as an other economic flow.
AAS for valuation. ABS GFS for changes in valuation.
Concessional loans
Concessional elements are treated as an expense.
Concessional elements are treated as an other economic flow.
AAS
Investment in other public sector entities
Valued at fair value in the balance sheet as long as it can be reliably measured, otherwise net assets is permissible.
Unlisted entities valued based on their net assets in the balance sheet.
AAS
Provision for restoration, decommissioning and make-good
Capitalised when the asset is purchased.
Capitalised when make-good activity takes place.
AAS
Renewable Energy Certificates (RECs)
The issuance and registration of RECs is considered to be an administrative function and does not result in the recognition of assets or liabilities and, consequently, no revenues or expenses are recognised.
The issuance and registration of RECs is considered to be government financial transactions resulting in the recognition of assets, liabilities, revenue and expenses.
AAS
Dividends paid by public corporations
Treated as an equity distribution. Equity distributions are treated as a distribution of profits, as opposed to an expense.
Dividends are treated as an expense.
ABS GFS
Dividends paid by the Reserve Bank of Australia
Dividends are recognised in the year profit was earned.
Dividends are recognised when the Treasurer makes a determination.
AAS
Interest expense measurement
Interest expense will be recorded on a contractual (debtor) rate basis.
Interest expense will be recorded on a market (creditor) rate basis.
AAS
2 From 1 July 2017, the 2015 ABS GFS Manual replaces the 2005 ABS GFS Manual (current at
the time of publication). The 2015 ABS GFS Manual has been updated to incorporate the changes included by the International Monetary Fund outlined in its IMF GFS Manual 2014.
Statement 10: Australian Government Budget Financial Statements
10-23
Table 13: Major differences between AAS and ABS GFS (continued) Issue AAS treatment ABS GFS treatment Treatment
adopted
Commercial tax effect accounting assets and liabilities
Corporations in the PNFC and PFC sectors record tax expenses on a commercial basis.
Deferred tax assets and liabilities are reversed so that corporations record tax expenses on a consistent basis to the Australian Taxation Office.
ABS GFS
Fiscal aggregates differences
Net worth of PNFC and PFC sectors
Calculated as assets less liabilities.
Calculated as assets less liabilities less shares and other contributed capital.
AAS
Net financial worth of PNFC and PFC sectors
Calculated as financial assets less total liabilities.
Calculated as financial assets less total liabilities less shares and contributed capital.
AAS
Classification differences
Prepayments Treated as a non-financial asset. Treated as a financial asset. ABS GFS
Spectrum sales Recognise non-financial asset sales for fiscal balance when payment is made and the licences take effect, which may be after the auction of licences, as this is regarded as the point control is transferred. Recognise cash at the time of receipt.
Recognise non-financial asset sales for fiscal balance at time of auction as this is regarded as the point control is transferred. Recognise cash at the time of receipt.
AAS

Statement 10: Australian Government Budget Financial Statements
10-24
Note 3: Taxation revenue by type Estimates Projections
2016-17 2017-18 2018-19 2019-20 2020-21$m $m $m $m $m
Individuals and other withholding taxesGross income tax withholding 180,150 188,750 200,400 216,520 231,770Gross other individuals 46,730 49,860 52,720 57,030 61,220less Refunds 28,300 29,000 30,900 32,700 34,400
Total individuals and other withholding taxation 198,580 209,610 222,220 240,850 258,590
Fringe benefits tax 4,450 4,430 4,520 4,870 5,130Company tax 68,900 79,400 86,400 93,300 95,900Superannuation fund taxes 7,760 8,540 9,510 10,720 12,120Petroleum resource rent tax(a) 1,050 990 990 1,030 1,000Income taxation revenue 280,740 302,970 323,640 350,770 372,740Goods and services tax 62,220 65,710 68,460 71,030 75,230Wine equalisation tax 870 900 1,000 1,060 1,100Luxury car tax 660 650 640 690 720Excise and customs duty
Petrol 6,100 6,250 6,410 6,790 7,150Diesel 10,240 10,640 11,140 11,690 12,340Other fuel products 1,900 1,920 1,920 2,000 2,070Tobacco 10,690 11,610 12,720 13,920 15,190Beer 2,350 2,390 2,470 2,520 2,670Spirits 2,050 2,130 2,210 2,300 2,410Other alcoholic beverages(b) 920 950 980 1,020 1,050Other customs duty Textiles, clothing and footwear 270 170 170 170 170 Passenger motor vehicles 500 490 500 520 560 Other imports 1,050 790 790 810 840less: Refunds and drawbacks 420 420 420 420 420
Total excise and customs duty 35,650 36,920 38,890 41,320 44,030
Major bank levy - 1,600 1,700 1,800 1,900Agricultural levies 532 537 533 537 546Other taxes 5,501 6,141 6,910 7,287 7,475Mirror taxes 530 559 582 612 630
less Transfers to States in relation to mirror tax revenue 530 559 582 612 630
Mirror tax revenue 0 0 0 0 0Indirect taxation revenue 105,432 112,458 118,132 123,724 131,001Taxation revenue 386,172 415,428 441,772 474,494 503,741

Statement 10: Australian Government Budget Financial Statements
10-25
Note 3: Taxation revenue by type (continued) Estimates Projections
2016-17 2017-18 2018-19 2019-20 2020-21$m $m $m $m $m
Memorandum:Total excise 21,560 22,190 22,950 24,070 25,320Total customs duty 14,090 14,730 15,940 17,250 18,710Capital gains tax(c) 12,700 15,500 16,800 18,400 20,500
(a) This item includes a small amount of MRRT revenue relating to a pre-2013-14 income year which cannot be separately disclosed owing to taxpayer confidentiality.
(b) ‘Other alcoholic beverages’ are those not exceeding 10 per cent by volume of alcohol (excluding beer, brandy and wine).
(c) ‘Capital gains tax’ is part of gross other individuals, company tax and superannuation fund taxes.
Note 3(a): Taxation revenue by source Estimates Projections
2016-17 2017-18 2018-19 2019-20 2020-21$m $m $m $m $m
Taxes on income, profits and capital gainsIncome and capital gains levied on individuals 203,020 214,040 226,740 245,720 263,720Income and capital gains levied on enterprises 77,720 88,930 96,900 105,050 109,020
Total taxes on income, profits and capital gains 280,740 302,970 323,640 350,770 372,740
Taxes on employers' payroll and labour force 635 635 668 673 697
Taxes on the provision of goods and servicesSales/goods and services tax 63,750 67,260 70,100 72,780 77,050Excises and levies 22,092 22,727 23,483 24,607 25,866Taxes on international trade 14,090 14,730 15,940 17,250 18,710
Total taxes on the provision of goods and services 99,932 104,717 109,523 114,637 121,626
Taxes on the use of goods and performance of activities 4,866 7,106 7,942 8,414 8,678Total taxation revenue 386,172 415,428 441,772 474,494 503,741
Note 4: Sales of goods and services revenue Estimates Projections
2016-17 2017-18 2018-19 2019-20 2020-21$m $m $m $m $m
Sales of goods 1,469 1,655 1,724 1,776 1,588Rendering of services 5,408 7,821 10,859 11,574 11,888Operating lease rental 89 86 91 93 89Fees from regulatory services 1,927 1,934 1,980 2,119 2,181Total sales of goods and services revenue 8,894 11,496 14,654 15,563 15,746

Statement 10: Australian Government Budget Financial Statements
10-26
Note 5: Interest and dividend revenue Estimates Projections
2016-17 2017-18 2018-19 2019-20 2020-21$m $m $m $m $m
Interest from other governmentsState and Territory debt 51 59 71 85 100Housing agreements 124 119 114 109 103
Total interest from other governments 175 178 185 194 203Interest from other sources
Advances 58 80 106 109 139Deposits 109 95 95 95 95Bank deposits 134 108 113 119 118Indexation of HELP receivable and other student loans 560 822 1,115 1,520 1,737Other 2,718 3,112 3,857 4,609 5,393
Total interest from other sources 3,578 4,218 5,285 6,452 7,482Total interest 3,753 4,397 5,470 6,645 7,685Dividends
Dividends from other public sector entities 1,340 848 1,296 1,608 300Other dividends 2,313 2,669 2,829 3,015 3,219
Total dividends 3,653 3,517 4,125 4,623 3,519Total interest and dividend revenue 7,407 7,913 9,595 11,268 11,204
Note 6: Other sources of non-taxation revenue Estimates
2016-17 2017-18 2018-19 2019-20 2020-21$m $m $m $m $m
Industry contributions 124 121 121 119 117Royalties 963 926 838 838 804Seigniorage 98 86 81 75 70Other 8,432 8,444 9,037 8,462 8,696Total other sources of non-taxation revenue 9,618 9,578 10,077 9,494 9,687
Projections
Note 7: Employee and superannuation expense Estimates Projections
2016-17 2017-18 2018-19 2019-20 2020-21$m $m $m $m $m
Wages and salaries expenses 19,926 19,906 20,072 20,165 20,241Other operating expenses
Leave and other entitlements 2,298 2,295 2,267 2,228 2,229Separations and redundancies 145 85 62 62 59Workers compensation premiums and claims 1,045 1,056 1,052 1,073 1,106Other 2,198 2,325 2,301 2,372 2,415
Total other operating expenses 5,686 5,761 5,682 5,735 5,809Superannuation expenses
Superannuation 9,702 4,578 4,617 4,647 4,644Superannuation interest cost 8,446 10,392 10,761 11,133 11,502
Total superannuation expenses 18,147 14,970 15,378 15,779 16,146Total employee and superannuation expense 43,759 40,637 41,131 41,679 42,197

Statement 10: Australian Government Budget Financial Statements
10-27
Note 8: Depreciation and amortisation expense Estimates Projections
2016-17 2017-18 2018-19 2019-20 2020-21$m $m $m $m $m
DepreciationSpecialist military equipment 5,294 5,051 4,805 5,169 5,653Buildings 1,414 1,319 1,295 1,272 1,265Other infrastructure, plant and equipment 1,512 1,498 1,502 1,512 1,536Heritage and cultural assets 81 83 83 84 84
Total depreciation 8,301 7,951 7,684 8,037 8,538Total amortisation 1,247 1,275 1,297 1,289 1,272Total depreciation and amortisation expense 9,547 9,226 8,981 9,326 9,811
Note 9: Supply of goods and services expense Estimates Projections
2016-17 2017-18 2018-19 2019-20 2020-21$m $m $m $m $m
Supply of goods and services 28,037 30,669 29,870 29,701 30,698Operating lease rental expenses 2,401 2,512 2,543 2,510 2,517Personal benefits – indirect(a)(b)(c)(d) 53,954 61,871 75,499 82,801 86,869Health care payments 4,772 4,813 4,677 4,558 4,497Other 2,170 2,612 2,583 2,620 2,503Total supply of goods and services expense 91,334 102,477 115,171 122,189 127,083 (a) Includes the Child Care Subsidy, which commences from 2018-19, with the majority of payments to be
made directly to child care providers. See also Note 12, Personal benefits expense. (b) Includes reclassification between Personal benefits expenses (Note 12) and Supply of goods and
services expense — ‘personal benefits — indirect’ (Note 9) made in the 2015-16 Final Budget Outcome, reflecting more accurate information about the nature of benefits provided.
(c) Includes reclassification for Home care packages from subsidy expenses to ‘personal benefits – indirect’ made in the 2016-17 MYEFO to reflect legislative changes to the program.
(d) Includes reclassification since the 2016-17 MYEFO for the payments under the National Disability Insurance Scheme from grants expenses (Note 11) to indirect personal benefits expenses (Note 9), to reflect the nature of benefits provided to households.

Statement 10: Australian Government Budget Financial Statements
10-28
Note 10: Interest expense Estimates Projections
2016-17 2017-18 2018-19 2019-20 2020-21$m $m $m $m $m
Interest on debtGovernment securities(a) 15,978 17,130 18,067 18,678 18,737Loans 1 1 1 1 1Other 199 214 223 236 249
Total interest on debt 16,178 17,345 18,291 18,914 18,987Other financing costs 1,404 1,200 1,507 1,885 1,458Total interest expense 17,582 18,544 19,797 20,799 20,445 (a) Public debt interest estimates are calculated using the contract interest rates incurred on existing
Commonwealth Government Securities (CGS) when issued and on technical assumptions, based on prevailing market interest rates across the yield curve, for yields on future CGS issuance.
Note 11: Current and capital grants expense Estimates Projections
2016-17 2017-18 2018-19 2019-20 2020-21$m $m $m $m $m
Current grants expenseState and Territory governments 106,227 109,584 117,332 118,604 123,350Local governments 2 0 0 0 0Private sector(a) 7,923 8,333 8,314 8,290 8,391Overseas 4,298 3,604 3,920 4,549 3,932Non-profit organisations(a) 3,833 4,145 4,123 4,110 3,845Multi-jurisdictional sector 10,201 10,464 10,393 10,492 10,726Other(a)(b) 1,579 2,091 2,176 2,233 3,109
Total current grants expense 134,064 138,221 146,258 148,279 153,352
Capital grants expenseMutually agreed write-downs 1,389 1,429 1,521 1,604 1,707Other capital grants
State and Territory governments 8,785 8,714 7,038 5,648 4,673Local governments 793 670 355 379 379Non-profit organisations(a) 309 308 276 69 71Private sector(a) 428 954 858 499 165Multi-jurisdictional sector 141 145 155 164 176Other(a) 22 366 1 0 0
Total capital grants expense 11,867 12,586 10,204 8,363 7,171Total grants expense 145,931 150,807 156,463 156,642 160,523 (a) Includes reallocation of some programs between grants to non-profit organisations, private sector and
other in the 2015-16 Final Budget Outcome reflecting more accurate information about the grants. (b) Includes reclassification since the 2016-17 MYEFO for the payments under the National Disability
Insurance Scheme from grants expenses (Note 11) to indirect personal benefits expenses (Note 9), to reflect the nature of benefits provided to households.

Statement 10: Australian Government Budget Financial Statements
10-29
Note 12: Personal benefits expense Estimates Projections
2016-17 2017-18 2018-19 2019-20 2020-21$m $m $m $m $m
Social welfare - assistance to the aged 44,857 45,726 47,844 49,931 52,459Assistance to veterans and dependants 5,416 5,140 4,979 4,850 4,795Assistance to people with disabilities 24,552 25,407 26,196 27,155 28,143Assistance to families with children(a) 32,805 32,961 28,902 29,543 29,922Assistance to the unemployed 10,992 10,017 11,093 11,785 12,544Student assistance 3,120 2,570 2,930 3,056 3,289Other welfare programs 1,190 1,098 1,142 1,168 1,188Financial and fiscal affairs 318 317 310 321 333Vocational and industry training 29 29 30 30 30Other(b) 6,661 7,241 9,428 11,541 16,184Total personal benefits expense 129,941 130,507 132,854 139,379 148,887 (a) The majority of payments under the Child Care Subsidy, which commences from 2018-19, are to be
made directly to child care providers. See also Note 9, Supply of goods and services expense. (b) Includes reclassification between Personal benefits expenses (Note 12) and Supply of goods and
services expense — ‘personal benefits — indirect’ (Note 9) made in the 2015-16 Final Budget Outcome, reflecting more accurate information about the nature of benefits provided.
Note 13: Advances paid and other receivables Estimates Projections
2016-17 2017-18 2018-19 2019-20 2020-21$m $m $m $m $m
Advances paidLoans to State and Territory governments 3,969 4,211 4,506 4,900 5,298Higher Education Loan Program 44,711 51,712 59,126 67,172 76,071Student Financial Supplement Scheme 367 317 267 217 168Other(a) 5,312 16,236 25,189 29,762 12,902less Provision for doubtful debts 285 393 521 662 817
Total advances paid 54,073 72,083 88,567 101,390 93,622Other receivables
Goods and services receivable 1,009 951 942 936 935Recoveries of benefit payments 5,667 7,254 7,281 7,286 6,973Taxes receivable 21,033 23,924 26,333 28,740 30,477Prepayments 4,423 4,509 4,592 4,653 4,633Other 19,797 20,790 21,646 21,849 21,345less Provision for doubtful debts 2,193 3,107 3,632 3,996 4,100
Total other receivables 49,736 54,322 57,163 59,468 60,263 (a) Due to the implementation of the 2015 ABS GFS Manual, Australia’s subscriptions to the International
Development Association and the Asian Development Fund were reclassified in the 2017-18 Budget from ‘advances paid’ to ‘equity investments’ on the balance sheet.
Note 14: Investments, loans and placements Estimates Projections
2016-17 2017-18 2018-19 2019-20 2020-21$m $m $m $m $m
Investments - deposits 60,405 50,804 52,194 47,903 48,289IMF quota 11,859 11,657 11,657 12,084 12,531Other 109,590 108,527 110,416 123,669 133,769Total investments, loans and placements 181,854 170,989 174,267 183,656 194,589

Statement 10: Australian Government Budget Financial Statements
10-30
Note 15: Non-financial assets Estimates Projections
2016-17 2017-18 2018-19 2019-20 2020-21$m $m $m $m $m
Land and buildingsLand 10,296 10,215 10,119 9,834 9,877Buildings 25,795 25,883 26,593 27,455 28,295
Total land and buildings 36,091 36,099 36,712 37,289 38,171Plant, equipment and infrastructure
Specialist military equipment(a) 56,703 58,097 60,759 64,070 68,327Other 15,319 16,498 17,066 17,712 18,183
Total plant, equipment and infrastructure 72,022 74,595 77,825 81,782 86,510Inventories
Inventories held for sale 1,428 1,482 1,395 1,235 1,356Inventories not held for sale 7,053 6,867 6,677 6,478 6,229
Total inventories 8,482 8,349 8,072 7,713 7,585Intangibles
Computer software 4,165 4,493 4,597 4,596 4,477Other 3,747 4,217 4,843 5,103 5,341
Total intangibles 7,912 8,711 9,440 9,699 9,818Total investment properties 164 164 164 164 164Total biological assets 49 49 49 49 49Total heritage and cultural assets 11,439 11,412 11,382 11,351 11,302Total assets held for sale 227 227 144 144 144Total other non-financial assets 111 103 97 92 89Total non-financial assets 136,497 139,709 143,885 148,282 153,834
(a) ‘Specialist military equipment’ is included at fair value to align with AASB 1049 which requires harmonisation with ABS GFS treatment.
Note 16: Loans Estimates Projections
2016-17 2017-18 2018-19 2019-20 2020-21$m $m $m $m $m
Promissory notes 9,534 9,142 9,117 9,094 9,096Special drawing rights 5,563 5,469 5,469 5,669 5,878Other 587 455 369 304 242Total loans 15,685 15,065 14,955 15,066 15,216

Statement 10: Australian Government Budget Financial Statements
10-31
Note 17: Employee and superannuation liabilities Estimates Projections
2016-17 2017-18 2018-19 2019-20 2020-21$m $m $m $m $m
Total superannuation liability(a) 174,989 181,303 187,684 194,069 200,416Other employee liabilities
Leave and other entitlements 7,772 7,899 8,006 8,115 8,213Accrued salaries and wages 212 213 219 272 277Workers compensation claims 2,788 2,758 2,741 2,733 2,733Other 7,408 7,691 7,985 8,288 8,602
Total other employee liabilities 18,180 18,560 18,950 19,408 19,825Total employee and
superannuation liabilities 193,168 199,863 206,634 213,477 220,241 (a) For budget reporting purposes, a discount rate of 6 per cent used by actuaries in preparing Long-Term
Cost Reports is used to value the superannuation liability. This reflects the average annual rate estimated to apply over the term of the liability and it reduces the volatility in reported liabilities that would occur from year to year if the long-term government bond rate were used. Consistent with Australian Accounting Standards, for the 2015-16 Final Budget Outcome the long-term government bond rate as at 30 June 2016 was used to calculate the superannuation liability. This rate was 2.7 per cent.
Note 18: Provisions and payables Estimates Projections
2016-17 2017-18 2018-19 2019-20 2020-21$m $m $m $m $m
Suppliers payableTrade creditors 4,163 4,244 4,295 4,297 4,286Operating lease rental payable 421 440 432 420 402Other creditors 1,076 1,190 1,188 1,185 1,191
Total suppliers payable 5,659 5,874 5,915 5,902 5,879Total personal benefits provisions and payables(a) 13,189 13,552 14,007 14,348 14,439
Total subsidies provisions and payables 451 439 441 447 433Grants provisions and payables
State and Territory governments 63 98 117 152 153Non-profit organisations 195 202 205 209 213Private sector 345 342 341 341 341Overseas 2,308 1,956 1,737 2,531 2,219Other(a) 8,625 7,991 7,650 7,369 7,050
Total grants provisions and payables 11,537 10,589 10,051 10,604 9,976Other provisions and payables
Provisions for tax refunds 2,978 2,994 2,988 2,982 2,993Other 17,785 16,605 16,950 17,484 18,107
Total other provisions and payables 20,763 19,599 19,938 20,466 21,100 (a) Includes reclassification for the payments under the National Disability Insurance Scheme from grants to
indirect personal benefits to reflect the nature of benefits provided to households.

Statement 10: Australian Government Budget Financial Statements
10-32
Note 19: Reconciliation of cash Estimates Projections
2016-17 2017-18 2018-19 2019-20 2020-21$m $m $m $m $m
Net operating balance (revenues less expenses) -38,666 -19,848 -10,765 7,622 17,471
less Revenues not providing cash Other 2,379 2,407 3,077 3,501 4,185
Total revenues not providing cash 2,379 2,407 3,077 3,501 4,185plus Expenses not requiring cash
Increase/(decrease) in employee entitlements 10,009 6,702 6,772 6,841 6,757 Depreciation/amortisation expense 9,547 9,226 8,981 9,326 9,811 Mutually agreed write-downs 1,389 1,429 1,521 1,604 1,707 Other 888 985 956 919 892
Total expenses not requiring cash 21,833 18,342 18,231 18,691 19,167plus Cash provided/(used) by working
capital items Decrease/(increase) in inventories -205 -177 -39 42 -184 Decrease/(increase) in receivables -6,138 -10,674 -10,218 -10,048 -7,461 Decrease/(increase) in other financial assets 2,659 2,834 2,546 2,697 2,547 Decrease/(increase) in other non-financial
assets -188 -44 -35 -25 47 Increase/(decrease) in benefits,
subsidies and grants payable -1,121 -392 92 1,011 -476 Increase/(decrease) in suppliers' liabilities 593 152 10 -53 -69 Increase/(decrease) in other provisions
and payables -1,445 -1,832 -1,508 -1,288 -3,744Net cash provided/(used) by working capital -5,844 -10,133 -9,152 -7,664 -9,339
equals (Net cash from/(to) operating activities) -25,055 -14,046 -4,763 15,147 23,113plus (Net cash from/(to) investing activities) -56,740 -23,890 -35,476 -36,721 -19,155
Net cash from operating activities andinvestment -81,795 -37,936 -40,239 -21,574 3,958plus (Net cash from/(to) financing activities) 81,565 37,939 40,280 22,112 -3,771
equals Net increase/(decrease) in cash -230 3 41 539 188Cash at the beginning of the year 3,638 3,408 3,411 3,452 3,991Net increase/(decrease) in cash -230 3 41 539 188Cash at the end of the year 3,408 3,411 3,452 3,991 4,179

Statement 10: Australian Government Budget Financial Statements
10-33
APPENDIX A: FINANCIAL REPORTING STANDARDS AND BUDGET CONCEPTS
The Budget primarily focuses on the financial performance and position of the general government sector (GGS). The ABS defines the GGS as providing public services which are mainly non-market in nature and for the collective consumption of the community, or involve the transfer or redistribution of income. These services are largely financed through taxes and other compulsory levies, user charging and external funding. AASB 1049 recognises the GGS as a reporting entity.
AASB 1049 HISTORY AND CONCEPTUAL FRAMEWORK
The Australian Accounting Standards Board (AASB) released AASB 1049 for application from the 2008-09 financial year. AASB 1049 seeks to ‘harmonise’ ABS GFS and AAS.
The reporting framework for AASB 1049 requires the preparation of accrual-based general purpose financial reports, showing government assets, liabilities, revenue, expenses and cash flows. GGS reporting under AASB 1049 aims to provide users with information about the stewardship of each government in relation to its GGS and accountability for the resources entrusted to it; information about the financial position, performance and cash flows of each government’s GGS; and information that facilitates assessments of the macroeconomic impact. While AASB 1049 provides a basis for whole of government (including the PNFC and PFC sectors) and GGS outcome reporting, budget reporting focuses on the GGS.
AASB 1049 has adopted the AAS conceptual framework and principles for the recognition of assets, liabilities, revenues and expenses and their presentation, measurement and disclosure. In addition, AASB 1049 has broadly adopted the ABS GFS conceptual framework for presenting government financial statements. In particular, AASB 1049 requires the GGS to prepare a separate set of financial statements, overriding AASB 10 Consolidated Financial Statements. AASB 1049 also follows ABS GFS by requiring changes in net worth to be split into either transactions or ‘other economic flows’ and for this to be presented in a single operating statement. AASB 1049 is therefore broadly consistent with international statistical standards and the International Monetary Fund’s (IMF) Government Finance Statistics Manual 2014.3
3 Additional information on the Australian accrual GFS framework is available in the ABS
publication Australian System of Government Finance Statistics: Concepts, Sources and Methods, 2015 (cat. no. 5514.0).

Statement 10: Australian Government Budget Financial Statements
10-34
All financial data presented in the financial statements are recorded as either stocks (assets and liabilities) or flows (classified as either transactions or ‘other economic flows’). Transactions result from a mutually agreed interaction between economic entities. Despite their compulsory nature, taxes are transactions deemed to occur by mutual agreement between the government and the taxpayer. Transactions that increase or decrease net worth (assets less liabilities) are reported as revenues and expenses respectively in the operating statement.4
A change to the value or volume of an asset or liability that does not result from a transaction is an ‘other economic flow’. This can include changes in values from market prices, most actuarial valuations, and exchange rates, and changes in volumes from discoveries, depletion and destruction. All ‘other economic flows’ are reported in the operating statement.
Consistent with the ABS GFS framework, and in general AAS, the financial statements record flows in the period in which they occur. As a result, prior period outcomes may be revised for classification changes relating to information that could reasonably have been expected to be known in the past, is material in at least one of the affected periods and can be reliably assigned to the relevant period(s).
Operating statement The operating statement presents details of transactions in revenues, expenses, the net acquisition of non-financial assets (net capital investment) and other economic flows for an accounting period.
Revenues arise from transactions that increase net worth and expenses arise from transactions that decrease net worth. Revenues less expenses gives the net operating balance. The net operating balance is similar to the National Accounts concept of government saving plus capital transfers.
The net acquisition of non-financial assets (net capital investment) equals gross fixed capital formation, less depreciation, plus changes (investment) in inventories, plus other transactions in non-financial assets. This measures the net effect of purchases, sales and consumption of non-financial assets during an accounting period.
‘Other economic flows’ are presented in the operating statement and outline changes in net worth that are driven by economic flows other than revenues and expenses. Revenues, expenses and ‘other economic flows’ sum to the total change in net worth during a period. The majority of ‘other economic flows’ for the Australian Government GGS arise from price movements in its assets and liabilities.
4 Not all transactions impact on net worth. For example, transactions in financial assets and
liabilities do not impact on net worth as they represent the swapping of assets and liabilities on the balance sheet.

Statement 10: Australian Government Budget Financial Statements
10-35
Net operating balance
The net operating balance is the excess of revenue from transactions over expenses from transactions. The net operating balance excludes expenditure on the acquisition of capital assets, but includes non-cash costs such as accruing superannuation entitlements and the consumption of capital (depreciation). By including all accruing costs, including depreciation, the net operating balance encompasses the full cost of providing government services. This makes it a measure of the sustainability of the government’s fiscal position over time and provides an indication of the sustainability of the existing level of government services.
The net operating balance is a flow measure on the statement of operations.
Fiscal balance
The fiscal balance (or net lending/borrowing) is the net operating balance less net capital investment. Thus, the fiscal balance includes the impact of net expenditure (effectively purchases less sales) on non-financial assets rather than consumption (depreciation) of non-financial assets.5
The fiscal balance measures the Australian Government’s investment-saving balance. It measures in accrual terms the gap between government savings plus net capital transfers, and investment in non-financial assets. As such, it approximates the contribution of the Australian Government GGS to the balance on the current account in the balance of payments.
Balance sheet The balance sheet shows stocks of assets, liabilities and net worth. In accordance with the UPF, net debt, net financial worth and net financial liabilities are also reported in the balance sheet.
Net worth
The net worth of the GGS, PNFC and PFC sectors is defined as assets less liabilities. This differs from the ABS GFS definition for the PNFC and PFC sectors where net worth is defined as assets less liabilities less shares and other contributed capital. Net worth is an economic measure of wealth, reflecting the Australian Government’s contribution to the wealth of Australia.
Net financial worth
Net financial worth measures a government’s net holdings of financial assets. It is calculated from the balance sheet as financial assets minus liabilities. This differs from the ABS GFS definition of net financial worth for the PNFC and PFC sectors, defined as financial assets, less liabilities, less shares and other contributed capital. Net financial
5 The net operating balance includes consumption of non-financial assets because depreciation
is an expense.

Statement 10: Australian Government Budget Financial Statements
10-36
worth is a broader measure than net debt, in that it incorporates provisions made (such as superannuation) as well as holdings of equity. Net financial worth includes all classes of financial assets and all liabilities, only some of which are included in net debt. As non-financial assets are excluded from net financial worth, this is a narrower measure than net worth. However, it avoids the concerns inherent with the net worth measure relating to the valuation of non-financial assets and their availability to offset liabilities.
Net financial liabilities
Net financial liabilities comprises total liabilities less financial assets but excludes equity investments in the other sectors of the jurisdiction. Net financial liabilities is a more accurate indicator than net debt of a jurisdiction’s fiscal position as it includes substantial non-debt liabilities such as accrued superannuation and long service leave entitlements. Excluding the net worth of other sectors in government results in a purer measure of financial worth than net financial worth as, in general, the net worth of other sectors of government, in particular the PNFC sector, is backed up by physical assets.
Net debt
Net debt is the sum of selected financial liabilities (deposits held, advances received, government securities, loans, and other borrowing) less the sum of selected financial assets6 (cash and deposits, advances paid, and investments, loans and placements). This includes financial assets (excluding equities) held by the Future Fund which are invested in these asset classes, including term deposits and investments in collective investment vehicles. Net debt does not include superannuation related liabilities. Net debt is a common measure of the strength of a government’s financial position. High levels of net debt impose a call on future revenue flows to service that debt.
The 2015 ABS GFS Manual presents debt in a matrix format, with no single net debt aggregate identified. The Commonwealth Government continues to report net debt in accordance with the UPF as described above.
Cash flow statement The cash flow statement identifies how cash is generated and applied in a single accounting period. The cash flow statement reflects a cash basis of recording (rather than an accrual basis) where information is derived indirectly from underlying accrual transactions and movements in balances. This, in effect, means that transactions are captured when cash is received or when cash payments are made. Cash transactions are specifically identified because cash management is considered an integral function of accrual budgeting.
6 Financial assets are defined as cash, an equity instrument of another entity, a contractual
right to receive cash or financial asset, and a contract that will or may be settled in the entity’s own equity instruments.

Statement 10: Australian Government Budget Financial Statements
10-37
Underlying cash balance
The underlying cash balance plus net Future Fund earnings is the cash counterpart of the fiscal balance, reflecting the Australian Government’s cash investment-saving balance.
For the GGS, the underlying cash balance is calculated as shown below:
Net cash flows from operating activities
plus
Net cash flows from investments in non-financial assets
equals
ABS GFS cash surplus/deficit7
less
Net acquisitions of assets acquired under finance leases and similar arrangements8
less
Net Future Fund cash earnings
equals
Underlying cash balance
Under the Future Fund Act 2006, earnings are required to be reinvested to meet the Government’s future public sector superannuation liabilities. The Government excludes net Future Fund cash earnings from the calculation of the underlying cash balance between 2005-06 and 2019-20. From 2020-21 onwards, net Future Fund cash earnings are included in the calculation of the underlying cash balance because the Future Fund becomes available to meet the Government’s superannuation liabilities from that year.
In contrast, net Future Fund earnings are included in the net operating balance and fiscal balance for all years because superannuation expenses relating to future cash payments are recorded in the net operating balance and fiscal balance.
7 In accordance with the 2015 ABS GFS Manual, finance leases are not deducted in the
derivation of the cash surplus/deficit. This has removed the distinction between the calculation of the cash surplus/deficit under AASB 1049 and the ABS GFS standards that existed under the 2005 ABS GFS Manual.
8 The underlying cash balance treats the acquisition and disposal of non-financial assets in the same manner regardless of whether they occur by purchase/sale or finance lease —acquisitions reduce the underlying cash balance and disposals increase the underlying cash balance. However, finance leases do not generate cash flows at the time of acquisition or disposal equivalent to the value of the asset. As such, net acquisitions of assets under finance leases are not shown in the body of the cash flow statement but are reported as a supplementary item for the calculation of the underlying cash balance.

Statement 10: Australian Government Budget Financial Statements
10-38
Net Future Fund earnings are separately identified in the Australian Government GGS cash flow statement in Table 3 of this Statement and related tables in Statement 3: Fiscal Strategy and Outlook, and Statement 11: Historical Australian Government Data.
Headline cash balance
The headline cash balance is calculated by adding net cash flows from investments in financial assets for policy purposes and net Future Fund earnings to the underlying cash balance.
Cash flows from investments in financial assets for policy purposes include equity transactions and net advances.9 Equity transactions include equity injections into controlled businesses and privatisations of government businesses. Net advances include net loans to the States, net loans to students under the Higher Education Loan Program (HELP), and contributions to international organisations that increase the Australian Government’s financial assets.
Sectoral classifications
To assist in analysing the public sector, data are presented by institutional sector as shown in Figure 1. ABS GFS defines the general government sector (GGS) and the public non-financial corporations (PNFC) and public financial corporations (PFC) sectors. AASB 1049 has also adopted this sectoral reporting.
Figure 1: Institutional structure of the public sector
9 Cash flows from investments in financial assets for policy purposes are often referred to as
net advances.
(Includes Reserve Bank of Australia and other borrowing authorities)
(Government departments and agencies that provide non-market public services, or involve the transfer or redistribution of income, and are funded mainly through taxes)
(Provide goods and services to consumers on a commercial basis, are funded largely by the sale of these goods and services and are generally legally distinguishable from the governments that own them)
Total public sector
Public financial corporations sector
Total non-financial public sector
General government sector Public non-financial corporations sector

Statement 10: Australian Government Budget Financial Statements
10-39
All entities are classified as GGS entities except for the following list of portfolio entities that are classified as PFC or PNFC (Table A1).
A table which provides a full list of public sector principal entities is available on the Department of Finance website at: http://www.finance.gov.au/sites/default/files/ Entity_List_May_2017.pdf.

Statement 10: Australian Government Budget Financial Statements
10-40
Table A1: Entities outside of the general government sector
Public financial corporations
Employment Portfolio
• Coal Mining Industry (Long Service Leave Funding) Corporation
Foreign Affairs and Trade Portfolio
• Export Finance and Insurance Corporation
Industry, Innovation and Science Portfolio
• CSIRO General Partner Pty Ltd
• CSIRO General Partner 2 Pty Ltd
Treasury Portfolio
• Australia Reinsurance Pool Corporation
• Reserve Bank of Australia
Public non-financial corporations
Communications and the Arts Portfolio
• Australian Postal Corporation
• NBN Co Ltd
Finance Portfolio
• ASC Pty Ltd*
• Australian Naval Infrastructure Pty Ltd*
Industry, Innovation and Science Portfolio
• ANSTO Nuclear Medicine Pty Ltd
Infrastructure and Regional Development Portfolio^
• Airservices Australia
• Australian Rail Track Corporation Ltd
• Moorebank Intermodal Company Ltd
Prime Minister and Cabinet Portfolio
• Voyages Indigenous Tourism Australia Pty Ltd
Social Services Portfolio
• Australian Hearing Services *The government has announced that ASC Pty Ltd will be separated into three individual Government owned companies. Australian Naval Infrastructure Pty Ltd was established under this structural separation. Full separation is expected to be completed during 2017. ^The government has announced that it will establish a government corporation to deliver Stage 1 of the Western Sydney Airport at Badgerys Creek. It is expected that the corporation will be established in the 2017-18 financial year.

Statement 10: Australian Government Budget Financial Statements
10-41
APPENDIX B: AUSTRALIAN LOAN COUNCIL ALLOCATION Under the Loan Council arrangements, every year the Commonwealth and each State government nominate an annual Loan Council Allocation (LCA). A jurisdiction’s LCA incorporates:
• the estimated non-financial public sector ABS GFS cash surplus/deficit (made up from the balance of the general government and public non-financial corporations sectors);
• net cash flows from investments in financial assets for policy purposes; and
• memorandum items, which involve transactions that are not formally borrowings but nevertheless have many of the characteristics of borrowings.
LCA nominations are considered by the Loan Council, having regard to each jurisdiction’s fiscal position and infrastructure requirements, as well as the macroeconomic implications of the aggregate figure.
As set out in Table B1, the Commonwealth’s revised estimate for the 2017-18 LCA is a $60.8 billion deficit. This compares with its LCA nomination of a $51.5 billion deficit. The LCA Budget estimate falls outside the tolerance limit set at nomination, partly due to the change in expected net cash flows from investments in financial assets for policy purposes.
Table B1: Commonwealth’s Loan Council Allocation budget update for 2017-18 2017-18 2017-18
Nomination Budget estimate$m $m
GGS cash surplus(-)/deficit(+) 25,273 26,191PNFC sector cash surplus(-)/deficit(+) 7,571 11,627NFPS cash surplus(-)/deficit(+)(a) 32,844 37,818
equals ABS GFS cash surplus(-)/deficit(+) 32,844 37,818minus Net cash flows from investments
in financial assets for policy purposes(b) -19,947 -22,221plus Memorandum items(c) -1,277 757
Loan Council Allocation 51,514 60,7962017-18 tolerance limit(d) 8,831 8,848
(a) May not directly equate to the sum of the GGS and the PNFC sector due to intersectoral transfers which are netted out.
(b) Net cash flows from investments in financial assets for policy purposes are displayed with the same sign as they are reported in cash flow statements. Such transactions involve the transfer or exchange of a financial asset and are not included within the cash surplus/deficit. However, the cash flow from investments in financial assets for policy purposes has implications for a government’s call on financial markets.
(c) For the Commonwealth’s Loan Council Allocation, memorandum items include the change in net present value (NPV) of operating leases (with NPV greater than $5 million), the net funding of superannuation; the net financing requirement of the Australian National University; and from this Budget, NFPS acquisitions under finance leases and similar arrangements.
(d) A tolerance limit equal to two per cent of NFPS cash receipts from operating activities applies to the movement between the LCA nomination and budget estimate, and again between the budget estimate and outcome.
