state university system of florida operating budget
TRANSCRIPT

State University System of Florida
OPERATING BUDGETSummary
Fiscal Year 2016-2017
Florida Board of Governors
Office of Budgeting and Fiscal Policy

OVERVIEW

2016-2017 OPERATING BUDGET OVERVIEW
Pursuant to Section 1011.40(2), Florida Statutes, and House Bill 5001, each President has prepared and received
approval from their University Board of Trustees for a 2016-2017 operating budget.
The 2016-2017 operating budgets for the state universities were approved by the Board of Governors at their
September 22, 2016, meeting.
The universities have developed their operating budgets for each budget entity in accordance with statutory
authority, the 2016 General Appropriations Act (GAA), Board of Governors Regulation 9.007, and the
information contained in the 2016-2017 Allocation Summary and Workpapers. When developing their
operating budget reports, universities utilize traditional appropriation categories and have budget flexibility
during the development stage.
A series of fiscal summaries, charts, graphs, and supporting information has been provided as an overview of
the State University System's fiscal operations for 2016-2017.

The Education and General (E&G) budget entity reflects the allocation of funds appropriated by the 2016
Legislature and includes previously appropriated trust funds. For 2016-2017 there are three sources of state
funding in the GAA: the General Revenue Fund, the Educational Enhancement Trust Fund (Lottery), and the
Phosphate Research Trust Fund (Florida Polytechnic University).
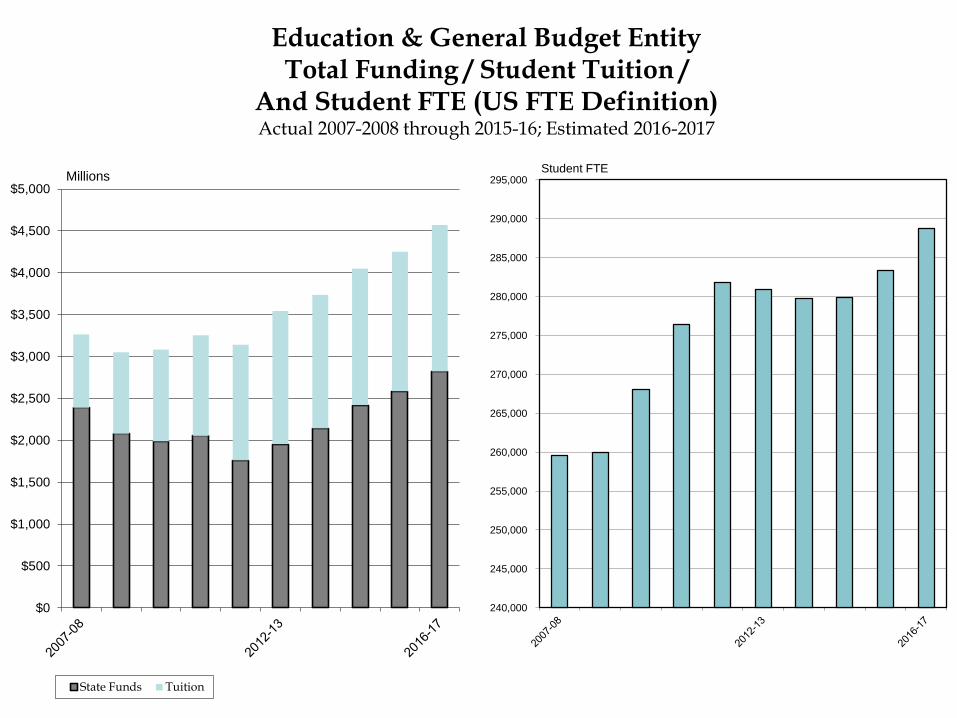
For the 2016-2017 academic year, base undergraduate student tuition will remain at $105.07 per student credit
hour.
The 2016-2017 funded enrollment plan increases slightly from the previous year. Funded enrollment for 2015-
2016 was 196,045 full-time equivalent (FTE) students and medical professionals, while 2016-2017 funded
enrollments are 196,166 FTE students and medical professionals. The funded enrollment plan was not listed in
the 2016-2017 GAA, but is based on an enrollment plan submitted to the Legislature on January 25, 2016.
During the 2016-2017 academic year, eleven of the state universities will be charging a tuition differential fee.
Tuition differential collections are expected to provide approximately $260 million for the university system,
with revenues to be utilized for need-based financial aid and to support undergraduate education through

investments in faculty and advisors, additional course offerings and course sections, and other undergraduate
educational resources.
*IMPORTANT NOTE - Actual expenditures reported for the 2015-16 year exhibits include payments made
from university carryforward funds, which are defined as appropriated dollars that were unexpended in the
year allocated and that have accumulated as available university fund balances in the education and general
budget entity. This methodology is a departure from history (actual) year reporting for fiscal periods earlier
than 2012-13 and must be taken into consideration when comparing expenditures from historical fiscal years,
which did not report expenditures from university carryforward (fund balance) funds prior to 2012-13.

State University System of FloridaAll Budget Entities
Actual Expenditures 2007-2008 through 2015-2016Estimated Expenditures 2016-2017
$7.59 $7.75$8.24
$8.82 $8.91
$9.49
$9.91
$10.50
$10.90
$11.52
$3.0
$4.0
$5.0
$6.0
$7.0
$8.0
$9.0
$10.0
$11.0
$12.0
2007-08 2008-09 2009-10 2010-11 2011-12 2012-13 2013-14 2014-15 2015-16 2016-17
Billions
Includes special units, contracts & grants, auxiliaries, local funds, and faculty practice plans.

Total Expenditures: $10,904,036,947
Actual 2015-2016
E&G38.98%
C&G21.03%
Auxiliary12.58%
Local Funds23.00%
Faculty Practice4.41%
Operating FundsPercentage of Total Expenditures by Budget Entity
Total Expenditures: $11,523,191,381
Estimated 2016-2017
E&G39.67%
C&G19.22%
Auxiliary13.64%
Local Funds22.82%
Faculty Practice4.65%

STATE UNIVERSITY SYSTEM OF FLORIDA
2016-2017 OPERATING BUDGETS
2015-2016 2016-2017
ACTUAL ESTIMATED
BUDGET ENTITY EXPENDITURES EXPENDITURES
GENERAL APPROPRIATIONS ACT
EDUCATIONAL & GENERAL
UNIVERSITIES 3,561,646,658$ 3,872,808,128$
UF-IFAS 178,967,140$ 188,633,814$
UF-HEALTH SCIENCE CENTER 179,615,304$ 178,234,946$
FSU MEDICAL SCHOOL 53,878,109$ 46,641,209$
USF-HEALTH SCIENCE CENTER 133,068,253$ 138,188,631$
UCF MEDICAL SCHOOL 44,557,411$ 41,671,606$
FIU MEDICAL SCHOOL 47,311,049$ 49,936,026$
FAU MEDICAL SCHOOL 23,006,668$ 24,342,165$
MOFFITT CANCER CENTER 10,576,930$ 10,576,930$
INSTITUTE FOR HUMAN AND MACHINE COGNITION 4,289,184$ 4,739,184$
FAMU/FSU JOINT COLLEGE OF ENGINEERING 12,230,086$ 13,241,710$
JOHNSON SCHOLARSHIPS MATCHING PROGRAM 772,500$ 1,237,500$
SUB-TOTALSUB-TOTAL 4,249,919,292$ 4,570,251,849$
OTHER STATUTORY AUTHORIZED
CONTRACTS & GRANTS 2,293,076,982$ 2,214,716,136$
AUXILIARY ENTERPRISES 1,371,921,236$ 1,572,019,139$
LOCAL FUNDS
STUDENT ACTIVITIES 113,840,977$ 129,670,783$
INTERCOLLEGIATE ATHLETICS 377,117,848$ 388,836,674$
CONCESSIONS 3,612,126$ 4,783,326$
STUDENT FINANCIAL AID 1,944,862,679$ 2,020,626,152$
TECHNOLOGY FEE 49,872,148$ 56,311,916$
BOARD-APPROVED FEES 3,215,717$ 6,680,199$
SELF-INSURANCE PROGRAMS 14,933,792$ 23,136,455$
FACULTY PRACTICE PLANS - UF 259,263,633$ 292,977,972$
FACULTY PRACTICE PLANS - FSU 6,456,050$ 2,195,716$
FACULTY PRACTICE PLANS - USF 207,337,032$ 228,290,197$
FACULTY PRACTICE PLANS - UCF 5,176,308$ 8,065,855$
FACULTY PRACTICE PLANS - FIU 3,431,127$ 4,629,012$
SUB-TOTAL 6,654,117,655$ 6,952,939,532$
SUMMARY 10,904,036,947$ 11,523,191,381$

EDUCATION AND GENERAL
POSITIONS DOLLARS POSITIONS DOLLARS POSITIONS DOLLARS POSITIONS DOLLARS POSITIONS DOLLARS POSITIONS DOLLARS
ACTUAL EXPENDITURES 2015-2016 ------------------- ------------------- ------------------- ------------------- ------------------- ------------------- ------------------- ------------------- ------------------- ----------------------- ------------------- -------------------
UNIVERSITY OF FLORIDA 4,809.48 656,695,189$ 4,596.59 1,319,847,540$ 1,538.32 362,647,171$ 168.07 585,992,671$ 11,112.46 2,925,182,571$
FLORIDA STATE UNIVERSITY 3,918.61 501,245,177$ 901.35 190,657,096$ 1,232.22 216,201,663$ 370.42 235,823,408$ 6,422.60 1,143,927,344$
FLORIDA A&M UNIVERSITY 1,359.80 166,955,054$ 487.86 45,798,866$ 162.96 25,149,703$ 72.40 58,347,810$ 2,083.02 296,251,433$
UNIVERSITY OF SOUTH FLORIDA 3,324.20 476,204,841$ 2,213.52 366,958,129$ 971.25 179,301,182$ 243.15 436,513,886$ 6,752.12 1,458,978,038$
FLORIDA ATLANTIC UNIVERSITY 2,568.02 264,874,577$ 377.29 53,228,117$ 526.06 92,147,432$ 136.86 224,579,890$ 3,608.23 634,830,016$
UNIVERSITY OF WEST FLORIDA 1,071.54 150,437,109$ 99.16 21,192,378$ 129.66 23,242,001$ 69.38 93,347,737$ 1,369.74 288,219,225$
UNIVERSITY OF CENTRAL FLORIDA 3,986.96 570,931,207$ 846.02 142,099,375$ 775.80 187,878,200$ 184.00 549,354,388$ 5,792.78 1,450,263,170$
FLORIDA INTERNATIONAL UNIVERSITY 3,957.29 435,782,315$ 861.61 126,459,667$ 1,065.44 203,327,816$ 263.49 208,515,937$ 6,147.83 974,085,735$
UNIVERSITY OF NORTH FLORIDA 1,319.25 156,675,573$ 252.35 9,410,214$ 282.87 46,643,545$ 179.51 55,380,084$ 2,033.98 268,109,416$
FLORIDA GULF COAST UNIVERSITY 1,038.00 126,500,783$ 86.85 13,049,740$ 139.00 26,386,890$ 73.90 40,519,621$ 1,337.75 206,457,034$
NEW COLLEGE OF FLORIDA 227.47 25,057,469$ 18.85 2,856,138$ 26.17 6,249,643$ 4.40 4,726,835$ 276.89 38,890,085$
FLORIDA POLYTECHNIC UNIVERSITY 187.36 30,287,364$ 0.65 1,519,722$ 3.00 2,745,990$ 0.00 (580,772)$ 191.01 33,972,304$
FAMU/FSU COLLEGE OF ENGINEERING 64.92 12,230,086$ 64.92 12,230,086$
SELF INSURANCE PROGRAMS (MEDICAL ENTITIES) 14,933,792$ 0.00 14,933,792$
MOFFITT CANCER CENTER 10,576,930$ 0.00 10,576,930$
INSTITUTE FOR HUMAN AND MACHINE COGNITION 4,289,184$ 0.00 4,289,184$
JOHNSON SCHOLARSHIPS - BOARD FOUNDATION 772,500$ 0.00 772,500$
UF - INSTITUTE OF FOOD AND AGRICULTURAL SCIENCES 1,519.91 178,967,140$ 1,519.91 178,967,140$
UF HEALTH SCIENCE CENTER 1,220.64 179,615,304$ 259,263,633$ 1,220.64 438,878,937$
FSU MEDICAL SCHOOL 320.17 53,878,109$ 6,456,050$ 320.17 60,334,159$
USF HEALTH SCIENCE CENTER 873.63 133,068,253$ 207,337,032$ 873.63 340,405,285$
UCF MEDICAL SCHOOL 218.16 44,557,411$ 5,176,308$ 218.16 49,733,719$
FIU MEDICAL SCHOOL 382.38 47,311,049$ 3,431,127$ 382.38 50,742,176$
FAU MEDICAL SCHOOL 160.24 23,006,668$ 160.24 23,006,668$
------------ ------------------- ------------ ------------------ ----------- ---------------- ----------- ------------------ ----------- ---------------- ------------ -------------------
STATE UNIVERSITY SYSTEM 32,528.03 4,249,919,292$ 10,742.10 2,293,076,982$ 6,852.75 1,371,921,236$ 1,765.58 2,507,455,287$ 0.00 481,664,150$ 51,888.46 10,904,036,947$
*Includes $353,718,820 from prior year's appropriations ======= =========== ======= ========== ====== ========= ====== ========== ====== ========= ======= ===========
ESTIMATED EXPENDITURES 2016-2017UNIVERSITY OF FLORIDA 4,662.98 704,024,803$ 4,532.60 1,186,315,494$ 1,581.13 368,572,901$ 164.58 584,959,110$ 10,941.29 2,843,872,308$
FLORIDA STATE UNIVERSITY 4,080.46 570,918,333$ 861.39 209,167,256$ 1,202.73 251,949,001$ 371.16 253,774,758$ 6,515.74 1,285,809,348$
FLORIDA A&M UNIVERSITY 1,342.40 175,980,100$ 476.43 53,647,869$ 163.07 34,676,032$ 69.74 58,869,890$ 2,051.64 323,173,891$
UNIVERSITY OF SOUTH FLORIDA 3,390.51 527,357,993$ 2,164.74 368,023,590$ 968.83 208,257,901$ 238.34 453,999,125$ 6,762.42 1,557,638,609$
FLORIDA ATLANTIC UNIVERSITY 2,568.02 311,225,479$ 377.29 60,514,704$ 526.07 133,515,374$ 136.86 230,552,694$ 3,608.24 735,808,251$
UNIVERSITY OF WEST FLORIDA 1,106.08 155,725,211$ 103.26 21,675,261$ 125.52 24,721,624$ 66.20 92,605,501$ 1,401.06 294,727,597$
UNIVERSITY OF CENTRAL FLORIDA 4,062.49 589,723,959$ 838.31 160,694,000$ 956.68 251,990,997$ 184.00 594,890,788$ 6,041.48 1,597,299,744$
FLORIDA INTERNATIONAL UNIVERSITY 3,942.75 477,166,362$ 847.26 121,834,350$ 1,058.52 210,521,540$ 265.18 220,446,371$ 6,113.71 1,029,968,623$
UNIVERSITY OF NORTH FLORIDA 1,342.45 155,426,415$ 237.84 10,359,209$ 285.98 51,003,321$ 181.41 62,902,440$ 2,047.68 279,691,385$
FLORIDA GULF COAST UNIVERSITY 1,084.31 134,456,234$ 86.94 18,051,137$ 126.73 27,080,950$ 78.40 41,053,520$ 1,376.38 220,641,841$
NEW COLLEGE OF FLORIDA 229.65 24,522,724$ 20.12 3,403,266$ 25.00 7,135,639$ 4.40 5,001,056$ 279.17 40,062,685$
FLORIDA POLYTECHNIC UNIVERSITY 216.11 41,280,515$ 0.50 1,030,000$ 5.00 2,593,859$ 2.00 7,853,797$ 223.61 52,758,171$
FAMU/FSU COLLEGE OF ENGINEERING 92.21 13,241,710$ 92.21 13,241,710$
SELF INSURANCE PROGRAMS (MEDICAL ENTITIES) 23,136,455$ 0.00 23,136,455$
MOFFITT CANCER CENTER 10,576,930$ 0.00 10,576,930$
INSTITUTE FOR HUMAN AND MACHINE COGNITION 4,739,184$ 0.00 4,739,184$
JOHNSON SCHOLARSHIPS - BOARD FOUNDATION 1,237,500$ 0.00 1,237,500$
CENTRAL RESERVES - UCF EMERGING PREEMINENCE 5,000,000$ 5,000,000$
UF - INSTITUTE OF FOOD AND AGRICULTURAL SCIENCES 682.95 188,633,814$ 682.95 188,633,814$
UF HEALTH SCIENCE CENTER 1,212.97 178,234,946$ 292,977,972$ 1,212.97 471,212,918$
FSU MEDICAL SCHOOL 322.50 46,641,209$ 2,195,716$ 322.50 48,836,925$
USF HEALTH SCIENCE CENTER 887.78 138,188,631$ 228,290,197$ 887.78 366,478,828$
UCF MEDICAL SCHOOL 237.29 41,671,606$ 8,065,855$ 237.29 49,737,461$
FIU MEDICAL SCHOOL 378.75 49,936,026$ 4,629,012$ 378.75 54,565,038$
FAU MEDICAL SCHOOL 160.24 24,342,165$ 160.24 24,342,165$
------------ ------------------- ----------- ----------------- ----------- ------------------ ----------- ------------------ ----------- ---------------- ------------- -------------------
STATE UNIVERSITY SYSTEM 32,002.90 4,570,251,849$ 10,546.68 2,214,716,136$ 7,025.26 1,572,019,139$ 1,762.27 2,630,045,505$ 0.00 536,158,752$ 51,337.11 11,523,191,381$
======= =========== ======= ========== ====== ========== ====== ========== ====== ========= ======= ===========
LOCAL FUNDS FACULTY PRACTICE PLANS SUMMARY
STATE UNIVERSITY SYSTEM OF FLORIDA
TOTAL POSITIONS AND EXPENDITURES
2015-2016 AND 2016-2017
CONTRACTS & GRANTS AUXILIARY ENTERPRISES

STATE UNIVERSITY SYSTEM OF FLORIDA 2016-2017 System Operating Budget
University Summary Schedule I Reports
The state universities are required to submit a detailed plan for each budget entity for the 2016-2017 fiscal year. Universities have developed their budgets in accordance with Board of Governors Regulation 9.007 – State University System Operating Budgets. Each university Board of Trustees has approved an operating budget for the current year.
The State University System (SUS) operating budget consists of five different budget entities: 1) Education and General, which includes both non-medical and medical entities, 2) Contracts and Grants, 3) Auxiliary Enterprises, 4) Local Funds, and 5) Faculty Practice Plans which are affiliated with the universities’ medical programs. A description of these entities is provided below:
1. The Education and General budget funds the general instruction, research, and public service operations of the universities. A large portion of the system’s 2016-2017 beginning fund balance reserves ($229.1 million) is dedicated to meeting the 5% reserve requirement set forth in Section 1011.40(2) of the Florida Statutes. Additionally, millions of dollars have been reserved by the SUS to cover the costs associated with the hiring of faculty, maintenance of facilities and equipment, the maintenance of each university’s financial software system, various research enhancement programs and initiatives, and the potential for budget reduction shortfalls.
2. The Contracts and Grants budget contains activities in support of research, public service, and training. Large fund balances are due to the timing of receipt of federal contracts or grants.
3. Auxiliaries are ancillary support units on each university campus. Major activities include housing, food services, bookstores, student health centers, facilities management, and computer support. Ending fund balances includes financial activities such as debt service payments, reserves, repair and replacement reserves for future maintenance costs, construction and renovation of auxiliary facilities, and prior-year encumbrances.

4. Local Funds include the following university activities: a) Student Activities – Supported primarily by the student activity and service fee revenues generated by the operations of student government, cultural events, organizations, and intramural/club sports. b) Financial Aid – This activity represents the financial aid amounts for which the university is fiscally responsible. Examples include the student financial aid fee, bright futures, federal grants, college work study, and scholarships. The ending fund balance represents a timing difference between the receipt of the funds and disbursement to students. c) Concessions – These resources are generated from various vending machines located on the university campuses. d) Athletics – Revenues are primarily derived from the student athletic fee, ticket sales, and sales of other goods and services. Sufficient fund balances are maintained to provide the necessary support for ongoing athletic activities. e) Technology Fee – Revenues generated from this fee are to be used to enhance instructional technology resources for students and faculty. f) Board Approved Local Fees – Resources generated from these local fees are utilized to address student-based needs not currently being met through existing university services, operations, or another fee. g) Self-Insurance Programs – These programs at UF, FSU, USF, UCF, and FIU are directed by the respective self-insurance councils and the captive insurance companies (these companies underwrite the risks of its owner and the owner’s affiliates). These activities are supported by premiums charged to the insured individuals and entities (primarily medical faculty and institutions).
5. Faculty Practice – The Faculty Practice Plans collect and distribute income from faculty billings for patient services to the University of Florida, Florida State University, University of South Florida, University of Central Florida, and Florida International University Medical Schools and Health Science Centers.
Other notes referred to on the Summary Schedule I report are:
6. Other Receipts/Revenues includes items such as interest, penalties, refunds, admissions, fines, taxes, etc.
7. Other Non-Operating Expenditures include items such as refunds, payment of sales taxes, or indirect costs.
The following Summary Schedule I reports were provided to the Board of Governors’ Office of Budgeting and Fiscal Policy as a component of the each state university’s annual operating budget for fiscal year 2016-2017.

Education &
General1
Contracts &
Grants2 Auxiliaries3 Local Funds4 Faculty Practice5 Summary
1 Beginning Fund Balance 983,298,583$ 1,045,346,936$ 1,074,098,787$ 459,632,225$ 272,695,560$ 3,835,072,091$ 23 Receipts/Revenues4 General Revenue 2,446,314,149$ 2,446,314,149$ 5 Lottery 304,369,400$ 304,369,400$ 6 Student Tuition 1,773,798,129$ 53,209,031$ 15,129,314$ 1,842,136,474$ 7 Phosphate Research 3,062,084$ 3,062,084$ 8 Other U.S. Grants 11,904,000$ 1,087,607,075$ 75,500$ 1,403,251,822$ 2,502,838,397$ 9 City or County Grants 11,901,658$ 11,901,658$ 10 State Grants 85,342,269$ 76,032$ 250,087,928$ 335,506,229$ 11 Other Grants and Donations 208,592,216$ 3,763,280$ 116,189,265$ 3,446,330$ 331,991,091$ 12 Donations / Contrib. Given to the State 640,942,309$ 4,938,789$ 645,881,098$ 13 Sales of Goods / Services 24,726,599$ 48,279,988$ 629,063,104$ 184,534,093$ 138,698,958$ 1,025,302,742$ 14 Sales of Data Processing Services 16,344,460$ 16,344,460$ 15 Fees 5,062,000$ 9,805,698$ 400,711,466$ 381,068,415$ 747,417,517$ 1,544,065,096$ 16 Miscellaneous Receipts 142,328$ 27,699,987$ 332,488,620$ 128,846,709$ 257,775,799$ 746,953,443$ 17 Rent 1,765,126$ 214,200$ 104,167,514$ 469,760$ 483,916$ 107,100,516$ 18 Concessions 150,000$ 764,000$ 914,000$ 19 Assessments / Services 12,055,699$ 12,055,699$
20 Other Reciepts / Revenues69,012,911$ 30,436,347$ 62,717,186$ 37,743,772$ 4,115,542$ 144,025,758$
21 Subtotal: 4,580,156,726$ 2,150,821,747$ 1,602,766,193$ 2,535,079,566$ 1,151,938,062$ 12,020,762,294$ 22 Transfers In 22,181,693$ 635,896,364$ 244,982,510$ 209,182,815$ 2,149,975$ 1,114,393,357$ 23 Total - Receipts / Revenues: 4,602,338,419$ 2,786,718,111$ 1,847,748,703$ 2,744,262,381$ 1,154,088,037$ 13,135,155,651$
2425 Operating Expenditures26 Salaries and Benefits 3,231,624,767$ 1,112,131,432$ 497,818,596$ 214,781,263$ 273,043,122$ 5,329,399,180$ 27 Other Personal Services 234,542,857$ 325,202,301$ 114,641,177$ 30,443,660$ 2,916,360$ 707,746,355$ 28 Expenses 870,574,359$ 729,332,506$ 874,450,371$ 1,385,401,212$ 247,542,628$ 4,107,301,076$ 29 Operating Capital Outlay 8,693,234$ 41,829,035$ 20,923,914$ 6,119,067$ 10,903,051$ 88,468,301$ 30 Risk Management 24,302,840$ 619,765$ 1,707,954$ 562,600$ 27,193,159$ 31 Financial Aid 110,948,894$ 3,864,276$ 33,500$ 533,940,002$ 648,786,672$ 32 Scholarships 10,650,000$ 7,251,781$ 442,138,044$ 460,039,825$ 33 Waivers 1,591,584$ 89,605$ 1,681,189$ 34 Finance Expense 196,573$ 501,760$ 3,601,757$ 1,586,821$ 5,886,911$ 35 Debt Service 1,514,846$ 205,000$ 51,309,974$ 12,492,511$ 166,770$ 65,689,101$ 36 Salary Incentive Payments 140,820$ 140,820$ 37 Law Enforcement Incentive Payments 14,799$ 14,799$ 38 Library Resources 44,628,572$ 61$ 190,510$ 44,819,143$ 39 Institute of Government 835,708$ 835,708$ 40 Regional Data Centers - SUS -$
STATE UNIVERSITY SYSTEM OF FLORIDA2016-2017 Operating Budget
Summary Schedule I

Education &
General1
Contracts &
Grants2 Auxiliaries3 Local Funds4 Faculty Practice5 Summary
STATE UNIVERSITY SYSTEM OF FLORIDA2016-2017 Operating Budget
Summary Schedule I
41 Black Male Explorers Program 198,000$ 198,000$ 42 Phosphate Research -$ 43 Other Operating Category 8,156,296$ 8,156,296$ 44 Total Operating Expenditures : 4,548,614,149$ 2,213,686,136$ 1,572,019,139$ 2,625,878,359$ 536,158,752$ 11,496,356,535$ 4546 Non-Operating Expenditures47 Transfers 925,860$ 558,547,048$ 362,112,408$ 131,393,621$ 615,406,775$ 1,668,385,712$ 48 Fixed Capital Outlay 400,000$ 3,000,000$ 3,400,000$ 49 Carryforward (From Prior Period Funds) 426,131,361$ 426,131,361$
50 Other7228,670$ 228,670$
51 Total Non-Operating Expenditures : 427,285,891$ 558,547,048$ 362,512,408$ 134,393,621$ 615,406,775$ 2,098,145,743$ 5253 Ending Fund Balance : 609,736,962$ 1,059,831,863$ 987,315,943$ 443,622,626$ 275,218,070$ 3,375,725,464$
5455 Fund Balance Increase / Decrease : (373,561,621)$ 14,484,927$ (86,782,844)$ (16,009,599)$ 2,522,510$ (459,346,627)$ 56 Fund Balance Percentage Change : -37.99% 1.39% -8.08% -3.48% 0.93% -11.98%

Education &
General1
IFAS E&G1
HSC E&G1
Contracts &
Grants2
Auxiliaries3
Local Funds4
Faculty
Practice5
Summary
1 Beginning Fund Balance 178,164,988$ 36,884,651$ 13,150,863$ 754,261,176$ 172,314,543$ 250,667,126$ 243,679,390$ 1,649,122,737$
2
3 Receipts/Revenues
4 General Revenue 365,930,982$ 157,537,380$ 106,226,937$ 629,695,299$
5 Lottery 50,765,017$ 12,533,877$ 5,796,416$ 69,095,310$
6 Student Tuition 316,441,618$ 38,267,508$ 354,709,126$
7 Phosphate Research -$
8 Other U.S. Grants 11,904,000$ 354,654,337$ 312,007,538$ 678,565,875$
9 City or County Grants -$
10 State Grants 47,303,018$ 67,702,229$ 115,005,247$
11 Other Grants and Donations 134,069,371$ 36,178,917$ 272,118$ 170,520,406$
12 Donations / Contrib. Given to the State 640,942,309$ 4,938,789$ 645,881,098$
13 Sales of Goods / Services 14,878,718$ 9,847,881$ 29,814,715$ 236,504,734$ 97,243,217$ 136,395,686$ 524,684,951$
14 Sales of Data Processing Services -$
15 Fees 5,012,000$ 120,474,833$ 34,084,736$ 572,881,972$ 732,453,541$
16 Miscellaneous Receipts 142,328$ 141,942$ 7,197,640$ 2,275,384$ 159,948,150$ 169,705,444$
17 Rent 789,967$ 975,159$ 214,200$ 4,928,545$ 6,907,871$
18 Concessions 122,000$ 700,000$ 822,000$
19 Assessments / Services 11,286,174$ 11,286,174$
20 Other Reciepts / Revenues6
100,000$ 20,153$ 195$ 2,233,831$ 1,792,130$ 6,777,819$ 58,327$ 10,982,455$
21 Subtotal: 738,249,617$ 197,806,423$ 161,114,096$ 1,209,373,723$ 371,019,882$ 573,194,803$ 869,556,253$ 4,120,314,797$
22 Transfers In 13,500$ 21,989,548$ 450,298,018$ 104,197,396$ 49,552,601$ 626,051,063$
23 Total - Receipts / Revenues: 738,249,617$ 197,819,923$ 183,103,644$ 1,659,671,741$ 475,217,278$ 622,747,404$ 869,556,253$ 4,746,365,860$
24
25 Operating Expenditures
26 Salaries and Benefits 567,521,763$ 143,067,976$ 133,441,567$ 662,050,151$ 118,466,493$ 57,990,670$ 108,128,000$ 1,790,666,620$
27 Other Personal Services 52,234,933$ 1,517,522$ 6,944,809$ 187,421,464$ 32,527,098$ 4,137,678$ 284,783,504$
28 Expenses 63,575,001$ 42,249,736$ 34,285,534$ 312,969,267$ 201,270,698$ 81,009,887$ 172,360,100$ 907,720,223$
29 Operating Capital Outlay 537,176$ 305,736$ 786,945$ 23,372,852$ 10,046,902$ 1,594,098$ 10,903,051$ 47,546,760$
30 Risk Management 2,433,229$ 1,463,051$ 1,166,454$ 5,062,734$
31 Financial Aid 1,737,381$ 1,737,381$
32 Scholarships 6,600,000$ 439,422,997$ 446,022,997$
33 Waivers 1,415,510$ 1,415,510$
34 Finance Expense 29,793$ 166,780$ 501,760$ 3,601,757$ 1,586,821$ 5,886,911$
35 Debt Service 2,659,953$ 11,035,000$ 13,694,953$
36 Salary Incentive Payments -$
37 Law Enforcement Incentive Payments -$
38 Library Resources 7,969,810$ 1,442,857$ 9,412,667$
39 Institute of Government -$
40 Regional Data Centers - SUS -$
UNIVERSITY OF FLORIDA
2016-2017 Operating Budget
Summary Schedule I

Education &
General1
IFAS E&G1
HSC E&G1
Contracts &
Grants2
Auxiliaries3
Local Funds4
Faculty
Practice5
Summary
UNIVERSITY OF FLORIDA
2016-2017 Operating Budget
Summary Schedule I
41 Black Male Explorers Program -$
42 Phosphate Research -$
43 Other Operating Category -$
44 Total Operating Expenditures : 704,024,803$ 188,633,814$ 178,234,946$ 1,186,315,494$ 368,572,901$ 595,190,330$ 292,977,972$ 3,513,950,260$
45
46 Non-Operating Expenditures
47 Transfers 525,417$ 400,443$ 470,892,318$ 124,608,133$ 34,551,604$ 570,679,448$ 1,201,657,363$
48 Fixed Capital Outlay 3,000,000$ 3,000,000$
49 Carryforward (From Prior Period Funds) 51,877,237$ 8,835,834$ 3,697,531$ 64,410,602$
50 Other7
-$
51 Total Non-Operating Expenditures : 51,877,237$ 9,361,251$ 4,097,974$ 470,892,318$ 124,608,133$ 37,551,604$ 570,679,448$ 1,269,067,965$
52
53 Ending Fund Balance : 160,512,565$ 36,709,509$ 13,921,587$ 756,725,105$ 154,350,787$ 240,672,596$ 249,578,223$ 1,612,470,372$
54
55 Fund Balance Increase / Decrease : (17,652,423)$ (175,142)$ 770,724$ 2,463,929$ (17,963,756)$ (9,994,530)$ 5,898,833$ (36,652,365)$
56 Fund Balance Percentage Change : -9.91% -0.47% 5.86% 0.33% -10.42% -3.99% 2.42% -2.22%

Education &
General1
Medical
School - E&G1
FAMU/FSU
College of
Engineering
Contracts &
Grants2
Auxiliaries3
Local Funds4
Faculty
Practice5
Summary
1 Beginning Fund Balance 63,238,871$ 13,874,462$ 2,422,458$ 154,677,051$ 188,773,131$ 63,449,726$ 945$ 486,436,644$
2
3 Receipts/Revenues
4 General Revenue 330,774,086$ 35,475,670$ 13,241,710$ 379,491,466$
5 Lottery 42,414,121$ 605,115$ 43,019,236$
6 Student Tuition 197,730,126$ 10,560,424$ 208,290,550$
7 Phosphate Research -$
8 Other U.S. Grants 126,053,189$ 75,500$ 49,177,599$ 175,306,288$
9 City or County Grants 445,162$ 445,162$
10 State Grants 20,857,394$ 59,087,345$ 79,944,739$
11 Other Grants and Donations 25,004,581$ 3,714,780$ 10,859,285$ 39,578,646$
12 Donations / Contrib. Given to the State -$
13 Sales of Goods / Services 10,286,777$ 115,480,979$ 72,189,842$ 2,283,272$ 200,240,870$
14 Sales of Data Processing Services 16,344,460$ 16,344,460$
15 Fees 515,000$ 64,649,896$ 39,720,707$ 104,885,603$
16 Miscellaneous Receipts -$
17 Rent 42,852,543$ 464,210$ 43,316,753$
18 Concessions -$
19 Assessments / Services -$
20 Other Reciepts / Revenues6
2,575,000$ 375,000$ 50,000$ 25,756,731$ 9,370,162$ 29,800,766$ 10,000$ 67,937,659$
21 Subtotal: 573,493,333$ 47,016,209$ 13,291,710$ 208,918,834$ 252,488,320$ 261,299,754$ 2,293,272$ 1,358,801,432$
22 Transfers In 1,202,181$ 1,202,181$
23 Total - Receipts / Revenues: 573,493,333$ 47,016,209$ 13,291,710$ 208,918,834$ 252,488,320$ 262,501,935$ 2,293,272$ 1,360,003,613$
24
25 Operating Expenditures
26 Salaries and Benefits 407,031,487$ 37,233,717$ 10,478,287$ 90,768,457$ 77,149,036$ 45,469,645$ 2,132,120$ 670,262,749$
27 Other Personal Services 37,089,467$ 3,305,735$ 979,497$ 35,885,099$ 19,006,181$ 8,161,056$ 61,500$ 104,488,535$
28 Expenses 97,433,875$ 5,907,576$ 1,473,926$ 73,182,018$ 129,769,091$ 198,227,091$ 2,096$ 505,995,673$
29 Operating Capital Outlay 1,122,227$ 98,094$ 310,000$ 9,331,621$ 3,024,221$ 1,916,966$ 15,803,129$
30 Risk Management 2,798,081$ 96,087$ 2,894,168$
31 Financial Aid 16,344,767$ 16,344,767$
32 Scholarships -$
33 Waivers 45,236$ 45,236$
34 Finance Expense -$
35 Debt Service 22,910,000$ 22,910,000$
36 Salary Incentive Payments 78,840$ 78,840$
37 Law Enforcement Incentive Payments -$
38 Library Resources 8,138,645$ 61$ 90,472$ 8,229,178$
39 Institute of Government 835,708$ 835,708$
40 Regional Data Centers - SUS -$
FLORIDA STATE UNIVERSITY
2016-2017 Operating Budget
Summary Schedule I

Education &
General1
Medical
School - E&G1
FAMU/FSU
College of
Engineering
Contracts &
Grants2
Auxiliaries3
Local Funds4
Faculty
Practice5
Summary
FLORIDA STATE UNIVERSITY
2016-2017 Operating Budget
Summary Schedule I
41 Black Male Explorers Program -$
42 Phosphate Research -$
43 Other Operating Category -$
44 Total Operating Expenditures : 570,918,333$ 46,641,209$ 13,241,710$ 209,167,256$ 251,949,001$ 253,774,758$ 2,195,716$ 1,347,887,983$
45
46 Non-Operating Expenditures
47 Transfers 1,152,706$ 22,345,346$ 8,681,623$ 87,556$ 32,267,231$
48 Fixed Capital Outlay -$
49 Carryforward (From Prior Period Funds) 62,156,049$ 14,249,462$ 495,668$ 76,901,179$
50 Other7
-$
51 Total Non-Operating Expenditures : 62,156,049$ 14,249,462$ 495,668$ 1,152,706$ 22,345,346$ 8,681,623$ 87,556$ 109,168,410$
52
53 Ending Fund Balance : 3,657,822$ -$ 1,976,790$ 153,275,923$ 166,967,104$ 63,495,280$ 10,945$ 389,383,864$
54
55 Fund Balance Increase / Decrease : (59,581,049)$ (13,874,462)$ (445,668)$ (1,401,128)$ (21,806,027)$ 45,554$ 10,000$ (97,052,780)$
56 Fund Balance Percentage Change : -94.22% -100.00% -18.40% -0.91% -11.55% 0.07% 1058.20% -19.95%

Education &
General1
Contracts &
Grants2
Auxiliaries3
Local Funds4
Summary
1 Beginning Fund Balance 31,198,773$ (4,917,210)$ 35,918,710$ (884,242)$ 61,316,031$
2
3 Receipts/Revenues
4 General Revenue 92,162,875$ 92,162,875$
5 Lottery 16,015,611$ 16,015,611$
6 Student Tuition 67,801,614$ 67,801,614$
7 Phosphate Research -$
8 Other U.S. Grants 54,171,419$ 54,171,419$
9 City or County Grants -$
10 State Grants 3,814,278$ 76,032$ 54,000$ 3,944,310$
11 Other Grants and Donations 2,171,160$ 32,239,772$ 34,410,932$
12 Donations / Contrib. Given to the State -$
13 Sales of Goods / Services 28,779,515$ 3,705,128$ 32,484,643$
14 Sales of Data Processing Services -$
15 Fees 16,000$ 4,680,205$ 10,948,461$ 15,644,666$
16 Miscellaneous Receipts 4,823,269$ 12,351,228$ 17,174,497$
17 Rent -$
18 Concessions -$
19 Assessments / Services -$
20 Other Reciepts / Revenues6
-$
21 Subtotal: 175,980,100$ 60,172,857$ 38,359,021$ 59,298,589$ 333,810,567$
22 Transfers In 3,385,657$ 10,455,000$ 13,840,657$
23 Total - Receipts / Revenues: 175,980,100$ 60,172,857$ 41,744,678$ 69,753,589$ 347,651,224$
24
25 Operating Expenditures
26 Salaries and Benefits 135,027,594$ 23,296,477$ 9,248,100$ 4,884,763$ 172,456,934$
27 Other Personal Services 4,808,764$ 5,530,319$ 2,125,609$ 965,033$ 13,429,725$
28 Expenses 27,965,528$ 22,002,575$ 16,977,068$ 52,985,094$ 119,930,265$
29 Operating Capital Outlay 386,300$ 2,818,498$ 167,398$ 35,000$ 3,407,196$
30 Risk Management 1,251,072$ 1,251,072$
31 Financial Aid 624,417$ 624,417$
32 Scholarships 3,200,000$ 3,200,000$
33 Waivers 130,838$ 130,838$
34 Finance Expense -$
35 Debt Service 1,514,846$ 6,157,857$ 7,672,703$
36 Salary Incentive Payments -$
37 Law Enforcement Incentive Payments 14,799$ 14,799$
38 Library Resources 857,942$ 857,942$
39 Institute of Government -$
40 Regional Data Centers - SUS -$
FLORIDA AGRICULTURAL & MECHANICAL UNIVERSITY
2016-2017 Operating Budget
Summary Schedule I

Education &
General1
Contracts &
Grants2
Auxiliaries3
Local Funds4
Summary
FLORIDA AGRICULTURAL & MECHANICAL UNIVERSITY
2016-2017 Operating Budget
Summary Schedule I
41 Black Male Explorers Program 198,000$ 198,000$
42 Phosphate Research -$
43 Other Operating Category -$
44 Total Operating Expenditures : 175,980,100$ 53,647,869$ 34,676,032$ 58,869,890$ 323,173,891$
45
46 Non-Operating Expenditures
47 Transfers 334,817$ 28,677,388$ 1,520,280$ 30,532,485$
48 Fixed Capital Outlay -$
49 Carryforward (From Prior Period Funds) -$
50 Other7
-$
51 Total Non-Operating Expenditures : -$ 334,817$ 28,677,388$ 1,520,280$ 30,532,485$
52
53 Ending Fund Balance : 31,198,773$ 1,272,961$ 14,309,968$ 8,479,177$ 55,260,879$
54
55 Fund Balance Increase / Decrease : -$ 6,190,171$ (21,608,742)$ 9,363,419$ (6,055,152)$
56 Fund Balance Percentage Change : 0.00% -125.89% -60.16% -1058.92% -9.88%

Education &
General1
HSC E&G1
Contracts &
Grants2
Auxiliaries3
Local Funds4
Faculty
Practice5
Summary
1 Beginning Fund Balance 162,906,194$ 41,343,112$ 75,905,342$ 173,632,985$ 30,987,584$ 32,334,613$ 517,109,830$
2
3 Receipts/Revenues
4 General Revenue 269,874,586$ 64,391,339$ 334,265,925$
5 Lottery 40,934,470$ 9,349,672$ 50,284,142$
6 Student Tuition 216,798,937$ 64,684,620$ 2,894,909$ 284,378,466$
7 Phosphate Research -$
8 Other U.S. Grants 301,921,590$ 315,508,500$ 617,430,090$
9 City or County Grants -$
10 State Grants 40,005,000$ 40,005,000$
11 Other Grants and Donations 1,132,721$ 1,132,721$
12 Donations / Contrib. Given to the State -$
13 Sales of Goods / Services 205,000$ 72,331,537$ 7,588,900$ 80,125,437$
14 Sales of Data Processing Services -$
15 Fees 60,313,086$ 65,821,643$ 174,535,545$ 300,670,274$
16 Miscellaneous Receipts 600,000$ 47,872,837$ 11,878,931$ 91,911,739$ 152,263,507$
17 Rent -$
18 Concessions -$
19 Assessments / Services -$
20 Other Reciepts / Revenues6
704,249$ 228,670$ 2,100,000$ 35,732,179$ 63,759$ 38,828,857$
21 Subtotal: 528,312,242$ 138,654,301$ 304,826,590$ 219,144,548$ 440,866,733$ 267,580,005$ 1,899,384,419$
22 Transfers In 178,645$ 121,360,000$ 42,267,068$ 41,528,575$ 205,334,288$
23 Total - Receipts / Revenues: 528,490,887$ 138,654,301$ 426,186,590$ 261,411,616$ 482,395,308$ 267,580,005$ 2,104,718,707$
24
25 Operating Expenditures
26 Salaries and Benefits 337,280,932$ 100,472,796$ 151,553,228$ 67,505,988$ 21,633,232$ 157,564,065$ 836,010,241$
27 Other Personal Services 32,580,082$ 3,675,860$ 69,143,362$ 15,213,438$ 5,138,515$ 2,854,860$ 128,606,117$
28 Expenses 136,765,572$ 31,574,599$ 140,007,000$ 114,925,740$ 433,192,498$ 67,871,272$ 924,336,681$
29 Operating Capital Outlay 572,278$ 172,500$ 4,000,000$ 4,319,518$ 996,073$ 10,060,369$
30 Risk Management 3,811,885$ 381,667$ 430,000$ 1,183,912$ 562,600$ 6,370,064$
31 Financial Aid 10,301,368$ 1,085,108$ 2,890,000$ 7,000$ 14,283,476$
32 Scholarships 1,747,382$ 1,747,382$
33 Waivers 89,605$ 89,605$
34 Finance Expense -$
35 Debt Service 3,214,248$ 51,500$ 3,265,748$
36 Salary Incentive Payments -$
37 Law Enforcement Incentive Payments -$
38 Library Resources 6,045,876$ 826,101$ 51,070$ 6,923,047$
39 Institute of Government -$
40 Regional Data Centers - SUS -$
UNIVERSITY OF SOUTH FLORIDA
2016-2017 Operating Budget
Summary Schedule I

Education &
General1
HSC E&G1
Contracts &
Grants2
Auxiliaries3
Local Funds4
Faculty
Practice5
Summary
UNIVERSITY OF SOUTH FLORIDA
2016-2017 Operating Budget
Summary Schedule I
41 Black Male Explorers Program -$
42 Phosphate Research -$
43 Other Operating Category -$ -$
44 Total Operating Expenditures : 527,357,993$ 138,188,631$ 368,023,590$ 208,257,901$ 228,290,197$ 1,931,692,730$
45
46 Non-Operating Expenditures
47 Transfers 58,000,000$ 61,306,114$ 30,264,937$ 43,375,950$ 192,947,001$
48 Fixed Capital Outlay -$
49 Carryforward (From Prior Period Funds) 60,600,000$ 20,056,006$ 80,656,006$
50 Other7
228,670$ 228,670$
51 Total Non-Operating Expenditures : 60,600,000$ 20,284,676$ 58,000,000$ 61,306,114$ 30,264,937$ 43,375,950$ 273,831,677$
52
53 Ending Fund Balance : 103,439,088$ 21,524,106$ 76,068,342$ 165,480,586$ 21,543,537$ 28,248,471$ 416,304,130$
54
55 Fund Balance Increase / Decrease : (59,467,106)$ (19,819,006)$ 163,000$ (8,152,399)$ (9,444,047)$ (4,086,142)$ (100,805,700)$
56 Fund Balance Percentage Change : -36.50% -47.94% 0.21% -4.70% -30.48% -12.64% -19.49%

Education &
General1
Medical
School E&G1
Contracts &
Grants2
Auxiliaries3
Local Funds4
Summary
1 Beginning Fund Balance 61,620,917$ 12,854,307$ 18,421,558$ 117,713,589$ 12,306,612$ 222,916,983$
2
3 Receipts/Revenues
4 General Revenue 152,645,069$ 14,693,918$ 167,338,987$
5 Lottery 22,506,154$ 22,506,154$
6 Student Tuition 136,074,256$ 9,648,247$ 145,722,503$
7 Phosphate Research -$
8 Other U.S. Grants 47,201,470$ 160,433,784$ 207,635,254$
9 City or County Grants -$
10 State Grants 4,236,029$ 12,132,018$ 16,368,047$
11 Other Grants and Donations 14,744,000$ 14,744,000$
12 Donations / Contrib. Given to the State -$
13 Sales of Goods / Services 69,303,241$ 69,303,241$
14 Sales of Data Processing Services -$
15 Fees 9,077,206$ 40,426,891$ 46,200,541$ 95,704,638$
16 Miscellaneous Receipts 5,775,270$ 5,775,270$
17 Rent -$
18 Concessions -$
19 Assessments / Services -$
20 Other Reciepts / Revenues6
231,000$ 231,000$
21 Subtotal: 311,225,479$ 24,342,165$ 60,514,705$ 115,505,402$ 233,741,343$ 745,329,094$
22 Transfers In 14,968,537$ 5,046,257$ 20,014,794$
23 Total - Receipts / Revenues: 311,225,479$ 24,342,165$ 60,514,705$ 130,473,939$ 238,787,600$ 765,343,888$
24
25 Operating Expenditures
26 Salaries and Benefits 185,580,410$ 17,342,721$ 28,209,504$ 43,710,248$ 9,051,695$ 283,894,578$
27 Other Personal Services 22,023,444$ 2,890,259$ 5,408,680$ 22,491,903$ 2,683,187$ 55,497,473$
28 Expenses 92,983,512$ 4,109,185$ 26,896,520$ 67,313,223$ 218,817,812$ 410,120,252$
29 Operating Capital Outlay -$
30 Risk Management 2,365,797$ 2,365,797$
31 Financial Aid 8,272,316$ 8,272,316$
32 Scholarships -$
33 Waivers -$
34 Finance Expense -$
35 Debt Service -$
36 Salary Incentive Payments -$
37 Law Enforcement Incentive Payments -$
38 Library Resources -$
39 Institute of Government -$
40 Regional Data Centers - SUS -$
FLORIDA ATLANTIC UNIVERSITY
2016-2017 Operating Budget
Summary Schedule I

Education &
General1
Medical
School E&G1
Contracts &
Grants2
Auxiliaries3
Local Funds4
Summary
FLORIDA ATLANTIC UNIVERSITY
2016-2017 Operating Budget
Summary Schedule I
41 Black Male Explorers Program -$
42 Phosphate Research -$
43 Other Operating Category -$
44 Total Operating Expenditures : 311,225,479$ 24,342,165$ 60,514,704$ 133,515,374$ 230,552,694$ 760,150,416$
45
46 Non-Operating Expenditures
47 Transfers 14,875,148$ 9,387,084$ 24,262,232$
48 Fixed Capital Outlay -$
49 Carryforward (From Prior Period Funds) 46,059,643$ 11,636,949$ 57,696,592$
50 Other7
-$
51 Total Non-Operating Expenditures : 46,059,643$ 11,636,949$ -$ 14,875,148$ 9,387,084$ 81,958,824$
52
53 Ending Fund Balance : 15,561,274$ 1,217,358$ 18,421,559$ 99,797,006$ 11,154,434$ 146,151,631$
54
55 Fund Balance Increase / Decrease : (46,059,643)$ (11,636,949)$ 1$ (17,916,583)$ (1,152,178)$ (76,765,352)$
56 Fund Balance Percentage Change : -74.75% -90.53% 0.00% -15.22% -9.36% -34.44%

Education &
General1
Contracts &
Grants2
Auxiliaries3
Local Funds4
Summary
1 Beginning Fund Balance 44,686,709$ 8,394,726$ 25,904,062$ 6,874,649$ 85,860,146$
2
3 Receipts/Revenues
4 General Revenue 101,433,718$ 101,433,718$
5 Lottery 8,492,718$ 8,492,718$
6 Student Tuition 45,798,775$ 45,798,775$
7 Phosphate Research -$
8 Other U.S. Grants 10,563,626$ 53,000,000$ 63,563,626$
9 City or County Grants 5,430,804$ 5,430,804$
10 State Grants -$
11 Other Grants and Donations 4,964,220$ 4,964,220$
12 Donations / Contrib. Given to the State -$
13 Sales of Goods / Services 1,434,760$ 405,328$ 1,840,088$
14 Sales of Data Processing Services -$
15 Fees 38,873$ 16,119,904$ 12,171,868$ 28,330,645$
16 Miscellaneous Receipts 1,392,898$ 4,335,195$ 27,452,856$ 33,180,949$
17 Rent 432,924$ 5,550$ 438,474$
18 Concessions -$
19 Assessments / Services -$
20 Other Reciepts / Revenues6
375,000$ 302,892$ 3,204,186$ 147,290$ 4,029,368$
21 Subtotal: 156,100,211$ 22,693,313$ 25,526,969$ 93,182,892$ 297,503,385$
22 Transfers In -$ -$
23 Total - Receipts / Revenues: 156,100,211$ 22,693,313$ 25,526,969$ 93,182,892$ 297,503,385$
24
25 Operating Expenditures
26 Salaries and Benefits 90,198,738$ 5,446,361$ 7,213,625$ 3,921,283$ 106,780,007$
27 Other Personal Services 7,484,843$ 2,723,962$ 2,785,901$ 1,125,976$ 14,120,682$
28 Expenses 47,372,080$ 13,462,178$ 14,697,098$ 87,033,964$ 162,565,320$
29 Operating Capital Outlay 42,760$ 25,000$ 524,278$ 592,038$
30 Risk Management 495,813$ 495,813$
31 Financial Aid 615,500$ 615,500$
32 Scholarships -$
33 Waivers -$
34 Finance Expense -$
35 Debt Service -$
36 Salary Incentive Payments -$
37 Law Enforcement Incentive Payments -$
38 Library Resources 1,401,941$ 1,401,941$
39 Institute of Government -$
40 Regional Data Centers - SUS -$
UNIVERSITY OF WEST FLORIDA
2016-2017 Operating Budget
Summary Schedule I

Education &
General1
Contracts &
Grants2
Auxiliaries3
Local Funds4
Summary
UNIVERSITY OF WEST FLORIDA
2016-2017 Operating Budget
Summary Schedule I
41 Black Male Explorers Program -$
42 Phosphate Research -$
43 Other Operating Category 8,156,296$ 8,156,296$
44 Total Operating Expenditures : 155,725,211$ 21,675,261$ 24,721,624$ 92,605,501$ 294,727,597$
45
46 Non-Operating Expenditures
47 Transfers (546,573)$ (132,542)$ 679,115$ -$
48 Fixed Capital Outlay 400,000$ 400,000$
49 Carryforward (From Prior Period Funds) 20,000,000$ 20,000,000$
50 Other7
-$
51 Total Non-Operating Expenditures : 20,000,000$ (546,573)$ 267,458$ 679,115$ 20,400,000$
52
53 Ending Fund Balance : 25,061,709$ 9,959,351$ 26,441,949$ 6,772,925$ 68,235,934$
54
55 Fund Balance Increase / Decrease : (19,625,000)$ 1,564,625$ 537,887$ (101,724)$ (17,624,212)$
56 Fund Balance Percentage Change : -43.92% 18.64% 2.08% -1.48% -20.53%

Education &
General1
Medical
School E&G1
Contracts &
Grants2
Auxiliaries3
Local Funds4
Faculty
Practice5
Summary
1 Beginning Fund Balance 137,488,042$ 15,323,181$ 23,154,497$ 175,347,996$ 53,913,057$ (6,273,364)$ 398,953,409$
2
3 Receipts/Revenues
4 General Revenue 279,937,275$ 26,017,366$ 305,954,641$
5 Lottery 38,834,488$ 38,834,488$
6 Student Tuition 266,752,552$ 15,469,240$ 5,863,411$ 288,085,203$
7 Phosphate Research -$
8 Other U.S. Grants 105,307,155$ 378,703,826$ 484,010,981$
9 City or County Grants -$
10 State Grants 7,273,865$ 48,056,497$ 55,330,362$
11 Other Grants and Donations 19,037,009$ 19,037,009$
12 Donations / Contrib. Given to the State -$
13 Sales of Goods / Services -$
14 Sales of Data Processing Services -$
15 Fees 66,906,618$ 63,484,773$ 130,391,391$
16 Miscellaneous Receipts 1,158,388$ 173,117,307$ 55,146,360$ 5,915,910$ 235,337,965$
17 Rent -$
18 Concessions -$
19 Assessments / Services 769,525$ 769,525$
20 Other Reciepts / Revenues6
4,199,644$ 185,000$ 173,889$ 4,558,533$
21 Subtotal: 589,723,959$ 41,671,606$ 132,776,417$ 245,887,336$ 546,334,870$ 5,915,910$ 1,562,310,098$
22 Transfers In 27,917,583$ 47,142,781$ 2,149,975$ 77,210,339$
23 Total - Receipts / Revenues: 589,723,959$ 41,671,606$ 160,694,000$ 245,887,336$ 593,477,651$ 8,065,885$ 1,639,520,437$
24
25 Operating Expenditures
26 Salaries and Benefits 420,929,343$ 30,717,237$ 73,863,750$ 66,989,597$ 35,477,672$ 5,218,937$ 633,196,536$
27 Other Personal Services -$
28 Expenses 124,381,824$ 7,784,369$ 86,830,250$ 185,001,400$ 50,557,467$ 2,846,918$ 457,402,228$
29 Operating Capital Outlay -$
30 Risk Management 2,141,926$ 2,141,926$
31 Financial Aid 35,170,866$ 3,170,000$ 508,219,163$ 546,560,029$
32 Scholarships -$
33 Waivers -$
34 Finance Expense -$
35 Debt Service 1,406,011$ 1,406,011$
36 Salary Incentive Payments -$
37 Law Enforcement Incentive Payments -$
38 Library Resources 7,100,000$ 7,100,000$
39 Institute of Government -$
40 Regional Data Centers - SUS -$
UNIVERSITY OF CENTRAL FLORIDA
2016-2017 Operating Budget
Summary Schedule I

Education &
General1
Medical
School E&G1
Contracts &
Grants2
Auxiliaries3
Local Funds4
Faculty
Practice5
Summary
UNIVERSITY OF CENTRAL FLORIDA
2016-2017 Operating Budget
Summary Schedule I
41 Black Male Explorers Program -$
42 Phosphate Research -$
43 Other Operating Category -$
44 Total Operating Expenditures : 589,723,959$ 41,671,606$ 160,694,000$ 251,990,997$ 595,660,313$ 8,065,855$ 1,647,806,730$
45
46 Non-Operating Expenditures
47 Transfers -$
48 Fixed Capital Outlay -$
49 Carryforward (From Prior Period Funds) 48,825,032$ 6,460,023$ 55,285,055$
50 Other7
-$
51 Total Non-Operating Expenditures : 48,825,032$ 6,460,023$ -$ -$ -$ -$ 55,285,055$
52
53 Ending Fund Balance : 88,663,010$ 8,863,158$ 23,154,497$ 169,244,335$ 51,730,395$ (6,273,334)$ 335,382,061$
54
55 Fund Balance Increase / Decrease : (48,825,032)$ (6,460,023)$ -$ (6,103,661)$ (2,182,662)$ 30$ (63,571,348)$
56 Fund Balance Percentage Change : -35.51% -42.16% 0.00% -3.48% -4.05% 0.00% -15.93%

Education &
General1
Medical
School E&G1
Contracts &
Grants2
Auxiliaries3
Local Funds4
Faculty
Practice5
Summary
1 Beginning Fund Balance 76,712,370$ 10,803,393$ 10,287,399$ 142,800,987$ 25,525,172$ 2,953,976$ 269,083,297$
2
3 Receipts/Revenues
4 General Revenue 208,014,204$ 31,698,518$ 239,712,722$
5 Lottery 33,200,019$ 33,200,019$
6 Student Tuition 235,952,139$ 18,237,508$ 44,450,711$ 15,129,314$ 313,769,672$
7 Phosphate Research -$
8 Other U.S. Grants 74,763,518$ 92,289,920$ 167,053,438$
9 City or County Grants 5,276,867$ 5,276,867$
10 State Grants 140,411$ 22,783,898$ 22,924,309$
11 Other Grants and Donations 14,156,173$ 5,000$ 2,041,491$ 16,202,664$
12 Donations / Contrib. Given to the State -$
13 Sales of Goods / Services 7,973,496$ 102,751,364$ 3,401,678$ 20,000$ 114,146,538$
14 Sales of Data Processing Services -$
15 Fees 15,332,748$ 66,590,946$ 81,923,694$
16 Miscellaneous Receipts 18,427,079$ 20,911,787$ 14,318,666$ 53,657,532$
17 Rent 33,255,710$ 483,916$ 33,739,626$
18 Concessions -$
19 Assessments / Services -$
20 Other Reciepts / Revenues6
12,024,218$ 487,502$ 4,047,215$ 16,558,935$
21 Subtotal: 477,166,362$ 49,936,026$ 120,737,544$ 228,731,538$ 215,001,924$ 6,592,622$ 1,098,166,016$
22 Transfers In 30,256,497$ 69,159,215$ 46,139,810$ 145,555,522$
23 Total - Receipts / Revenues: 477,166,362$ 49,936,026$ 150,994,041$ 297,890,753$ 261,141,734$ 6,592,622$ 1,243,721,538$
24
25 Operating Expenditures
26 Salaries and Benefits 319,623,903$ 40,437,413$ 64,050,840$ 81,491,369$ 18,345,301$ 523,948,826$
27 Other Personal Services 39,455,579$ 2,570,471$ 14,976,379$ 14,901,914$ 3,285,297$ 75,189,640$
28 Expenses 77,807,960$ 6,132,231$ 40,560,479$ 91,552,446$ 198,351,392$ 4,462,242$ 418,866,750$
29 Operating Capital Outlay 4,051,274$ 1,851,887$ 2,367,705$ 857,652$ 9,128,518$
30 Risk Management 3,104,310$ 80,190$ 189,765$ 380,791$ 3,755,056$
31 Financial Aid 24,821,566$ 24,821,566$
32 Scholarships 5,504,399$ 5,504,399$
33 Waivers -$
34 Finance Expense -$
35 Debt Service 205,000$ 14,322,916$ 166,770$ 14,694,686$
36 Salary Incentive Payments 31,980$ 31,980$
37 Law Enforcement Incentive Payments -$
38 Library Resources 8,269,790$ 715,721$ 8,985,511$
39 Institute of Government -$
40 Regional Data Centers - SUS -$
FLORIDA INTERNATIONAL UNIVERSITY
2016-2017 Operating Budget
Summary Schedule I

Education &
General1
Medical
School E&G1
Contracts &
Grants2
Auxiliaries3
Local Funds4
Faculty
Practice5
Summary
FLORIDA INTERNATIONAL UNIVERSITY
2016-2017 Operating Budget
Summary Schedule I
41 Black Male Explorers Program -$
42 Phosphate Research -$
43 Other Operating Category -$
44 Total Operating Expenditures : 477,166,362$ 49,936,026$ 121,834,350$ 210,521,540$ 220,839,642$ 4,629,012$ 1,084,926,932$
45
46 Non-Operating Expenditures
47 Transfers 29,341,080$ 79,746,589$ 44,590,023$ 1,263,821$ 154,941,513$
48 Fixed Capital Outlay -$
49 Carryforward (From Prior Period Funds) 21,731,662$ 8,306,591$ 30,038,253$
50 Other7
-$
51 Total Non-Operating Expenditures : 21,731,662$ 8,306,591$ 29,341,080$ 79,746,589$ 44,590,023$ 1,263,821$ 184,979,766$
52
53 Ending Fund Balance : 54,980,708$ 2,496,802$ 10,106,010$ 150,423,611$ 21,237,241$ 3,653,765$ 242,898,137$
54
55 Fund Balance Increase / Decrease : (21,731,662)$ (8,306,591)$ (181,389)$ 7,622,624$ (4,287,931)$ 699,789$ (26,185,160)$
56 Fund Balance Percentage Change : -28.33% -76.89% -1.76% 5.34% -16.80% 23.69% -9.73%

Education &
General1
Contracts &
Grants2
Auxiliaries3
Local Funds4
Summary
1 Beginning Fund Balance 27,181,624$ 574,071$ 23,206,668$ 11,371,019$ 62,333,382$
2
3 Receipts/Revenues
4 General Revenue 75,287,726$ 75,287,726$
5 Lottery 13,829,188$ 13,829,188$
6 Student Tuition 66,309,501$ 66,309,501$
7 Phosphate Research -$
8 Other U.S. Grants 2,803,639$ 20,000,000$ 22,803,639$
9 City or County Grants -$
10 State Grants -$
11 Other Grants and Donations 3,249,633$ 14,024,000$ 17,273,633$
12 Donations / Contrib. Given to the State -$
13 Sales of Goods / Services 38,900$ 38,900$
14 Sales of Data Processing Services -$
15 Fees 158,619$ 6,479,416$ 24,819,141$ 31,457,176$
16 Miscellaneous Receipts 4,000,401$ 19,833,709$ 3,673,165$ 27,507,275$
17 Rent 22,697,792$ 22,697,792$
18 Concessions 28,000$ 54,000$ 82,000$
19 Assessments / Services -$
20 Other Reciepts / Revenues6
9,956$ 312,311$ 56,447$ 378,714$
21 Subtotal: 155,426,415$ 10,222,248$ 49,390,128$ 62,626,753$ 277,665,544$
22 Transfers In 135,527$ 5,250,670$ 536,000$ 5,922,197$
23 Total - Receipts / Revenues: 155,426,415$ 10,357,775$ 54,640,798$ 63,162,753$ 283,587,741$
24
25 Operating Expenditures
26 Salaries and Benefits 118,065,150$ 4,166,603$ 13,461,289$ 10,628,875$ 146,321,917$
27 Other Personal Services 6,086,823$ 1,381,420$ 3,142,085$ 2,895,110$ 13,505,438$
28 Expenses 24,841,827$ 4,513,230$ 33,919,919$ 48,963,955$ 112,238,931$
29 Operating Capital Outlay 60,188$ 302,059$ 432,560$ 5,000$ 799,807$
30 Risk Management 1,072,522$ 1,072,522$
31 Financial Aid 5,267,405$ (4,103)$ 409,500$ 5,672,802$
32 Scholarships -$
33 Waivers -$
34 Finance Expense -$
35 Debt Service -$
36 Salary Incentive Payments 30,000$ 30,000$
37 Law Enforcement Incentive Payments -$
38 Library Resources 2,500$ 47,468$ 49,968$
39 Institute of Government -$
40 Regional Data Centers - SUS -$
UNIVERSITY OF NORTH FLORIDA
2016-2017 Operating Budget
Summary Schedule I

Education &
General1
Contracts &
Grants2
Auxiliaries3
Local Funds4
Summary
UNIVERSITY OF NORTH FLORIDA
2016-2017 Operating Budget
Summary Schedule I
41 Black Male Explorers Program -$
42 Phosphate Research -$
43 Other Operating Category -$
44 Total Operating Expenditures : 155,426,415$ 10,359,209$ 51,003,321$ 62,902,440$ 279,691,385$
45
46 Non-Operating Expenditures
47 Transfers 135,527$ 6,020,117$ 1,327,836$ 7,483,480$
48 Fixed Capital Outlay -$
49 Carryforward (From Prior Period Funds) 19,410,303$ 19,410,303$
50 Other7
-$
51 Total Non-Operating Expenditures : 19,410,303$ 135,527$ 6,020,117$ 1,327,836$ 26,893,783$
52
53 Ending Fund Balance : 7,771,321$ 437,110$ 20,824,028$ 10,303,496$ 39,335,955$
54
55 Fund Balance Increase / Decrease : (19,410,303)$ (136,961)$ (2,382,640)$ (1,067,523)$ (22,997,427)$
56 Fund Balance Percentage Change : -71.41% -23.86% -10.27% -9.39% -36.89%

Education &
General1
Contracts &
Grants2
Auxiliaries3
Local Funds4
Summary
1 Beginning Fund Balance 22,621,717$ 4,115,922$ 15,290,902$ 4,533,403$ 46,561,944$
2
3 Receipts/Revenues
4 General Revenue 67,945,174$ 67,945,174$
5 Lottery 7,684,070$ 7,684,070$
6 Student Tuition 59,113,989$ 59,113,989$
7 Phosphate Research -$
8 Other U.S. Grants 9,547,394$ 22,130,655$ 31,678,049$
9 City or County Grants 748,825$ 748,825$
10 State Grants 1,717,274$ 266,941$ 1,984,215$
11 Other Grants and Donations 4,651,069$ 43,500$ 4,026,324$ 8,720,893$
12 Donations / Contrib. Given to the State -$
13 Sales of Goods / Services -$
14 Sales of Data Processing Services -$
15 Fees 4,089,060$ 14,961,969$ 19,051,029$
16 Miscellaneous Receipts 96,696$ 41,998,501$ 1,746,019$ 43,841,216$
17 Rent -$
18 Concessions -$
19 Assessments / Services -$
20 Other Reciepts / Revenues6
200,000$ 27,937$ 260,000$ 487,937$
21 Subtotal: 134,943,233$ 16,789,195$ 46,391,061$ 43,131,908$ 241,255,397$
22 Transfers In 5,298,739$ 4,458,967$ 1,033,917$ 10,791,623$
23 Total - Receipts / Revenues: 134,943,233$ 22,087,934$ 50,850,028$ 44,165,825$ 252,047,020$
24
25 Operating Expenditures
26 Salaries and Benefits 96,481,882$ 6,916,609$ 10,775,097$ 7,007,650$ 121,181,238$
27 Other Personal Services 8,775,678$ 2,019,400$ 2,126,550$ 1,910,928$ 14,832,556$
28 Expenses 22,957,144$ 8,027,391$ 13,689,941$ 8,366,787$ 53,041,263$
29 Operating Capital Outlay 263,910$ 109,358$ 334,010$ 100,000$ 807,278$
30 Risk Management 1,268,102$ 127,352$ 1,395,454$
31 Financial Aid 3,033,793$ 978,379$ 26,500$ 23,668,155$ 27,706,827$
32 Scholarships -$
33 Waivers -$
34 Finance Expense -$
35 Debt Service -$
36 Salary Incentive Payments -$
37 Law Enforcement Incentive Payments -$
38 Library Resources 1,675,724$ 1,500$ 1,677,224$
39 Institute of Government -$
40 Regional Data Centers - SUS -$
FLORIDA GULF COAST UNIVERSITY
2016-2017 Operating Budget
Summary Schedule I

Education &
General1
Contracts &
Grants2
Auxiliaries3
Local Funds4
Summary
FLORIDA GULF COAST UNIVERSITY
2016-2017 Operating Budget
Summary Schedule I
41 Black Male Explorers Program -$
42 Phosphate Research -$
43 Other Operating Category -$
44 Total Operating Expenditures : 134,456,233$ 18,051,137$ 27,080,950$ 41,053,520$ 220,641,840$
45
46 Non-Operating Expenditures
47 Transfers (762,827)$ 23,371,115$ 391,119$ 22,999,407$
48 Fixed Capital Outlay -$
49 Carryforward (From Prior Period Funds) 5,622,446$ 5,622,446$
50 Other7
-$
51 Total Non-Operating Expenditures : 5,622,446$ (762,827)$ 23,371,115$ 391,119$ 28,621,853$
52
53 Ending Fund Balance : 17,486,271$ 8,915,546$ 15,688,865$ 7,254,589$ 49,345,271$
54
55 Fund Balance Increase / Decrease : (5,135,446)$ 4,799,624$ 397,963$ 2,721,186$ 2,783,327$
56 Fund Balance Percentage Change : -22.70% 116.61% 2.60% 60.03% 5.98%

Education &
General1
Contracts &
Grants2
Auxiliaries3
Local Funds4
Summary
1 Beginning Fund Balance 4,695,924$ 472,404$ 2,703,011$ 328,525$ 8,199,864$
2
3 Receipts/Revenues
4 General Revenue 18,366,962$ 18,366,962$
5 Lottery 1,115,762$ 1,115,762$
6 Student Tuition 4,990,000$ 4,990,000$
7 Phosphate Research -$
8 Other U.S. Grants 619,738$ 619,738$
9 City or County Grants -$
10 State Grants -$
11 Other Grants and Donations 889,000$ 4,116,967$ 5,005,967$
12 Donations / Contrib. Given to the State -$
13 Sales of Goods / Services -$
14 Sales of Data Processing Services -$
15 Fees 50,000$ 842,580$ 853,460$ 1,746,040$
16 Miscellaneous Receipts 1,882,583$ 6,623,105$ 4,100$ 8,509,788$
17 Rent -$
18 Concessions -$
19 Assessments / Services -$
20 Other Reciepts / Revenues6
-$ 5,000$ 22,000$ 5,300$ 32,300$
21 Subtotal: 24,522,724$ 3,396,321$ 7,487,685$ 4,979,827$ 40,386,557$
22 Transfers In 1,295,000$ -$ 1,295,000$
23 Total - Receipts / Revenues: 24,522,724$ 3,396,321$ 8,782,685$ 4,979,827$ 41,681,557$
24
25 Operating Expenditures
26 Salaries and Benefits 18,687,641$ 1,809,452$ 1,338,754$ 259,127$ 22,094,974$
27 Other Personal Services 502,582$ 712,216$ 268,940$ 89,520$ 1,573,258$
28 Expenses 3,493,792$ 881,598$ 3,383,046$ 294,178$ 8,052,614$
29 Operating Capital Outlay 26,606$ 84,000$ 110,606$
30 Risk Management 326,034$ 15,899$ 341,933$
31 Financial Aid 454,407$ 1,643,184$ 2,097,591$
32 Scholarships 850,000$ 2,715,047$ 3,565,047$
33 Waivers -$
34 Finance Expense -$
35 Debt Service 2,045,000$ 2,045,000$
36 Salary Incentive Payments -$
37 Law Enforcement Incentive Payments -$
38 Library Resources 181,665$ 181,665$
39 Institute of Government -$
40 Regional Data Centers - SUS -$
NEW COLLEGE OF FLORIDA
2016-2017 Operating Budget
Summary Schedule I

Education &
General1
Contracts &
Grants2
Auxiliaries3
Local Funds4
Summary
NEW COLLEGE OF FLORIDA
2016-2017 Operating Budget
Summary Schedule I
41 Black Male Explorers Program -$
42 Phosphate Research -$
43 Other Operating Category -$
44 Total Operating Expenditures : 24,522,727$ 3,403,266$ 7,135,639$ 5,001,056$ 40,062,688$
45
46 Non-Operating Expenditures
47 Transfers 1,295,000$ 1,295,000$
48 Fixed Capital Outlay -$
49 Carryforward (From Prior Period Funds) -$ -$
50 Other7
-$ -$
51 Total Non-Operating Expenditures : -$ -$ 1,295,000$ -$ 1,295,000$
52
53 Ending Fund Balance : 4,695,921$ 465,459$ 3,055,057$ 307,296$ 8,523,733$
54
55 Fund Balance Increase / Decrease : (3)$ (6,945)$ 352,046$ (21,229)$ 323,869$
56 Fund Balance Percentage Change : 0.00% -1.47% 13.02% -6.46% 3.95%

Education &
General1
Contracts &
Grants2
Auxiliaries3
Local Funds4
Summary
1 Beginning Fund Balance 26,126,027$ -$ 492,203$ 559,594$ 27,177,824$
2
3 Receipts/Revenues
4 General Revenue 34,658,654$ 34,658,654$
5 Lottery 292,702$ 292,702$
6 Student Tuition 3,167,075$ 3,167,075$
7 Phosphate Research 3,062,084$ 3,062,084$
8 Other U.S. Grants -$
9 City or County Grants -$
10 State Grants -$
11 Other Grants and Donations 400,000$ 400,000$
12 Donations / Contrib. Given to the State -$
13 Sales of Goods / Services 2,438,074$ 2,438,074$
14 Sales of Data Processing Services -$
15 Fees 396,229$ 1,410,170$ 1,806,399$
16 Miscellaneous Receipts -$
17 Rent -$
18 Concessions 10,000$ 10,000$
19 Assessments / Services -$
20 Other Reciepts / Revenues6
-$
21 Subtotal: 41,180,515$ 400,000$ 2,834,303$ 1,420,170$ 45,834,988$
22 Transfers In 630,000$ 6,545,693$ 7,175,693$
23 Total - Receipts / Revenues: 41,180,515$ 1,030,000$ 2,834,303$ 7,965,863$ 53,010,681$
24
25 Operating Expenditures
26 Salaries and Benefits 22,004,210$ 469,000$ 111,350$ 22,584,560$
27 Other Personal Services 1,616,509$ 51,558$ 51,360$ 1,719,427$
28 Expenses 17,479,088$ 1,950,701$ 7,601,087$ 27,030,876$
29 Operating Capital Outlay 122,600$ 90,000$ 212,600$
30 Risk Management 46,620$ 46,620$
31 Financial Aid 50,000$ 50,000$
32 Scholarships -$
33 Waivers -$
34 Finance Expense -$
35 Debt Service -$
36 Salary Incentive Payments -$
37 Law Enforcement Incentive Payments -$
38 Library Resources -$
39 Institute of Government -$
40 Regional Data Centers - SUS -$
FLORIDA POLYTECHNIC UNIVERSITY
2016-2017 Operating Budget
Summary Schedule I

Education &
General1
Contracts &
Grants2
Auxiliaries3
Local Funds4
Summary
FLORIDA POLYTECHNIC UNIVERSITY
2016-2017 Operating Budget
Summary Schedule I
41 Black Male Explorers Program -$
42 Phosphate Research -$
43 Other Operating Category -$
44 Total Operating Expenditures : 41,196,427$ -$ 2,593,859$ 7,853,797$ 51,644,083$
45
46 Non-Operating Expenditures
47 Transfers -$
48 Fixed Capital Outlay -$
49 Carryforward (From Prior Period Funds) 16,110,925$ 16,110,925$
50 Other7
-$ -$
51 Total Non-Operating Expenditures : 16,110,925$ -$ -$ -$ 16,110,925$
52
53 Ending Fund Balance : 9,999,190$ 1,030,000$ 732,647$ 671,660$ 12,433,497$
54
55 Fund Balance Increase / Decrease : (16,126,837)$ 1,030,000$ 240,444$ 112,066$ (14,744,327)$
56 Fund Balance Percentage Change : -61.73% - 48.85% 20.03% -54.25%

STATE UNIVERSITY SYSTEM OF FLORIDA
2016-2017 OPERATING BUDGETS
EDUCATION AND GENERAL
DETAIL BY FUND
2015-2016 2016-2017
ACTUAL ESTIMATED
EXPENDITURES EXPENDITURES
UNIVERSITIES
GENERAL REVENUE 1,506,520,590$ 2,003,518,811$
EDUCATIONAL ENHANCEMENT 244,089,342$ 276,084,320$
STUDENT FEES TF 1,523,381,382$ 1,591,280,413$
OTHER TRUST FUNDS 1,745,077$ 3,162,084$
*UNIVERSITY CARRYFORWARD 286,682,767$ -$
UF-IFAS SUB-TOTAL 3,562,419,158$ 3,874,045,628$
UF-IFAS
GENERAL REVENUE 130,542,423$ 157,537,380$
EDUCATIONAL ENHANCEMENT 12,533,877$ 12,533,877$
OTHER TRUST FUNDS 18,908,096$ 18,562,557$
*UNIVERSITY CARRYFORWARD 16,982,744$ -$
SUB-TOTAL 178,967,140$ 188,633,814$
UF-HEALTH CENTER
GENERAL REVENUE 100,152,375$ 106,226,937$
EDUCATIONAL ENHANCEMENT 5,796,416$ 5,796,416$
STUDENT FEES TF 38,401,910$ 38,089,358$
OTHER TRUST FUNDS 28,125,562$ 28,122,235$
*UNIVERSITY CARRYFORWARD 7,139,041$ -$
SUB-TOTAL 179,615,304$ 178,234,946$
FSU-MEDICAL SCHOOL
GENERAL REVENUE 31,538,141$ 35,475,670$
EDUCATIONAL ENHANCEMENT 605,115$ 605,115$
STUDENT FEES TF 10,491,450$ 10,560,424$
*UNIVERSITY CARRYFORWARD 11,243,403$ -$
SUB-TOTAL 53,878,109$ 46,641,209$
USF-HEALTH SCIENCE CENTER
GENERAL REVENUE 54,132,524$ 64,141,339$
EDUCATIONAL ENHANCEMENT 5,370,689$ 9,349,672$
STUDENT FEES TF 53,999,423$ 64,697,620$
*UNIVERSITY CARRYFORWARD 19,565,617$ -$
SUB-TOTAL 133,068,253$ 138,188,631$
UCF-HEALTH SCIENCE CENTER
GENERAL REVENUE 26,167,536$ 26,017,366$
STUDENT FEES TF 13,337,956$ 15,654,240$
*CARRYFORWARD 5,051,919$ -$

STATE UNIVERSITY SYSTEM OF FLORIDA
2016-2017 OPERATING BUDGETS
EDUCATION AND GENERAL
DETAIL BY FUND
2015-2016 2016-2017
ACTUAL ESTIMATED
EXPENDITURES EXPENDITURES
SUB-TOTAL 44,557,411$ 41,671,606$
FIU-HEALTH SCIENCE CENTER
GENERAL REVENUE 24,273,858$ 31,698,518$
STUDENT FEES TF 18,065,975$ 18,237,508$
*UNIVERSITY CARRYFORWARD 4,971,216$
SUB-TOTAL 47,311,049$ 49,936,026$
FAU-HEALTH SCIENCE CENTER
GENERAL REVENUE 13,278,127$ 14,693,918$
STUDENT FEES TF 8,272,005$ 9,648,247$
*UNIVERSITY CARRYFORWARD 1,456,536$ -$
SUB-TOTAL 23,006,668$ 24,342,165$
FAMU/FSU COLLEGE OF ENGINEERING
GENERAL REVENUE 12,230,086$ 13,241,710$
SUB-TOTAL 12,230,086$ 13,241,710$
MOFFITT CANCER CENTER GENERAL REVENUE 10,576,930$ 10,576,930$
SUB-TOTAL 10,576,930$ 10,576,930$
HUMAN AND MACHINE COGNITION
GENERAL REVENUE 4,289,184$ 4,739,184$
SUB-TOTAL 4,289,184$ 4,739,184$
TOTAL
GENERAL REVENUE 1,913,701,774$ 2,467,867,763$
EDUCATIONAL ENHANCEMENT 268,395,439$ 304,369,400$
STUDENT FEES 1,665,950,101$ 1,748,167,810$
OTHER TRUST FUNDS 48,778,735$ 49,846,876$
*UNIVERSITY CARRYFORWARD 353,093,243$ -$
GRAND TOTAL 4,249,919,292$ 4,570,251,849$
*University carryforward consists of unexpended E&G appropriations from previous fiscal years.

62%
54%
5%
7%
27% 38%
6% 1%
0%
10%
20%
30%
40%
50%
60%
70%
80%
90%
100%
2007-08 2008-09 2009-10 2010-11 2011-12 2012-13 2013-14 2014-15 2015-16 2016-17
Other (Trust Funds)
Annual Education & General FundsPercentage of Total Funding by Source
2007-2008 through 2016-2017
Student Tuition
Lottery
General Revenue

State University System of FloridaEducation and General ExpendituresActual 2007-08 through 2014-2015; Estimated 2016-2017
Excludes IFAS, Health / Medical Centers
$2.85
$2.64 $2.65$2.77
$2.66
$2.97
$3.13
$3.40$3.57
$3.88
$1.0
$1.5
$2.0
$2.5
$3.0
$3.5
$4.0
$4.5
2007-08 2008-09 2009-10 2010-11 2011-12 2012-13 2013-14 2014-15 2015-16 2016-17
Billions

STATE UNIVERSITY SYSTEM OF FLORIDA
2016-2017 OPERATING BUDGETS
Moffitt Cancer Center 10,576,930$
Institute for Human and Machine Cognition 4,739,184$
UCF Emerging Preeminence - Held in Central Reserves 5,000,000$ Johnson Scholarships Matching 1,237,500$
SUB-TOTALTotal: 21,553,614$
Moffitt Cancer Center 10,576,930$
Institute for Human and Machine Cognition 4,289,184$ Johnson Scholarships Matching 772,500$
Total: 15,638,614$
UNALLOCATED/SYSTEMWIDE ISSUES
EDUCATION AND GENERAL
2015-2016 Actual Expenditures:
2016-2017 Estimated Expenditures:
$0
$500
$1,000
$1,500
$2,000
$2,500
$3,000
$3,500
$4,000
$4,500
$5,000
State Funds Tuition
240,000
245,000
250,000
255,000
260,000
265,000
270,000
275,000
280,000
285,000
290,000
295,000Millions
Education & General Budget EntityTotal Funding / Student Tuition /
And Student FTE (US FTE Definition)Actual 2007-2008 through 2015-16; Estimated 2016-2017
Student FTE

Education & General Estimated ExpendituresPercentage by University
2016-2017
Total Expenditures: $4,548,698,235
Includes IFAS, UF-HSC, USF-HSC,
FSU-MS, UCF-MS, FIU-MS
FIU11.59%
FAMU3.87%
FAMU/FSU COE
0.29%
FAU7.38%
FSU13.58%
UWF3.42%
USF14.63%
UNF3.41%
UCF13.88%
FGCU2.96%
UF23.54%
NCF0.54%
FPU0.91%
FIU12.29%
FAMU4.54%
FAMU/FSU COE0.34%
FAU8.02%
FSU14.71%
UWF4.02%
USF13.59%
UNF4.01%
UCF15.19%
FGCU3.46%UF
18.14%
NCF0.63%
FPU1.06%
Total Expenditures: $3,881,049,838
Excludes IFAS, UF-HSC, USF-HSC, FSU-MS, UCF-MS, FIU-MS
Does not include $ 21,553,614 in pass-through funding held centrally.Does not include $21,553,614 in pass-through funding held centrally.

Education & General PositionsPercentage by University
2016-2017
Total Positions: 32,002.9
Includes IFAS, UF-HSC, USF-HSC, FSU-MS, UCF-MS, FIU-MS, FAU-MS
Total Positions: 28,120.42
Excludes IFAS, UF-HSC, USF-HSC, FSU-MS, UCF-MS, FIU-MS, FAU-MS
FIU14.02%
FAMU4.77%
FAMU/FSU COE0.33%
FAU9.13%
FSU14.51%
UWF3.93%
USF12.06%
UNF4.77%
UCF14.45%
FGCU3.86%
UF16.58%
NCF0.82%
FPU0.77%
FIU13.50%
FAMU4.19%
FAMU/FSU COE0.29%
FAU8.53%
FSU13.76%
UWF3.45%
USF13.37%
UNF4.19%
UCF13.44%
FGCU3.39%
UF20.49%
NCF0.72%
FPU0.68%

Education & General Budget Allocationby Program Component
Includes IFAS, Health/Medical Centers2016-2017
Admin & Support $537,671,860 (11.82%)
Allied Clinics,$28,463,256 (<1%)
Instruction & Research, $2,874,790,868 (63.2%)
Radio / TV, $7,474,100(<1%)
PO&M, $394,342,014 (8.67%)
Institutes & Centers* $181,680,532 (4.00%)
Library/Audio Visual $138,612,970 (3.05%)
Museums, $19,468,775 (<1%)
Student Services $300,673,134 (6.61%)
Agricultural Ext. Services $60,931,365 (1.34%)
AISO, $4,589,361 (<1%)
*Includes state services related to research organizations and legislative approved institutes.
** Total Budget $4,548,698,235
** Does not include $21,553,614 in pass-through funding held centrally.

UF FSU FAMU USF FAU UWF UCF FIU UNF FGCU NCF FPU
Instruction & Research
General Academic Instruction 52.54% 48.14% 41.68% 41.51% 47.82% 30.06% 46.26% 42.07% 46.87% 46.67% 38.87% 18.78%
Individual or Project Research 4.01% 5.35% 0.18% 3.54% 1.09% 0.24% 4.90% 3.48% 0.48% 0.00% 0.00% 6.18%
Public Service 0.27% 0.15% 0.19% 0.02% 0.25% 0.20% 0.02% 0.17% 1.08% 0.38% 0.00% 0.42%
Academic Advising 0.03% 1.12% 0.90% 1.74% 1.29% 0.49% 2.24% 0.65% 1.62% 1.89% 0.00% 0.14%
Computing Support 4.38% 4.42% 0.03% 5.01% 3.49% 3.41% 1.62% 2.64% 2.96% 1.66% 2.70% 11.04%
Academic Administration 11.42% 5.22% 12.23% 16.93% 6.22% 7.23% 4.12% 11.98% 6.81% 5.47% 2.74% 5.44%
Total 72.63% 64.40% 55.21% 68.76% 60.16% 41.63% 59.17% 60.99% 59.82% 56.05% 44.31% 41.99%
Acad. Infrastructure Support Organizations
Total 0.11% 0.00% 0.00% 0.64% 0.28% 0.00% 0.00% 0.00% 0.00% 0.00% 0.00% 0.00%
Institutes & Research Centers
Total 0.65% 0.40% 0.52% 0.78% 5.55% 30.73% 0.61% 1.56% 0.74% 0.00% 0.00% 0.00%
Plant Operations & Maintenance
Plant Administration 0.54% 2.05% 3.28% 0.63% 1.08% 1.05% 8.92% 1.32% 1.41% 1.58% 0.77% 2.87%
Utilities 2.77% 4.63% 5.72% 3.96% 4.48% 2.77% 2.58% 3.57% 3.54% 3.04% 3.97% 1.70%
Building Maintenance 1.77% 2.98% 1.57% 4.21% 1.18% 1.68% 0.79% 3.14% 3.05% 5.12% 3.11% 1.58%
Custodial Services 2.09% 3.11% 1.82% 2.28% 1.16% 1.78% 2.02% 2.38% 3.41% 1.32% 3.44% 0.75%
Total 7.17% 12.77% 12.40% 11.09% 7.90% 7.29% 14.31% 10.41% 11.41% 11.05% 11.29% 6.90%
Admin. Dir. & Support Services
General Administration 7.31% 11.11% 18.90% 9.14% 12.48% 9.85% 13.63% 11.36% 12.68% 18.40% 22.94% 41.75%
Radio/TV
Public Broadcasting Services 0.15% 0.41% 0.00% 0.20% 0.00% 0.45% 0.33% 0.00% 0.00% 0.50% 0.00% 0.00%
Library/Audio Visual
Libraries 4.30% 2.79% 4.18% 3.15% 3.95% 2.53% 2.50% 4.03% 3.00% 4.18% 3.64% 1.56%
Audio Visual Services 0.00% 0.00% 0.00% 0.00% 0.08% 0.00% 0.00% 0.48% 0.00% 0.00% 0.10% 0.00%
Total 4.30% 2.79% 4.18% 3.15% 4.04% 2.53% 2.50% 4.51% 3.00% 4.18% 3.74% 1.56%
Museums & Galleries
Total 1.78% 0.57% 0.18% 0.17% 0.00% 0.00% 0.00% 0.86% 0.00% 0.00% 0.00% 0.00%
Student Services
EEO/Minority Students 0.00% 0.00% 0.00% 0.15% 0.07% 0.45% 0.00% 0.12% 0.64% 0.52% 0.24% 0.00%
Financial Aid 2.65% 4.10% 5.59% 3.80% 5.61% 2.38% 6.49% 6.42% 5.74% 2.85% 6.99% 0.74%
Career Placement 0.25% 0.36% 0.20% 0.26% 0.32% 0.35% 0.25% 0.26% 0.47% 0.21% 1.25% 0.00%
Other Student Services 2.94% 3.10% 2.83% 1.74% 3.51% 4.35% 2.72% 3.40% 5.41% 6.23% 9.24% 7.07%
Total 5.85% 7.55% 8.62% 5.95% 9.51% 7.53% 9.45% 10.20% 12.26% 9.82% 17.73% 7.81%
Intercollegiate Athletics
E&G - Title IX 0.00% 0.00% 0.00% 0.07% 0.07% 0.00% 0.10% 0.11% 0.09% 0.00% 0.00% 0.00%
E&G - Other 0.06% 0.00% 0.00% 0.05% 0.02% 0.00% 0.00% 0.00% 0.00% 0.00% 0.00% 0.00%
Total Education & General 100.00% 100.00% 100.00% 100.00% 100.00% 100.00% 100.00% 100.00% 100.00% 100.00% 100.00% 100.00%
State University System
Education and General
2015-2016 Percent of Budget
Allocated by Activity

UF FSU FAMU USF FAU UWF UCF FIU UNF FGCU NCF FPU SUSInstruction & Research
Positions 3,124.56 2,438.32 786.29 2,262.85 1,542.65 663.02 2,539.22 2,451.99 715.12 613.79 83.51 118.81 17,340.13 General Academic Instruction 345,031,676.00 241,275,015.00 $69,592,177 $197,650,311 $126,666,958 $45,216,706 $264,135,809 183,330,403.00 $73,432,821 59,032,373.00 $9,739,259 $5,687,880 $1,620,791,388
Individual or Project Research 26,313,535.00 26,830,153.00 $296,698 $16,845,199 $2,899,707 $356,540 $27,988,870 15,162,263.00 $751,505 0.00 $0 $1,870,877 $119,315,347
Public Service 1,745,985.00 741,845.00 $316,013 $113,865 $656,435 $300,197 $103,905 732,191.00 $1,694,001 479,229.00 $0 $126,415 $7,010,081 Academic Advising 178,765.00 5,635,516.00 $1,504,629 $8,300,005 $3,424,347 $744,625 $12,777,128 2,840,973.00 $2,533,805 2,384,936.00 $0 $41,333 $40,366,062
Computing Support 28,747,140.00 22,149,433.00 $44,994 $23,879,018 $9,230,920 $5,123,061 $9,270,251 11,503,887.00 $4,636,685 2,094,015.00 $675,764 $3,343,160 $120,698,328
Academic Administration 74,966,293.00 26,149,599.00 $20,422,538 $80,637,690 $16,466,580 $10,880,130 $23,529,515 52,225,924.00 $10,671,005 6,913,860.00 $687,348 $1,646,968 $325,197,450
Total $476,983,394 $322,781,561 $92,177,049 $327,426,088 $159,344,947 $62,621,259 $337,805,478 $265,795,641 $93,719,822 $70,904,413 $11,102,371 $12,716,633 $2,233,378,656
Academic Infrastructure Support Orgs.
Positions 0.00 0.00 0.00 23.70 11.35 0.00 0.00 0.00 0.00 0.00 0.00 0.00 35.05
Cost 742,605 $0 $0 $3,062,345 $729,383 $0 $0 $0 $0 $0 $0 $0 $4,534,333
Institutes & Research Centers
Positions 19.81 3.53 10.89 21.96 159.70 31.01 39.50 141.00 9.79 0.00 0.00 0.00 437.19
Cost $4,246,486 $1,985,625 $871,909 $3,730,843 $14,707,475 $46,223,703 $3,478,755 $6,792,079 $1,160,436 $0 $0 $0 $83,197,311
Plant Operations & Maintenance
Positions 468.55 599.91 193.00 358.32 134.75 112.00 410.90 378.80 219.14 50.00 33.40 7.00 2,965.77
Plant Administration $3,542,788 $10,278,919 $5,479,416 $2,992,638 $2,873,368 $1,584,116 $50,954,914 $5,758,701 $2,211,486 1,993,087.00 $193,011 $869,755 $88,732,199
Utilities $18,198,106 $23,213,499 $9,548,677 $18,880,538 $11,861,408 $4,162,519 $14,712,603 $15,578,761 $5,552,877 3,843,805.00 $995,562 $514,711 $127,063,066
Building Maintenance $11,627,531 $14,944,568 $2,621,838 $20,070,956 $3,129,544 $2,533,514 $4,517,694 $13,670,996 $4,777,216 6,475,691.00 $778,175 $478,372 $85,626,095
Custodial Services $13,700,610 $15,581,137 $3,046,525 $10,850,122 $3,059,531 $2,680,033 $11,510,194 $10,359,757 $5,340,490 1,667,125.00 $861,490 $227,917 $78,884,931
Total $47,069,035 $64,018,123 $20,696,456 $52,794,254 $20,923,851 $10,960,182 $81,695,405 $45,368,215 $17,882,069 $13,979,708 $2,828,238 $2,090,755 $380,306,291
Admin. Direction & Support Services
Positions 583.22 435.14 236.74 389.37 438.18 136.25 585.14 525.93 176.23 208.17 53.82 41.53 3,809.72
General Administration $47,991,628 55,694,112 $31,549,800 $43,525,885 $33,047,819 $14,820,345 $77,833,766 $49,494,681 $19,871,462 $23,280,938 $5,748,710 $12,644,459 $415,503,605
Radio/TV
Positions 15.33 22.64 0.00 11.95 0.00 6.51 29.00 0.00 0.00 7.52 0.00 0.00 92.95
Public Broadcasting Services $956,695 $2,038,741 $0 $936,350 $0 $674,269 $1,902,127 $0 $0 $632,905 $0 $0 $7,141,087
Library/Audio Visual
Positions 239.85 140.00 67.00 118.43 102.34 35.74 132.83 172.29 44.47 42.50 20.00 2.00 1,117.45
Libraries $28,212,763 $13,999,507 $6,974,965 $14,978,164 $10,469,268 $3,806,141 $14,259,982 $17,557,769 $4,695,068 $5,282,820 $912,414 $471,284 $121,620,145
Audio Visual Services $52 $83 $0 $0 $223,507 $0 $6,060 $2,100,104 $0 $0 $23,892 $0 $2,353,698
Total $28,212,815 $13,999,590 $6,974,965 $14,978,164 $10,692,775 $3,806,141 $14,266,042 $19,657,873 $4,695,068 $5,282,820 $936,306 $471,284 $123,973,843
Museums & Galleries
Positions 109.75 39.25 3.00 7.00 0.00 0.00 0.00 43.75 0.00 0.00 0.00 0.00 202.75
Cost $11,705,296 $2,877,123 $295,757 $801,886 $0.00 $0.00 $0.00 $3,759,370 $0.00 $0.00 $0.00 $0.00 $19,439,432
Student Services
Positions 248.38 239.82 62.88 126.92 179.03 87.00 250.36 243.51 154.49 116.02 36.73 18.00 1,763.14
EEO/Minority Students $0.00 $0.00 $0 $694,793 $196,324 $679,873 $0 $538,768 $1,008,384 $656,504 $61,243 $2,364,233 $6,200,122
Financial Aid $17,408,278 $20,526,180.00 $9,328,143 $18,101,771 $14,854,451 $3,574,543 $37,037,835 $27,976,372 $8,993,130 $3,607,985 $1,750,512 $0 $163,159,200
Career Placement $1,655,185 $1,792,947.00 $332,339 $1,250,557 $840,934 $531,404 $1,410,423 $1,115,748 $731,159 $270,098 $314,414 $0 $10,245,208
Other Student Services $19,339,310 $15,531,175.00 $4,728,636 $8,287,538 $9,306,372 $6,540,469 $15,501,376 $14,802,363 $8,469,462 $7,885,412 $2,315,675 $0 $112,707,788
Total $38,402,773 $37,850,302 $14,389,118 $28,334,659 $25,198,081 $11,326,289 $53,949,634 $44,433,251 $19,202,135 $12,419,999 $4,441,844 $2,364,233 $292,312,318
Intercollegiate Athletics
Positions 0.00 0.00 0.00 3.66 0.00 0.00 0.00 0.00 0.00 0.00 0.00 0.00 3.66
E&G - Title IX $0.00 $0.00 $0 $355,390 $174,090 $0.00 598,359 $481,205 $144,581 $0.00 $0.00 $0.00 $1,753,625
E&G - Other $384,462 $0.00 $0 $258,977 $56,156 $4,921 0 $0 $0.00 $0.00 $0.00 $0.00 $704,516
Total Education & General $656,695,189 $501,245,177 $166,955,054 $476,204,841 $264,874,577 $150,437,109 $570,931,207 $435,782,315 $156,675,573 $126,500,783 $25,057,469 $30,287,364 $3,561,646,658
Total Positions 4,809.45 3,918.61 1,359.80 3,324.16 2,568.00 1,071.53 3,986.95 3,957.27 1,319.24 1,038.00 227.46 187.34 27,767.81
State University System
Education and General
2015-2016 Actual Expenditures
By Program Activity

UF FSU FAMU USF FAU UWF UCF FIU UNF FGCU NCF FPUInstruction & Research
General Academic Instruction 49.92% 50.04% 48.15% 40.66% 49.40% 29.71% 52.19% 45.77% 47.45% 47.34% 38.23% 23.04%
Individual or Project Research 3.21% 4.40% 0.15% 2.62% 0.95% 0.23% 4.67% 3.10% 0.39% 0.00% 0.00% 8.22%
Public Service 0.27% 0.13% 0.13% 0.00% 0.12% 0.54% 0.01% 0.12% 0.09% 0.30% 0.00% 3.96% Academic Advising 0.00% 1.04% 0.91% 1.65% 1.20% 0.51% 2.17% 0.58% 1.64% 1.85% 0.00% 0.00%
Computing Support 4.27% 3.22% 0.04% 4.72% 2.61% 3.42% 1.65% 2.48% 3.19% 1.11% 2.82% 16.54%
Academic Administration 12.64% 5.93% 8.51% 18.10% 5.57% 7.71% 7.82% 12.40% 6.44% 5.69% 2.74% 14.80%
Total 70.31% 64.76% 57.87% 67.74% 59.86% 42.12% 68.51% 64.46% 59.21% 56.28% 43.80% 66.57%
Acad. Infrastructure Support Orgs.
Total 0.10% 0.00% 0.00% 0.63% 0.19% 0.00% 0.00% 0.00% 0.00% 0.00% 0.00% 0.00%
Institutes & Research Centers
Total 0.62% 0.33% 0.72% 0.52% 4.86% 31.39% 0.53% 1.32% 0.74% 0.02% 0.00% 0.00%
Plant Operations & Maintenance
Plant Administration 0.69% 1.65% 2.86% 0.56% 0.91% 1.12% 3.52% 1.15% 6.86% 1.93% 0.78% 4.91%
Utilities 2.67% 5.31% 5.45% 3.67% 3.69% 3.38% 2.51% 3.48% 3.63% 3.06% 3.30% 1.85%
Building Maintenance 1.49% 2.62% 1.58% 1.06% 1.07% 0.76% 0.03% 2.27% 0.91% 1.75% 3.36% 0.11%
Custodial Services 2.17% 2.98% 1.82% 2.17% 0.98% 1.79% 1.91% 2.38% 0.59% 1.20% 3.93% 0.75%
Total 7.03% 12.55% 11.71% 7.47% 6.66% 7.04% 7.97% 9.29% 12.00% 7.95% 11.37% 7.61%
Admin. Dir. & Support Services
General Administration 10.88% 11.38% 18.48% 14.59% 17.59% 9.71% 10.74% 10.29% 13.09% 22.01% 23.14% 18.46%
Radio/TV
Public Broadcasting Services 0.15% 0.37% 0.00% 0.18% 0.00% 0.43% 0.34% 0.00% 0.00% 0.46% 0.00% 0.00%
Library/Audio Visual
Libraries 3.88% 3.22% 3.76% 2.98% 3.23% 2.60% 2.53% 3.71% 1.99% 3.69% 4.05% 1.69%
Audio Visual Services 0.00% 0.00% 0.00% 0.00% 0.00% 0.00% 0.00% 0.48% 0.00% 0.00% 0.13% 0.00%
Total 3.88% 3.22% 3.76% 2.98% 3.23% 2.60% 2.54% 4.20% 1.99% 3.69% 4.18% 1.69%
Museums & Galleries
Total 1.69% 0.52% 0.09% 0.14% 0.00% 0.00% 0.00% 0.78% 0.00% 0.00% 0.00% 0.00%
Student Services
EEO/Minority Students 0.00% 0.00% 0.00% 0.15% 0.06% 0.40% 0.00% 0.12% 0.69% 0.45% 0.30% 0.00%
Financial Aid 2.41% 3.58% 4.94% 3.65% 3.04% 2.39% 6.35% 6.01% 6.38% 2.71% 6.75% 0.65%
Career Placement 0.25% 0.37% 0.22% 0.30% 0.35% 0.42% 0.26% 0.26% 0.48% 0.24% 1.32% 0.00%
Other Student Services 2.63% 2.92% 2.21% 1.53% 4.09% 3.49% 2.76% 3.17% 5.34% 6.18% 9.14% 5.02%
Total 5.29% 6.87% 7.37% 5.63% 7.54% 6.70% 9.37% 9.56% 12.89% 9.58% 17.50% 5.67%
Intercollegiate Athletics
E&G - Title IX 0.00% 0.00% 0.00% 0.07% 0.06% 0.00% 0.10% 0.10% 0.09% 0.00% 0.00% 0.00%
E&G - Other 0.06% 0.00% 0.00% 0.05% 0.02% 0.00% 0.00% 0.00% 0.00% 0.00% 0.00% 0.00%
Total Educational & General 100.00% 100.00% 100.00% 100.00% 99.81% 100.00% 100.00% 100.00% 100.00% 100.00% 100.00% 100.00%
State University System
Education and General
2016-17 Percent of Budget
Allocated by Activity

UF FSU FAMU USF FAU UWF UCF FIU UNF FGCU NCF FPU SUSInstruction & Research
Positions 3,027.36 2,533.62 768.21 2,265.14 1,509.96 506.65 2,551.99 2,435.04 729.01 623.29 84.81 124.01 17,159.09 General Academic Instruction $351,429,042 285,700,107 84,728,195.00 214,418,465 $153,752,269 $46,269,856 $307,787,005 $218,407,750 73,756,956.00 63,650,598.00 $9,376,226 $9,510,013 $1,818,786,482
Individual or Project Research $22,606,154 25,094,772 259,477.00 13,823,050 $2,965,011 $350,405 $27,525,099 $14,792,161 599,014.00 0.00 $0 $3,394,184 $111,409,327
Public Service $1,907,925 753,068 223,631.00 0 $378,506 $846,451 $85,655 $569,854 147,571.00 400,919.00 $0 $1,636,390 $6,949,970 Academic Advising $0 5,912,418 1,594,779.00 8,680,118 $3,736,365 $787,651 $12,782,988 $2,788,775 2,550,359.00 2,487,424.00 $0 $0 $41,320,877
Computing Support $30,031,642 18,399,272 65,000.00 24,887,368 $8,133,352 $5,330,222 $9,728,499 $11,838,160 4,955,582.00 1,494,216.00 $691,437 $6,828,971 $122,383,721
Academic Administration $89,021,672 33,867,751 14,969,503.00 95,429,182 $17,322,979 $12,007,657 $46,127,226 $59,176,565 10,014,838.00 7,644,594.00 $672,921 $6,108,818 $392,363,706
Total $494,996,435 $369,727,388 $101,840,585 $357,238,183 $186,288,482 $65,592,242 $404,036,472 $307,573,265 $92,024,320 $75,677,751 $10,740,584 $27,478,376 $2,493,214,083
Academic Infrastructure Support Orgs.
Positions 0.00 0.00 0.00 24.75 11.35 0.00 0.00 0.00 0.00 0.00 0.00 0.00 36.10
Cost $669,321 0.00 0.00 3,327,290 $592,750 $0 $0 $0 $0 $0 $0 $0 $4,589,361
Institutes & Research Centers
Positions 18.42 3.50 10.89 20.98 248.73 206.85 20.00 144.40 10.08 1.00 0.00 0.00 684.85
Cost $4,374,138 1,885,842.00 1,266,212.00 2,748,019 $15,118,127 $48,879,636 $3,147,046 $6,290,010 $1,150,667 $31,000 $0 $0 $84,890,697
Plant Operations & Maintenance
Positions 496.31 599.91 193.00 342.85 100.75 112.00 413.90 378.30 226.14 49.00 33.60 7.00 2,952.76
Plant Administration 4,870,069.00 9,395,604.00 5,031,335 2,949,620 $2,843,638 $1,736,528 $20,781,573 $5,503,016 10,669,455.00 $2,594,135 $192,458 $2,024,934 $68,592,365
Utilities 18,817,513.00 30,308,046.00 9,591,648 19,364,744 $11,487,983 $5,263,506 $14,803,608 $16,622,426 5,635,083.00 $4,114,602 $809,631 $761,934 $137,580,724
Building Maintenance 10,513,957.00 14,934,182.00 2,780,879 5,614,962 $3,331,821 $1,176,607 $148,641 $10,840,854 1,421,003.00 $2,357,438 $823,227 $47,045 $53,990,616
Custodial Services 15,307,735.00 17,001,032.00 3,206,720 11,458,225 $3,050,057 $2,786,098 $11,257,399 $11,350,710 920,341.00 $1,619,361 $963,119 $308,160 $79,228,957
Total $49,509,274 $71,638,864 $20,610,582 $39,387,551 $20,713,499 $10,962,739 $46,991,221 $44,317,006 $18,645,882 $10,685,536 $2,788,435 $3,142,073 $339,392,662
Admin. Direction & Support Services
Positions 512.02 498.65 237.42 460.19 372.04 143.11 672.98 509.80 175.79 229.52 55.78 60.09 3,927.39
General Administration 76,622,744.00 64,959,231 $32,519,374 76,919,730 $54,748,132 $15,123,518 $63,346,279 $49,118,595 $20,340,877 $29,599,645 $5,675,498 $7,620,331 $496,593,954
Radio/TV
Positions 14.31 23.64 0.00 11.95 0.00 8.01 28.00 0.00 0.00 8.52 0.00 0.00 94.43
Public Broadcasting Services $1,077,955 2,135,301 $0 956,627 $0 $671,176 $2,012,186 $0 $0 $620,855 $0 $0 $7,474,100
Library/Audio Visual
Positions 228.72 140.50 67.00 117.43 107.34 35.74 129.83 179.36 43.93 43.10 19.00 5.00 1,116.95
Libraries 27,289,244.00 18,377,744.00 6,616,573.00 $15,734,515 $10,066,051 $4,051,034 $14,933,183 $17,724,777 3,086,753.00 $4,960,461 $993,781 $697,930 $124,532,046
Audio Visual Services 0.00 0.00 0.00 $0 $0 $0 $20,000 $2,305,881 0.00 $0 $32,090 $0 $2,357,971
Total $27,289,244 $18,377,744 $6,616,573 $15,734,515 $10,066,051 $4,051,034 $14,953,183 $20,030,658 $3,086,753 $4,960,461 $1,025,871 $697,930 $126,890,017
Museums & Galleries
Positions 109.21 39.25 3.00 7.00 0.00 0.00 0.00 49.90 0.00 0.00 0.00 0.00 208.36
Cost 11,881,749.00 2,989,628.00 $160,385 $718,172 $0.00 $0.00 $0.00 $3,718,841 $0.00 $0.00 $0.00 $0.00 $19,468,775
Student Services
Positions 256.59 241.39 62.88 136.94 217.83 93.71 245.78 245.94 157.49 129.88 36.46 20.00 1,844.89
EEO/Minority Students $0 0 $0 $803,887 $199,151 $626,692 $0 $585,756 $1,067,646 $603,200 $73,062 $0 $3,959,394
Financial Aid $16,942,071 $20,460,797 $8,691,596 $19,232,553 $9,465,553 $3,724,419 $37,422,351 $28,666,677 $9,908,632 $3,639,119 $1,654,834 $267,558 $160,076,160
Career Placement $1,737,121 $2,086,408 $381,924 $1,573,514 $1,076,757 $658,687 $1,537,511 $1,253,430 $753,244 $323,421 $323,547 $0 $11,705,564
Other Student Services $18,540,289 $16,657,130 $3,892,869 $8,075,615 $12,726,731 $5,430,147 $16,277,710 $15,130,919 $8,303,813 $8,315,246 $2,240,893 $2,074,247 $117,665,609
Total $37,219,481 $39,204,335 $12,966,389 $29,685,569 $23,468,192 $10,439,945 $55,237,572 $45,636,782 $20,033,335 $12,880,986 $4,292,336 $2,341,805 $293,406,727
Intercollegiate Athletics
Positions 0.00 0 0.00 3.27 0.00 0.00 0.00 0.00 0.00 0.00 0.00 0.00 3.27
E&G - Title IX $0 0 $0 $372,127 $174,090 $0.00 $598,359 $481,205 $144,581 0.00 $0.00 $0.00 $1,770,362
E&G - Other $384,462 0 $0 $270,210 $56,156 $4,921 $0.00 $0 $0.00 0.00 $0.00 $0.00 $715,749
Total Education & General $704,024,803 $570,918,333 $175,980,100 $527,357,993 $311,225,479 $155,725,211 $589,723,959 $477,166,362 $155,426,415 $134,456,234 $24,522,724 $41,280,515 $3,867,808,128
Total Positions 4,662.94 4,080.46 1,342.40 3,390.50 2,568.00 1,106.07 4,062.48 3,942.74 1,342.44 1,084.31 229.65 216.10 28,028.09
State University System
Education and General
2016-2017 Estimated Expenditures
By Program Activity

State University System
Education and General
Comparative Statement of University
Actual and Estimated Expenditures by Activity
Expenditures % of total Expenditures % of total Expenditures % of total Expenditures % of total Expenditures % of total Expenditures % of total
Instruction & Research
Positions 2,803.30 2,900.97 2,850.03 3,057.45 3,124.56 3,027.36 General Academic Instruction $291,002,569 55.47% $296,647,790 54.67% $320,034,734 54.01% $343,082,190 54.36% $345,031,676 52.54% $351,429,042 49.92%
Individual or Project Research $12,641,139 2.41% $14,077,062 2.59% $15,442,001 2.61% $18,210,666 2.89% $26,313,535 4.01% $22,606,154 3.21%
Public Service $1,993,981 0.38% $2,686,662 0.50% $1,697,031 0.29% $1,963,927 0.31% $1,745,985 0.27% $1,907,925 0.27% Academic Advising $359,163 0.07% $372,468 0.07% $133,495 0.02% $228,639 0.04% $178,765 0.03% $0 0.00%
Computing Support $20,011,986 3.81% $33,889,991 6.25% $29,927,130 5.05% $30,673,049 4.86% $28,747,140 4.38% $30,031,642 4.27%
Academic Administration $43,221,102 8.24% $48,783,058 8.99% $61,848,064 10.44% $64,427,913 10.21% $74,966,293 11.42% $89,021,672 12.64%
Total $369,229,940 70.38% $396,457,031 73.06% $429,082,455 72.42% $458,586,384 72.66% $476,983,394 72.63% $494,996,435 70.31%
Academic Infrastructure Support Orgs.
Positions 45.50 0.00 0.00 0.00 0.00 0.00
Cost $9,276,348 1.77% $2,476,130 0.46% $526,285 0.09% $519,321 0.08% $742,605 0.11% $669,321 0.10%
Institutes & Research Centers
Positions 24.26 21.88 19.79 21.56 19.81 18.42
Cost $2,532,176 0.48% $2,558,263 0.47% $2,639,088 0.45% $3,325,327 0.53% $4,246,486 0.65% $4,374,138 0.62%
Plant Operations & Maintenance
Positions 547.29 494.98 492.77 475.74 468.55 496.31
Plant Administration $3,571,071 0.68% $3,958,790 0.73% $2,942,983 0.50% $2,994,459 0.47% $3,542,788 0.54% $4,870,069 0.69%
Utilities $18,512,236 3.53% $9,321,018 1.72% $14,854,020 2.51% $14,629,597 2.32% $18,198,106 2.77% $18,817,513 2.67%
Building Maintenance $8,804,647 1.68% $10,805,070 1.99% $10,779,959 1.82% $12,414,383 1.97% $11,627,531 1.77% $10,513,957 1.49%
Custodial Services $12,704,036 2.42% $12,672,610 2.34% $13,028,608 2.20% $13,744,219 2.18% $13,700,610 2.09% $15,307,735 2.17%
Total $43,591,990 8.31% $36,757,488 6.77% $41,605,570 7.02% $43,782,658 6.94% $47,069,035 7.17% $49,509,274 7.03%
Administrative Dir. & Support Services
Positions 422.91 405.3 512.67 507.72 583.22 512.02
General Administration $34,106,924 6.50% $36,055,368 6.64% $45,920,170 7.75% $47,833,471 7.58% $47,991,628 7.31% $76,622,744 10.88%
Radio/TV
Positions 19.64 14.51 13.13 17.76 15.33 14.31
Public Broadcasting Services $1,285,149 0.24% $1,072,977 0.20% $1,101,451 0.19% $1,125,402 0.18% $956,695 0.15% $1,077,955 0.15%
Library/Audio Visual
Positions 248.59 239.66 240.65 242.87 239.85 228.72
Libraries $24,695,285 4.71% $25,960,911 4.78% $26,937,947 4.55% $28,599,384 4.53% $28,212,763 4.30% $27,289,244 3.88%
Audio Visual Services $0 0.00% $0 0.00% $0 0.00% $2,691 0.00% $52 0.00% $0 0.00%
Total $24,695,285 4.71% $25,960,911 4.78% $26,937,947 4.55% $28,602,075 4.53% $28,212,815 4.30% $27,289,244 3.88%
2012-132011-12 Estimated 2016-17University of Florida
2015-162014-15 2013-14

State University System
Education and General
Comparative Statement of University
Actual and Estimated Expenditures by Activity
Expenditures % of total Expenditures % of total Expenditures % of total Expenditures % of total Expenditures % of total Expenditures % of total
2012-132011-12 Estimated 2016-17University of Florida
2015-162014-15 2013-14
Museums & Galleries
Positions 112.28 104.27 102.94 105.31 109.75 109.21
Cost $9,632,067 1.84% $10,016,652 1.85% $10,861,608 1.83% $11,221,277 1.78% $11,705,296 1.78% $11,881,749 1.69%
Student Services
EEO/Minority Students
Positions 0.00 0.00 0.00 0.00 0.00 0.00
Cost $0 0.00% $0 0.00% $0 0.00% $0 0.00% $0 0.00% $0 0.00%
Financial Aid
Positions 56.76 50.56 51.41 51.87 51.83 49.62
Cost $11,263,809 2.15% $14,496,823 2.67% $14,575,433 2.46% $17,738,680 2.81% $17,408,278 2.65% $16,942,071 2.41%
Career Placement
Positions 20.00 18.92 19.00 19.00 22.09 20.76
Cost $1,431,763 0.27% $1,390,045 0.26% $1,448,649 0.24% $1,456,953 0.23% $1,655,185 0.25% $1,737,121 0.25%
Other Student Services
Positions 157.89 152.95 157.02 164.49 174.46 186.21
Cost $17,154,506 3.27% $15,393,705 2.84% $17,443,027 2.94% $16,581,285 2.63% $19,339,310 2.94% $18,540,289 2.63%
Summary Student Services
Total Positions 234.65 222.43 227.43 235.36 248.38 256.59
Total $29,850,078 5.69% $31,280,573 5.76% $33,467,109 5.65% $35,776,918 5.67% $38,402,773 5.85% $37,219,481 5.29%
Intercollegiate Athletics
Positions 0.00 0.00 0.00 0.00 0.00 0.00
E&G Cost - Title IX $0 0.00% $0 0.00% $0 0.00% $0 0.00% $0 0.00% $0 0.00%
E&G Cost - Other $395,549 0.08% $384,462 0.07% $384,462 0.06% $384,462 0.06% $384,462 0.06% $384,462 0.05%
Total Educational & General $524,595,506 100.00% $542,635,393 100.00% $592,526,145 100.00% $631,157,295 100.00% $656,695,189 100.00% $704,024,803 100.00%
Total Positions 4,458.42 4,404.00 4,459.41 4,663.77 4,809.45 4,662.94

State University System
Educational and General
Comparative Statement of University
Actual and Estimated Expenditures by Activity
Expenditures % of total Expenditures % of total Expenditures % of total Expenditures % of total Expenditures % of total Expenditures % of total
Instruction & Research
Positions 2,342.93 2,355.46 2,347.01 2,378.17 2,438.32 2,533.62
General Academic Instruction $184,462,967 51.41% $208,395,773 48.34% $224,066,218 49.66% $230,459,885 46.16% $241,275,015 48.14% $285,700,107 50.04%
Individual or Project Research $16,017,643 4.46% $22,515,376 5.22% $23,685,222 5.25% $24,996,121 5.01% $26,830,153 5.35% $25,094,772 4.40%
Public Service $682,364 0.19% $604,496 0.14% $631,383 0.14% $692,671 0.14% $741,845 0.15% $753,068 0.13%
Academic Advising $4,405,619 1.23% $4,775,726 1.11% $5,107,019 1.13% $5,140,372 1.03% $5,635,516 1.12% $5,912,418 1.04%
Computing Support $15,058,996 4.20% $26,127,648 6.06% $21,199,363 4.70% $19,844,016 3.97% $22,149,433 4.42% $18,399,272 3.22%
Academic Administration $16,988,455 4.74% $22,708,906 5.27% $23,944,067 5.31% $36,276,605 7.27% $26,149,599 5.22% $33,867,751 5.93%
Total $237,616,044 66.23% $285,127,925 66.14% $298,633,272 66.19% $317,409,670 63.57% $322,781,561 64.40% $369,727,388 64.76%
Academic Infrastructure Support Orgs.
Positions 0.00 0.00 0.00 0.00 0.00 0.00
Cost $0 0.00% $0 0.00% $0 0.00% $0 0.00% $0 0.00% $0 0.00%
Institutes & Research Centers
Positions 0.08 0 0 2.41 3.53 3.5
Cost $835,708 0.23% $901,199 0.21% $981,359 0.22% $1,563,034 0.31% $1,985,625 0.40% $1,885,842 0.33%
Plant Operations & Maintenance
Positions 574.50 587.50 596.50 600.91 599.91 599.91
Plant Administration $7,498,496 2.09% $7,866,855 1.82% $8,685,271 1.93% $8,921,784 1.79% $10,278,919 2.05% $9,395,604 1.65%
Utilities $22,431,695 6.25% $21,278,168 4.94% $22,937,836 5.08% $22,055,288 4.42% $23,213,499 4.63% $30,308,046 5.31%
Building Maintenance $11,146,570 3.11% $12,497,413 2.90% $13,559,796 3.01% $13,644,633 2.73% $14,944,568 2.98% $14,934,182 2.62%
Custodial Services $13,308,044 3.71% $14,559,003 3.38% $14,913,709 3.31% $15,774,080 3.16% $15,581,137 3.11% $17,001,032 2.98%
Total $54,384,805 15.16% $56,201,439 13.04% $60,096,612 13.32% $60,395,785 12.10% $64,018,123 12.77% $71,638,864 12.55%
Admin. Dir. & Support Services
Positions 374.85 380.51 394.31 425.38 435.14 498.65
General Administration $31,354,315 8.74% $35,282,352 8.18% $34,900,125 7.74% $50,594,317 10.13% $55,694,112 11.11% $64,959,231 11.38%
Radio/TV
Positions 19.62 19.38 21.09 22.62 22.64 23.64
Public Broadcasting Services $1,449,981 0.40% $1,666,296 0.39% $1,816,367 0.40% $1,853,153 0.37% $2,038,741 0.41% $2,135,301 0.37%
Library/Audio Visual
Positions 140.00 140.00 139.00 140.50 140.00 140.50
Libraries $15,094,791 4.21% $15,547,168 3.61% $15,605,514 3.46% $27,533,450 5.51% $13,999,507 2.79% $18,377,744 3.22%
Audio Visual Services $0 0.00% $0 0.00% $0 0.00% $0 0.00% $83 0.00% $0 0.00%
Total $15,094,791 4.21% $15,547,168 3.61% $15,605,514 3.46% $27,533,450 5.51% $13,999,590 2.79% $18,377,744 3.22%
Estimated 2016-172015-16 2014-15 2013-142012-13 2011-12Florida State University

State University System
Educational and General
Comparative Statement of University
Actual and Estimated Expenditures by Activity
Expenditures % of total Expenditures % of total Expenditures % of total Expenditures % of total Expenditures % of total Expenditures % of total
Estimated 2016-172015-16 2014-15 2013-142012-13 2011-12Florida State University
Museums & Galleries
Positions 39.30 41.50 40.83 39.50 39.25 39.25
Cost $2,333,870 0.65% $2,351,911 0.55% $2,749,984 0.61% $2,741,623 0.55% $2,877,123 0.57% $2,989,628 0.52%
Student Services
EEO/Minority Students
Positions 0.00 0.00 0.00 0.00 0.00 0.00
Cost $0 0.00% $0 0.00% $0 0.00% $0 0.00% $0 0.00% $0 0.00%
Financial Aid
Positions 23.85 22.63 23.63 23.63 25.06 25.06
Cost $4,146,782 1.16% $20,226,691 4.69% $20,598,020 4.57% $20,049,282 4.02% $20,526,180 4.10% $20,460,797 3.58%
Career Placement
Positions 20.00 22.00 22.00 24.00 27.05 27.05
Cost $1,136,426 0.32% $1,351,031 0.31% $1,555,544 0.34% $1,640,943 0.33% $1,792,947 0.36% $2,086,408 0.37%
Other Student Services
Positions 162.08 163.02 176.68 185.23 187.71 189.28
Cost $10,429,442 2.91% $12,460,438 2.89% $14,242,630 3.16% $15,527,074 3.11% $15,531,175 3.10% $16,657,130 2.92%
Summary Student Services
Total Positions 205.93 207.65 222.31 232.86 239.82 241.39
Total $15,712,650 4.38% $34,038,160 7.90% $36,396,194 8.07% $37,217,299 7.45% $37,850,302 7.55% $39,204,335 6.87%
Intercollegiate Athletics
Positions 0.00 0.00 0.00 0.00 0.00 0.00
E&G Cost - Title IX $0 0.00% $0 0.00% $0 0.00% $0 0.00% $0 0.00% $0 0.00%
E&G Cost - Other $0 0.00% $0 0.00% $0 0.00% $0 0.00% $0 0.00% $0 0.00%
Total Educational & General $358,782,164 100.00% $431,116,450 100.00% $451,179,427 100.00% $499,308,331 100.00% $501,245,177 100.00% $570,918,333 100.00%
Total Positions 3,697.21 3,732.00 3,761.05 3,842.35 3,918.61 4,080.46

State University System
Educational and General
Comparative Statement of University
Actual and Estimated Expenditures by Activity
Expenditures % of total Expenditures % of total Expenditures % of total Expenditures % of total Expenditures % of total Expenditures % of total
Instruction & Research
Positions 732.43 791.42 785.77 792.20 786.29 768.21
General Academic Instruction $67,412,489 46.91% $69,666,111 44.48% $72,518,664 42.84% $75,409,263 44.43% $69,592,177 41.68% $84,728,195 48.15%
Individual or Project Research $1,250,887 0.87% $1,209,966 0.77% $397,504 0.23% $430,858 0.25% $296,698 0.18% $259,477 0.15%
Public Service $846,339 0.59% $3,139,030 2.00% $4,733,713 2.80% $519,077 0.31% $316,013 0.19% $223,631 0.13%
Academic Advising $254,736 0.18% $737,406 0.47% $1,486,642 0.88% $1,733,279 1.02% $1,504,629 0.90% $1,594,779 0.91%
Computing Support $33,177 0.02% $18,013 0.01% $20,131 0.01% $33,957 0.02% $44,994 0.03% $65,000 0.04%
Academic Administration $13,923,840 9.69% $16,633,716 10.62% $17,401,607 10.28% $18,525,684 10.91% $20,422,538 12.23% $14,969,503 8.51%
Total $83,721,468 58.25% $91,404,242 58.36% $96,558,261 57.04% $96,652,118 56.95% $92,177,049 55.21% $101,840,585 57.87%
Academic Infrastructure Support Orgs.
Positions 0.00 0.00 0.00 0.00 0.00 0.00
Cost $0 0.00% $0 0.00% $0 0.00% $0 0.00% $0 0.00% $0 0.00%
Institutes & Research Centers
Positions 3.00 2.50 3.80 5.94 10.89 10.89
Cost $236,416 0.16% $298,132 0.19% $425,037 0.25% $696,533 0.41% $871,909 0.52% $1,266,212 0.72%
Plant Operations & Maintenance
Positions 193.50 195.50 193.50 192.50 193.00 193.00
Plant Administration $4,438,370 3.09% $4,255,287 2.72% $4,905,626 2.90% $4,946,945 2.91% $5,479,416 3.28% $5,031,335 2.86%
Utilities $7,894,267 5.49% $9,612,667 6.14% $8,697,477 5.14% $9,041,952 5.33% $9,548,677 5.72% $9,591,648 5.45%
Building Maintenance $1,963,880 1.37% $2,326,676 1.49% $5,111,762 3.02% $2,938,714 1.73% $2,621,838 1.57% $2,780,879 1.58%
Custodial Services $2,720,054 1.89% $2,954,653 1.89% $3,255,963 1.92% $3,180,710 1.87% $3,046,525 1.82% $3,206,720 1.82%
Total $17,016,571 11.84% $19,149,283 12.23% $21,970,828 12.98% $20,108,321 11.85% $20,696,456 12.40% $20,610,582 11.71%
Admin. Dir. & Support Services
Positions 225.17 231.26 234.63 232.52 236.74 237.42
General Administration $26,165,237 18.21% $27,370,987 17.48% $30,578,609 18.06% $30,783,217 18.14% $31,549,800 18.90% $32,519,374 18.48%
Radio/TV
Positions 0.00 0.00 0.00 0.00 0.00 0.00
Public Broadcasting Services $0 0.00% $0 0.00% $0 0.00% $0 0.00% $0 0.00% $0 0.00%
Library/Audio Visual
Positions 71.00 68.93 68.00 67.00 67.00 67.00
Libraries $5,469,947 3.81% $6,441,462 4.11% $6,820,172 4.03% $6,838,420 4.03% $6,974,965 4.18% $6,616,573 3.76%
Audio Visual Services $0 0.00% $0 0.00% $0 0.00% $0 0.00% $0 0.00% $0 0.00%
Total $5,469,947 3.81% $6,441,462 4.11% $6,820,172 4.03% $6,838,420 4.03% $6,974,965 4.18% $6,616,573 3.76%
2014-152013-142012-13Florida A&M University
2011-12 Estimated 2016-172015-16

State University System
Educational and General
Comparative Statement of University
Actual and Estimated Expenditures by Activity
Expenditures % of total Expenditures % of total Expenditures % of total Expenditures % of total Expenditures % of total Expenditures % of total
2014-152013-142012-13Florida A&M University
2011-12 Estimated 2016-172015-16
Museums & Galleries
Positions 2.00 2.00 2.00 2.00 3.00 3.00
Cost $146,962 0.10% $146,226 0.09% $158,514 0.09% $214,679 0.13% $295,757 0.18% $160,385 0.09%
Student Services
EEO/Minority Students
Positions 0.00 0.00 0.00 0.00 0.00 0.00
Cost $12,323 0.01% $13,670 0.01% $0 0.00% $0 0.00% $0 0.00% $0 0.00%
Financial Aid
Positions 20.00 17.00 17.00 17.26 16.64 16.64
Cost $8,478,361 5.90% $975,662 0.62% $7,395,845 4.37% $10,039,767 5.92% $9,328,143 5.59% $8,691,596 4.94%
Career Placement
Positions 5.00 5.00 5.00 5.00 5.09 5.09
Cost $294,842 0.21% $306,706 0.20% $227,603 0.13% $326,501 0.19% $332,339 0.20% $381,924 0.22%
Other Student Services
Positions 25.00 29.10 34.41 28.10 41.15 41.15
Cost $1,877,819 1.31% $10,169,576 6.49% $5,146,179 3.04% $2,642,118 1.56% $4,728,636 2.83% $3,892,869 2.21%
Summary Student Services
Total Positions 50.00 51.10 56.41 50.36 62.88 62.88
Total $10,663,345 7.42% $11,465,614 7.32% $12,769,627 7.54% $13,008,386 7.66% $14,389,118 8.62% $12,966,389 7.37%
Intercollegiate Athletics
Positions 4.22 4.22 5.31 6.35 0.00 0.00
E&G Cost - Title IX $298,680 0.21% $352,760 0.23% $669,609 0.40% $1,425,971 0.84% $0 0.00% $0 0.00%
E&G Cost - Other $0 0.00% $0 0.00% $0 0.00% $0 0.00% $0 0.00% $0 0.00%
Total Educational & General $143,718,626 100.00% $156,628,706 100.00% $169,281,048 100.40% $169,727,645 100.00% $166,955,054 100.00% $175,980,100 100.00%
Total Positions 1,281.32 1,346.93 1,349.42 1,348.87 1,359.80 1,342.40

State University System
Educational and General
Comparative Statement of University
Actual and Estimated Expenditures by Activity
Expenditures % of total Expenditures % of total Expenditures % of total Expenditures % of total Expenditures % of total Expenditures % of total
Instruction & Research
Positions 2,156.11 2,069.65 2,146.93 2,121.33 2,262.85 2,265.14
General Academic Instruction $159,932,101 44.23% $166,089,867 42.00% $186,717,496 46.25% $188,353,051 43.15% $197,650,311 41.51% $214,418,465 40.66%
Individual or Project Research $18,095,454 5.00% $19,249,144 4.87% $17,493,585 4.33% $14,418,906 3.30% $16,845,199 3.54% $13,823,050 2.62%
Public Service $0 0.00% $107,784 0.03% $85,699 0.02% $89,133 0.02% $113,865 0.02% $0 0.00%
Academic Advising $6,948,911 1.92% $7,113,582 1.80% $7,795,057 1.93% $7,851,697 1.80% $8,300,005 1.74% $8,680,118 1.65%
Computing Support $12,705,132 3.51% $13,762,263 3.48% $13,708,425 3.40% $18,464,035 4.23% $23,879,018 5.01% $24,887,368 4.72%
Academic Administration $61,987,940 17.14% $80,913,849 20.46% $74,648,266 18.49% $77,638,512 17.79% $80,637,690 16.93% $95,429,182 18.10%
Total $259,669,538 71.81% $287,236,489 72.64% $300,448,528 74.43% $306,815,334 70.30% $327,426,088 68.76% $357,238,183 67.74%
Academic Infrastructure Support Orgs.
Positions 7.00 22.95 23.51 24.20 23.70 24.75
Cost $875,239 0.24% $1,916,122 0.48% $1,914,750 0.47% $2,493,191 0.57% $3,062,345 0.64% $3,327,290 0.63%
Institutes & Research Centers
Positions 6.67 12.07 10.88 10.18 21.96 20.98
Cost $3,543,080 0.98% $2,159,392 0.55% $2,335,710 0.58% $3,628,475 0.83% $3,730,843 0.78% $2,748,019 0.52%
Plant Operations & Maintenance
Positions 321.28 361.02 370.59 359.05 358.32 342.85
Plant Administration $2,906,508 0.80% $3,113,305 0.79% $3,279,473 0.81% $3,186,599 0.73% $2,992,638 0.63% $2,949,620 0.56%
Utilities $17,590,378 4.86% $18,063,842 4.57% $18,049,260 4.47% $18,539,690 4.25% $18,880,538 3.96% $19,364,744 3.67%
Building Maintenance $13,027,012 3.60% $11,305,194 2.86% $8,727,778 2.16% $11,542,981 2.64% $20,070,956 4.21% $5,614,962 1.06%
Custodial Services $1,839,119 0.51% $9,133,649 2.31% $10,064,353 2.49% $10,919,687 2.50% $10,850,122 2.28% $11,458,225 2.17%
Total $35,363,017 9.78% $41,615,990 10.52% $40,120,864 9.94% $44,188,957 10.12% $52,794,254 11.09% $39,387,551 7.47%
Admin. Dir. & Support Services
Positions 391.51 331.12 355.1 349.2 389.37 460.19
General Administration $26,751,015 7.40% $32,410,560 8.20% $30,748,642 7.62% $36,591,191 8.38% $43,525,885 9.14% $76,919,730 14.59%
Radio/TV
Positions 13.46 13.12 13.05 12.60 11.95 11.95
Public Broadcasting Services $945,518 0.26% $881,236 0.22% $927,112 0.23% $948,298 0.22% $936,350 0.20% $956,627 0.18%
Library/Audio Visual
Positions 118.02 114.52 113.81 120.45 118.43 117.43
Libraries $13,822,586 3.82% $10,184,284 2.58% $14,109,629 3.50% $14,223,561 3.26% $14,978,164 3.15% $15,734,515 2.98%
Audio Visual Services $214,323 0.06% $227,683 0.06% $199,055 0.05% $11,486 0.00% $0 0.00% $0 0.00%
Total $14,036,909 3.88% $10,411,967 2.63% $14,308,684 3.54% $14,235,047 3.26% $14,978,164 3.15% $15,734,515 2.98%
2013-142012-13 2011-12 2015-16 Estimated 2016-172014-15University of South Florida

State University System
Educational and General
Comparative Statement of University
Actual and Estimated Expenditures by Activity
Expenditures % of total Expenditures % of total Expenditures % of total Expenditures % of total Expenditures % of total Expenditures % of total
2013-142012-13 2011-12 2015-16 Estimated 2016-172014-15University of South Florida
Museums & Galleries
Positions 7.00 7.00 7.00 7.00 7.00 7.00
Cost $738,589 0.20% $708,774 0.18% $691,820 0.17% $792,459 0.18% $801,886 0.17% $718,172 0.14%
Student Services
EEO/Minority Students
Positions 5.30 1.00 1.00 1.00 4.10 9.00
Cost $818,180 0.23% $405,561 0.10% $107,610 0.03% $353,781 0.08% $694,793 0.15% $803,887 0.15%
Financial Aid
Positions 33.94 41.94 37.94 36.94 42.00 41.00
Cost $9,409,873 2.60% $9,336,438 2.36% $4,273,349 1.06% $16,925,382 3.88% $18,101,771 3.80% $19,232,553 3.65%
Career Placement
Positions 17.00 15.22 5.97 19.97 17.97 21.77
Cost $945,382 0.26% $1,120,251 0.28% $918,018 0.23% $1,084,288 0.25% $1,250,557 0.26% $1,573,514 0.30%
Other Student Services
Positions 70.10 46.39 63.16 59.70 62.85 65.17
Cost $8,163,165 2.26% $5,919,072 1.50% $6,255,767 1.55% $7,797,108 1.79% $8,287,538 1.74% $8,075,615 1.53%
Summary Student Services
Total Positions 126.34 104.55 108.07 117.61 126.92 136.94
Total $19,336,600 5.35% $16,781,322 4.24% $11,554,744 2.86% $26,160,559 5.99% $28,334,659 5.95% $29,685,569 5.63%
Intercollegiate Athletics
Positions 6.00 6.00 6.00 3.00 3.66 3.27
E&G Cost - Title IX $368,234 0.10% $357,137 0.09% $324,935 0.08% $342,243 0.08% $355,390 0.07% $372,127 0.07%
E&G Cost - Other $0 0.00% $935,181 0.24% $300,043 0.07% $270,210 0.06% $258,977 0.05% $270,210 0.05%
Total Educational & General $361,627,739 100.00% $395,414,170 100.00% $403,675,832 100.00% $436,465,964 100.00% $476,204,841 100.00% $527,357,993 100.00%
Total Positions 3,153.39 3,042.00 3,154.94 3,124.62 3,324.16 3,390.50

State University System
Educational and General
Comparative Statement of University
Actual and Estimated Expenditures by Activity
Expenditures % of total Expenditures % of total Expenditures % of total Expenditures % of total Expenditures % of total Expenditures % of total Expenditures % of total
Instruction & Research
Positions 1,713.11 1,805.36 1,629.61 1,718.32 1,574.39 1,542.65 1,509.96
General Academic Instruction $126,891,110 51.07% $123,971,654 51.87% $124,866,576 49.86% $121,004,050 48.52% $123,326,263 47.99% $126,666,958 47.82% $153,752,269 49.40%
Individual or Project Research $6,185,732 2.49% $6,078,486 2.54% $5,135,384 2.05% $4,040,915 1.62% $1,869,353 0.73% $2,899,707 1.09% $2,965,011 0.95%
Public Service $448,766 0.18% $219,475 0.09% $153,121 0.06% $169,819 0.07% $183,376 0.07% $656,435 0.25% $378,506 0.12%
Academic Advising $2,458,766 0.99% $2,466,735 1.03% $2,450,498 0.98% $2,729,918 1.09% $3,004,032 1.17% $3,424,347 1.29% $3,736,365 1.20%
Computing Support $8,701,317 3.50% $8,756,027 3.66% $7,911,907 3.16% $10,391,722 4.17% $11,437,269 4.45% $9,230,920 3.49% $8,133,352 2.61%
Academic Administration $14,553,154 5.86% $15,726,116 6.58% $18,685,072 7.46% $19,439,986 7.79% $15,431,099 6.00% $16,466,580 6.22% $17,322,979 5.57%
Total $159,238,845 64.08% $157,218,493 65.79% $159,202,558 63.57% $157,776,410 63.26% $155,251,392 60.41% $159,344,947 60.16% $186,288,482 59.86%
Academic Infrastructure Support Orgs.
Positions 0.00 0.00 0.00 0.00 0.00 11.35 11.35
Cost $0 0.00% $0 0.00% $0 0.00% $0 0.00% $0 0.00% $729,383 0.28% $592,750 0.19%
Institutes & Research Centers
Positions 8.20 7.68 7.47 6.10 89.72 159.70 248.73
Cost $867,433 0.35% $442,647 0.19% $625,638 0.25% $636,153 0.26% $13,540,573 5.27% $14,707,475 5.55% $15,118,127 4.86%
Plant Operations & Maintenance
Positions 292.85 261.90 209.65 217.30 281.96 134.75 100.75
Plant Administration $1,496,456 0.60% $702,201 0.29% $3,121,340 1.25% $3,916,537 1.57% $1,597,808 0.62% $2,873,368 1.08% $2,843,638 0.91%
Utilities $13,216,124 5.32% $10,055,705 4.21% $13,463,741 5.38% $13,738,150 5.51% $12,697,762 4.94% $11,861,408 4.48% $11,487,983 3.69%
Building Maintenance $3,282,044 1.32% $3,802,647 1.59% $3,918,473 1.56% $3,924,357 1.57% $2,883,132 1.12% $3,129,544 1.18% $3,331,821 1.07%
Custodial Services $4,463,538 1.80% $4,525,590 1.89% $4,367,913 1.74% $4,087,343 1.64% $4,261,062 1.66% $3,059,531 1.16% $3,050,057 0.98%
Total $22,458,162 9.04% $19,086,143 7.99% $24,871,467 9.93% $25,666,387 10.29% $21,439,764 8.34% $20,923,851 7.90% $20,713,499 6.66%
Admin. Dir. & Support Services
Positions 411.08 384.18 316.1 311.43 321.99 438.18 372.04
General Administration $32,055,748 12.90% $27,936,139 11.69% $29,657,315 11.84% $29,053,407 11.65% $31,216,233 12.15% $33,047,819 12.48% $54,748,132 17.59%
Radio/TV
Positions 0.00 0.00 0.00 0.00 0.00 0.00 0.00
Public Broadcasting Services $0 0.00% $0 0.00% $0 0.00% $0 0.00% $0 0.00% $0 0.00% $0 0.00%
Library/Audio Visual
Positions 210.47 141.57 134.27 125.66 122.16 102.34 107.34
Libraries $10,742,046 4.32% $11,019,709 4.61% $10,646,369 4.25% $10,375,044 4.16% $10,092,433 3.93% $10,469,268 3.95% $10,066,051 3.23%
Audio Visual Services $421,053 0.17% $361,612 0.15% $240,652 0.10% $235,998 0.09% $225,441 0.09% $223,507 0.08% $0 0.00%
Total $11,163,099 4.49% $11,381,321 4.76% $10,887,021 4.35% $10,611,042 4.25% $10,317,874 4.02% $10,692,775 4.04% $10,066,051 3.23%
Estimated 2016-172010-11 2014-15 2013-142012-13 2011-12 2015-16Florida Atlantic University

State University System
Educational and General
Comparative Statement of University
Actual and Estimated Expenditures by Activity
Expenditures % of total Expenditures % of total Expenditures % of total Expenditures % of total Expenditures % of total Expenditures % of total Expenditures % of total
Estimated 2016-172010-11 2014-15 2013-142012-13 2011-12 2015-16Florida Atlantic University
Museums & Galleries
Positions 0.00 0.00 0.00 0.00 0.00 0.00 0.00
Cost $0 0.00% $0 0.00% $0 0.00% $0 0.00% $0 0.00% $0 0.00% $0 0.00%
Student Services
EEO/Minority Students
Positions 5.00 5.00 3.00 3.00 3.00 4.35 4.35
Cost $324,148 0.13% $261,077 0.11% $238,739 0.10% $243,229 0.10% $269,256 0.10% $196,324 0.07% $199,151 0.06%
Financial Aid
Positions 26.04 21.55 21.01 20.76 21.50 22.36 27.31
Cost $12,361,011 4.97% $13,149,548 5.50% $15,319,369 6.12% $15,985,337 6.41% $15,605,392 6.07% $14,854,451 5.61% $9,465,553 3.04%
Career Placement
Positions 11.78 12.88 12.35 12.35 13.03 15.48 37.48
Cost $658,105 0.26% $768,710 0.32% $773,818 0.31% $762,013 0.31% $812,777 0.32% $840,934 0.32% $1,076,757 0.35%
Other Student Services
Positions 184.20 174.69 146.28 153.05 140.23 136.84 148.69
Cost $9,127,391 3.67% $8,511,426 3.56% $8,626,118 3.44% $8,427,224 3.38% $8,294,124 3.23% $9,306,372 3.51% $12,726,731 4.09%
Summary Student Services
Total Positions 227.02 214.12 182.64 189.16 177.76 179.03 217.83
Total $22,470,655 9.04% $22,690,761 9.49% $24,958,044 9.97% $25,417,803 10.19% $24,981,549 9.72% $25,198,081 9.51% $23,468,192 7.54%
Intercollegiate Athletics
Positions 0.00 0.00 0.00 0.00 0.00 0.00 0.00
E&G Cost - Title IX $174,090 0.07% $174,090 0.07% $174,090 0.07% $174,090 0.07% $174,090 0.07% $174,090 0.07% $174,090 0.06%
E&G Cost - Other $56,156 0.02% $56,156 0.02% $56,156 0.02% $56,156 0.02% $56,156 0.02% $56,156 0.02% $56,156 0.02%
Total Educational & General $248,484,188 100.00% $238,985,750 100.00% $250,432,289 100.00% $249,391,448 100.00% $256,977,631 100.00% $264,874,577 100.00% $311,225,479 100.00%
Total Positions 2,862.73 2,814.81 2,479.74 2,567.97 2,567.98 2,568.00 2,568.00

State University System
Educational and General
Comparative Statement of University
Actual and Estimated Expenditures by Activity
Expenditures % of total Expenditures % of total Expenditures % of total Expenditures % of total Expenditures % of total Expenditures % of total
Instruction & Research
Positions 489.11 484.85 494.09 463.34 663.02 506.65
General Academic Instruction $40,351,744 48.53% $43,801,347 43.69% $43,338,930 40.65% $42,475,111 29.98% $45,216,706 30.06% $46,269,856 29.71%
Individual or Project Research $12,277 0.01% $32,273 0.03% $178,220 0.17% $245,430 0.17% $356,540 0.24% $350,405 0.23%
Public Service $1,046,003 1.26% $1,411,729 1.41% $4,032,736 3.78% $159,008 0.11% $300,197 0.20% $846,451 0.54%
Academic Advising $450,424 0.54% $483,525 0.48% $536,112 0.50% $717,082 0.51% $744,625 0.49% $787,651 0.51%
Computing Support $3,975,682 4.78% $4,710,541 4.70% $5,051,350 4.74% $5,541,742 3.91% $5,123,061 3.41% $5,330,222 3.42%
Academic Administration $3,389,626 4.08% $8,703,105 8.68% $7,996,396 7.50% $8,916,281 6.29% $10,880,130 7.23% $12,007,657 7.71%
Total $49,225,756 59.20% $59,142,520 58.99% $61,133,744 57.35% $58,054,654 40.98% $62,621,259 41.63% $65,592,242 42.12%
Academic Infrastructure Support Orgs.
Positions 0.00 0.00 0.00 0.00 0.00 0.00
Cost $0 0.00% $0 0.00% $0 0.00% $0 0.00% $0 0.00% $0 0.00%
Institutes & Research Centers
Positions 8.33 8.33 8.34 72.76 31.01 206.85
Cost $714,529 0.86% $822,791 0.82% $4,530,578 4.25% $41,272,179 29.13% $46,223,703 30.73% $48,879,636 31.39%
Plant Operations & Maintenance
Positions 116.41 113.00 112.00 112.00 112.00 112.00
Plant Administration $1,622,168 1.95% $1,503,823 1.50% $1,642,834 1.54% $1,746,729 1.23% $1,584,116 1.05% $1,736,528 1.12%
Utilities $4,186,635 5.04% $4,221,127 4.21% $4,304,294 4.04% $4,212,673 2.97% $4,162,519 2.77% $5,263,506 3.38%
Building Maintenance $1,753,635 2.11% $1,784,906 1.78% $2,780,987 2.61% $1,888,555 1.33% $2,533,514 1.68% $1,176,607 0.76%
Custodial Services $2,518,810 3.03% $2,543,311 2.54% $2,566,622 2.41% $2,693,769 1.90% $2,680,033 1.78% $2,786,098 1.79%
Total $10,081,248 12.12% $10,053,167 10.03% $11,294,737 10.59% $10,541,726 7.44% $10,960,182 7.29% $10,962,739 7.04%
Admin. Dir. & Support Services
Positions 144.49 147.42 154.21 138.84 136.25 143.11
General Administration $12,719,166 15.30% $16,344,356 16.30% $14,450,018 13.55% $16,152,232 11.40% $14,820,345 9.85% $15,123,518 9.71%
Radio/TV
Positions 6.67 6.67 6.67 8.17 6.51 8.01
Public Broadcasting Services $458,536 0.55% $459,666 0.46% $488,311 0.46% $662,675 0.47% $674,269 0.45% $671,176 0.43%
Library/Audio Visual
Positions 41.00 38.00 37.00 35.74 35.74 35.74
Libraries $3,045,394 3.66% $3,666,847 3.66% $3,697,323 3.47% $3,650,767 2.58% $3,806,141 2.53% $4,051,034 2.60%
Audio Visual Services $0 0.00% $0 0.00% $0 0.00% $0 0.00% $0 0.00% $0 0.00%
Total $3,045,394 3.66% $3,666,847 3.66% $3,697,323 3.47% $3,650,767 2.58% $3,806,141 2.53% $4,051,034 2.60%
Estimated 2016-172014-15 2013-142012-13 2011-12 2015-16University of West Florida

State University System
Educational and General
Comparative Statement of University
Actual and Estimated Expenditures by Activity
Expenditures % of total Expenditures % of total Expenditures % of total Expenditures % of total Expenditures % of total Expenditures % of total
Estimated 2016-172014-15 2013-142012-13 2011-12 2015-16University of West Florida
Museums & Galleries
Positions 0.00 0.00 0.00 0.00 0.00 0.00
Cost $0 0.00% $0 0.00% $0 0.00% $0 0.00% $0 0.00% $0 0.00%
Student Services
EEO/Minority Students
Positions 15.00 14.00 19.00 19.00 21.00 18.00
Cost $345,022 0.41% $586,079 0.58% $660,714 0.62% $679,491 0.48% $679,873 0.45% $626,692 0.40%
Financial Aid
Positions 10.00 9.58 8.75 9.78 8.77 7.77
Cost $2,505,639 3.01% $3,621,496 3.61% $3,706,290 3.48% $3,659,262 2.58% $3,574,543 2.38% $3,724,419 2.39%
Career Placement
Positions 8.00 9.00 9.00 9.00 10.00 10.44
Cost $398,270 0.48% $466,875 0.47% $483,778 0.45% $523,433 0.37% $531,404 0.35% $658,687 0.42%
Other Student Services
Positions 37.67 40.67 40.98 47.30 47.23 57.50
Cost $3,646,594 4.39% $5,088,614 5.08% $6,156,195 5.77% $6,457,746 4.56% $6,540,469 4.35% $5,430,147 3.49%
Summary Student Services
Total Positions 70.67 73.25 77.73 85.08 87.00 93.71
Total $6,895,525 8.29% $9,763,064 9.74% $11,006,977 10.32% $11,319,932 7.99% $11,326,289 7.53% $10,439,945 6.70%
Intercollegiate Athletics
Positions 0.00 0.00 0.00 0.00 0.00 0.00
E&G Cost - Title IX $0 0.00% $0 0.00% $0 0.00% $0 0.00% $0 0.00% $0 0.00%
E&G Cost - Other $4,921 0.01% $4,921 0.01% $4,921 0.00% $4,921 0.00% $4,921 0.00% $4,921 0.00%
Total Educational & General $83,145,075 100.00% $100,257,332 100.00% $106,606,609 100.00% $141,659,086 100.00% $150,437,109 100.00% $155,725,211 100.00%
Total Positions 876.68 871.52 890.04 915.93 1,071.53 1,106.07

State University System
Educational and General
Comparative Statement of University
Actual and Estimated Expenditures by Activity
Expenditures % of total Expenditures % of total Expenditures % of total Expenditures % of total Expenditures % of total Expenditures % of total
Instruction & Research
Positions 2,486.37 2,517.76 2,459.32 2,469.76 2,539.22 2,551.99
General Academic Instruction $191,620,779 51.54% $205,244,928 44.50% $241,110,825 49.00% $241,110,825 46.85% $264,135,809 46.26% $307,787,005 52.19%
Individual or Project Research $18,316,116 4.93% $25,455,889 5.52% $22,489,576 4.57% $24,263,502 4.71% $27,988,870 4.90% $27,525,099 4.67%
Public Service $377,817 0.10% $254,230 0.06% $164,300 0.03% $50,253 0.01% $103,905 0.02% $85,655 0.01%
Academic Advising $12,403,881 3.34% $11,741,257 2.55% $11,510,334 2.34% $12,476,278 2.42% $12,777,128 2.24% $12,782,988 2.17%
Computing Support $7,315,275 1.97% $7,345,372 1.59% $7,572,854 1.54% $8,322,678 1.62% $9,270,251 1.62% $9,728,499 1.65%
Academic Administration $16,771,526 4.51% $24,641,796 5.34% $27,175,715 5.52% $30,562,934 5.94% $23,529,515 4.12% $46,127,226 7.82%
Total $246,805,394 66.38% $274,683,472 59.55% $310,023,604 63.01% $316,786,470 61.56% $337,805,478 59.17% $404,036,472 68.51%
Academic Infrastructure Support Orgs.
Positions 0.00 0.00 0.00 0.00 0.00 0.00
Cost $0 0.00% $0 0.00% $0 0.00% $0 0.00% $0 0.00% $0 0.00%
Institutes & Research Centers
Positions 42.90 43.50 43.50 44.50 39.50 20.00
Cost $3,028,865 0.81% $3,345,519 0.73% $2,951,828 0.60% $3,203,788 0.62% $3,478,755 0.61% $3,147,046 0.53%
Plant Operations & Maintenance
Positions 432.50 409.50 400.50 412.50 410.90 413.90
Plant Administration $12,196,824 3.28% $37,713,918 8.18% $30,224,050 6.14% $22,083,434 4.29% $50,954,914 8.92% $20,781,573 3.52%
Utilities $10,348,196 2.78% $22,876,901 4.96% $14,379,078 2.92% $14,706,516 2.86% $14,712,603 2.58% $14,803,608 2.51%
Building Maintenance $2,036,059 0.55% $3,162,468 0.69% $2,330,325 0.47% $3,137,673 0.61% $4,517,694 0.79% $148,641 0.03%
Custodial Services $4,076,908 1.10% $4,520,742 0.98% $8,765,695 1.78% $10,634,455 2.07% $11,510,194 2.02% $11,257,399 1.91%
Total $28,657,987 7.71% $68,274,029 14.80% $55,699,148 11.32% $50,562,078 9.83% $81,695,405 14.31% $46,991,221 7.97%
Admin. Dir. & Support Services
Positions 527.28 490.48 504.61 518.82 585.14 672.98
General Administration $48,181,160 12.96% $58,512,010 12.69% $60,046,242 12.20% $73,825,533 14.35% $77,833,766 13.63% $63,346,279 10.74%
Radio/TV
Positions 0.00 1.00 21.00 30.00 29.00 28.00
Public Broadcasting Services $801,448 0.22% $3,079,580 0.67% $2,750,732 0.56% $2,095,050 0.41% $1,902,127 0.33% $2,012,186 0.34%
Library/Audio Visual
Positions 153.33 151.33 146.83 145.83 132.83 129.83
Libraries $11,308,847 3.04% $11,966,355 2.59% $12,835,004 2.61% $13,360,697 2.60% $14,259,982 2.50% $14,933,183 2.53%
Audio Visual Services $1,169,758 0.31% ($615) 0.00% $1,306,735 0.27% $199,457 0.04% $6,060 0.00% $20,000 0.00%
Total $12,478,605 3.36% $11,965,740 2.59% $14,141,739 2.87% $13,560,154 2.63% $14,266,042 2.50% $14,953,183 2.54%
2012-13 2011-12 2015-16 Estimated 2016-17University of Central Florida
2014-152013-14

State University System
Educational and General
Comparative Statement of University
Actual and Estimated Expenditures by Activity
Expenditures % of total Expenditures % of total Expenditures % of total Expenditures % of total Expenditures % of total Expenditures % of total
2012-13 2011-12 2015-16 Estimated 2016-17University of Central Florida
2014-152013-14
Museums & Galleries
Positions 0.00 0.00 0.00 0.00 0.00 0.00
Cost $0 0.00% $0 0.00% $0 0.00% $0 0.00% $0 0.00% $0 0.00%
Student Services
EEO/Minority Students
Positions 0.00 0.00 0.00 0.00 0.00 0.00
Cost $0 0.00% $0 0.00% $0 0.00% $0 0.00% $0 0.00% $0 0.00%
Financial Aid
Positions 35.00 35.00 35.00 36.00 35.00 35.00
Cost $19,435,955 5.23% $26,872,668 5.83% $31,479,880 6.40% $36,568,297 7.11% $37,037,835 6.49% $37,422,351 6.35%
Career Placement
Positions 31.50 30.50 30.50 29.50 24.00 24.00
Cost $1,757,526 0.47% $1,208,265 0.26% $1,287,005 0.26% $1,321,263 0.26% $1,410,423 0.25% $1,537,511 0.26%
Other Student Services
Positions 137.00 135.00 186.00 187.92 191.36 186.78
Cost $10,383,786 2.79% $13,289,640 2.88% $13,655,867 2.78% $16,695,769 3.24% $15,501,376 2.72% $16,277,710 2.76%
Summary Student Services
Total Positions 203.50 200.50 251.50 253.42 250.36 245.78
Total $31,577,267 8.49% $41,370,573 8.97% $46,422,752 9.43% $54,585,329 10.61% $53,949,634 9.45% $55,237,572 9.37%
Intercollegiate Athletics
Positions 0.00 0.00 0.00 0.00 0.00 0.00
E&G Cost - Title IX $268,359 0.07% $268,359 0.06% $268,359 0.05% $268,359 0.05% $598,359 0.10% $598,359 0.10%
E&G Cost - Other $0 0.00% $0 0.00% $0 0.00% $0 0.00% $0 0.00% $0 0.00%
Total Educational & General $371,799,085 100.00% $461,230,923 100.06% $492,036,045 100.00% $514,618,402 100.05% $570,931,207 100.10% $589,723,959 100.00%
Total Positions 3,845.88 3,814.07 3,827.26 3,874.83 3,986.95 4,062.48

State University System
Educational and General
Comparative Statement of University
Actual and Estimated Expenditures by Activity
Expenditures % of total Expenditures % of total Expenditures % of total Expenditures % of total Expenditures % of total Expenditures % of total
Instruction & Research
Positions 2,124.29 2,211.99 2,249.98 2,396.84 2,451.99 2,435.04
General Academic Instruction $148,033,644 43.46% $160,173,575 41.24% $172,957,350 42.34% $176,313,025 41.60% $183,330,403 42.07% $218,407,750 45.77%
Individual or Project Research $7,055,430 2.07% $8,896,076 2.29% $7,743,766 1.90% $11,510,456 2.72% $15,162,263 3.48% $14,792,161 3.10%
Public Service $22,331 0.01% $343,643 0.09% $755,398 0.18% $714,327 0.17% $732,191 0.17% $569,854 0.12%
Academic Advising $1,339,934 0.39% $1,773,435 0.46% $1,141,317 0.28% $2,964,646 0.70% $2,840,973 0.65% $2,788,775 0.58%
Computing Support $9,230,731 2.71% $10,171,488 2.62% $9,109,004 2.23% $11,726,389 2.77% $11,503,887 2.64% $11,838,160 2.48%
Academic Administration $43,801,821 12.86% $48,856,505 12.58% $54,224,585 13.27% $51,445,631 12.14% $52,225,924 11.98% $59,176,565 12.40%
Total $209,483,891 61.50% $230,214,722 59.28% $245,931,420 60.21% $254,674,474 60.09% $265,795,641 60.99% $307,573,265 64.46%
Academic Infrastructure Support Orgs.
Positions 0.00 0.00 0.00 0.00 0.00 0.00
Cost $0 0.00% $0 0.00% $0 0.00% $0 0.00% $0 0.00% $0 0.00%
Institutes & Research Centers
Positions 98.29 116.6 109.51 116.09 141.00 144.40
Cost $4,429,606 1.30% $6,211,151 1.60% $6,402,916 1.57% $6,180,644 1.46% $6,792,079 1.56% $6,290,010 1.32%
Plant Operations & Maintenance
Positions 357.25 361.59 377.70 383.30 378.80 378.30
Plant Administration $3,997,096 1.17% $4,421,584 1.14% $5,256,875 1.29% $5,944,653 1.40% $5,758,701 1.32% $5,503,016 1.15%
Utilities $13,257,971 3.89% $3,361,689 0.87% $14,374,939 3.52% $15,872,656 3.75% $15,578,761 3.57% $16,622,426 3.48%
Building Maintenance $8,310,662 2.44% $32,478,267 8.36% $14,943,382 3.66% $16,686,400 3.94% $13,670,996 3.14% $10,840,854 2.27%
Custodial Services $8,902,267 2.61% $6,869,302 1.77% $7,833,478 1.92% $10,554,006 2.49% $10,359,757 2.38% $11,350,710 2.38%
Total $34,467,996 10.12% $47,130,842 12.14% $42,408,674 10.38% $49,057,715 11.58% $45,368,215 10.41% $44,317,006 9.29%
Admin. Dir. & Support Services
Positions 510.63 535.83 525.4 506.91 525.93 509.80
General Administration $39,656,501 11.64% $45,297,225 11.66% $47,550,881 11.64% $45,922,308 10.84% $49,494,681 11.36% $49,118,595 10.29%
Radio/TV
Positions 0.00 0.00 0.00 0.00 0.00 0.00
Public Broadcasting Services $0 0.00% $0 0.00% $0 0.00% $0 0.00% $0 0.00% $0 0.00%
Library/Audio Visual
Positions 162.58 170.86 180.86 185.86 172.29 179.36
Libraries $15,346,715 4.51% $15,753,024 4.06% $16,758,939 4.10% $17,360,450 4.10% $17,557,769 4.03% $17,724,777 3.71%
Audio Visual Services $2,101,185 0.62% $2,041,016 0.53% $2,024,075 0.50% $2,022,861 0.48% $2,100,104 0.48% $2,305,881 0.48%
Total $17,447,900 5.12% $17,794,040 4.58% $18,783,014 4.60% $19,383,311 4.57% $19,657,873 4.51% $20,030,658 4.20%
Estimated 2016-172015-16 2014-15 2013-142012-13 2011-12Florida International University

State University System
Educational and General
Comparative Statement of University
Actual and Estimated Expenditures by Activity
Expenditures % of total Expenditures % of total Expenditures % of total Expenditures % of total Expenditures % of total Expenditures % of total
Estimated 2016-172015-16 2014-15 2013-142012-13 2011-12Florida International University
Museums & Galleries
Positions 53.75 53.50 54.00 53.50 43.75 49.90
Cost $3,223,680 0.95% $3,205,731 0.83% $3,261,740 0.80% $3,261,782 0.77% $3,759,370 0.86% $3,718,841 0.78%
Student Services
EEO/Minority Students
Positions 10.00 9.00 8.30 8.50 8.50 8.50
Cost $561,942 0.16% $506,270 0.13% $592,494 0.15% $543,887 0.13% $538,768 0.12% $585,756 0.12%
Financial Aid
Positions 15.00 18.00 17.90 19.00 11.00 11.00
Cost $19,209,890 5.64% $23,130,613 5.96% $29,775,768 7.29% $30,425,518 7.18% $27,976,372 6.42% $28,666,677 6.01%
Career Placement
Positions 19.00 20.00 20.00 20.00 20.00 20.00
Cost $1,043,844 0.31% $953,695 0.25% $958,484 0.23% $1,066,636 0.25% $1,115,748 0.26% $1,253,430 0.26%
Other Student Services
Positions 166.00 178.99 182.49 195.26 204.01 206.44
Cost $10,619,931 3.12% $13,438,965 3.46% $12,331,242 3.02% $12,801,359 3.02% $14,802,363 3.40% $15,130,919 3.17%
Summary Student Services
Total Positions 210.00 225.99 228.69 242.76 243.51 245.94
Total $31,435,607 9.23% $38,029,543 9.79% $43,657,988 10.69% $44,837,400 10.58% $44,433,251 10.20% $45,636,782 9.56%
Intercollegiate Athletics
Positions 0.00 0.00 0.00 0.00 0.00 0.00
E&G Cost - Title IX $481,205 0.14% $481,205 0.12% $481,205 0.12% $481,205 0.11% $481,205 0.11% $481,205 0.10%
E&G Cost - Other $0 0.00% $0 0.00% $0 0.00% $0 0.00% $0 0.00% $0 0.00%
Total Educational & General $340,626,386 100.00% $388,364,459 100.00% $408,477,838 100.00% $423,798,839 100.00% $435,782,315 100.00% $477,166,362 100.00%
Total Positions 3,516.79 3,676.36 3,726.14 3,885.26 3,957.27 3,942.74

State University System
Educational and General
Comparative Statement of University
Actual and Estimated Expenditures by Activity
Expenditures % of total Expenditures % of total Expenditures % of total Expenditures % of total Expenditures % of total Expenditures % of total
Instruction & Research
Positions 726.53 714.55 714.55 708.41 715.12 729.01
General Academic Instruction $60,032,835 48.42% $61,486,451 46.19% $64,475,095 45.69% $70,299,052 45.57% $73,432,821 46.87% $73,756,956 47.45%
Individual or Project Research $209,513 0.17% $323,674 0.24% $352,322 0.25% $444,338 0.29% $751,505 0.48% $599,014 0.39%
Public Service $160,412 0.13% $542,769 0.41% $555,821 0.39% $992,770 0.64% $1,694,001 1.08% $147,571 0.09%
Academic Advising $1,656,037 1.34% $1,782,083 1.34% $1,896,851 1.34% $2,048,797 1.33% $2,533,805 1.62% $2,550,359 1.64%
Computing Support $2,703,274 2.18% $2,827,998 2.12% $2,966,382 2.10% $3,374,080 2.19% $4,636,685 2.96% $4,955,582 3.19%
Academic Administration $8,154,867 6.58% $9,449,077 7.10% $9,992,138 7.08% $10,736,371 6.96% $10,671,005 6.81% $10,014,838 6.44%
Total $72,916,938 58.82% $76,412,052 57.40% $80,238,609 56.86% $87,895,408 56.98% $93,719,822 59.82% $92,024,320 59.21%
Academic Infrastructure Support Orgs.
Positions 0.00 0.00 0.00 0.00 0.00 0.00
Cost $0 0.00% $0 0.00% $0 0.00% $0 0.00% $0 0.00% $0 0.00%
Institutes & Research Centers
Positions 9.70 9.92 9.92 10.51 9.79 10.08
Cost $1,073,561 0.87% $1,308,155 0.98% $1,410,613 1.00% $1,298,805 0.84% $1,160,436 0.74% $1,150,667 0.74%
Plant Operations & Maintenance
Positions 219.20 218.20 218.20 217.80 219.14 226.14
Plant Administration $1,475,143 1.19% $2,031,665 1.53% $2,622,485 1.86% $1,436,469 0.93% $2,211,486 1.41% $10,669,455 6.86%
Utilities $6,201,040 5.00% $6,034,771 4.53% $6,511,219 4.61% $5,825,463 3.78% $5,552,877 3.54% $5,635,083 3.63%
Building Maintenance $3,141,576 2.53% $3,438,295 2.58% $3,759,585 2.66% $7,654,792 4.96% $4,777,216 3.05% $1,421,003 0.91%
Custodial Services $4,243,303 3.42% $4,545,214 3.41% $5,063,440 3.59% $5,402,296 3.50% $5,340,490 3.41% $920,341 0.59%
Total $15,061,062 12.15% $16,049,945 12.06% $17,956,729 12.72% $20,319,020 13.17% $17,882,069 11.41% $18,645,882 12.00%
Admin. Dir. & Support Services
Positions 167.12 168.43 168.43 169.82 176.23 175.79
General Administration $15,623,595 12.60% $16,458,737 12.36% $17,867,201 12.66% $19,460,971 12.62% $19,871,462 12.68% $20,340,877 13.09%
Radio/TV
Positions 0.00 0.00 0.00 0.00 0.00 0.00
Public Broadcasting Services $0 0.00% $0 0.00% $0 0.00% $0 0.00% $0 0.00% $0 0.00%
Library/Audio Visual
Positions 44.22 44.80 44.80 44.46 44.47 43.93
Libraries $2,592,193 2.09% $3,945,552 2.96% $4,058,858 2.88% $4,433,438 2.87% $4,695,068 3.00% $3,086,753 1.99%
Audio Visual Services $0 0.00% $0 0.00% $0 0.00% $0 0.00% $0 0.00% $0 0.00%
Total $2,592,193 2.09% $3,945,552 2.96% $4,058,858 2.88% $4,433,438 2.87% $4,695,068 3.00% $3,086,753 1.99%
2013-142012-13 2011-12 2015-16 Estimated 2016-172014-15University of North Florida

State University System
Educational and General
Comparative Statement of University
Actual and Estimated Expenditures by Activity
Expenditures % of total Expenditures % of total Expenditures % of total Expenditures % of total Expenditures % of total Expenditures % of total
2013-142012-13 2011-12 2015-16 Estimated 2016-172014-15University of North Florida
Museums & Galleries
Positions 0.00 0.00 0.00 0.00 0.00 0.00
Cost $0 0.00% $0 0.00% $0 0.00% $0 0.00% $0 0.00% $0 0.00%
Student Services
EEO/Minority Students
Positions 8.70 8.70 11.85 11.85 11.95 11.95
Cost $693,505 0.56% $715,096 0.54% $934,773 0.66% $947,585 0.61% $1,008,384 0.64% $1,067,646 0.69%
Financial Aid
Positions 20.50 20.50 20.50 19.50 19.50 19.25
Cost $7,349,890 5.93% $9,620,563 7.23% $9,858,404 6.99% $10,266,651 6.66% $8,993,130 5.74% $9,908,632 6.38%
Career Placement
Positions 10.70 10.70 12.00 12.00 12.00 11.00
Cost $604,988 0.49% $586,065 0.44% $642,241 0.46% $723,971 0.47% $731,159 0.47% $753,244 0.48%
Other Student Services
Positions 110.08 109.70 109.24 110.24 111.04 115.29
Cost $7,912,672 6.38% $7,888,682 5.93% $8,011,271 5.68% $8,761,435 5.68% $8,469,462 5.41% $8,303,813 5.34%
Summary Student Services
Total Positions 149.98 149.60 153.59 153.59 154.49 157.49
Total $16,561,055 13.36% $18,810,406 14.13% $19,446,689 13.78% $20,699,642 13.42% $19,202,135 12.26% $20,033,335 12.89%
Intercollegiate Athletics
Positions 0.00 0.00 0.00 0.00 0.00 0.00
E&G Cost - Title IX $144,581 0.12% $144,581 0.11% $144,581 0.10% $144,581 0.09% $144,581 0.09% $144,581 0.09%
E&G Cost - Other $0 0.00% $0 0.00% $0 0.00% $0 0.00% $0 0.00% $0 0.00%
Total Educational & General $123,972,985 100.00% $133,129,428 100.00% $141,123,280 100.00% $154,251,865 100.00% $156,675,573 100.00% $155,426,415 100.00%
Total Positions 1,316.75 1,305.50 1,309.49 1,304.59 1,319.24 1,342.44

State University System
Educational and General
Comparative Statement of University
Actual and Estimated Expenditures by Activity
Expenditures % of total Expenditures % of total Expenditures % of total Expenditures % of total Expenditures % of total Expenditures % of total
Instruction & Research
Positions 521.55 517.54 517.54 608.03 613.79 623.29
General Academic Instruction $46,023,269 51.99% $46,611,489 50.00% $47,641,934 46.96% $58,833,383 48.59% $59,032,373 46.67% $63,650,598 47.34%
Individual or Project Research $0 0.00% $0 0.00% $225 0.00% $0 0.00% $0 0.00% $0 0.00%
Public Service $105,299 0.12% $104,538 0.11% $202,128 0.20% $351,905 0.29% $479,229 0.38% $400,919 0.30%
Academic Advising $0 0.00% $0 0.00% $1,466,988 1.45% $2,118,389 1.75% $2,384,936 1.89% $2,487,424 1.85%
Computing Support $0 0.00% $0 0.00% $1,706,526 1.68% $1,836,490 1.52% $2,094,015 1.66% $1,494,216 1.11%
Academic Administration $6,784,013 7.66% $7,696,880 8.26% $6,237,898 6.15% $6,837,104 5.65% $6,913,860 5.47% $7,644,594 5.69%
Total $52,912,581 59.77% $54,412,907 58.37% $57,255,699 56.43% $69,977,271 57.80% $70,904,413 56.05% $75,677,751 56.28%
Academic Infrastructure Support Orgs.
Positions 0.00 0.00 0.00 0.00 0.00 0.00
Cost $0 0.00% $0 0.00% $0 0.00% $0 0.00% $0 0.00% $0 0.00%
Institutes & Research Centers
Positions 0.00 0.00 0.00 0.00 0.00 1.00
Cost $0 0.00% $0 0.00% $0 0.00% $0 0.00% $0 0.00% $31,000 0.02%
.
Plant Operations & Maintenance
Positions 38.00 42.00 42.00 46.00 50.00 49.00
Plant Administration $1,841,030 2.08% $1,761,783 1.89% $2,062,765 2.03% $2,628,066 2.17% $1,993,087 1.58% $2,594,135 1.93%
Utilities $2,970,478 3.36% $3,424,801 3.67% $3,747,789 3.69% $3,749,363 3.10% $3,843,805 3.04% $4,114,602 3.06%
Building Maintenance $1,991,767 2.25% $2,170,551 2.33% $2,520,874 2.48% $6,315,399 5.22% $6,475,691 5.12% $2,357,438 1.75%
Custodial Services $1,417,761 1.60% $1,483,703 1.59% $1,519,009 1.50% $1,523,127 1.26% $1,667,125 1.32% $1,619,361 1.20%
Total $8,221,036 9.29% $8,840,838 9.48% $9,850,437 9.71% $14,215,955 11.74% $13,979,708 11.05% $10,685,536 7.95%
Admin. Dir. & Support Services
Positions 151.42 168.75 168.75 191.33 208.17 229.52
General Administration $15,073,452 17.03% $16,569,456 17.77% $19,438,969 19.16% $20,426,198 16.87% $23,280,938 18.40% $29,599,645 22.01%
Radio/TV
Positions 7.87 7.30 7.30 6.43 7.52 8.52
Public Broadcasting Services $553,218 0.62% $529,988 0.57% $560,304 0.55% $614,231 0.51% $632,905 0.50% $620,855 0.46%
Library/Audio Visual
Positions 36.50 37.50 37.50 40.50 42.50 43.10
Libraries $3,540,220 4.00% $3,622,846 3.89% $4,356,362 4.29% $4,683,245 3.87% $5,282,820 4.18% $4,960,461 3.69%
Audio Visual Services $0 0.00% $0 0.00% $0 0.00% $0 0.00% $0 0.00% $0 0.00%
Total $3,540,220 4.00% $3,622,846 3.89% $4,356,362 4.29% $4,683,245 3.87% $5,282,820 4.18% $4,960,461 3.69%
Estimated 2016-17 2014-15 2013-142012-13 2011-12 2015-16Florida Gulf Coast University

State University System
Educational and General
Comparative Statement of University
Actual and Estimated Expenditures by Activity
Expenditures % of total Expenditures % of total Expenditures % of total Expenditures % of total Expenditures % of total Expenditures % of total
Estimated 2016-17 2014-15 2013-142012-13 2011-12 2015-16Florida Gulf Coast University
Museums & Galleries
Positions 0.00 0.00 0.00 0.00 0.00 0.00
Cost $0 0.00% $0 0.00% $0 0.00% $0 0.00% $0 0.00% $0 0.00%
Student Services
EEO/Minority Students
Positions 6.75 7.10 2.75 3.70 8.46 11.61
Cost $388,285 0.44% $381,612 0.41% $173,787 0.17% $332,001 0.27% $656,504 0.52% $603,200 0.45%
Financial Aid
Positions 10.80 9.80 9.80 10.80 10.80 10.72
Cost $2,020,665 2.28% $3,077,934 3.30% $3,266,484 3.22% $3,431,548 2.83% $3,607,985 2.85% $3,639,119 2.71%
Career Placement
Positions 4.00 4.00 4.00 5.00 5.00 6.00
Cost $194,297 0.22% $194,608 0.21% $219,654 0.22% $259,741 0.21% $270,098 0.21% $323,421 0.24%
Other Student Services
Positions 69.93 67.93 72.28 87.56 91.76 101.55
Cost $5,615,878 6.34% $5,595,415 6.00% $6,338,977 6.25% $7,136,287 5.89% $7,885,412 6.23% $8,315,246 6.18%
Summary Student Services
Total Positions 91.48 88.83 88.83 107.06 116.02 129.88
Total $8,219,125 9.29% $9,249,569 9.92% $9,998,902 9.85% $11,159,577 9.22% $12,419,999 9.82% $12,880,986 9.58%
Intercollegiate Athletics
Positions 0.00 0.00 0.00 0.00 0.00 0.00
E&G Cost - Title IX $0 0.00% $0 0.00% $0 0.00% $0 0.00% $0 0.00% $0 0.00%
E&G Cost - Other $0 0.00% $0 0.00% $0 0.00% $0 0.00% $0 0.00% $0 0.00%
Total Educational & General $88,519,632 100.00% $93,225,604 100.00% $101,460,673 100.00% $121,076,477 100.00% $126,500,783 100.00% $134,456,234 100.00%
Total Positions 846.82 861.92 861.92 999.35 1,038.00 1,084.31

State University System
Educational and General
Comparative Statement of University
Actual and Estimated Expenditures by Activity
Expenditures % of total Expenditures % of total Expenditures % of total Expenditures % of total Expenditures % of total Expenditures % of total
Instruction & Research
Positions 74.47 73.56 77.70 81.57 83.51 84.81
General Academic Instruction $7,448,612 36.47% $8,213,985 38.27% $8,746,190 38.20% $9,554,325 39.64% $9,739,259 38.87% $9,376,226 38.23%
Individual or Project Research $0 0.00% $0 0.00% $0 0.00% $0 0.00% $0 0.00% $0 0.00%
Public Service $0 0.00% $0 0.00% $0 0.00% $0 0.00% $0 0.00% $0 0.00%
Academic Advising $0 0.00% $0 0.00% $0 0.00% $0 0.00% $0 0.00% $0 0.00%
Computing Support $602,012 2.95% $579,802 2.70% $796,180 3.48% $765,762 3.18% $675,764 2.70% $691,437 2.82%
Academic Administration $555,313 2.72% $538,820 2.51% $602,380 2.63% $589,236 2.44% $687,348 2.74% $672,921 2.74%
Total $8,605,937 42.14% $9,332,607 43.48% $10,144,750 44.31% $10,909,323 45.27% $11,102,371 44.31% $10,740,584 43.80%
Academic Infrastructure Support Orgs.
Positions 0.00 0.00 0.00 0.00 0.00 0.00
Cost $0 0.00% $0 0.00% $0 0.00% $0 0.00% $0 0.00% $0 0.00%
Institutes & Research Centers
Positions 0.00 0.00 0.00 0.00 0.00 0.00
Cost $0 0.00% $0 0.00% $0 0.00% $0 0.00% $0 0.00% $0 0.00%
Plant Operations & Maintenance
Positions 36.60 32.79 33.79 33.39 33.40 33.60
Plant Administration $176,192 0.86% $240,605 1.12% $198,801 0.87% $201,591 0.84% $193,011 0.77% $192,458 0.78%
Utilities $1,020,456 5.00% $884,661 4.12% $957,465 4.18% $947,929 3.93% $995,562 3.97% $809,631 3.30%
Building Maintenance $618,886 3.03% $702,380 3.27% $873,305 3.81% $867,698 3.60% $778,175 3.11% $823,227 3.36%
Custodial Services $784,452 3.84% $697,732 3.25% $847,177 3.70% $858,642 3.56% $861,490 3.44% $963,119 3.93%
Total $2,599,986 12.73% $2,525,378 11.77% $2,876,748 12.57% $2,875,860 11.93% $2,828,238 11.29% $2,788,435 11.37%
Admin. Dir. & Support Services
Positions 53.64 50.49 50.81 51.11 53.82 55.78
General Administration $4,847,701 23.74% $4,806,773 22.39% $4,989,337 21.79% $4,954,684 20.56% $5,748,710 22.94% $5,675,498 23.14%
Radio/TV
Positions 0.00 0.00 0.00 0.00 0.00 0.00
Public Broadcasting Services $0 0.00% $0 0.00% $0 0.00% $0 0.00% $0 0.00% $0 0.00%
Library/Audio Visual
Positions 18.86 19.00 19.00 19.00 20.00 19.00
Libraries $895,713 4.39% $911,875 4.25% $904,062 3.95% $916,662 3.80% $912,414 3.64% $993,781 4.05%
Audio Visual Services $29,024 0.14% $13,510 0.06% $35,037 0.15% $30,126 0.13% $23,892 0.10% $32,090 0.13%
Total $924,737 4.53% $925,385 4.31% $939,099 4.10% $946,788 3.93% $936,306 3.74% $1,025,871 4.18%
New College of Florida 2013-142012-13 Estimated 2016-17 2011-12 2015-162014-15

State University System
Educational and General
Comparative Statement of University
Actual and Estimated Expenditures by Activity
Expenditures % of total Expenditures % of total Expenditures % of total Expenditures % of total Expenditures % of total Expenditures % of totalNew College of Florida
2013-142012-13 Estimated 2016-17 2011-12 2015-162014-15
Museums & Galleries
Positions 0.00 0.00 0.00 0.00 0.00 0.00
Cost $0 0.00% $0 0.00% $0 0.00% $0 0.00% $0 0.00% $0 0.00%
Student Services
EEO/Minority Students
Positions 1.00 0.65 0.77 0.53 0.53 0.68
Cost $97,588 0.48% $55,257 0.26% $62,687 0.27% $56,065 0.23% $61,243 0.24% $73,062 0.30%
Financial Aid
Positions 3.50 3.95 3.70 3.20 4.70 4.35
Cost $1,241,820 6.08% $1,426,232 6.64% $1,541,687 6.73% $1,832,378 7.60% $1,750,512 6.99% $1,654,834 6.75%
Career Placement
Positions 1.50 1.50 1.00 3.00 4.00 4.46
Cost $89,718 0.44% $88,042 0.41% $90,420 0.39% $333,789 1.39% $314,414 1.25% $323,547 1.32%
Other Student Services
Positions 22.25 23.40 27.89 24.99 27.50 26.97
Cost $2,015,738 9.87% $2,304,359 10.74% $2,249,362 9.83% $2,191,309 9.09% $2,315,675 9.24% $2,240,893 9.14%
Summary Student Services
Total Positions 28.25 29.50 33.36 31.72 36.73 36.46
Total $3,444,864 16.87% $3,873,890 18.05% $3,944,156 17.23% $4,413,541 18.31% $4,441,844 17.73% $4,292,336 17.50%
Intercollegiate Athletics
Positions 0.00 0.00 0.00 0.00 0.00 0.00
E&G Cost - Title IX $0 0.00% $0 0.00% $0 0.00% $0 0.00% $0 0.00% $0 0.00%
E&G Cost - Other $0 0.00% $0 0.00% $0 0.00% $0 0.00% $0 0.00% $0 0.00%
Total Educational & General $20,423,225 100.00% $21,464,033 100.00% $22,894,090 100.00% $24,100,196 100.00% $25,057,469 100.00% $24,522,724 100.00%
Total Positions 211.82 205.34 214.66 216.79 227.46 229.65

Expenditures % of total Expenditures % of total Expenditures % of total Expenditures % of total Expenditures % of total
Instruction & Research
Positions 78.23 78.85 100.69 118.81 124.01
General Academic Instruction $0 0.00% $666,183 4.96% $3,865,374 14.65% $5,687,880 18.78% $9,510,013 23.04%
Individual or Project Research $2,264,944 49.68% $0 0.00% $562 0.00% $1,870,877 6.18% $3,394,184 8.22%
Public Service $0 0.00% $207,310 1.54% $154,042 0.58% $126,415 0.42% $1,636,390 3.96%
Academic Advising $0 0.00% $309 0.00% $61,275 0.23% $41,333 0.14% $0 0.00%
Computing Support $0 0.00% $1,851,176 13.79% $4,508,315 17.08% $3,343,160 11.04% $6,828,971 16.54%
Academic Administration $44,818 0.98% $864,692 6.44% $1,811,406 6.86% $1,646,968 5.44% $6,108,818 14.80%
Total $2,309,762 50.66% $3,589,670 26.74% $10,400,974 39.41% $12,716,633 41.99% $27,478,376 66.57%
Academic Infrastructure Support Orgs.
Positions 0.00 0.00 0.00 0.00 0.00
Cost $0 0.00% $0 0.00% $0 0.00% $0 0.00% $0 0.00%
Institutes & Research Centers
Positions 15.93 16.00 15.00 0.00 0.00
Cost $0 0.00% $778,462 5.80% $1,121,631 4.25% $0 0.00% $0 0.00%
Plant Operations & Maintenance
Positions 0.00 0.00 5.00 7.00 7.00
Plant Administration $0 0.00% $696,430 5.19% $1,745,167 6.61% $869,755 2.87% $2,024,934 4.91%
Utilities $0 0.00% $0 0.00% $1,523 0.01% $514,711 1.70% $761,934 1.85%
Building Maintenance $0 0.00% $0 0.00% $24,550 0.09% $478,372 1.58% $47,045 0.11%
Custodial Services $0 0.00% $0 0.00% $204,377 0.77% $227,917 0.75% $308,160 0.75%
Total $0 0.00% $696,430 5.19% $1,975,617 7.49% $2,090,755 6.90% $3,142,073 7.61%
Admin. Dir. & Support Services
Positions 16.66 17.00 28.24 41.53 60.09
General Administration $2,249,629 49.34% $7,077,716 52.73% $10,486,420 39.74% $12,644,459 41.75% $7,620,331 18.46%
Radio/TV
Positions 0.00 0.00 0.00 0.00 0.00
Public Broadcasting Services $0 0.00% $0 0.00% $0 0.00% $0 0.00% $0 0.00%
Library/Audio Visual
Positions 0.00 0.00 2.00 2.00 5.00
Libraries $0 0.00% $116,768 0.87% $415,726 1.58% $471,284 1.56% $697,930 1.69%
Audio Visual Services $0 0.00% $0 0.00% $0 0.00% $0 0.00% $0 0.00%
Total $0 0.00% $116,768 0.87% $415,726 1.58% $471,284 1.56% $697,930 1.69%
Museums & Galleries
Positions 0.00 0.00 0.00 0.00 0.00
Cost $0 0.00% $0 0.00% $0 0.00% $0 0.00% $0 0.00%
Student Services
EEO/Minority Students
Positions 0.00 0.00 0.00 0.00 0.00
Cost $0 0.00% $0 0.00% $0 0.00% $0 0.00% $0 0.00%
Financial Aid
Positions 0.00 0.00 1.00 2.00 3.00
Cost $0 0.00% $0 0.00% $181,537 0.69% $223,957 0.74% $267,558 0.65%
Career Placement
Positions 0.00 0.00 0.00 0.00 0.00
Cost $0 0.00% $0 0.00% $0 0.00% $0 0.00% $0 0.00%
Other Student Services
Positions 0.00 9.00 13.00 16.00 17.00
Cost $0 0.00% $1,163,413 8.67% $1,807,213 6.85% $2,140,276 7.07% $2,074,247 5.02%
Summary Student Services
Total Positions 8.96 9.00 14.00 18.00 20.00
Total $0 0.00% $1,163,413 8.67% $1,988,750 7.54% $2,364,233 7.81% $2,341,805 5.67%
Intercollegiate Athletics
Positions 0.00 0.00 0.00 0.00 0.00
E&G Cost - Title IX $0 0.00% $0 0.00% $0 0.00% $0 0.00% $0 0.00%
E&G Cost - Other $0 0.00% $0 0.00% $0 0.00% $0 0.00% $0 0.00%
Total Educational & General $4,559,391 100.00% $13,422,459 100.00% $26,389,118 100.00% $30,287,364 100.00% $41,280,515 100.00%
Total Positions 119.78 120.85 164.93 187.34 216.10
Estimated 2016-172012-13 2013-14Florida Polytechnic University
2014-15 2015-16

State University System
Education and General
Comparative Statement of University
Actual and Estimated Expenditures by Activity
Expenditures % of total Expenditures % of total Expenditures % of total Expenditures % of total Expenditures % of total Expenditures % of total
Institutes & Research Centers
Positions 791.93 800.62 742.44 775.22 794.36 209.83
Cost $73,235,066 53.80% $74,878,235 52.21% $78,554,232 49.95% $83,989,383 50.73% $89,116,714 49.80% $96,789,835 51.31%
Plant Operations & Maintenance
Positions 63.00 64.75 61.00 60.00 59.00 1.42
Plant Administration $899,051 0.66% $797,145 0.56% $4,175 0.00% $0 0.00% $0 0.00% $0 0.00%
Utilities $7,107,952 5.22% $7,175,182 5.00% $7,228,015 4.60% $7,715,493 4.66% $7,397,797 4.13% $8,300,143 4.40%
Building Maintenance $5,746,265 4.22% $7,399,903 5.16% $9,861,572 6.27% $10,346,863 6.25% $12,838,670 7.17% $6,874,076 3.64%
Custodial Services $535,934 0.39% $533,524 0.37% $676,070 0.43% $572,946 0.35% $644,629 0.36% $850,000 0.45%
Total $14,289,202 10.50% $15,905,754 11.09% $17,769,832 11.30% $18,635,302 11.26% $20,881,096 11.67% $16,024,219 8.49%
Admin. Dir. & Support Services
Positions 50.06 86.55 104.31 117.01 127.74 78.37
General Administration $7,185,500 5.28% $10,856,182 7.57% $14,928,593 9.49% $13,725,318 8.29% $14,735,578 8.23% $14,888,395 7.89%
Agricultural Extension Services
Positions 536.90 566.75 544.27 585.09 538.79 393.32
Cooperative Extension Services $41,409,931 30.42% $41,783,184 29.13% $46,018,498 29.26% $49,221,975 29.73% $54,233,752 30.30% $60,931,365 32.30%
Total Educational & General $136,119,699 100.00% $143,423,355 100.00% $157,271,155 100.00% $165,571,978 100.00% $178,967,140 100.00% $188,633,814 100.00%
Total Positions 1,441.89 1,518.67 1,452.02 1,537.32 1,519.89 682.94
2013-142012-132011-12 Estimated 2016-17UF-IFAS
2015-162014-15

State University System
Education and General
Comparative Statement of University
Actual and Estimated Expenditures by Activity
Expenditures % of total Expenditures % of total Expenditures % of total Expenditures % of total Expenditures % of total Expenditures % of total
Instruction & Research
Positions 506.49 443.80 547.86 630.14 601.21 577.97
General Academic Instruction $69,065,000 47.40% $68,109,444 44.80% $81,421,366 47.97% $80,914,790 45.72% $79,915,017 44.49% $79,422,605 44.56%
Individual or Project Research $3,496,784 2.40% $2,306,607 1.52% $2,857,495 1.68% $4,314,323 2.44% $4,302,344 2.40% $5,190,484 2.91%
Public Service $77,571 0.05% $105,436 0.07% $140,570 0.08% $146,177 0.08% $145,399 0.08% $154,769 0.09%
Computing Support $793,975 0.54% $322,730 0.21% $918,834 0.54% $0 0.00% $19,737 0.01% $20,439 0.01%
Academic Administration $12,127,246 8.32% $11,651,221 7.66% $16,240,546 9.57% $19,755,028 11.16% $19,854,566 11.05% $19,886,335 11.16%
Total $85,560,576 58.73% $82,495,438 54.26% $101,578,811 59.85% $105,130,318 59.41% $104,237,063 58.03% $104,674,632 58.73%
Plant Operations & Maintenance
Positions 212.67 209.30 206.60 210.90 213.00 224.47
Plant Administration $3,841,270 2.64% $4,525,865 2.98% $4,437,910 2.61% $4,730,815 2.67% $5,141,802 2.86% $8,088,055 4.54%
Utilities $14,828,023 10.18% $19,519,697 12.84% $15,288,140 9.01% $15,953,749 9.01% $16,092,498 8.96% $9,971,923 5.59%
Building Maintenance $6,274,638 4.31% $6,722,882 4.42% $6,973,828 4.11% $6,913,437 3.91% $7,503,990 4.18% $6,772,821 3.80%
Custodial Services $3,540,816 2.43% $3,755,315 2.47% $3,958,897 2.33% $4,881,036 2.76% $5,266,723 2.93% $5,232,852 2.94%
Total $28,484,747 19.55% $34,523,759 22.71% $30,658,775 18.06% $32,479,037 18.35% $34,005,013 18.93% $30,065,651 16.87%
Admin. Dir. & Support Services
Positions 112.35 95.19 127.71 145.90 141.50 144.99
General Administration $9,477,654 6.51% $13,443,683 8.84% $15,630,894 9.21% $15,366,859 8.68% $14,421,051 8.03% $11,151,792 6.26%
Teaching Hospital & Allied Clinics
Positions 142.49 155.14 221.88 179.41 229.89 233.41
Patient Services $18,811,107 12.91% $18,222,133 11.99% $18,300,431 10.78% $20,213,152 11.42% $22,613,852 12.59% $28,463,256 15.97%
Library/Audio Visual
Positions 37.52 35.94 35.84 36.75 35.02 32.12
Libraries $3,362,235 2.31% $3,344,081 2.20% $3,557,678 2.10% $3,781,354 2.14% $4,338,325 2.42% $3,879,615 2.18%
Audio Visual Services $0 0.00% $0 0.00% $0 0.00% $0 0.00% $0 0.00% $0 0.00%
Total $3,362,235 2.31% $3,344,081 2.20% $3,557,678 2.10% $3,781,354 2.14% $4,338,325 2.42% $3,879,615 2.18%
Total Educational & General $145,696,319 100.00% $152,029,094 100.00% $169,726,589 100.00% $176,970,720 100.00% $179,615,304 100.00% $178,234,946 100.00%
Total Positions 1,011.52 939.37 1,139.89 1,203.10 1,220.62 1,212.96
2013-142012-132011-12 Estimated 2016-17UF-HSC
2015-162014-15

State University System
Education and General
Comparative Statement of University
Actual and Estimated Expenditures by Activity
Expenditures % of total Expenditures % of total Expenditures % of total Expenditures % of total Expenditures % of total Expenditures % of total Expenditures % of total
Instruction & Research
Positions 664.97 679.47 728.47 718.63 793.09 801.35 816.79
General Academic Instruction $56,892,477 65.61% $57,513,039 66.64% $71,823,405 63.14% $74,075,018 62.49% $84,144,276 60.71% $87,157,952 65.50% $102,974,038 74.52%
Individual or Project Research $3,878,585 4.47% $4,093,192 4.74% $6,724,716 5.91% $6,598,423 5.57% $10,017,334 7.23% $10,016,508 7.53% $4,953,032 3.58%
Public Service $294,001 0.34% $72,800 0.08% $9,433 0.01% $2,673 0.00% $313,927 0.23% $347,170 0.26% $54,004 0.04%
Academic Advising $527,989 0.61% $538,507 0.62% $554,327 0.49% $484,306 0.41% $507,333 0.37% $694,189 0.52% $638,825 0.46%
Computing Support $3,792,829 4.37% $3,655,402 4.24% $5,250,674 4.62% $6,226,818 5.25% $7,152,052 5.16% $6,084,918 4.57% $3,683,555 2.67%
Academic Administration $11,135,658 12.84% $10,509,168 12.18% $11,310,890 9.94% $14,908,405 12.58% $14,814,629 10.69% $12,204,828 9.17% $14,932,207 10.81%
Total $76,521,540 88.25% $76,382,108 88.50% $95,673,445 84.11% $102,295,643 86.30% $116,949,551 84.38% $116,505,565 87.55% $127,235,661 92.07%
Institutes & Research Centers
Positions 0.00 0.00 0.00 0.00 0.00 0.00 0.00
Cost $1,639 0.00% $0 0.00% $0 0.00% $0 0.00% $0 0.00% $0 0.00% $0 0.00%
Plant Operations & Maintenance
Positions 5.15 5.21 5.21 6.06 5.11 4.52 4.52
Plant Administration $185,172 0.21% $212,776 0.25% $251,420 0.22% $323,219 0.27% $315,402 0.23% $302,143 0.23% $183,224 0.13%
Utilities $620,859 0.72% $576,530 0.67% $2,026,112 1.78% $2,150,622 1.81% $2,176,326 1.57% $2,127,540 1.60% $3,802,442 2.75%
Building Maintenance $528,357 0.61% $945,576 1.10% $4,478,329 3.94% $4,642,754 3.92% $8,792,092 6.34% $4,171,623 3.13% $1,161,952 0.84%
Custodial Services $38,674 0.04% $65,965 0.08% $263,536 0.23% $274,540 0.23% $274,880 0.20% $292,089 0.22% $301,096 0.22%
Total $1,373,062 1.58% $1,800,847 2.09% $7,019,397 6.17% $7,391,135 6.24% $11,558,700 8.34% $6,893,395 5.18% $5,448,714 3.94%
Admin. Dir. & Support Services
Positions 61.38 54.57 55.04 54.18 47.91 48.83 47.55
General Administration $6,375,336 7.35% $5,076,837 5.88% $8,132,708 7.15% $6,263,326 5.28% $7,120,886 5.14% $6,317,189 4.75% $3,147,630 2.28%
Teaching Hospital & Allied Clinics
Positions 0.00 0.00 0.00 0.00 0.00 0.00 0.00
Patient Services $0 0.00% $0 0.00% $0 0.00% $0 0.00% $0 0.00% $0 0.00% $0 0.00%
Library/Audio Visual
Positions 21.65 20.85 20.96 20.00 20.08 18.92 18.92
Libraries $2,437,818 2.81% $3,043,160 3.53% $2,921,295 2.57% $2,587,261 2.18% $2,961,575 2.14% $2,818,268 2.12% $2,356,626 1.71%
Audio Visual Services $0 0.00% $0 0.00% $0 0.00% $0 0.00% $0 0.00% $0 0.00% $0 0.00%
Total $2,437,818 2.81% $3,043,160 3.53% $2,921,295 2.57% $2,587,261 2.18% $2,961,575 2.14% $2,818,268 2.12% $2,356,626 1.71%
Student Services
EEO/Minority Students
Positions 0.00 0.00 0.00 0.00 0.00 0.00 0.00
Cost $0 0.00% $0 0.00% $0 0.00% $0 0.00% $0 0.00% $0 0.00% $0 0.00%
Financial Aid
Positions 0.00 0.00 0.00 0.00 0.00 0.00 0.00
Cost $0 0.00% $0 0.00% $0 0.00% $0 0.00% $0 0.00% $0 0.00% $0 0.00%
Career Placement
Positions 0.00 0.00 0.00 0.00 0.00 0.00 0.00
Cost $0 0.00% $0 0.00% $0 0.00% $0 0.00% $0 0.00% $0 0.00% $0 0.00%
Other Student Services
Positions 0.00 0.00 0.00 0.00 0.00 0.00 0.00
Cost $0 0.00% $0 0.00% $0 0.00% $0 0.00% $0 0.00% $533,836 0.40% $0 0.00%
Summary Student Services
Total Positions 0.00 0.00 0.00 0.00 0.00 0.00 0.00
Total $0 0.00% $0 0.00% $0 0.00% $0 0.00% $0 0.00% $533,836 0.40% $0 0.00%
Total Educational & General $86,709,395 100.00% $86,302,952 100.00% $113,746,845 100.00% $118,537,365 100.00% $138,590,712 100.00% $133,068,253 100.00% $138,188,631 100.00%
Total Positions 753.15 760.10 809.68 798.87 866.19 873.62 887.78
Estimated 2016-172010-11 2015-16 2014-15 2013-142012-132011-12USF-HSC

State University System
Education and General
Comparative Statement of University
Actual and Estimated Expenditures by Activity
Expenditures % of total Expenditures % of total Expenditures % of total Expenditures % of total Expenditures % of total Expenditures % of total
Instruction & Research
Positions 335.08 331.04 329.99 321.60 280.56 280.75
General Academic Instruction $35,731,204 88.28% $41,449,595 84.01% $40,301,871 83.63% $41,941,025 86.43% $41,526,365 77.07% $37,419,481 80.23%
Individual or Project Research $0 0.00% $229,119 0.46% $116,189 0.24% $47,599 0.10% $5,431 0.01% $0 0.00%
Public Service $351,708 0.87% $306,703 0.62% $280,060 0.58% $159,541 0.33% $265,471 0.49% $345,292 0.74%
Academic Advising $1,453,147 3.59% $2,485,233 5.04% $2,645,701 5.49% $2,569,328 5.29% $3,829,197 7.11% $2,879,808 6.17%
Computing Support $0 0.00% $0 0.00% $0 0.00% $0 0.00% $0 0.00% $0 0.00%
Academic Administration $2,305,090 5.70% $4,035,578 8.18% $3,113,386 6.46% $1,983,050 4.09% $3,503,048 6.50% $2,717,513 5.83%
Total $39,841,149 98.44% $48,506,228 98.32% $46,457,207 96.40% $46,700,543 96.24% $49,129,512 91.19% $43,362,094 92.97%
Plant Operations & Maintenance
Positions 0.00 0.00 0.00 0.00 0.00 0.00
Plant Administration $0 0.00% $0 0.00% $0 0.00% $0 0.00% $0 0.00% $0 0.00%
Utilities $0 0.00% $0 0.00% $0 0.00% $0 0.00% $0 0.00% $0 0.00%
Building Maintenance $0 0.00% $0 0.00% $0 0.00% $0 0.00% $0 0.00% $0 0.00%
Custodial Services $0 0.00% $0 0.00% $0 0.00% $0 0.00% $0 0.00% $0 0.00%
Total $0 0.00% $0 0.00% $0 0.00% $0 0.00% $0 0.00% $0 0.00%
Admin. Dir. & Support Services
Positions 0 0 0 0 32.61 34.75
General Administration $57,093 0.14% $60,964 0.12% $83,282 0.17% $91,260 0.19% $2,833,079 5.26% $2,685,089 5.76%
Teaching Hospital & Allied Clinics
Positions 0.00 0.00 0.00 0.00 0.00 0.00
Patient Services $0 0.00% $0 0.00% $0 0.00% $0 0.00% $0 0.00% $0 0.00%
Library/Audio Visual
Positions 8.00 9.00 6.00 6.00 7.00 7.00
Libraries $574,721 1.42% $769,739 1.56% $1,649,927 3.42% $1,735,327 3.58% $1,915,518 3.56% $594,026 1.27%
Audio Visual Services $0 0.00% $0 0.00% $0 0.00% $0 0.00% $0 0.00% $0 0.00%
Total $574,721 1.42% $769,739 1.56% $1,649,927 3.42% $1,735,327 3.58% $1,915,518 3.56% $594,026 1.27%
Total Educational & General $40,472,963 100.00% $49,336,931 100.00% $48,190,416 100.00% $48,527,130 100.00% $53,878,109 100.00% $46,641,209 100.00%
Total Positions 343.08 340.04 335.99 327.60 320.17 322.50
FSU-MS2011-12 Estimated 2016-172015-16 2014-15 2013-14 2012-13

State University System
Education and General
Comparative Statement of University
Actual and Estimated Expenditures by Activity
Expenditures % of total Expenditures % of total Expenditures % of total Expenditures % of total Expenditures % of total Expenditures % of total
Instruction & Research
Positions 219.87 182.35 179.00 162.29 143.36 154.49
General Academic Instruction $14,494,876 60.24% $16,997,597 57.22% $15,275,330 51.29% $20,809,284 56.17% $22,606,411 50.74% $17,146,631 41.15%
Individual or Project Research $31,879 0.13% $84,554 0.28% $160,684 0.54% $847,593 2.29% $1,465,486 3.29% $180,000 0.43%
Public Service $0 0.00% $0 0.00% $0 0.00% $225,000 0.61% $499,999 1.12% $0 0.00%
Academic Advising $0 0.00% $0 0.00% $0 0.00% $0 0.00% $0 0.00% $0 0.00%
Computing Support $0 0.00% $0 0.00% $0 0.00% $435,379 1.18% $601,626 1.35% $921,228 2.21%
Academic Administration $4,943,926 20.55% $6,062,881 20.41% $6,559,670 22.02% $5,582,766 15.07% $5,829,283 13.08% $7,795,989 18.71%
Total $19,470,681 80.92% $23,145,032 77.92% $21,995,684 73.85% $27,900,022 75.31% $31,002,805 69.58% $26,043,848 62.50%
Plant Operations & Maintenance
Positions 0.00 0.00 0.00 6.00 7.00 8.00
Plant Administration $0 0.00% $1,199,110 4.04% $0 0.00% $0 0.00% $0 0.00% $0 0.00%
Utilities $0 0.00% $0 0.00% $0 0.00% $0 0.00% $0 0.00% $0 0.00%
Building Maintenance $300,641 1.25% $0 0.00% $1,387,977 4.66% $1,652,368 4.46% $1,816,548 4.08% $1,843,590 4.42%
Custodial Services $0 0.00% $0 0.00% $0 0.00% $0 0.00% $0 0.00% $0 0.00%
Total $300,641 1.25% $1,199,110 4.04% $1,387,977 4.66% $1,652,368 4.46% $1,816,548 4.08% $1,843,590 4.42%
Admin. Dir. & Support Services
Positions 0 35.49 35.74 32.74 33.00 38.00
General Administration $3,657,268 15.20% $3,442,636 11.59% $4,253,171 14.28% $4,883,285 13.18% $4,845,255 10.87% $5,331,151 12.79%
Teaching Hospital & Allied Clinics
Positions 0.00 0.00 0.00 0.00 0.00 0.00
Patient Services $0 0.00% $0 0.00% $0 0.00% $0 0.00% $0 0.00% $0 0.00%
Library/Audio Visual
Positions 0.00 0.00 0.00 16.00 18.00 20.00
Libraries $581,634 2.42% $1,346,913 4.53% $1,396,366 4.69% $1,686,325 4.55% $1,634,312 3.67% $1,866,940 4.48%
Audio Visual Services $51,766 0.22% $571,051 1.92% $751,226 2.52% $922,954 2.49% $900,013 2.02% $1,207,422 2.90%
Total $633,400 2.63% $1,917,964 6.46% $2,147,592 7.21% $2,609,279 7.04% $2,534,325 5.69% $3,074,362 7.38%
Student Services
EEO/Minority Students
Positions 0.00 0.00 0.00 0.00 0.00 0.00
Cost $0 0.00% $0 0.00% $0 0.00% $0 0.00% $0 0.00% $0 0.00%
Financial Aid
Positions 0.00 0.00 0.00 0.00 0.00 0.00
Cost $0 0.00% $0 0.00% $0 0.00% $0 0.00% $2,527,117 5.67% $3,170,000 7.61%
Career Placement
Positions 0.00 0.00 0.00 0.00 0.00 0.00
Cost $0 0.00% $0 0.00% $0 0.00% $0 0.00% $0 0.00% $0 0.00%
Other Student Services
Positions 0.00 0.00 0.00 0.00 16.80 16.80
Cost $0 0.00% $0 0.00% $0 0.00% $0 0.00% $1,831,361 4.11% $2,208,655 5.30%
Summary Student Services
Total Positions 0.00 0.00 0.00 0.00 16.80 16.80
Total $0 0.00% $0 0.00% $0 0.00% $0 0.00% $4,358,478 9.78% $5,378,655 12.91%
Total Educational & General $24,061,990 100.00% $29,704,742 100.00% $29,784,424 100.00% $37,044,954 100.00% $44,557,411 100.00% $41,671,606 100.00%
Total Positions 219.87 217.84 214.74 217.03 218.16 237.29
UCF-MS2011-12 Estimated 2016-172015-16 2014-15 2013-142012-13

State University System
Education and General
Comparative Statement of University
Actual and Estimated Expenditures by Activity
Expenditures % of total Expenditures % of total Expenditures % of total Expenditures % of total Expenditures % of total Expenditures % of total
Instruction & Research
Positions 212.28 244.91 278.77 324.86 348.28 343.76
General Academic Instruction $10,166,599 35.45% $11,997,489 32.94% $11,946,146 29.00% $17,118,173 36.41% $18,519,934 39.15% $22,888,323 45.84%
Individual or Project Research $0 0.00% $184,297 0.51% $276,392 0.67% $202,212 0.43% $93,370 0.20% $0 0.00%
Public Service $0 0.00% $0 0.00% $0 0.00% $0 0.00% $0 0.00% $0 0.00%
Academic Advising $0 0.00% $0 0.00% $18,336 0.04% $862,507 1.83% $702,380 1.48% $849,778 1.70%
Computing Support $0 0.00% $0 0.00% $4,918 0.01% $288,998 0.61% $279,933 0.59% $395,537 0.79%
Academic Administration $13,600,224 47.42% $18,191,698 49.95% $22,303,287 54.14% $23,118,679 49.17% $23,226,807 49.09% $21,640,523 43.34%
Total $23,766,823 82.87% $30,373,484 83.40% $34,549,079 83.87% $41,590,569 88.47% $42,822,424 90.51% $45,774,161 91.67%
Plant Operations & Maintenance
Positions 0.00 0.00 0.00 0.00 0.00 0.00
Plant Administration $0 0.00% $0 0.00% $0 0.00% $0 0.00% $0 0.00% $0 0.00%
Utilities $0 0.00% $0 0.00% $0 0.00% $0 0.00% $0 0.00% $0 0.00%
Building Maintenance $861 0.00% $88,374 0.24% $147,554 0.36% $843,929 1.80% $546,568 1.16% $0 0.00%
Custodial Services $0 0.00% $0 0.00% $0 0.00% $0 0.00% $0 0.00% $0 0.00%
Total $861 0.00% $88,374 0.24% $147,554 0.36% $843,929 1.80% $546,568 1.16% $0 0.00%
Admin. Dir. & Support Services
Positions 37.68 40.02 44.89 34.56 25.10 25.99
General Administration $3,794,663 13.23% $4,716,660 12.95% $5,175,971 12.57% $3,314,208 7.05% $2,608,605 5.51% $2,706,620 5.42%
Teaching Hospital & Allied Clinics
Positions 0.00 0.00 0.00 0.00 0.00 0.00
Patient Services $0 0.00% $0 0.00% $0 0.00% $0 0.00% $0 0.00% $0 0.00%
Library/Audio Visual
Positions 8.50 8.50 9.00 9.00 9.00 9.00
Libraries $1,118,855 3.90% $1,238,406 3.40% $1,319,497 3.20% $1,264,636 2.69% $1,333,452 2.82% $1,455,245 2.91%
Audio Visual Services $0 0.00% $0 0.00% $0 0.00% $0 0.00% $0 0.00% $0 0.00%
Total $1,118,855 3.90% $1,238,406 3.40% $1,319,497 3.20% $1,264,636 2.69% $1,333,452 2.82% $1,455,245 2.91%
Total Educational & General $28,681,202 100.00% $36,416,924 100.00% $41,192,101 100.00% $47,013,342 100.00% $47,311,049 100.00% $49,936,026 100.00%
Total Positions 258.46 293.43 332.66 368.42 382.38 378.75
FIU-MSEstimated 2016-172014-15 2013-142012-132011-12 2015-16

State University System
Education and General
Comparative Statement of University
Actual and Estimated Expenditures by Activity
Expenditures % of total Expenditures % of total Expenditures % of total Expenditures % of total Expenditures % of total Expenditures % of total
Instruction & Research
Positions 0.00 112.47 134.09 124.35 150.49 150.49
General Academic Instruction $8,244,887 67.57% $10,093,537 60.08% $10,071,110 57.70% $12,203,767 59.75% $14,083,517 61.21% $15,378,618 63.18%
Individual or Project Research $419,646 3.44% $405,522 2.41% $393,596 2.25% $649,490 3.18% $483,657 2.10% $292,806 1.20%
Public Service $13,472 0.11% $276,292 1.64% $478,316 2.74% $485,553 2.38% $417,313 1.81% $570,886 2.35%
Academic Advising $0 0.00% $0 0.00% $0 0.00% $0 0.00% $0 0.00% $0 0.00%
Computing Support $459,697 3.77% $467,746 2.78% $609,242 3.49% $700,189 3.43% $820,552 3.57% $850,494 3.49%
Academic Administration $2,600,047 21.31% $4,440,600 26.43% $4,793,119 27.46% $5,333,634 26.12% $5,951,315 25.87% $5,719,053 23.49%
Total $11,737,749 96.19% $15,683,697 93.36% $16,345,383 93.64% $19,372,633 94.85% $21,756,354 94.57% $22,811,857 93.71%
Plant Operations & Maintenance
Positions 0.00 0.00 0.00 0.00 0.00 0.00
Plant Administration $0 0.00% $0 0.00% $0 0.00% $0 0.00% $0 0.00% $0 0.00%
Utilities $0 0.00% $0 0.00% $0 0.00% $0 0.00% $0 0.00% $0 0.00%
Building Maintenance $0 0.00% $0 0.00% $0 0.00% $0 0.00% $0 0.00% $0 0.00%
Custodial Services $0 0.00% $0 0.00% $0 0.00% $0 0.00% $0 0.00% $0 0.00%
Total $0 0.00% $0 0.00% $0 0.00% $0 0.00% $0 0.00% $0 0.00%
Admin. Dir. & Support Services
Positions 0.00 9.77 8.77 8.00 8.39 8.39
General Administration $464,461 3.81% $690,252 4.11% $763,110 4.37% $637,163 3.12% $836,453 3.64% $1,167,229 4.80%
Teaching Hospital & Allied Clinics
Positions 0.00 0.00 0.00 0.00 0.00 0.00
Patient Services $0 0.00% $0 0.00% $0 0.00% $0 0.00% $0 0.00% $0 0.00%
Library/Audio Visual
Positions 0.00 0.00 2.36 27.88 1.36 1.36
Libraries $434 0.00% $425,000 2.53% $346,334 1.98% $413,696 2.03% $413,861 1.80% $363,079 1.49%
Audio Visual Services $0 0.00% $0 0.00% $0 0.00% $0 0.00% $0 0.00% $0 0.00%
Total $434 0.00% $425,000 2.53% $346,334 1.98% $413,696 2.03% $413,861 1.80% $363,079 1.49%
Total Educational & General $12,202,644 100.00% $16,798,949 100.00% $17,454,827 100.00% $20,423,492 100.00% $23,006,668 100.00% $24,342,165 100.00%
Total Positions 0.00 122.24 145.22 160.23 160.24 160.24
FAU-MSEstimated 2016-172015-16 2014-15 2013-142011-12 2012-13

Expenditures % of total Expenditures % of total
Instruction & Research
Positions 64.92 92.21
General Academic Instruction $11,096,694 90.73% $11,370,388 85.87%
Individual or Project Research $7,098 0.06% $0 0.00%
Public Service $0 0.00% $0 0.00%
Academic Advising $0 0.00% $0 0.00%
Computing Support $0 0.00% $0 0.00%
Academic Administration $220,273 1.80% $304,144 2.30%
Total $11,324,065 92.59% $11,674,532 88.16%
Academic Infrastructure Support Orgs.
Positions 0.00 0.00
Cost $0 0.00% $0 0.00%
Institutes & Research Centers
Positions 0 0
Cost $0 0.00% $0 0.00%
Plant Operations & Maintenance
Positions 0.00 0.00
Plant Administration $0 0.00% $0 0.00%
Utilities $906,021 7.41% $1,567,178 11.84%
Building Maintenance $0 0.00% $0 0.00%
Custodial Services $0 0.00% $0 0.00%
Total $906,021 7.41% $1,567,178 11.84%
Admin. Dir. & Support Services
Positions 0 0
General Administration $0 0.00% $0 0.00%
Radio/TV
Positions 0.00 0.00
Public Broadcasting Services $0 0.00% $0 0.00%
Library/Audio Visual
Positions 0.00 0.00
Libraries $0 0.00% $0 0.00%
Audio Visual Services $0 0.00% $0 0.00%
Total $0 0.00% $0 0.00%
Museums & Galleries
Positions 0.00 0.00
Cost $0 0.00% $0 0.00%
Estimated 2016-172015-16FAMU/FSU College of
Engineering

Student Services
EEO/Minority Students
Positions 0.00 0.00
Cost $0 0.00% $0 0.00%
Financial Aid
Positions 0.00 0.00
Cost $0 0.00% $0 0.00%
Career Placement
Positions 0.00 0.00
Cost $0 0.00% $0 0.00%
Other Student Services
Positions 0.00 0.00
Cost $0 0.00% $0 0.00%
Summary Student Services
Total Positions 0.00 0.00
Total $0 0.00% $0 0.00%
Intercollegiate Athletics
Positions
E&G Cost - Title IX $0 0.00% $0 0.00%
E&G Cost - Other $0 0.00% $0 0.00%
Total Educational & General $12,230,086 100.00% $13,241,710 100.00%
Total Positions 64.92 92.21

BOARD OF GOVERNORS GENERAL OFFICE

APPROPRIATION CATEGORY
2015-2016 ACTUAL
EXPENDITURES
2016-2017
ESTIMATED
EXPENDITURES
EXECUTIVE DIRECTION & SUPPORT SERVICES:
SALARIES AND BENEFITS 5,944,250$ 6,396,369$
OTHER PERSONAL SERVICES 54,698$ 72,095$
EXPENSES 664,277$ 922,128$
OPERATING CAPITAL OUTLAY 17,822$ 17,732$
CONTRACTED SERVICES 260,089$ 738,127$
HUMAN RESOURCES 21,736$ 21,736$
RISK MANAGEMENT INSURANCE 11,937$ 11,937$
NORTHWEST REGIONAL DATA CENTER 128,580$ 123,516$
TOTAL EXECUTIVE DIRECTION & SUPPORT SERVICES: 7,103,389$ 8,303,640$
TOTAL BY FUND
GENERAL REVENUE 6,236,074$ 7,278,203$
FACILITIES CONSTRUCTION ADMIN TRUST FUND 865,927$ 1,005,241$
OPERATIONS & MAINTENANCE TRUST FUND 1,388$ 20,196$
FEDERAL GRANTS TRUST FUND - DOE -$ -$
TOTAL: 7,103,389$ 8,303,640$

CONTRACTS AND GRANTS

CONTRACTS AND GRANTS
The Contracts and Grants budget contains activities in support of research,
public service, and training. These activities are funded with awards from
federal, state, local, and private resources.
Each university has established budget to support anticipated grant
activities for 2016-2017 and to cover encumbrances from June 30, 2016. A total
budget for 2016-2017 of $2,214,716,136, a 3 percent decrease from actual 2015-
2016 expenditures, has been established.

STATE UNIVERSITY SYSTEM OF FLORIDA
CONTRACTS AND GRANTS
2016-2017
EXPENDITURES
2015-2016 2016-2017 % CHANGE
2015-2016 ACTUAL 2016-2017 ESTIMATED FROM 2015-2016
UNIVERSITY POSITIONS EXPENDITURES POSITIONS EXPENDITURES TO 2016-2017
----------------------------------- -------------- -------------------- -------------- --------------------- ---------------------
University of Florida 4,596.59 1,319,847,540$ 4,532.60 1,186,315,494$ -10.12%
Florida State University 901.35 190,657,096$ 861.39 209,167,256$ 9.71%
Florida A&M University 487.86 45,798,866$ 476.43 53,647,869$ 17.14%
University of South Florida 2,213.52 366,958,129$ 2,164.74 368,023,590$ 0.29%
Florida Atlantic University 377.29 53,228,117$ 377.29 60,514,704$ 13.69%
University of West Florida 99.16 21,192,378$ 103.26 21,675,261$ 2.28%
University of Central Florida 846.02 142,099,375$ 838.31 160,694,000$ 13.09%
Florida International University 861.61 126,459,667$ 847.26 121,834,350$ -3.66%
University of North Florida 252.35 9,410,214$ 237.84 10,359,209$ 10.08%
Florida Gulf Coast University 86.85 13,049,740$ 86.94 18,051,137$ 38.33%
New College of Florida 18.85 2,856,138$ 20.12 3,403,266$ 19.16%
Florida Polytech University 0.65 1,519,722$ 0.50 1,030,000$ -32.22%
-------------- -------------------- -------------- -------------------- -----------
Totals : 10,742.10 2,293,076,982$ 10,546.68 2,214,716,136$ -3.42%
======== =========== ======== =========== ======

State University System of FloridaContracts and Grant ExpendituresActual 2007-08 through 2015-16; Estimated 2016-17
$1,720$1,813
$1,893 $1,962 $1,991$2,068
$2,165
$2,293$2,214
$0
$500
$1,000
$1,500
$2,000
$2,500
2008-09 2009-10 2010-11 2011-12 2012-13 2013-14 2014-15 2015-16 2016-17
Millions

AUXILIARY ENTERPRISES

AUXILIARY ENTERPRISES
Auxiliary Enterprises are university operations that are self-supporting
through fees, payments and charges. Student housing, food services, bookstores,
student health centers, transportation and parking services, facilities
management, and computer support are among the major services provided to
and supported by the students and staff.
Each year, the universities establish an auxiliary budget to support
anticipated growth for their auxiliary units. A total estimated budget for 2016-
2017 of $1,572,019,139, a 15 percent increase over actual 2015-2016 expenditures,
has been established.
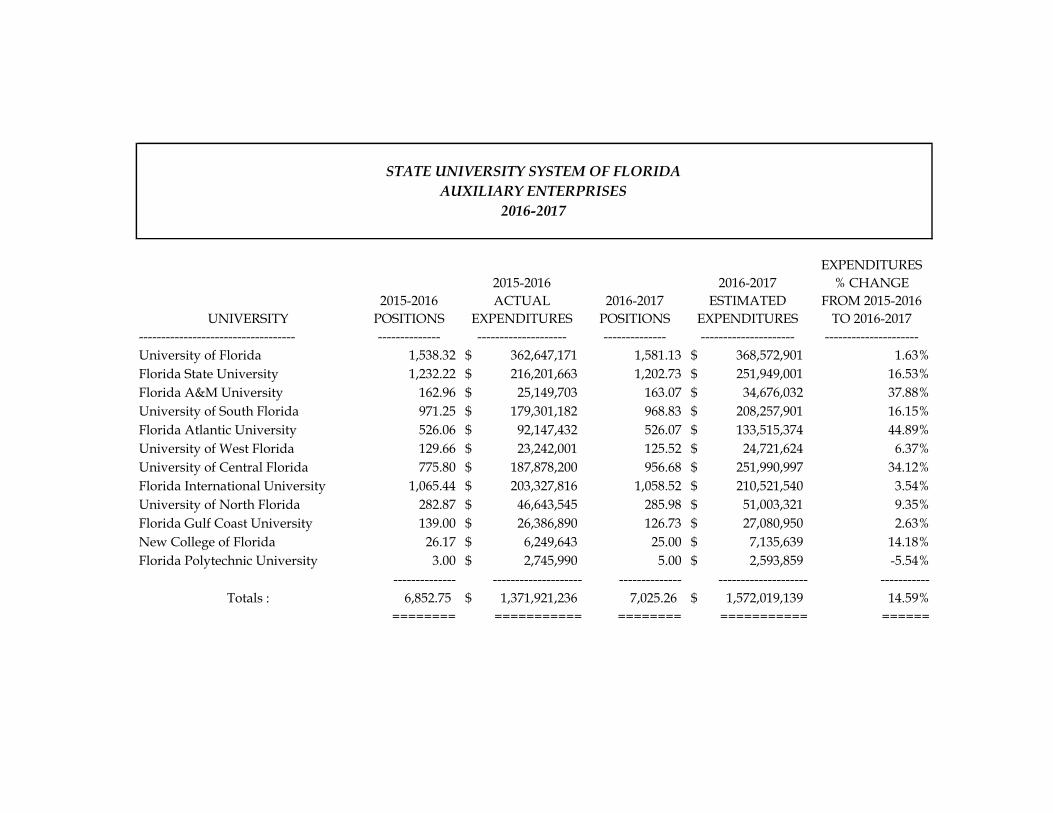
STATE UNIVERSITY SYSTEM OF FLORIDA
AUXILIARY ENTERPRISES
2016-2017
EXPENDITURES
2015-2016 2016-2017 % CHANGE
2015-2016 ACTUAL 2016-2017 ESTIMATED FROM 2015-2016
UNIVERSITY POSITIONS EXPENDITURES POSITIONS EXPENDITURES TO 2016-2017
----------------------------------- -------------- -------------------- -------------- --------------------- ---------------------
University of Florida 1,538.32 362,647,171$ 1,581.13 368,572,901$ 1.63%
Florida State University 1,232.22 216,201,663$ 1,202.73 251,949,001$ 16.53%
Florida A&M University 162.96 25,149,703$ 163.07 34,676,032$ 37.88%
University of South Florida 971.25 179,301,182$ 968.83 208,257,901$ 16.15%
Florida Atlantic University 526.06 92,147,432$ 526.07 133,515,374$ 44.89%
University of West Florida 129.66 23,242,001$ 125.52 24,721,624$ 6.37%
University of Central Florida 775.80 187,878,200$ 956.68 251,990,997$ 34.12%
Florida International University 1,065.44 203,327,816$ 1,058.52 210,521,540$ 3.54%
University of North Florida 282.87 46,643,545$ 285.98 51,003,321$ 9.35%
Florida Gulf Coast University 139.00 26,386,890$ 126.73 27,080,950$ 2.63%
New College of Florida 26.17 6,249,643$ 25.00 7,135,639$ 14.18%
Florida Polytechnic University 3.00 2,745,990$ 5.00 2,593,859$ -5.54%
-------------- -------------------- -------------- -------------------- -----------
Totals : 6,852.75 1,371,921,236$ 7,025.26 1,572,019,139$ 14.59%
======== =========== ======== =========== ======

State University System of FloridaAuxiliary Expenditures
Actual 2008-2009 through 2015-2016; Estimated 2016-2017
$923
$979
$1,054$1,095
$1,165
$1,287
$1,356$1,372
$1,572
$0
$200
$400
$600
$800
$1,000
$1,200
$1,400
$1,600
$1,800
2008-09 2009-10 2010-11 2011-12 2012-13 2013-14 2014-15 2015-16 2016-17
Millions

LOCAL FUNDS

STATE UNIVERSITY SYSTEM OF FLORIDA
LOCAL FUNDS
2016-2017
EXPENDITURES
2015-2016 2016-2017 % CHANGE
ACTUAL ESTIMATED FROM 2015-2016
EXPENDITURES EXPENDITURES TO 2016-2017
Student Activity 113,840,977$ 129,670,783$ 13.91%
Student Financial Aid 1,944,862,679$ 2,020,626,152$ 3.90%
Concessions 3,612,126$ 4,783,326$ 32.42%
Intercollegiate Athletics 377,117,848$ 388,836,674$ 3.11%
Technology Fee 49,872,148$ 56,311,916$ 12.91%
Board Approved Fees 3,215,717$ 6,680,199$ 100.00%
Self-Insurance Programs 14,933,792$ 23,136,455$ 54.93%-------------------- -------------------- -----------
Total 2,507,455,287$ 2,630,045,505$ 4.89%============ ============ ======
The Local Funds budget entity for the universities contains operating resources for the seven
specific areas above. The Universities have established budget to support anticipated growth for
these operations. A total estimated budget for 2016-2017 of $2,630,045,505, a 5 percent increase
over actual 2015-2016 expenditures, has been established.

EXPENDITURES
2015-2016 2016-2017 % CHANGE
ACTUAL ESTIMATED FROM 2015-2016
UNIVERSITY EXPENDITURES EXPENDITURES TO 2016-2017
University of Florida 17,384,469$ 18,283,986$ 5.17%
Florida State University 17,627,551$ 19,149,280$ 8.63%
Florida A&M University 2,153,365$ 1,433,020$ -33.45%
University of South Florida 16,025,795$ 22,316,337$ 39.25%
Florida Atlantic University 4,080,913$ 5,162,711$ 26.51%
University of West Florida 3,386,999$ 2,958,530$ -12.65%
University of Central Florida 20,384,304$ 23,750,000$ 16.51%
Florida International University 17,583,106$ 19,871,967$ 13.02%
University of North Florida 10,874,607$ 11,494,277$ 5.70%
Florida Gulf Coast University 3,622,203$ 3,837,011$ 5.93%
New College of Florida 450,525$ 394,921$ -12.34%
Florida Polytechnic University 267,140$ 1,018,743$ 281.35%---------------- ---------------- -----------
Total 113,840,977$ 129,670,783$ 13.91%
========= ========= ======
These resources are generated primarily from the activity and service fee which each university is authorized to charge its
students as a component of the fee schedule. The level of the fee varies by university, depending on the purposes and
programs for which it is intended to support. Activities commonly supported by these revenues include student
government, cultural events, organizations, intramural/club sports, etc. The level of revenue varies among universities since
the operating philosophies vary by campus. For example, a portion of UF's revenue is deposited into the auxiliary
enterprises budget entity in support of the Reitz Union. Conversly, FSU operates its student union within the student
activity budget.
STATE UNIVERSITY SYSTEM OF FLORIDA
STUDENT ACTIVITIES
2016-2017

State University System of FloridaStudent Activities
Actual 2008-09 through 2015-16; Estimated 2016-17
$78.6$82.8
$91.0$94.8
$98.4
$110.7$111.8 $113.8
$129.7
$0.0
$10.0
$20.0
$30.0
$40.0
$50.0
$60.0
$70.0
$80.0
$90.0
$100.0
$110.0
$120.0
$130.0
$140.0
2008-09 2009-10 2010-11 2011-12 2012-13 2013-14 2014-15 2015-16 2016-17
Millions

EXPENDITURES
2015-2016 2016-2017 % CHANGE
ACTUAL ESTIMATED FROM 2015-2016
UNIVERSITY EXPENDITURES EXPENDITURES TO 2016-2017
University of Florida 439,644,459$ 439,422,997$ -0.05%
Florida State University 126,127,771$ 137,432,771$ 8.96%
Florida A&M University 44,211,158$ 46,777,227$ 5.80%
University of South Florida 372,206,438$ 373,437,094$ 0.33%
Florida Atlantic University 191,943,754$ 193,232,138$ 0.67%
University of West Florida 83,135,057$ 83,000,000$ -0.16%
University of Central Florida 473,882,139$ 513,219,163$ 8.30%
Florida International University 155,660,055$ 161,088,250$ 3.49%
University of North Florida 30,276,542$ 37,502,095$ 23.87%
Florida Gulf Coast University 24,484,336$ 24,568,873$ 0.35%
New College of Florida 4,142,661$ 4,399,851$ 6.21%
Florida Polytechnic University (851,691)$ 6,545,693$ 868.55%-------------------- -------------------- -----------
Total 1,944,862,679$ 2,020,626,152$ 3.90%=========== =========== ======
The budget for this activity represents the amounts for which the university is fiscally accountable. The variances in the
level of financial aid among the universities relates to the various operational philosophies and the manner in which the
accounting records are maintained, as well as the mix among the sources of aid. Section 1009.24(6), Florida Statutes,
requires that "a minimum of 75 percent of funds from the student financial aid fee for new financial aid awards shall be
used to provide financial aid based on absolute need."
STATE UNIVERSITY SYSTEM OF FLORIDA
STUDENT FINANCIAL AID
2016-2017

State University System of FloridaFinancial Aid Expenditures
Actual 2008-09 through 2015-16; Estimated 2016-17
$1,133
$1,205
$1,409 $1,663 $1,880 $1,897 $1,950 $1,945$2,021
$0
$500
$1,000
$1,500
$2,000
$2,500
2008-09 2009-10 2010-11 2011-12 2012-13 2013-14 2014-15 2015-16 2016-17
Millions

EXPENDITURES
2015-2016 2016-2017 % CHANGE
ACTUAL ESTIMATED FROM 2015-2016
UNIVERSITY EXPENDITURES EXPENDITURES TO 2016-2017
University of Florida 591,506$ 759,094$ 28.33%
Florida State University 502,530$ 473,999$ -5.68%
Florida A&M University 155,083$ 295,815$ 90.75%
University of South Florida 428,116$ 774,076$ 80.81%
Florida Atlantic University 505,241$ 445,000$ -11.92%
University of West Florida 97,883$ 71,418$ -27.04%
University of Central Florida 410,825$ 750,000$ 82.56%
Florida International University 643,116$ 896,350$ 39.38%
University of North Florida 205,136$ 225,574$ 9.96%
Florida Gulf Coast University 69,955$ 80,000$ 14.36%
New College of Florida -$ 2,000$ 100.00%
Florida Polytechnic University 2,735$ 10,000$ 265.63%-------------- -------------- ---------
Total 3,612,126$ 4,783,326$ 32.42%======== ======== =====
Concession revenues are royalties that are generated from various vending machines located throughout the campus of the
universities. Since the methods of operation vary among universities, the level of revenues differ. For example, a university
may have fewer vending machines because strategically located food service units serve most of its needs. In turn, revenues
generated from concession actitivities are mainly used to pay the cost of operating the vending machines on campus. These
resources are also allocated to various academic, administrative, and student units on campus to fund a variety of activities
such as student recruitment and retention programs; faculty, staff and student recognition programs and various
organizations and events.
STATE UNIVERSITY SYSTEM OF FLORIDA
CONCESSIONS
2016-2017

State University System of FloridaConcession Expenditures
Actual 2008-09 through 2015-16; Estimated 2016-17
$3.2 $3.1
$3.4
$3.2
$3.4
$3.8 $3.7
$3.6
$4.7
$0.0
$0.5
$1.0
$1.5
$2.0
$2.5
$3.0
$3.5
$4.0
$4.5
$5.0
2008-09 2009-10 2010-11 2011-12 2012-13 2013-14 2014-15 2015-16 2016-17
Millions

STATE UNIVERSITY SYSTEM OF FLORIDA
INTERCOLLEGIATE ATHLETICS
2016-2017
EXPENDITURES
2015-2016 2016-2017 % CHANGE
ACTUAL ESTIMATED FROM 2015-2016
UNIVERSITY EXPENDITURES EXPENDITURES TO 2016-2017
University of Florida 119,745,222$ 119,666,480$ -0.07%
Florida State University 85,560,507$ 91,090,062$ 6.46%
Florida A&M University 9,490,150$ 8,937,500$ -5.82%
University of South Florida 41,043,842$ 40,140,918$ -2.20%
Florida Atlantic University 23,845,409$ 27,105,033$ 13.67%
University of West Florida 5,310,438$ 5,217,253$ -1.75%
University of Central Florida 46,707,886$ 48,071,625$ 2.92%
Florida International University 24,783,590$ 28,328,269$ 14.30%
University of North Florida 9,968,236$ 9,403,898$ -5.66%
Florida Gulf Coast University 10,662,568$ 10,875,636$ 2.00%
Florida Polytechnic University -$ -$ 0.00%------------------ ------------------ ---------
Total 377,117,848$ 388,836,674$ 3.11%========== ========== =====
Revenues to support this activity are primarily derived from sporting event ticket sales and the student
athletic fee that each university is authorized to collect as a component of the fee schedule. Revenues are
expended towards travel expenses, advertising, salaries and benefits and scholarships for student
athletics.

State University System of FloridaIntercollegiate Athletic Expenditures
Actual 2008-09 through 2015-16; Estimated 2016-17
$259.4 $266.7
$282.7$295.7
$307.9$323.9
$358.5
$377.1
$388.8
$0
$50
$100
$150
$200
$250
$300
$350
$400
$450
2008-09 2009-10 2010-11 2011-12 2012-13 2013-14 2014-15 2015-16 2016-17
Millions

STATE UNIVERSITY SYSTEM OF FLORIDA
TECHNOLOGY FEE
2016-2017
EXPENDITURES
2015-2016 2016-2017 % CHANGE
ACTUAL ESTIMATED FROM 2015-2016
UNIVERSITY EXPENDITURES EXPENDITURES TO 2016-2017
University of Florida 8,627,015$ 6,826,553$ -20.87%
Florida State University 6,005,049$ 5,628,646$ -6.27%
Florida A&M University 2,338,054$ 1,426,328$ -39.00%
University of South Florida 6,196,550$ 13,424,933$ 116.65%
Florida Atlantic University 4,204,573$ 4,607,812$ 9.59%
University of West Florida 1,304,053$ 1,218,118$ -6.59%
University of Central Florida 7,969,234$ 9,100,000$ 14.19%
Florida International University 9,426,315$ 9,841,535$ 4.40%
University of North Florida 2,002,861$ 2,117,046$ 5.70%
Florida Gulf Coast University 1,680,559$ 1,692,000$ 0.68%
New College of Florida 116,841$ 149,584$ 28.02%
Florida Polytechnic University 1,044$ 279,361$ 26658.72%-------------------- -------------------- -----------
Total 49,872,148$ 56,311,916$ 12.91%=========== =========== ======
Revenues generated from this student fee are to be used to enhance instructional technology
resources for students and faculty, as authorized in F.S. 1009.24(13).

State University System of FloridaTechnology Fee Expenditures
Actual 2010-11 through 2015-16; Estimated 2016-17
$31.0
$42.5
$51.0$48.4
$50.1 $49.8
$56.0
$0.0
$10.0
$20.0
$30.0
$40.0
$50.0
$60.0
$70.0
2010-11 2011-12 2012-13 2013-14 2014-15 2015-16 2016-17
Millions

STATE UNIVERSITY SYSTEM OF FLORIDA
BOARD APPROVED FEES
2016-2017
EXPENDITURES
2015-2016 2016-2017 % CHANGE
ACTUAL ESTIMATED FROM 2015-2016
UNIVERSITY EXPENDITURES EXPENDITURES TO 2016-2017
University of South Florida 613,145$ 3,905,767$ 537.01%
University of West Florida 113,307$ 140,182$ 23.72%
Florida International University 419,755$ 420,000$ 0.06%
University of North Florida 2,052,702$ 2,159,550$ 5.21%
New College of Florida 16,808$ 54,700$ 225.44%-------------------- -------------------- --------------------
Total 3,215,717$ 6,680,199$ 107.74%=========== =========== ===========
Resources generated from these local fees are to be utilized to meet student-based needs not
currently being met through existing university services, operations, or another fee. For
fiscal year 2016-17, only Florida A&M University, University of South Florida, University of West Florida,
Florida International University, University of North Florida, and New College of Florida have received
Board of Governors approval to assess this type of student fee.

State University System of FloridaBoard-Approved Fees Expenditures
Actual 2012-13 through 2015-16; Estimated 2016-17
$3.5
$2.9
$3.4$3.2
$6.7
$0.0
$1.0
$2.0
$3.0
$4.0
$5.0
$6.0
$7.0
2012-13 2013-14 2014-15 2015-16 2016-17
Millions

EXPENDITURES2015-2016 2016-2017 % CHANGE
ACTUAL ESTIMATED FROM 2015-2016
UNIVERSITY EXPENDITURES EXPENDITURES TO 2016-2017
University of Florida 9,063,622$ 14,791,637$ 63.20%
University of South Florida 5,640,775$ 7,575,293$ 34.30%
University of Central Florida 229,395$ 769,525$ 235.46%---------------- ---------------- ------------
Total 14,933,792$ 23,136,455$ 54.93%
========= ========= =====
The budgets for the University of Florida, the University of South Florida, the University of Central Florida, and Florida
International University include self-insurance programs (authorized by Section 1004.24 F.S.) as directed by the respective
self-insurance councils and the captive insurance companies. These activities are supported by fees charged to the
insured individuals and entities (primarily medical faculty and institutions).
STATE UNIVERSITY SYSTEM OF FLORIDA
SELF-INSURANCE PROGRAMS
2016-2017

State University System of FloridaSelf Insurance Expenditures
UF-HSC, USF-HSC, UCF-MS, & FIU-MSActual 2008-09 through 2015-16; Estimated 2016-17
$27.9$32.3
$31.2
$35.4
$30.0
$15.3
$19.6
$14.9
$23.1
$0
$5
$10
$15
$20
$25
$30
$35
$40
$45
2008-09 2009-10 2010-11 2011-12 2012-13 2013-14 2014-15 2015-16 2016-17
Millions

FACULTY PRACTICE PLANS

FACULTY PRACTICE PLANS The Faculty Practice Plan budget contains data related to not-for-profit corporations organized to collect and
distribute to the University of Florida, University of South Florida, Florida State University, University of Central Florida,
and Florida International University health science and medical centers’ income from faculty billings for patient services.
These patient services are provided in conjunction with the educational and research programs of the health science and
medical centers. The total estimated 2016-2017 Faculty Practice Plan expenditures for the system is $536,158,752.
The University of Florida (UF) has established a Faculty Practice Plan budget for 2016-2017 of $292,977,972, a 13
percent increase over actual 2015-2016 expenditures. During the 2008-2009 fiscal year the University of Florida Health
Center changed the reporting methodology for the Academic Enrichment Fund (AEF), which has historically been reported
as a component of the UF Faculty Practice Plan corporations. All AEF fiscal activity is now reported in UF’s Contracts and
Grants budget entity, significantly reducing the Faculty Practice Plan budget when compared to previous periods.
The University of South Florida has established a total budget for 2016-2017 of $228,290,197, which represents a 10
percent increase from actual 2015-2016 expenditures. Florida State University has established a total budget for 2016-2017
of $2,195,716, a decrease of 66 percent over actual 2015-2016 expenditures. The University of Central Florida has established
a total budget for 2016-2017 of $8,065,855, an increase of 56 percent over actual 2015-2016 expenditures. Florida International
University has established a total budget for 2016-2017 of $4,629,012, an increase of 35 percent from actual 2015-2016
expenditures.

2015-16 2016-17 2015-16 2016-17 2015-16 2016-17 2015-16 2016-17 2015-16 2016-17
EXPENDITURE CATEGORY ACTUAL ESTIMATE ACTUAL ESTIMATE ACTUAL ESTIMATE ACTUAL ESTIMATE ACTUAL ESTIMATE
----------------- ----------------- ----------------- ----------------- ----------------- ----------------- ----------------- ----------------- ----------------- -----------------
SALARIES AND BENEFITS 102,597,000$ 108,128,000$ 5,053,116$ 2,132,120$ 142,190,257$ 157,564,065$ 3,255,342$ 5,218,937$ -$ -$
OTHER PERSONAL SERVICES -$ -$ 1,299,038$ 61,500$ 3,193,978$ 2,854,860$ -$ -$ -$ -$
EXPENSES 147,371,030$ 172,360,100$ 103,896$ 2,096$ 61,952,797$ 67,871,272$ 1,920,966$ 2,846,918$ 3,224,344$ 4,462,242$
OPERATING CAPITAL OUTLAY 7,101,069$ 10,903,051$ -$ -$ -$ -$ -$ -$ 34,104$ -$
DEBT SERVICE 650,863$ -$ -$ -$ -$ -$ -$ -$ 172,679$ 166,770$
FINANCING EXPENSE 1,543,671$ 1,586,821$ -$ -$ -$ -$ -$ -$ -$ -$
------------------- ------------------- ------------------- ------------------- ------------------- ------------------- ------------------- ------------------- ------------------- -------------------
TOTAL 259,263,633$ 292,977,972$ 6,456,050$ 2,195,716$ 207,337,032$ 228,290,197$ 5,176,308$ 8,065,855$ 3,431,127$ 4,629,012$
=========== =========== =========== =========== =========== =========== =========== =========== =========== ===========
STATE UNIVERSITY SYSTEM OF FLORIDA
FACULTY PRACTICE PLANS
2016-2017 OPERATING BUDGET
DETAIL SUMMARY
UF FSU USF UCF FIU
HEALTH SCIENCE CENTER MEDICAL SCHOOL HEALTH SCIENCE CENTER MEDICAL SCHOOL MEDICAL SCHOOL

State University System of FloridaFaculty Practice Plan Expenditures
UF-HSC, USF-HSC, and FSU, UCF & FIU Medical SchoolsActual 2008-09 through 2015-16; Estimated 2016-17
$277.2$298.7* $303.8
$342.5$362.1
$382.9
$448.7
$481.7
$536.2
$0
$100
$200
$300
$400
$500
$600
2008-09 2009-10 2010-11 2011-12 2012-13 2013-14 2014-15 2015-16 2016-17
Millions
* The University of Florida Health Center changed the reporting methodology for the Academic Enrichment Fund (AEF), which has historically
been reported as a component of the UF Faculty Practice Plan corporations, during fiscal year 2008-2009. All AEF fiscal activity is now reported
in UF’s Contracts and Grants budget entity. This change has a material effect on the traditional reporting of Faculty Practice Plan expenditures for
the state university system.