state tax commission of missouri assessor manual …
TRANSCRIPT

STATE TAX COMMISSION OF MISSOURI
ASSESSOR MANUAL
CHAPTER:
RATIO STUDY
REVISION DATE: 10/5/2018 Page 1 of 77
IV – 1
4.0 ASSESSMENT RATIO STUDIES The assessor has the difficult task of preparing an annual assessment roll that accurately reflects the value of all taxable property within the jurisdiction. The assessor is charged with valuing real property (with the exception of agricultural land) at market value. Market Value Definition: Section 137.115, RSMo, requires that property be assessed based upon its true value in money which is defined as the price a property would bring when offered for sale by one willing or desirous to sell and bought by one who is willing or desirous to purchase but who is not compelled to do so (1). True value in money is defined in terms of value in exchange and not value in use (2). It is the fair market value of the subject property on the valuation date (3). Market value is the most probable price in terms of money which a property should bring in competitive and open market under all conditions requisite to a fair sale, the buyer and seller, each acting prudently, knowledgeable and assuming the price is not affected by undue stimulus. Implicit in this definition are the consummation of a sale as of a specific date and the passing of title from seller to buyer under conditions whereby:
1. Buyer and seller are typically motivated.
2. Both parties are well informed and well advised, and both acting in what they consider their own best interests.
3. A reasonable time is allowed for exposure in the open market.
4. Payment is made in cash or its equivalent.
5. Financing, if any, is on terms generally available in the Community at the specified date and typical for the property type in its locale. 6. The price represents a normal consideration for the property sold unaffected by special financing amounts and/or terms, services, fees, costs, or credits incurred in the transaction (4). 1 St. Joe Minerals Corp. v. State Tax Commission, 854 S.W.2d 526, 529 (Mo. App. E.D. 1993); Missouri Baptist Children’s Home v. State Tax Commission, 867 S.W.2d 510, 512 (Mo. banc 1993) 2 Daly v. P. D. George Company, et al, 77 S.W.3d 645, 649 (Mo. App E.D. 2002), citing, Equitable Life Assurance Society v. STC, 852 S.W.2d 376, 380 (Mo. App. 1993); citing, Stephen & Stephen Properties, Inc. v. STC, 499 S.W.2d 798, 801-803 (Mo. 1973) 3 Hermel, Inc. v. STC, 564 S.W.2d 888, 895 (Mo. banc 1978); Chicago, Burlington & Quincy Railroad Co. v. STC, 436 S.W.2d 650, 656 (Mo. 1968); May Department Stores Co. v. STC, 308 S.W.2d 748, 759 (Mo. 1958) 4 Real Estate Appraisal Terminology, Society of Real Estate Appraisers, Revised Edition,1984; See also, Real

STATE TAX COMMISSION OF MISSOURI
ASSESSOR MANUAL
CHAPTER:
RATIO STUDY
REVISION DATE: 10/5/2018 Page 2 of 77
IV – 2
The property tax system is fair and equitable when the assessor produces accurate assessments. The accuracy of appraisals that form the basis for assessments is, therefore, of great concern to the assessor, property owners, political subdivisions (taxing entities), elected officials, and the State Tax Commission. The State Tax Commission Ratio Studies are the fundamental instruments used to measure the accuracy of real property assessments. 4.1 MISSOURI RATIO STUDY’S REQUIREMENTS & CONCEPTS Ratio studies determine the level and uniformity of assessment by comparing the assessor’s value to a market value proxy. As of January 1, 2011 there were approximately 3.28 million parcels of real estate within the State of Missouri. As it is not feasible to test the relationships that exist between the assessor’s value and market value for every taxable parcel in the state, the Commission employs a sampling process that compares a statistically valid number of parcels from each county in order to make statistical inferences about the total population of parcels in each county. In a ratio study, the county’s assessment is either compared to the sale price for recent transactions (sales ratio study) or the county’s assessment is compared to an independent appraisal (appraisal ratio study.) Both are recognized procedures to determine if property tax assessments are fair and equitable. Ratio studies have a variety of uses. At the local level, they can be used to:
1. Monitor assessment performance and thereby identify potential problems with assessment procedures;
2. Improve assessment equity by monitoring the overall level of assessment and the degree of dispersion;
3. Indicate the need for a general reappraisal, or a selective reappraisal of certain property types, groups or neighborhoods; and
4. Assist in market analysis.
At the state level, they can be used: 1. To monitor assessment accuracy; 2. For inter-county and intra-county equalization; 3. To distribute intergovernmental funds, such as the distribution of state funds to local school
districts; 4. To determine the need for a general reassessment; 5. To establish priorities for reappraisal of selected groups of properties; 6. To compute an estimate of the market value of taxable property within a jurisdiction; 7. To adjust appraisals for centrally assessed properties; and 8. To evaluate claims of discrimination within the assessment function.
Estate Valuation in Litigation, J. D. Eaton, M.A.I., American Institute of Real Estate Appraisers, 1982, pp. 4-5; Property Appraisal and Assessment Administration, International Association of Practice, Glossary.

STATE TAX COMMISSION OF MISSOURI
ASSESSOR MANUAL
CHAPTER:
RATIO STUDY
REVISION DATE: 10/5/2018 Page 3 of 77
IV – 3
The end product of a ratio study is that the descriptive statistics allow the analyst to summarize the status of the valuations and to draw conclusions about the tested population. 1. BACKGROUND As early as 1955 the general assembly created statutes that required the State Tax Commission to determine the general level of assessment in each of the state’s 114 counties and the City of St. Louis. Over the years, a number of methods have been employed to establish assessment ratios through varying endeavors and with varied results. In 1975, the State Auditor conducted a statewide sale ratio study to measure the assessment levels of the 114 counties and the City of St. Louis. The study showed a range of ratios from a low of 6.2% to a high of 46.7%. The problems inherent in a one-year sale ratio study subjected the study to considerable criticism; but if nothing else, the report served to point out the fact that there were obviously large disparities among the assessment levels of the counties. As a result of these studies, the legislature directed the Commission to formulate a supportable program to be used to measure the accuracy of the assessment process throughout the state. In 1977, the Commission contracted with the Arthur Young & Company to develop a methodology for conducting statistically valid ratio studies and assisting the Commission in fulfilling its responsibilities and objectives of monitoring the property tax system. In 1979, the State Supreme Court, in Cassily vs. Riley, ordered the Commission to conduct a statewide reassessment. Subsequently each county was directed to plan and implement a reassessment program in order to eliminate the deficiencies in the assessment process. In 1985, the Commission contracted with the University of Missouri-Columbia to review the Commission’s ratio study methodology and to recommend changes. The analysis found the policies and procedures of the state’s study to be consistent with accepted statistical practices. The policies, procedures, and methodology of conducting the studies were also found to be in compliance with the “Standard on Ratio Studies” as published by the International Association of Assessing Officers (IAAO). In 2006, the Commission contracted with the IAAO to re-examine the policies, procedures and methodology of the Commission’s ratio study and to recommend improvements that would allow the Commission to better evaluate the state’s level of assessment and to provide improved guidance to county assessors to ensure that assessments remain current. In 2007, based on the IAAO recommendations, the Commission began using sales ratio studies for residential property, including the Traditional Sales Study and the Progressive Hybrid Study.

STATE TAX COMMISSION OF MISSOURI
ASSESSOR MANUAL
CHAPTER:
RATIO STUDY
REVISION DATE: 10/5/2018 Page 4 of 77
IV – 4
These sales ratio studies replaced the appraisal ratio studies in counties that showed quality sales databases, historically and prospectively. A. MISSOURI RATIO STUDY TECHNICAL ADVISORY GROUP The Missouri Ratio Study Technical Advisory Group (MRSTAG) was formed in 2010 to advise the Commission on its ratio study processes and procedures. The purpose of the Missouri Ratio Study Technical Advisory Group is to review ratio study procedures, discuss relevant issues, and assist the State Tax Commission of Missouri with policies and procedures concerning the ratio study.
Committee Makeup: The Missouri Ratio Study Technical Advisory Group is made up of individuals with a broad background in statistics, ratio studies, appraisal and assessment. The members are approved by the Commission.
The group is comprised of up to five (5) members, in addition to any STC members; one of the five members will be a sitting assessor as a representative of the Missouri State Assessors Association.
Ratio Study Management and the Ratio Study Statistician are permanent members of the committee; the Ratio Study Manager serves as Chair of the committee. Other STC personnel may participate in meetings when appropriate.
The members serve on the MRSTAG on a voluntary basis with no monetary benefit to any member. As of October 1, 2018, the Committee Members were: Dr. Elbert B. Whorton, Jr. Univ. of Texas (retired); StatCom PhD Statistician Dr. Thomas Hamilton Roosevelt University PhD Real Estate and Urban Land Economics Anthony Sackey Kweku MA Economics MO Certified Residential Appraiser
Hon. Tom Schauwecker Boone County Assessor MSAA Representative Ms. Kristen Solindas MO State Tax Commission B.S. (Statistics); Statistician Mr. Jeff Schmidt MO State Tax Commission Local Assistance Asst. Mgr. Mrs. Jan Elliott, Chair MO State Tax Commission Local Assistance Manager
STATE TAX COMMISSION OF MISSOURI
ASSESSOR MANUAL
CHAPTER:
RATIO STUDY
REVISION DATE: 10/5/2018 Page 5 of 77
V5
2. RESPONSIBILITIES AND OBJECTIVES The State Tax Commission of Missouri, as the oversight agency of the assessment function in Missouri, is charged with the responsibility of monitoring the assessment accuracy in each of the 114 counties and the City of St. Louis. This is accomplished by a periodic Assessment Ratio Study. The current analysis is based upon the accepted concepts for statistically valid studies.
Sales studies measure marketable subsets of the entire population and are tested for reliability and adherence to professional standards.
Appraisal studies employ a simple random, representative sample. The sampling methodology currently employed by the Commission identifies the population within each county and subclass. From this population, a random sample is drawn. Appraisals are then completed by the Commission’s staff appraisers to estimate the Market Value for the property. Approximately 25 to 30 parcels are appraised in each subclass.
Hybrid studies combine sales and appraisals for overall results. The objective is to accurately estimate the overall level and uniformity of assessment for each specified subclass of property to determine compliance with constitutional, statutory, and departmental rule requirements. 3. RATIO STUDY CYCLE In 1989, the Commission implemented a two (2) year ratio study cycle in place of an annually conducted study; previously, all subclasses in each of the 115 jurisdictions were completed each year. A two-year ratio study cycle provides several benefits as compared to an annual cycle:
a. It balances the appraisal workload over a longer time period thereby improving the work product. The appraisers have more time to research the market for the data necessary to support their value conclusions.
b. The supplementary time allows for conducting additional market studies (land analysis studies, cost studies, depreciation studies, etc.). These and other in-depth studies are most helpful in the proper valuation of real property.
c. It allows an appropriate amount of time to perform sales studies and allows for control groups of sales occurring after the date of value (January 1, odd year).
Beginning with the 2001 cycle, agricultural studies were scheduled for completion every six years. That is, one-third of the agricultural subclass studies were scheduled for completion during each two year cycle. This practice was deemed necessary due to budget and staffing reductions. Then,
STATE TAX COMMISSION OF MISSOURI
ASSESSOR MANUAL
CHAPTER:
RATIO STUDY
REVISION DATE: 10/5/2018 Page 6 of 77
V6
in the 2007 cycle, Agricultural ratio studies were suspended altogether due to another round of budget and staff reductions. The reasoning in the Commission’s decision lies in the nature of the agricultural assessment process. Agricultural land is assessed based on “use value” not market value as are residential and commercial real estate. The grading and classification of agricultural land is based on observations of the topography, potential for flooding, tree cover and the quality and productivity of the underlying soil. The productivity rating for developing these classifications does not consider the market value of the land; therefore an increasing land value does not translate to an increase in land productivity. Since there is less likelihood of rapid changes in agricultural use value, the original decision to spread these studies over a longer time-frame was deemed reasonable. Paramount in the decision to suspend studies in 2007 was the stable nature of agricultural property productivity values with minimal changes over time, and consideration of the cost benefit analysis, wherein the required resources to do appraisal studies greatly exceeds any notable impact on the assessment process. Agricultural real property accounts for approximately 1.7% (as of 2010) of the total real property value in the state. While no Agricultural studies are currently planned, they can still be completed on an “as needed” basis when warranted. Additionally, agricultural values are monitored as part of the normal duties of the Local Assistance section, and are also tracked through year end reports supplied by the county which would indicate any significant changes requiring additional investigation and scrutiny. For the 2009 ratio cycle, commercial studies were scheduled for completion every four years, with approximately half of the counties being completed in each two year ratio cycle. This practice was deemed necessary due to budget and staffing reductions. In making the decision to extend the time frame for measuring commercial assessments in all Missouri counties, particular scrutiny was given to the complexities and nuances of the commercial real estate market. It generally takes longer to recognize trends in commercial real estate due to the timing of leases and the overall scarcity of sales and income information available at any time, and historical information indicated that commercial assessments had far less variability between cycles than the residential subclass. The State Tax Commission incurred additional budget and staffing reductions. Beginning with the 2015 commercial ratio cycle, seventy-five (75) counties will be completed on a four year ratio cycle with approximately half of the counties being completed in each two year ratio study cycle. Forty (40) counties will be on a six year process with approximately one-third of the counties being completed in each two year ratio study cycle. Counties that are on a six year rotation will be monitored between studies by the Form 11 and 11A, County Index Study, Land Value Studies, Sales Analysis, and 30 commercial parcels to be reviewed by Assessment Representatives/Appraisers in the cycle a commercial ratio is not performed. Additional studies by the Assessment Representative/Appraisers may be conducted if deemed necessary.

STATE TAX COMMISSION OF MISSOURI
ASSESSOR MANUAL
CHAPTER:
RATIO STUDY
REVISION DATE: 10/5/2018 Page 7 of 77
V7
4. STATUTORY ASSESSMENT RATES Once a property is valued by the county, the property’s assessment is calculated. The assessment rates are statutorily set as follows: Residential property assessments reflect 19% of the property’s market value. Agricultural property assessments reflect 12% of the property’s production and/or market value. Commercial property assessments reflect 32% of the property’s market value. These different assessment rates allocate the burden between the three subclasses of real property. 4.2 RATIO STUDY METHODOLOGY A brief description of the various ratio studies conducted by the Commission follows. The Commission’s studies use both sales and appraisals as proxies of market value. The Commission’s Assessment Ratio Study follows the general guidelines and requirements set forth in the Standard on Ratio Studies published by the International Association of Assessing Officers. 1. RESIDENTIAL RATIO STUDY Residential assessments are tested every biennial reassessment (once every two years.) Market value is the basis of value for properties in the residential subclass. There are three types of studies used to determine the level and uniformity of assessment for residential property.
1. Traditional Sales Study – Valid sales representative of the population are used to measure fair market value for comparison to the county’s assessed values.
2. Appraisal Study – Approximately 25 properties with a residential assessment are randomly selected and independently appraised for comparison to the county’s assessed values.
2. AGRICULTURAL RATIO STUDY A random, independent Appraisal Study is the only method currently used by the Commission to determine the level of assessment for the agricultural subclass. Prior to the 2007 assessment cycle, Agricultural assessments were tested once every three biennial reassessments (once every six years.) Approximately 35 properties with an agricultural assessment were randomly selected and independently appraised for comparison to the county’s assessed values. Agricultural studies have been suspended since the 2007 assessment cycle. If future agricultural studies are performed, it is likely that the sample size would be between 20 to 30 properties as the
STATE TAX COMMISSION OF MISSOURI
ASSESSOR MANUAL
CHAPTER:
RATIO STUDY
REVISION DATE: 10/5/2018 Page 8 of 77
V8
STC updated its sample size requirements for appraisal studies in 2009. 3. COMMERCIAL RATIO STUDY A random, independent Appraisal Study is the only method currently used by the Commission to determine the level of assessment for the commercial subclass. Approximately 30 properties with a commercial assessment are randomly selected and independently appraised for comparison to the county’s assessed values. 4.3 DATA REQUIREMENTS In order to perform ratio study analyses of all 115 assessment jurisdictions, the Commission must collect enough information from the counties to facilitate valid and reliable ratio study results. The first step in the ratio study process is to collect information concerning the real estate properties and their assessed values so that they can be analyzed and measured. The Commission makes a universal data request that is the same for each assessment jurisdiction for each ratio study cycle. Generally, the Commission asks for the following data sets:
Assessment roll Building Structure database Sales database
The Commission requires the requested information be submitted in a computer database format. The objective for this requirement is to make the collection of data as efficient as possible. These data sets are described in more detail below. 1. ASSESSMENT ROLL An electronic version of the assessment roll is requested from each county. The information request sent to the county assessor is shown in Exhibit 4-1.
STATE TAX COMMISSION OF MISSOURI
ASSESSOR MANUAL
CHAPTER:
RATIO STUDY
REVISION DATE: 10/5/2018 Page 9 of 77
V9
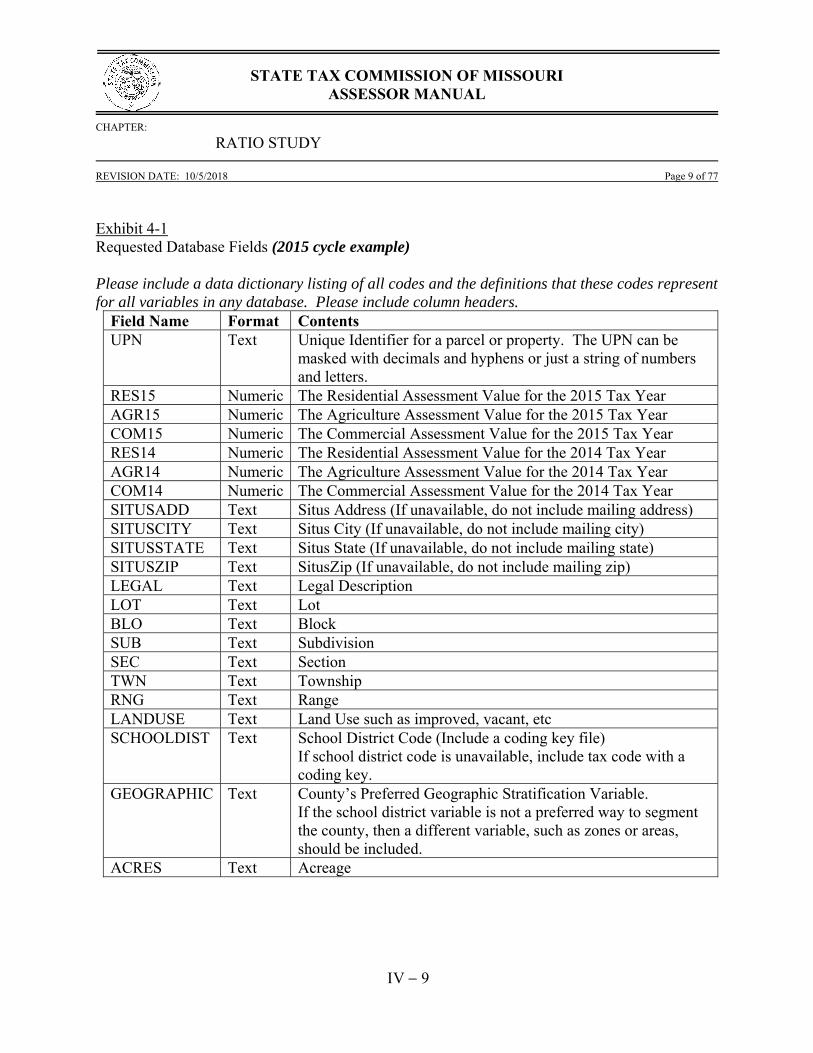
Exhibit 4-1 Requested Database Fields (2015 cycle example) Please include a data dictionary listing of all codes and the definitions that these codes represent for all variables in any database. Please include column headers.
Field Name Format Contents UPN Text Unique Identifier for a parcel or property. The UPN can be
masked with decimals and hyphens or just a string of numbers and letters.
RES15 Numeric The Residential Assessment Value for the 2015 Tax Year AGR15 Numeric The Agriculture Assessment Value for the 2015 Tax Year COM15 Numeric The Commercial Assessment Value for the 2015 Tax Year RES14 Numeric The Residential Assessment Value for the 2014 Tax Year AGR14 Numeric The Agriculture Assessment Value for the 2014 Tax Year COM14 Numeric The Commercial Assessment Value for the 2014 Tax Year SITUSADD Text Situs Address (If unavailable, do not include mailing address) SITUSCITY Text Situs City (If unavailable, do not include mailing city) SITUSSTATE Text Situs State (If unavailable, do not include mailing state) SITUSZIP Text SitusZip (If unavailable, do not include mailing zip) LEGAL Text Legal Description LOT Text Lot BLO Text Block SUB Text Subdivision SEC Text Section TWN Text Township RNG Text Range LANDUSE Text Land Use such as improved, vacant, etc SCHOOLDIST Text School District Code (Include a coding key file)
If school district code is unavailable, include tax code with a coding key.
GEOGRAPHIC Text County’s Preferred Geographic Stratification Variable. If the school district variable is not a preferred way to segment the county, then a different variable, such as zones or areas, should be included.
ACRES Text Acreage
STATE TAX COMMISSION OF MISSOURI
ASSESSOR MANUAL
CHAPTER:
RATIO STUDY
REVISION DATE: 10/5/2018 Page 10 of 77
V10
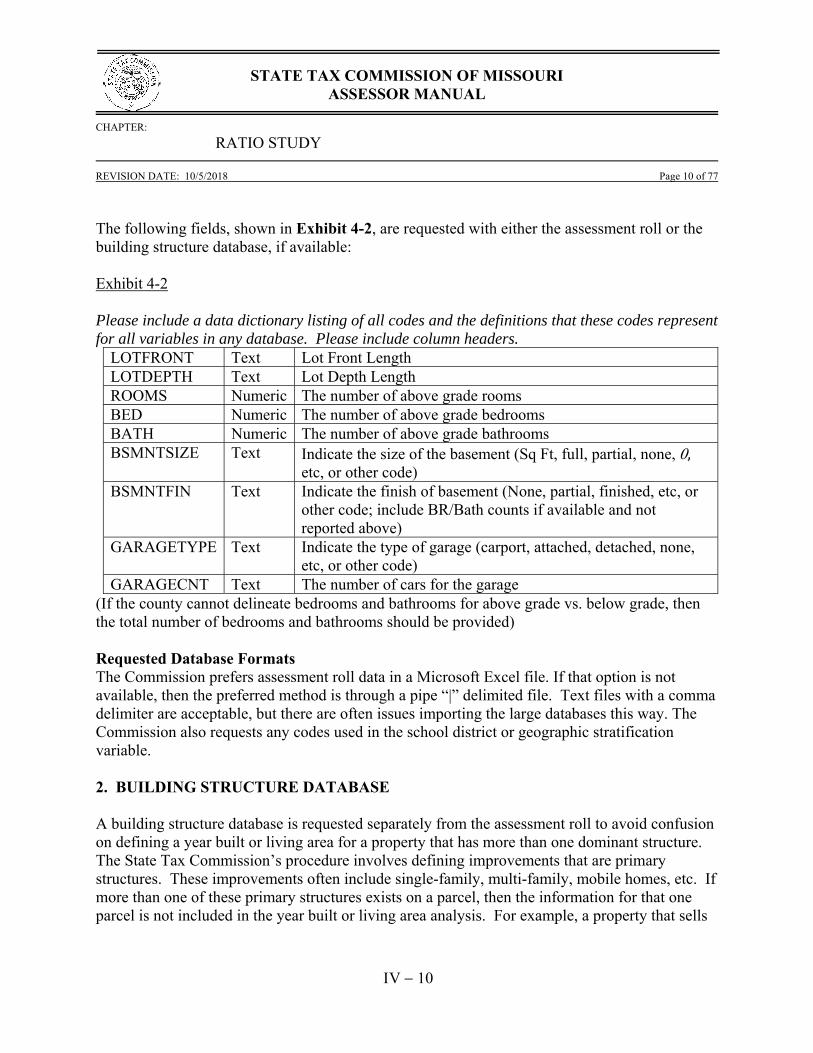
The following fields, shown in Exhibit 4-2, are requested with either the assessment roll or the building structure database, if available: Exhibit 4-2 Please include a data dictionary listing of all codes and the definitions that these codes represent for all variables in any database. Please include column headers.
LOTFRONT Text Lot Front Length LOTDEPTH Text Lot Depth Length ROOMS Numeric The number of above grade rooms BED Numeric The number of above grade bedrooms BATH Numeric The number of above grade bathrooms BSMNTSIZE Text Indicate the size of the basement (Sq Ft, full, partial, none, ,
etc, or other code) BSMNTFIN Text Indicate the finish of basement (None, partial, finished, etc, or
other code; include BR/Bath counts if available and not reported above)
GARAGETYPE Text Indicate the type of garage (carport, attached, detached, none, etc, or other code)
GARAGECNT Text The number of cars for the garage (If the county cannot delineate bedrooms and bathrooms for above grade vs. below grade, then the total number of bedrooms and bathrooms should be provided) Requested Database Formats The Commission prefers assessment roll data in a Microsoft Excel file. If that option is not available, then the preferred method is through a pipe “|” delimited file. Text files with a comma delimiter are acceptable, but there are often issues importing the large databases this way. The Commission also requests any codes used in the school district or geographic stratification variable. 2. BUILDING STRUCTURE DATABASE A building structure database is requested separately from the assessment roll to avoid confusion on defining a year built or living area for a property that has more than one dominant structure. The State Tax Commission’s procedure involves defining improvements that are primary structures. These improvements often include single-family, multi-family, mobile homes, etc. If more than one of these primary structures exists on a parcel, then the information for that one parcel is not included in the year built or living area analysis. For example, a property that sells

STATE TAX COMMISSION OF MISSOURI
ASSESSOR MANUAL
CHAPTER:
RATIO STUDY
REVISION DATE: 10/5/2018 Page 11 of 77
V11
with two or more primary structures is used in the overall statistics and the geographic location stratification, but not in the year built or improved area stratification. Exhibit 4-3 Requested Building Structure Database Fields Please include a data dictionary listing of all codes and the definitions that these codes represent for all variables in any database. Please include column headers.
Field Name Format Contents UPN Text Unique Identifier for a parcel or property. The UPN can be
masked with decimals and hyphens or just a string of numbers and letters
STRUCTURE Text A code that can refer to the type of structure. (Single Family, Duplex, Garage, Utility, etc.)
STYLE Text Descriptive Property Features (1 Story, 2 Story, Split Level, etc) YRBLT Numeric The year the structure was built AREA Numeric The size of the property. Gross living area is preferred if
available. Otherwise, include base area. Adjusted area is not desired.
For some counties, living area may not be an available field. In such a case, reporting base area is preferred. Adjusted area is not desired. The building structure information will be filtered to include only dominant structures. Parcels with one dominant structure will have their detail information paired to the assessment roll for analysis. Requested Database Formats The Commission prefers building data in a Microsoft Excel file. If that option is not available, then the preferred method is through a pipe “|” delimited file. Text files with a comma delimiter are acceptable, but there are often issues importing the large databases this way. The Commission also requests any codes used in the school district or geographic stratification variable. 3. SALES DATABASE A sales database is requested from all counties. The sales database deadline for submission is around April 15th of the even numbered year subsequent to the assessment year. The database should consist of sales between January 1 of the even numbered year preceding the assessment

STATE TAX COMMISSION OF MISSOURI
ASSESSOR MANUAL
CHAPTER:
RATIO STUDY
REVISION DATE: 10/5/2018 Page 12 of 77
V12
year and December 31 of the assessment year (odd numbered year). The minimum fields that should be included are parcel number, sale price, sale date, and validity codes (if applicable). As an example, for the 2015 assessment year, the deadline for submission of the sales database is April 15, 2016. The database will consist of sales between January 1, 2014 and December 31, 2015.
A.Sales Validation and Verification The Commission generally adheres to the IAAO Standard on Ratio Studies in performing ratio studies for each county. The Commission must be able to verify the county’s sales follow IAAO guidelines for validation and verification before sales can be utilized for a sales study. A sales survey is required from each county to verify sales validation and verification procedures. The STC relies on the following IAAO standards and guidelines concerning the validation and verification of sales (all available at www.iaao.org):
IAAO Standard on Ratio Studies (Appendix A) IAAO Standard on Verification and Adjustment of Sales IAAO Guide to Foreclosure-Related Sales and Verification Procedures
Valid Sales
Generally speaking, a valid sale is a transaction that reflects market value where a willing seller offers the property but is not obligated to sell it, and is bought by a person who is willing to purchase but is not forced to do so. A valid sale can also be described as a sale that meets the definition of a market value transaction.
Invalid Sales
Sales Generally Invalid for Ratio Studies (from IAAO publications):
Sales involving government agencies and public utilities Sales involving charitable, religious, or educational institutions Sales involving financial institutions Sales between relatives or corporate affiliates Sales settling an estate Forced sales Sales of doubtful title
STATE TAX COMMISSION OF MISSOURI
ASSESSOR MANUAL
CHAPTER:
RATIO STUDY
REVISION DATE: 10/5/2018 Page 13 of 77
V13
Sales with Special Conditions
The IAAO requires these sales be used with caution and requires substantial verification
before being used for ratio studies. DO NOT use these sales unless certain they are valid:
Trades Partial interests Land contracts Incomplete or unbuilt common property Auctions
B. Requested Sales Database Fields
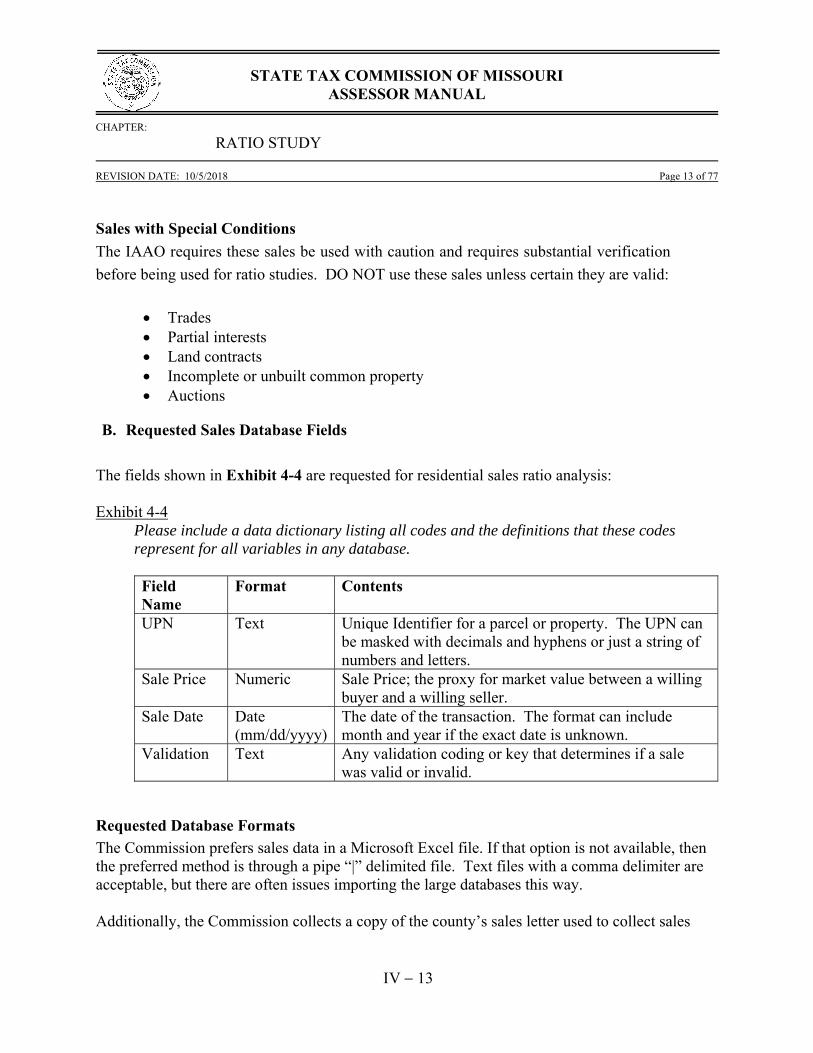
The fields shown in Exhibit 4-4 are requested for residential sales ratio analysis: Exhibit 4-4
Please include a data dictionary listing all codes and the definitions that these codes represent for all variables in any database. Field Name
Format Contents
UPN Text Unique Identifier for a parcel or property. The UPN can be masked with decimals and hyphens or just a string of numbers and letters.
Sale Price Numeric Sale Price; the proxy for market value between a willing buyer and a willing seller.
Sale Date Date (mm/dd/yyyy)
The date of the transaction. The format can include month and year if the exact date is unknown.
Validation Text Any validation coding or key that determines if a sale was valid or invalid.
Requested Database Formats
The Commission prefers sales data in a Microsoft Excel file. If that option is not available, then the preferred method is through a pipe “|” delimited file. Text files with a comma delimiter are acceptable, but there are often issues importing the large databases this way. Additionally, the Commission collects a copy of the county’s sales letter used to collect sales
STATE TAX COMMISSION OF MISSOURI
ASSESSOR MANUAL
CHAPTER:
RATIO STUDY
REVISION DATE: 10/5/2018 Page 14 of 77
V14
information. The Commission also prepares a sales survey that asks the county to explain how they comply with the IAAO guidelines on screening sales; this survey information is collected at the beginning of each ratio study cycle. This information is reviewed to ensure that proper sales screening and validation processes are being followed at the county level. 4. ONLINE DATA PROCESSES To help counties save on costs, all requested material can be sent electronically through a File Transfer Protocol (FTP.) Links are available on the STC website at http://stc.mo.gov/ and secure accounts are available to county officials. 4.4 DATABASE PREPARATION 1. COUNTY INFORMATION An Incoming Data folder contains only the information received from the county; the Assessment Roll, the Building Structures database, and the Sales database.
o Assessment Roll – An electronic source that lists every parcel in the county with their descriptive information, as requested in the description above.
o Building Structure Databases – An electronic source that lists every improvement in the county.
o Sales Databases – An electronic source that lists the information collected by the assessor concerning sold properties.
o Codes – Any codes or data dictionaries received from the counties 2. FORMATTING FILES
The initial step for any file received is to format the file type and Uniform Parcel Number to be legible by any program utilized by the Commission. Additional steps may be needed to process the files since information and formats differ by county. Assessment totals from the received Assessment Roll are verified against the odd numbered year Form 11 and Form 11A to determine the totals per each subclass are accurate.
Within the Building Structure database, non-residential structure codes, unnecessary fields, and duplicate parcels are removed.
The formatted Assessment Roll is merged with the Building Structure Database via the Uniform Parcel Number.
After formatting the Sales Database, the following steps occur:
STATE TAX COMMISSION OF MISSOURI
ASSESSOR MANUAL
CHAPTER:
RATIO STUDY
REVISION DATE: 10/5/2018 Page 15 of 77
V15
o Invalid sales are excluded o Resales (properties that sell more than once) are identified. o Duplicate sales (repeated records) are removed properly. o If a property sells more than one time, then all sale prices must be within 5%
of the minimum sale price, and the sale closest to the January 1st assessment date is used, discarding the others. Otherwise, all sales from that property are removed.
o New construction sales data is flagged for further analysis. o Sale dates are categorized for the different stages of the quality testing.
The formatted Sales Database is merged with the formatted and consolidated Assessment Roll/Building Structure Database file via the Uniform Parcel Number.
4.5 RANDOM SAMPLING PROCESS A formatted assessment roll is generated for the residential and commercial subclass. The file is sorted in Uniform Parcel Number order. If the county identifies tax exempt properties in their database information, then the Commission will remove those parcels prior to sampling. If tax exempt properties are not identified by the county, then those properties will be omitted later in the process when identified by the statistician or the appraiser, but after the sampling procedure. A random sample for each of the three subclasses is generated. Each property that has an assessment of the subclass being tested has an equal chance of selection. Approximately 25 (residential) or 30 (commercial) randomly selected properties will be appraised by an employee from the State Tax Commission. 1. STRATIFIED RANDOM SAMPLING PROCESS FOR APPRAISAL STUDIES Based on the assistance and recommendations of the MO Ratio Study Technical Advisory Group, the STC implemented stratified random sampling for appraisal studies in the 2011 cycle. The benefit of stratified random sampling is more stability in the random sampling process, which should benefit the overall ratio study analysis.
The stratification procedure is based on the assessed value of the parcel population for both the residential and commercial subclass. The parcel population is stratified into four quartiles as follows:
1st Quartile: Low to Low/Middle value properties 2nd Quartile: Low/Middle to Middle value properties

STATE TAX COMMISSION OF MISSOURI
ASSESSOR MANUAL
CHAPTER:
RATIO STUDY
REVISION DATE: 10/5/2018 Page 16 of 77
V16
3rd Quartile: Middle to Middle/High value properties 4th Quartile: Middle/High to High value properties
The overall sample sizes for appraisal studies is as follows:
25 appraisals for residential studies 30 appraisals for commercial studies
Since the total number of samples is not divisible by four, for either residential or commercial appraisal studies, there will be slightly different numbers of samples pulled from each stratum (quartile) as shown below:
1st Quartile 2nd
Quartile 3rd Quartile 4th Quartile # of samples # of samples # of samples # of samples Total samples Residential 6 6 7 6 25 Commercial 7 8 8 7 30
Because there is one more sample in some strata than in others, the Commission is purposefully choosing to include more samples in the 2nd and 3rd quartiles (in the middle) rather than the 1st and 4th quartiles (low and high ends).
The result is a completely random selection of samples for the appraisal ratio study. Every parcel within each stratum (quartile), and subsequently every sample in the parcel population, has an equal chance of being selected for the ratio study.
Statistics will only be performed on the total number of samples and there will be no statistical analysis of any of the individual strata (quartiles).
Assessors should not notice any changes in State Tax Commission operations and will have no additional requirements to implement these new sampling procedures. The following screenshots of fictitious data demonstrate how stratified random sampling is applied.

STATE TAX COMMISSION OF MISSOURI
ASSESSOR MANUAL
CHAPTER:
RATIO STUDY
REVISION DATE: 10/5/2018 Page 17 of 77
V17
Exhibit 4-5: Data received from a County:
Exhibit 4-6: Residential Assessment Roll includes all samples with a residential assessed value:

STATE TAX COMMISSION OF MISSOURI
ASSESSOR MANUAL
CHAPTER:
RATIO STUDY
REVISION DATE: 10/5/2018 Page 18 of 77
V18
Exhibit 4-7: Using Excel, insert a column for random numbers:
Exhibit 4-8: Add columns before the RandomNumber column, and re-label as needed. The columns needed for the random sampling are, in order: Cnty ID, Sample, Book, Control, UPN, Res13, AGR13, COM13, Name1, Name2, SitusAddress1, SitusAddress2, SitusAddress3, SitusCity, Section, Township, Range, Acres, Lotsize, Legal.

STATE TAX COMMISSION OF MISSOURI
ASSESSOR MANUAL
CHAPTER:
RATIO STUDY
REVISION DATE: 10/5/2018 Page 19 of 77
V19
Exhibit 4-9: Create four tabs at the bottom of the page, TabA, TabB, TabC, and TabD.
Exhibit 4-10: Sort the data by the RES13 column.
Exhibit 4-11: Sort the data by the Control column (formerly the RandomNumber column).
STATE TAX COMMISSION OF MISSOURI
ASSESSOR MANUAL
CHAPTER:
RATIO STUDY
REVISION DATE: 10/5/2018 Page 20 of 77
V20
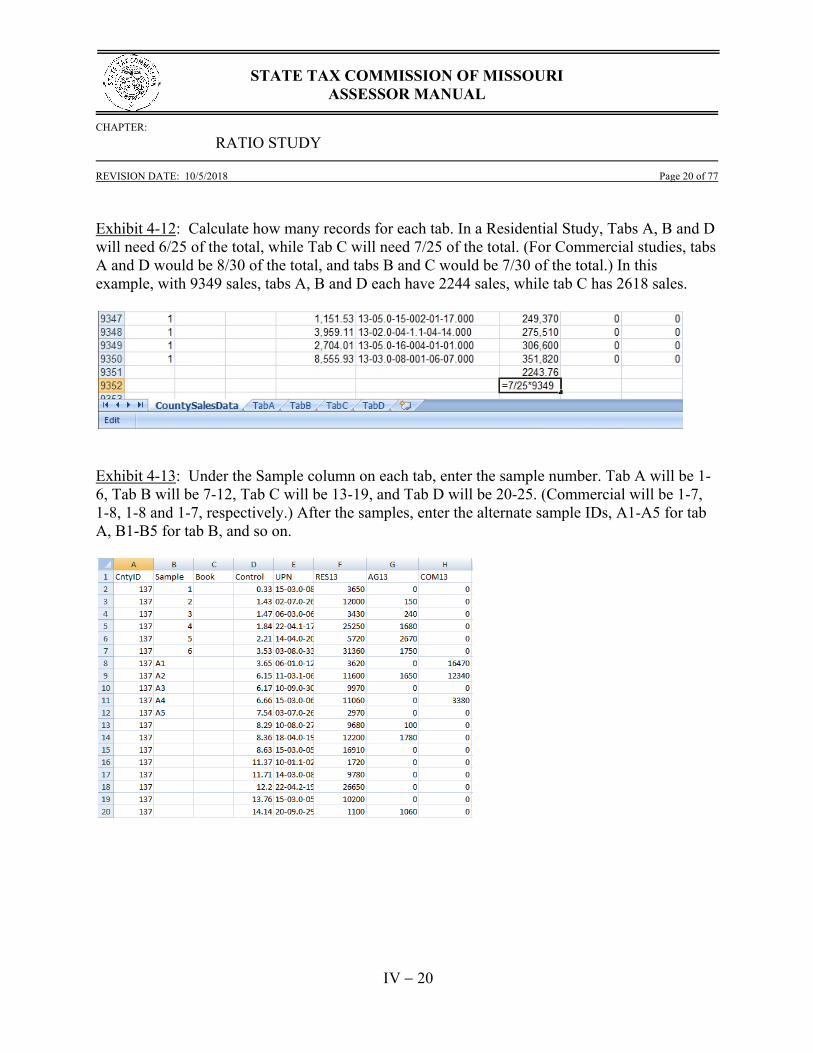
Exhibit 4-12: Calculate how many records for each tab. In a Residential Study, Tabs A, B and D will need 6/25 of the total, while Tab C will need 7/25 of the total. (For Commercial studies, tabs A and D would be 8/30 of the total, and tabs B and C would be 7/30 of the total.) In this example, with 9349 sales, tabs A, B and D each have 2244 sales, while tab C has 2618 sales.
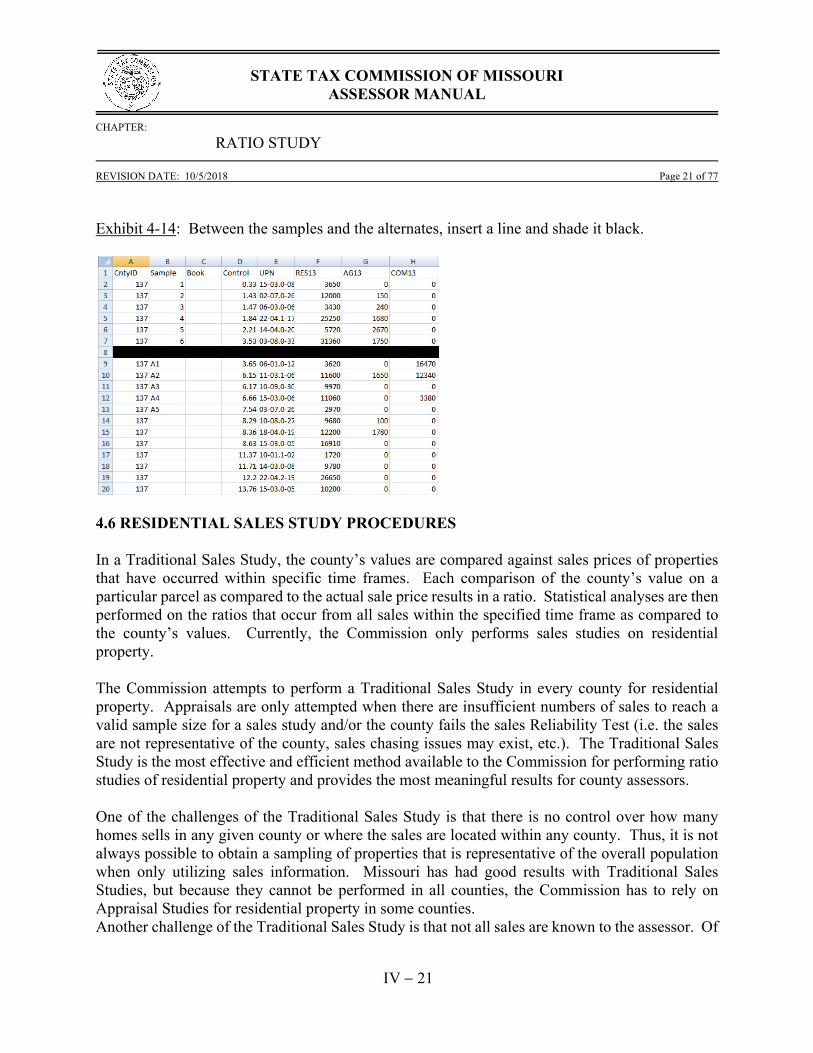
Exhibit 4-13: Under the Sample column on each tab, enter the sample number. Tab A will be 1-6, Tab B will be 7-12, Tab C will be 13-19, and Tab D will be 20-25. (Commercial will be 1-7, 1-8, 1-8 and 1-7, respectively.) After the samples, enter the alternate sample IDs, A1-A5 for tab A, B1-B5 for tab B, and so on.
STATE TAX COMMISSION OF MISSOURI
ASSESSOR MANUAL
CHAPTER:
RATIO STUDY
REVISION DATE: 10/5/2018 Page 21 of 77
V21
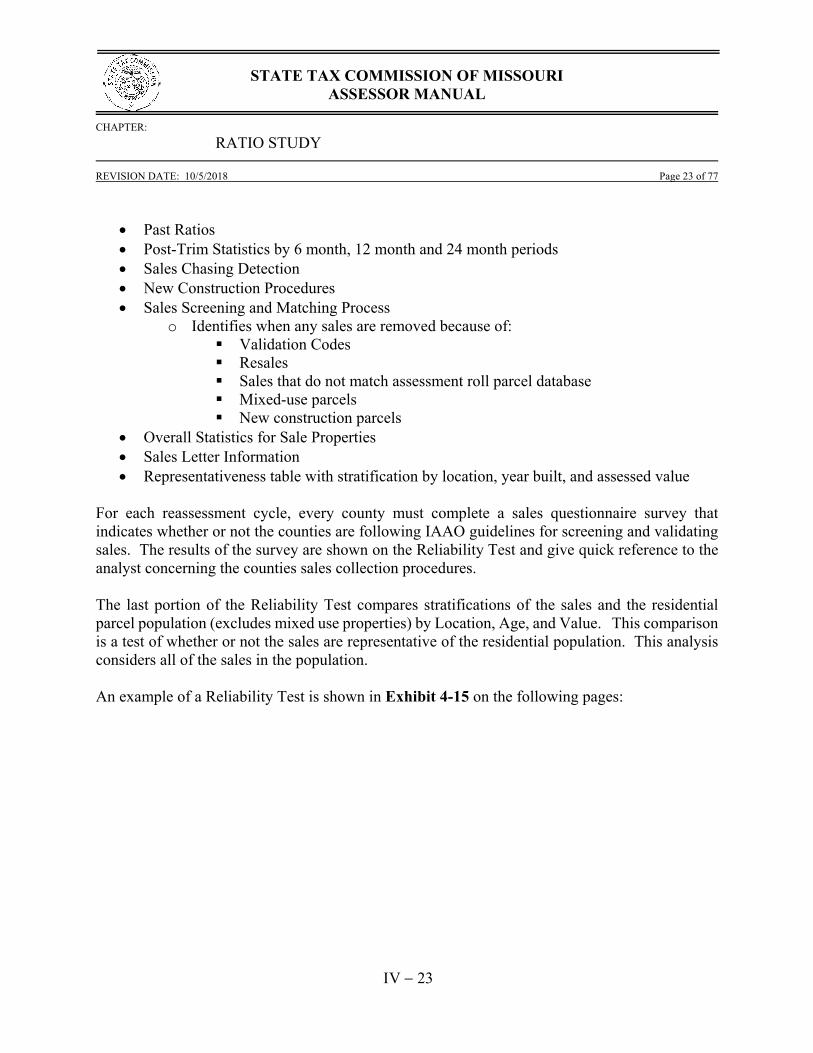
Exhibit 4-14: Between the samples and the alternates, insert a line and shade it black.
4.6 RESIDENTIAL SALES STUDY PROCEDURES In a Traditional Sales Study, the county’s values are compared against sales prices of properties that have occurred within specific time frames. Each comparison of the county’s value on a particular parcel as compared to the actual sale price results in a ratio. Statistical analyses are then performed on the ratios that occur from all sales within the specified time frame as compared to the county’s values. Currently, the Commission only performs sales studies on residential property. The Commission attempts to perform a Traditional Sales Study in every county for residential property. Appraisals are only attempted when there are insufficient numbers of sales to reach a valid sample size for a sales study and/or the county fails the sales Reliability Test (i.e. the sales are not representative of the county, sales chasing issues may exist, etc.). The Traditional Sales Study is the most effective and efficient method available to the Commission for performing ratio studies of residential property and provides the most meaningful results for county assessors. One of the challenges of the Traditional Sales Study is that there is no control over how many homes sells in any given county or where the sales are located within any county. Thus, it is not always possible to obtain a sampling of properties that is representative of the overall population when only utilizing sales information. Missouri has had good results with Traditional Sales Studies, but because they cannot be performed in all counties, the Commission has to rely on Appraisal Studies for residential property in some counties. Another challenge of the Traditional Sales Study is that not all sales are known to the assessor. Of

STATE TAX COMMISSION OF MISSOURI
ASSESSOR MANUAL
CHAPTER:
RATIO STUDY
REVISION DATE: 10/5/2018 Page 22 of 77
V22
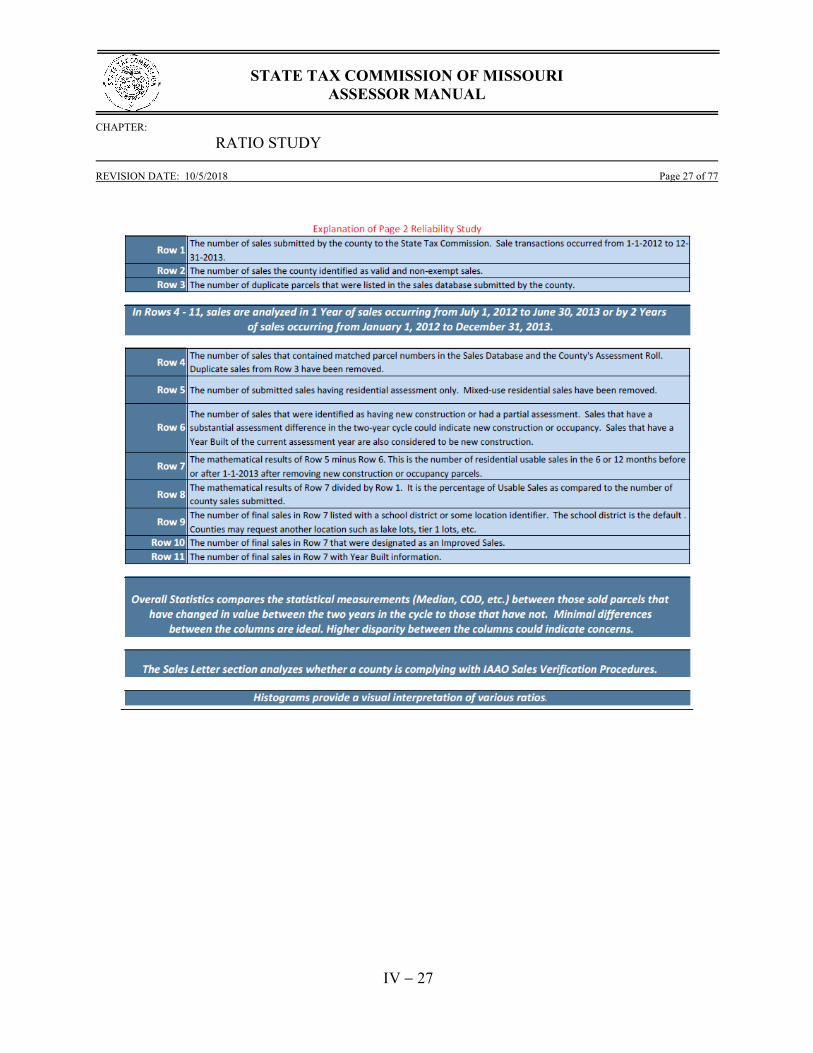
Missouri’s 115 assessment jurisdictions, only four of the jurisdictions have ordinances or rules in place that require the recordation of sales price information on all real estate transactions. For the rest of the jurisdictions in the state, the assessors collect sales data by relying on property owners to voluntarily return sales questionnaires and report the sale price information. The success rate of assessors in obtaining sales information varies from county to county. The more sales that are available, the more likely the county will qualify for a Traditional Sales Study. Whenever sales are used in ratio studies, the Commission performs a Reliability Test to ensure that the data and sales utilized in a Traditional Sales Study will yield valid and reliable results. If the county data passes the Reliability Test, then the Traditional Sales Study is attempted. 1. RELIABILITY TEST A Reliability Test is an analysis of the information received from the county to verify if the information will result in valid and reliable results. Once the county is identified, historical information is inputted, including the county’s sales disclosure history. A brief explanation is provided concerning both the quality of the sales validation/screening and the source of the databases. Data is imported from the sales databases submitted by the counties. The sales are inspected within a quality control review. If county sales databases meet the State Tax Commission standards, then the sales are analyzed by the Traditional Sales Study. The Reliability Test contains the following major components:
County Sales Collection History o Total number of transfers o Number of sales letters sent as a percent of transfers o Sales returned percentage o Number of usable sales from transfers o Number of useable sales as a percent of transfers o Turnover rate as a percentage of total parcels o Turnover rate as a percentage of residential parcels o Percent of properties unchanged in value for sold vs. unsold properties o Overall statistics for specified time frames
Jan – June of Even Year July – Dec of Even Year Jan – June of Odd Year July – Dec of Odd Year 1 Year study period vs. 6 months after
o Percent of change for sold properties vs. neighboring properties o Percent change for sold properties vs. all unsold properties
STATE TAX COMMISSION OF MISSOURI
ASSESSOR MANUAL
CHAPTER:
RATIO STUDY
REVISION DATE: 10/5/2018 Page 23 of 77
V23
Past Ratios Post-Trim Statistics by 6 month, 12 month and 24 month periods Sales Chasing Detection New Construction Procedures Sales Screening and Matching Process
o Identifies when any sales are removed because of: Validation Codes Resales Sales that do not match assessment roll parcel database Mixed-use parcels New construction parcels
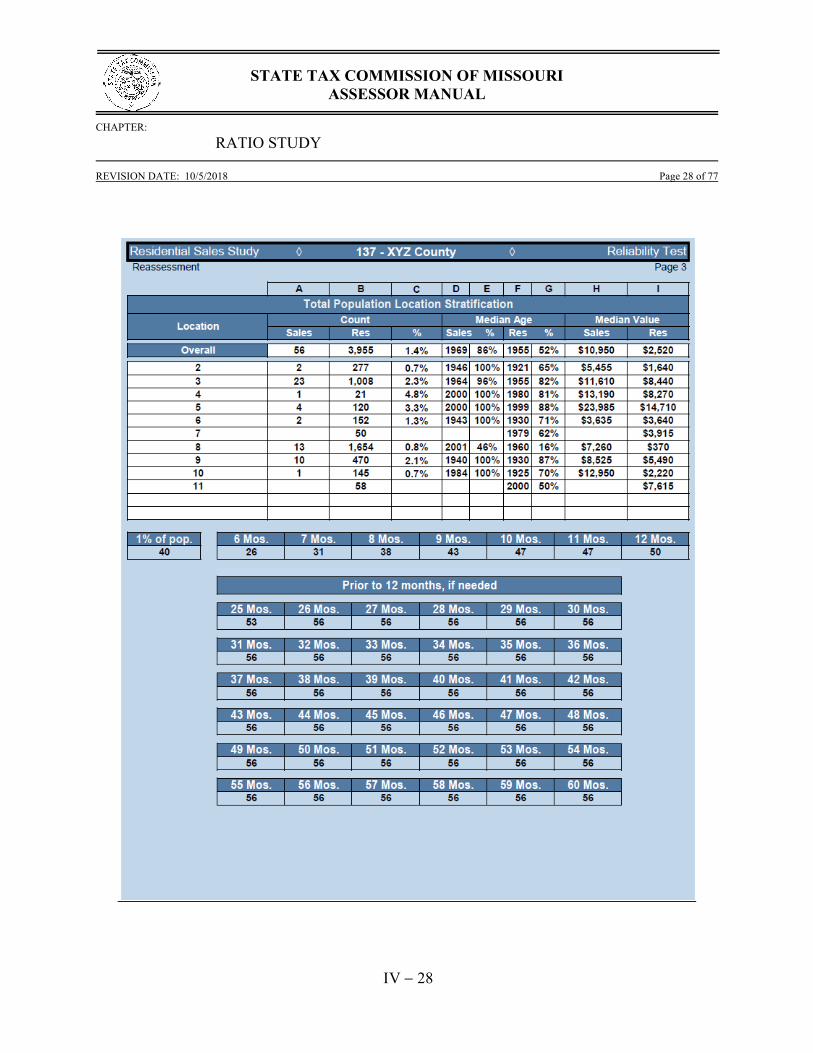
Overall Statistics for Sale Properties Sales Letter Information Representativeness table with stratification by location, year built, and assessed value
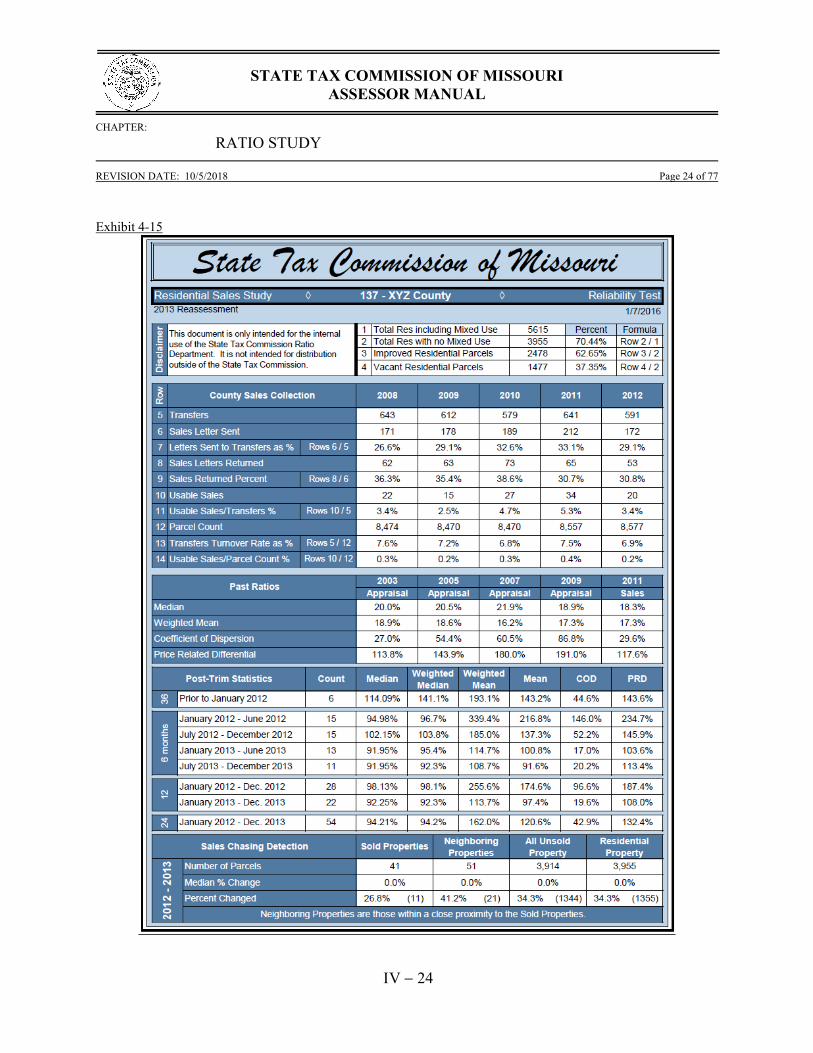
For each reassessment cycle, every county must complete a sales questionnaire survey that indicates whether or not the counties are following IAAO guidelines for screening and validating sales. The results of the survey are shown on the Reliability Test and give quick reference to the analyst concerning the counties sales collection procedures. The last portion of the Reliability Test compares stratifications of the sales and the residential parcel population (excludes mixed use properties) by Location, Age, and Value. This comparison is a test of whether or not the sales are representative of the residential population. This analysis considers all of the sales in the population. An example of a Reliability Test is shown in Exhibit 4-15 on the following pages:
STATE TAX COMMISSION OF MISSOURI
ASSESSOR MANUAL
CHAPTER:
RATIO STUDY
REVISION DATE: 10/5/2018 Page 24 of 77
V24
Exhibit 4-15

STATE TAX COMMISSION OF MISSOURI
ASSESSOR MANUAL
CHAPTER:
RATIO STUDY
REVISION DATE: 10/5/2018 Page 25 of 77
V25

STATE TAX COMMISSION OF MISSOURI
ASSESSOR MANUAL
CHAPTER:
RATIO STUDY
REVISION DATE: 10/5/2018 Page 26 of 77
V26
STATE TAX COMMISSION OF MISSOURI
ASSESSOR MANUAL
CHAPTER:
RATIO STUDY
REVISION DATE: 10/5/2018 Page 27 of 77
V27
STATE TAX COMMISSION OF MISSOURI
ASSESSOR MANUAL
CHAPTER:
RATIO STUDY
REVISION DATE: 10/5/2018 Page 28 of 77
V28

STATE TAX COMMISSION OF MISSOURI
ASSESSOR MANUAL
CHAPTER:
RATIO STUDY
REVISION DATE: 10/5/2018 Page 29 of 77
V29

STATE TAX COMMISSION OF MISSOURI
ASSESSOR MANUAL
CHAPTER:
RATIO STUDY
REVISION DATE: 10/5/2018 Page 30 of 77
V30
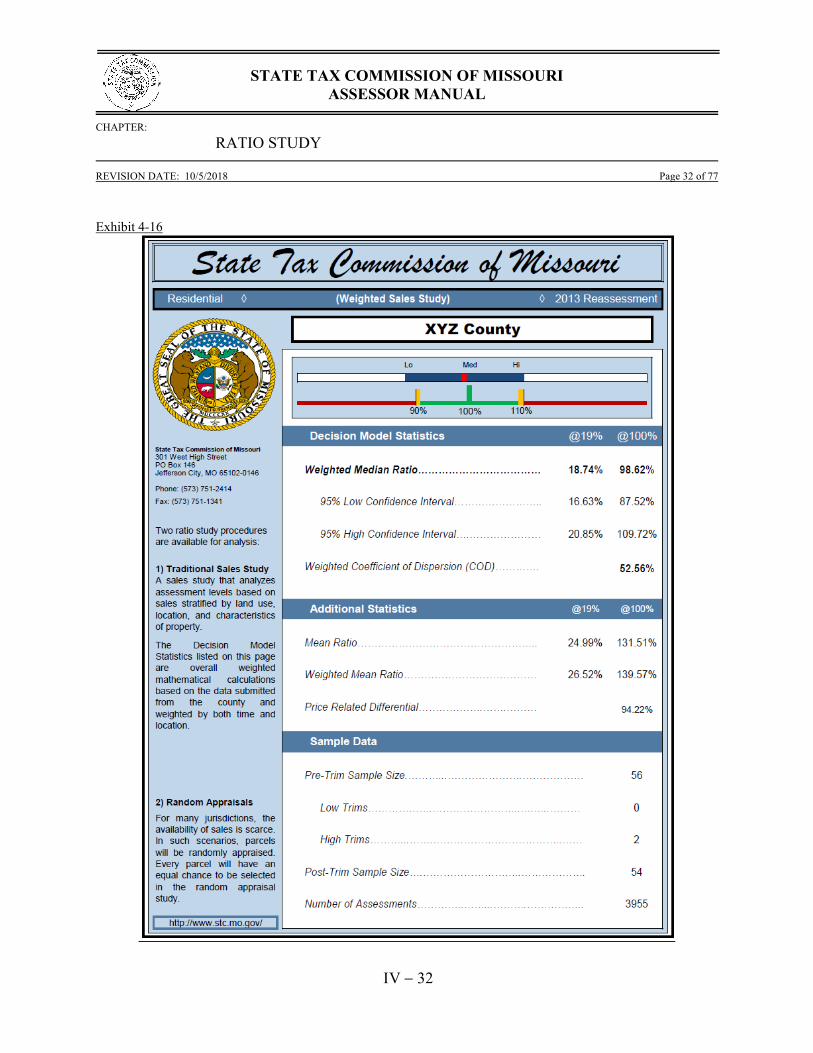
2. TRADITIONAL SALES STUDY REPORT Once a county passes the Reliability Test, the sales are imported into program templates to calculate the statistics used in the ratio study. The Traditional Sales Study has three stages: Preliminary, Tentative, and Final. First, the data is imported in the Preliminary stage. The statistics calculated are reviewed internally and the report quality is monitored. The internal review consists of both specific computer program functions to review for potential errors, as well as oversight and review of results by Management. A review is also completed by the research analyst when preparing the data and compiling the reports. The Traditional Sales Study Report can vary in length, but typically includes the following components:
Cover Page o Includes most of the statistical results used in the decision model process
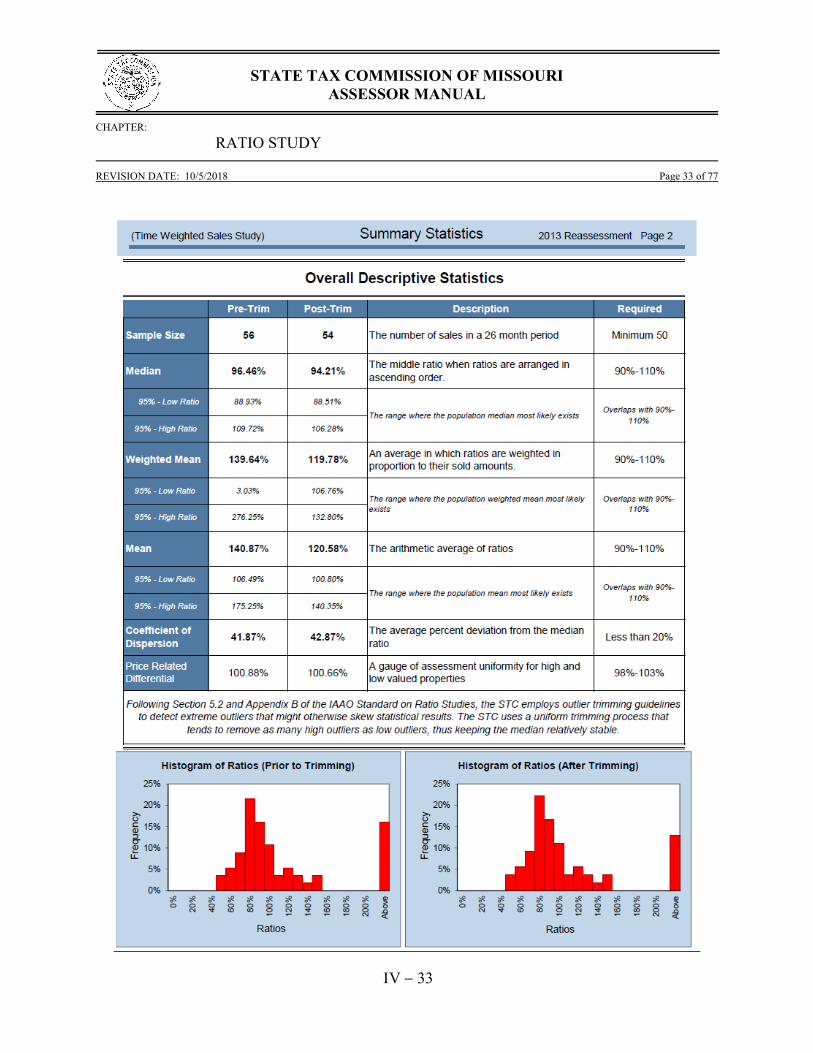
Overall Weighted Statistics
o Shows the trimming process and provides a short description of each statistic used in the report.
Stratification by Vacant and Improved property
o Includes histograms (graphs) for each stratification
Stratification by Assessed Value o Includes histograms (graphs) for each stratification
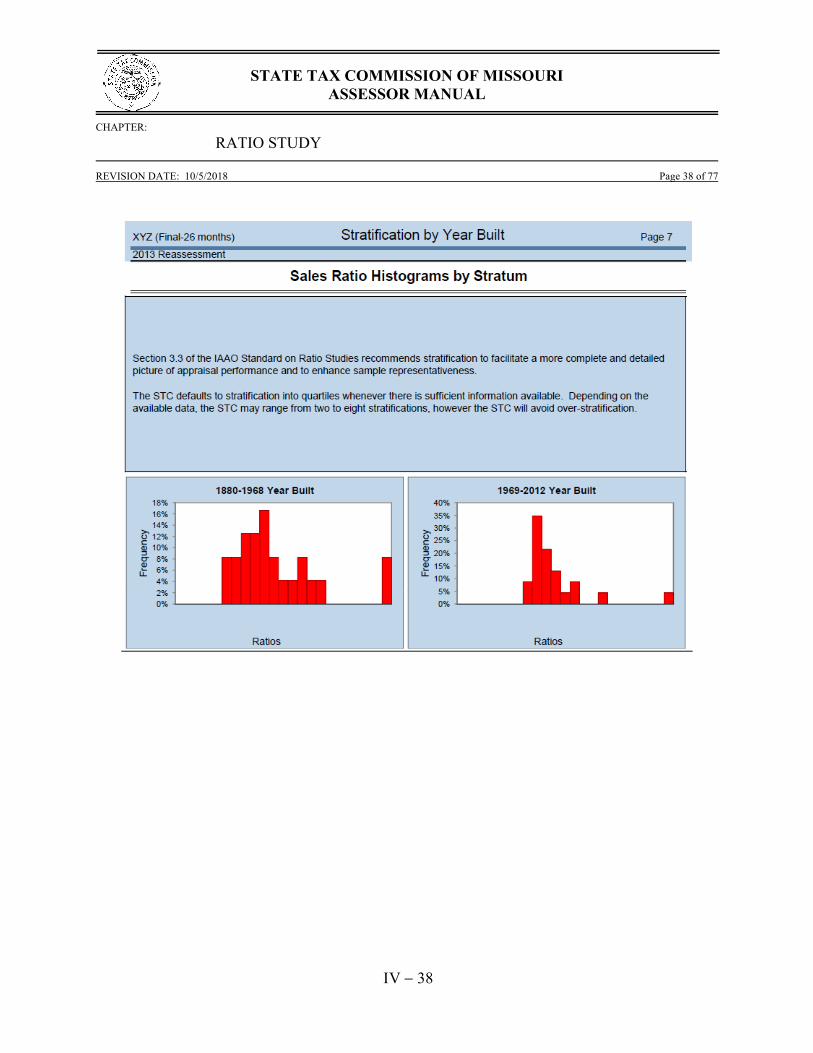
Stratification by Year Built
o Includes histograms (graphs) for each stratification
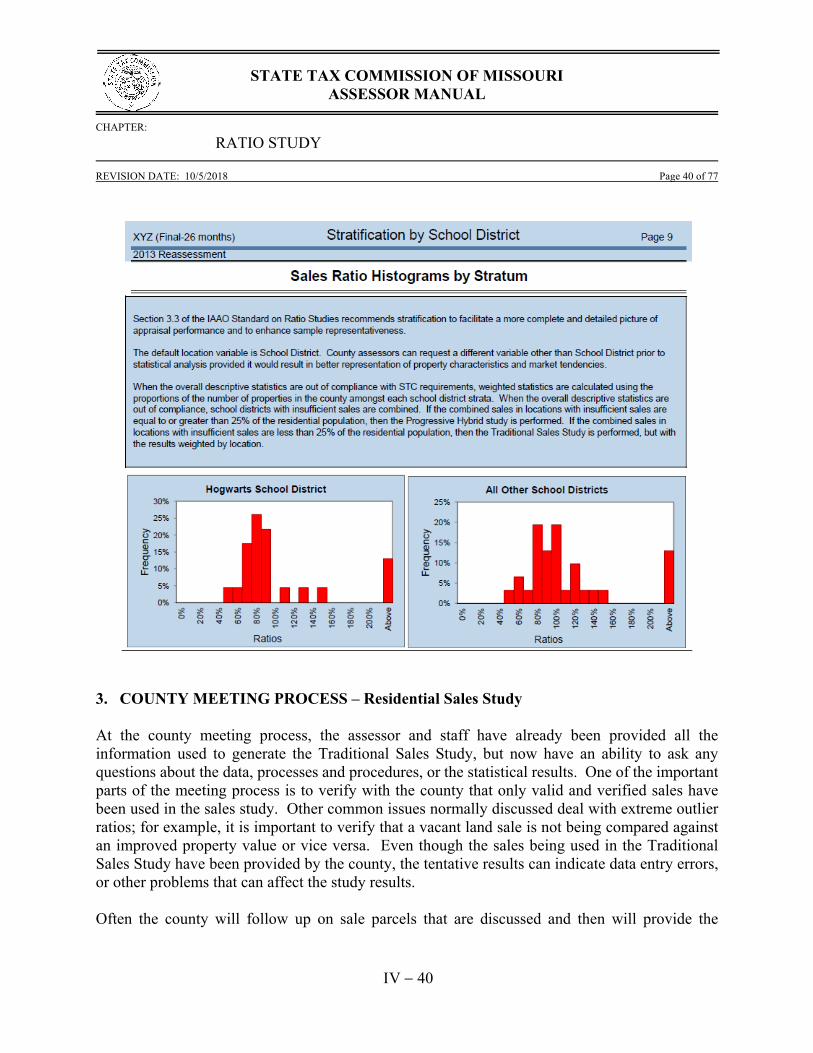
Stratification by Location o Includes histograms (graphs) for each stratification o Includes overall weighted statistics which are used in the decision model
The Commission attempts to stratify the data into quartiles whenever the data is sufficient and normally limits the number of stratifications between two and four; as an exception, those counties with more than four school districts will possibly have more than four strata for the location variable.

STATE TAX COMMISSION OF MISSOURI
ASSESSOR MANUAL
CHAPTER:
RATIO STUDY
REVISION DATE: 10/5/2018 Page 31 of 77
V31
Once it is determined that the sale price estimators are valid, reliable, and reflect the county’s level of assessment, the report becomes tentative and is then provided to the county. Data is provided concerning the steps of the sales study process. Counties are encouraged to review the information, ask any questions, and/or provide feedback. Approximately thirty days are allowed for the county to review the report and request a meeting. After meeting with the county to discuss the study results, or after the time period has lapsed, the study becomes final.
An example of a Traditional Sales Study Report is shown in Exhibit 4-16, on the pages which follow:
STATE TAX COMMISSION OF MISSOURI
ASSESSOR MANUAL
CHAPTER:
RATIO STUDY
REVISION DATE: 10/5/2018 Page 32 of 77
V32
Exhibit 4-16
STATE TAX COMMISSION OF MISSOURI
ASSESSOR MANUAL
CHAPTER:
RATIO STUDY
REVISION DATE: 10/5/2018 Page 33 of 77
V33

STATE TAX COMMISSION OF MISSOURI
ASSESSOR MANUAL
CHAPTER:
RATIO STUDY
REVISION DATE: 10/5/2018 Page 34 of 77
V34

STATE TAX COMMISSION OF MISSOURI
ASSESSOR MANUAL
CHAPTER:
RATIO STUDY
REVISION DATE: 10/5/2018 Page 35 of 77
V35

STATE TAX COMMISSION OF MISSOURI
ASSESSOR MANUAL
CHAPTER:
RATIO STUDY
REVISION DATE: 10/5/2018 Page 36 of 77
V36

STATE TAX COMMISSION OF MISSOURI
ASSESSOR MANUAL
CHAPTER:
RATIO STUDY
REVISION DATE: 10/5/2018 Page 37 of 77
V37
STATE TAX COMMISSION OF MISSOURI
ASSESSOR MANUAL
CHAPTER:
RATIO STUDY
REVISION DATE: 10/5/2018 Page 38 of 77
V38

STATE TAX COMMISSION OF MISSOURI
ASSESSOR MANUAL
CHAPTER:
RATIO STUDY
REVISION DATE: 10/5/2018 Page 39 of 77
V39
STATE TAX COMMISSION OF MISSOURI
ASSESSOR MANUAL
CHAPTER:
RATIO STUDY
REVISION DATE: 10/5/2018 Page 40 of 77
V40
3. COUNTY MEETING PROCESS – Residential Sales Study At the county meeting process, the assessor and staff have already been provided all the information used to generate the Traditional Sales Study, but now have an ability to ask any questions about the data, processes and procedures, or the statistical results. One of the important parts of the meeting process is to verify with the county that only valid and verified sales have been used in the sales study. Other common issues normally discussed deal with extreme outlier ratios; for example, it is important to verify that a vacant land sale is not being compared against an improved property value or vice versa. Even though the sales being used in the Traditional Sales Study have been provided by the county, the tentative results can indicate data entry errors, or other problems that can affect the study results. Often the county will follow up on sale parcels that are discussed and then will provide the
STATE TAX COMMISSION OF MISSOURI
ASSESSOR MANUAL
CHAPTER:
RATIO STUDY
REVISION DATE: 10/5/2018 Page 41 of 77
V41
Commission with explanations and documentation concerning each sale in question. The Commission uses the county’s additional information to make determinations whether the sale parcels in question should remain in the study or if they may need to be removed. After all the information from the county meeting process is analyzed, the Commission then determines a final ratio study result. 4.7 RANDOM APPRAISAL STUDY (Residential, Agricultural, and Commercial) Agricultural and commercial properties are only analyzed by appraisal studies whereas residential property can be analyzed by either sales or appraisals. Sales studies for the agricultural and commercial subclasses are less likely to result in justifiable assessment level estimates. For the residential subclass, if the Reliability Test from the Traditional Sales Study shows that the sales data is not representative or does not pass the Reliability Test for any other reason, then the Commission will utilize a random appraisal study to determine the level of assessment. In a random appraisal study, the Commission takes a random sample of all of the residential parcels in the county and then sends staff appraisers to appraise those properties that were randomly selected. Currently, the Commission uses 25 random samples for a residential study. The resulting appraised values are used as proxies for market value and compared to the county’s value to determine the ratios used in the ratio study. Agricultural studies rely mainly on the productivity value of the land, rather than market value. Market value sales do not reflect productivity values based on the grading required by the State Tax Commission. No comparison can be made between productivity values determined by the assessor and market values from sales. Due to the different definitions of value being measured (productivity value vs. market value), no valid, reasonable, or reliable conclusions can be drawn from a sales ratio study on agricultural property. Assessors do use market value sales for analyses on those agricultural properties where market value determinations are required, but this is such a small minority of the agricultural parcels that it still renders an overall sales ratio study to be inadequate for this classification of property. The inherent disadvantages that can exist in sales are more common in commercial property. The number of sales and/or turnover rate is often inadequate to meet the standards of the State Tax Commission. For commercial property sales, there is immense difficulty separating out intangible value, personal property, and other valuable assets or considerations to obtain an adjusted sale value that appropriately represents the real property value. Additionally, it is much more difficult, subjective and burdensome to accurately validate sales for these properties. Therefore, a random independent appraisal study is utilized to produce valid statistical results that can accurately
STATE TAX COMMISSION OF MISSOURI
ASSESSOR MANUAL
CHAPTER:
RATIO STUDY
REVISION DATE: 10/5/2018 Page 42 of 77
V42
determine the level of assessment for commercial properties. A stratified random sample is taken from the subclass population to determine which properties will be appraised. 1. APPRAISAL VALUATION In the valuation phase, it is the responsibility of the appraiser to research the marketplace and to seek the market information necessary to arrive at the market value of the properties being appraised. This does not apply, however, in the valuation of agricultural and horticultural land when such lands are valued by their productive capability. The effective date of all appraisals completed during the two-year period is January 1 of the reassessment year, or odd-numbered year, being studied. This conforms to the same effective date of appraisal that is used by the assessor in establishing the assessed values on the parcels selected. The Commission has adopted the Uniform Standards of Professional Appraisal Practice (USPAP) as the standard to which appraisals performed for the State Tax Commission must comply, following the recommendations in the IAAO Standard on Ratio Studies. The appraisals performed by ratio staff appraisers employ one or more of the following approaches to value:
Cost Approach Sales Comparison Approach Income Approach
The applicability of using any of the approaches is dependent upon the market data available for each individual appraisal. A. Residential / Agricultural Property Market value is the basis of value for properties in the residential subclass. In the agricultural subclass, buildings and other structures customarily associated with farming and agricultural lands that are vacant and unused, in accordance with Section 137.017(4), RSMo, are valued under the market value concept. Lands that are used for agricultural and horticultural purposes are valued in accordance with the land’s productive capability and graded using one of the eight (8) grades published by the Commission. One of the benefits of implementing the two-year ratio study cycle is the improvements made in the valuation process. One of the improvements involves researching and inspecting market information. Appraisers now have the time to look for additional sales information and to inspect

STATE TAX COMMISSION OF MISSOURI
ASSESSOR MANUAL
CHAPTER:
RATIO STUDY
REVISION DATE: 10/5/2018 Page 43 of 77
V43
the properties that have sold to verify their comparability to the subject properties. The second improvement involves documenting the methodology employed by the appraiser in arriving at the appraised value of the properties in the study. It is important in reviewing an appraisal that the reader, or reviewer, is able to arrive at the same value conclusion as the appraiser who prepared the report. Appraisal reports have been produced and reviewed digitally since 2005. Any data, information and documentation necessary to support the appraiser’s opinions and conclusions are kept in a work file. The appraiser’s work file is retained for a minimum of ten (10) years after preparation or two (2) years after the final disposition of any judicial proceeding in which the appraiser provided testimony related to the assignment, whichever period expires last. In selecting counties for the ratio study, priority is given to those counties where preliminary research indicates potential valuation and/or other issues may exist that substantially impact the tax base. B. Commercial Property Market value is the basis of value for properties in the commercial subclass. As with the residential and agricultural appraisals, the two year ratio study cycle for completing the appraisals improves the final product. Benefits are gained in the improved appraisal reporting format and the additional time to investigate the marketplace for comparable sales and rentals that are essential to the valuation process. Beginning with the 2015 commercial ratio cycle, seventy-five (75) counties will be completed on a four year ratio cycle with approximately half of the counties being completed in each two year ratio study cycle. Forty (40) counties will be on a six year process with approximately one-third of the counties being completed in each two year ratio study cycle. This practice was deemed necessary due to budget and staffing reductions. In making the decision to extend the time frame for measuring commercial assessments in all Missouri counties, particular scrutiny was given to the complexities and nuances of the commercial real estate market. It generally takes longer to recognize trends in commercial real estate due to the timing of leases and the overall scarcity of sales and income information available at any time, and historical information indicated that commercial assessments had far less variability between cycles than the residential subclass. In selecting counties for the ratio study, priority is given to those counties where preliminary research indicates potential valuation and/or other issues may exist that substantially impact the tax base. 2. INTERNAL REVIEW The internal review process consists of two components. The main component involves a review of the procedures used in the appraisal process and the second component is a desk audit for quality
STATE TAX COMMISSION OF MISSOURI
ASSESSOR MANUAL
CHAPTER:
RATIO STUDY
REVISION DATE: 10/5/2018 Page 44 of 77
V44
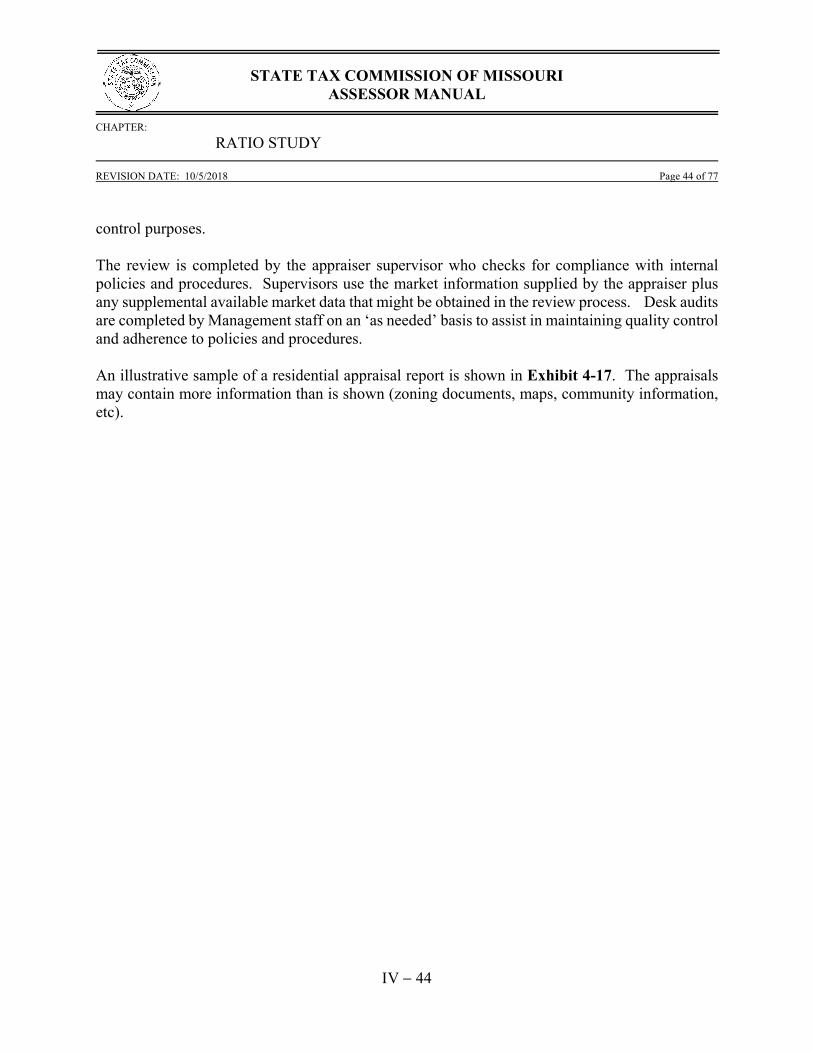
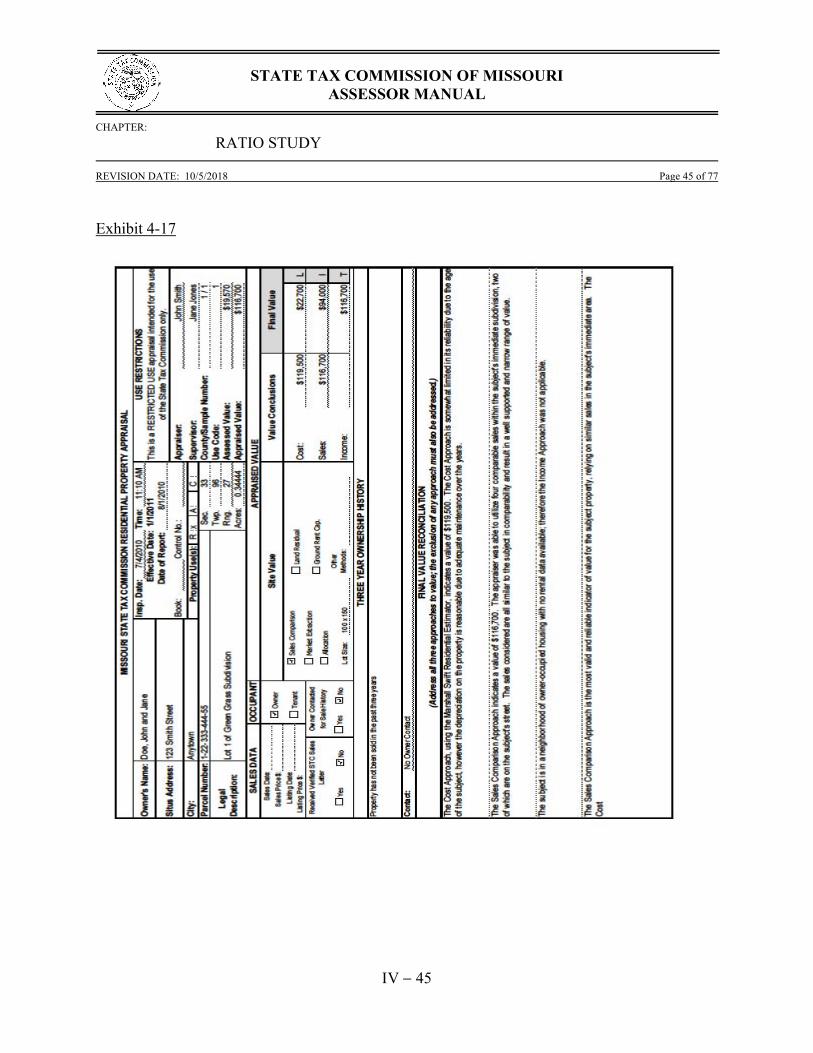
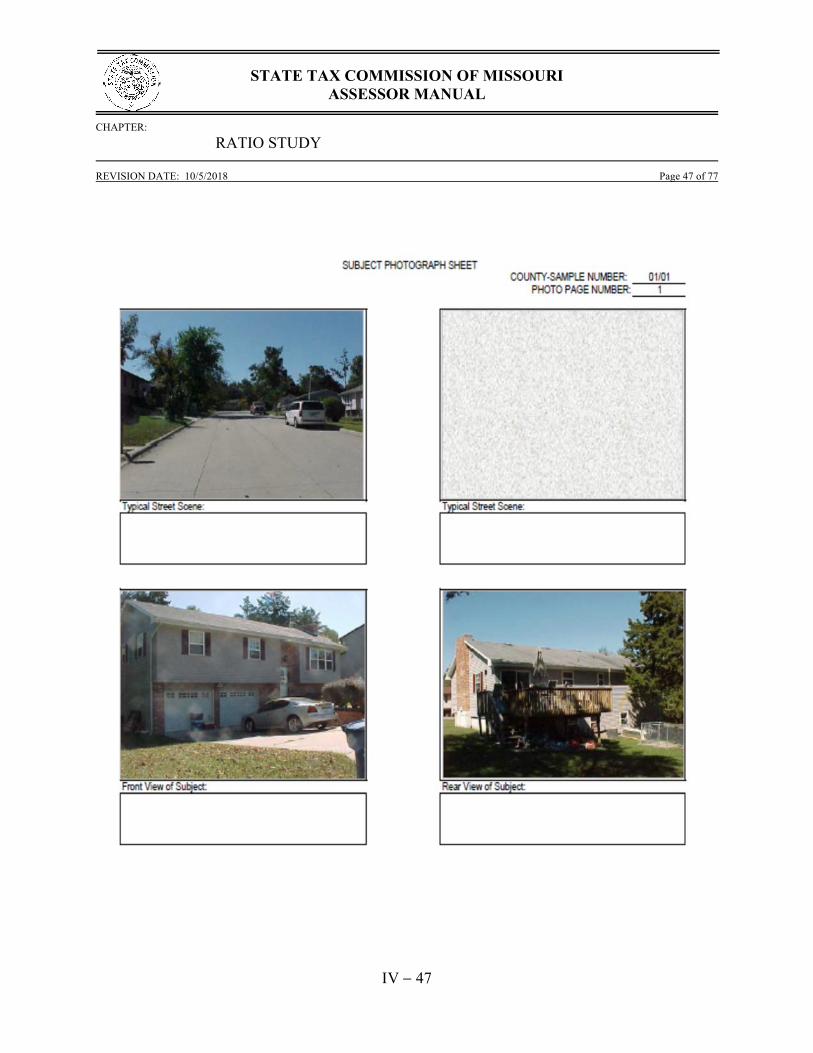
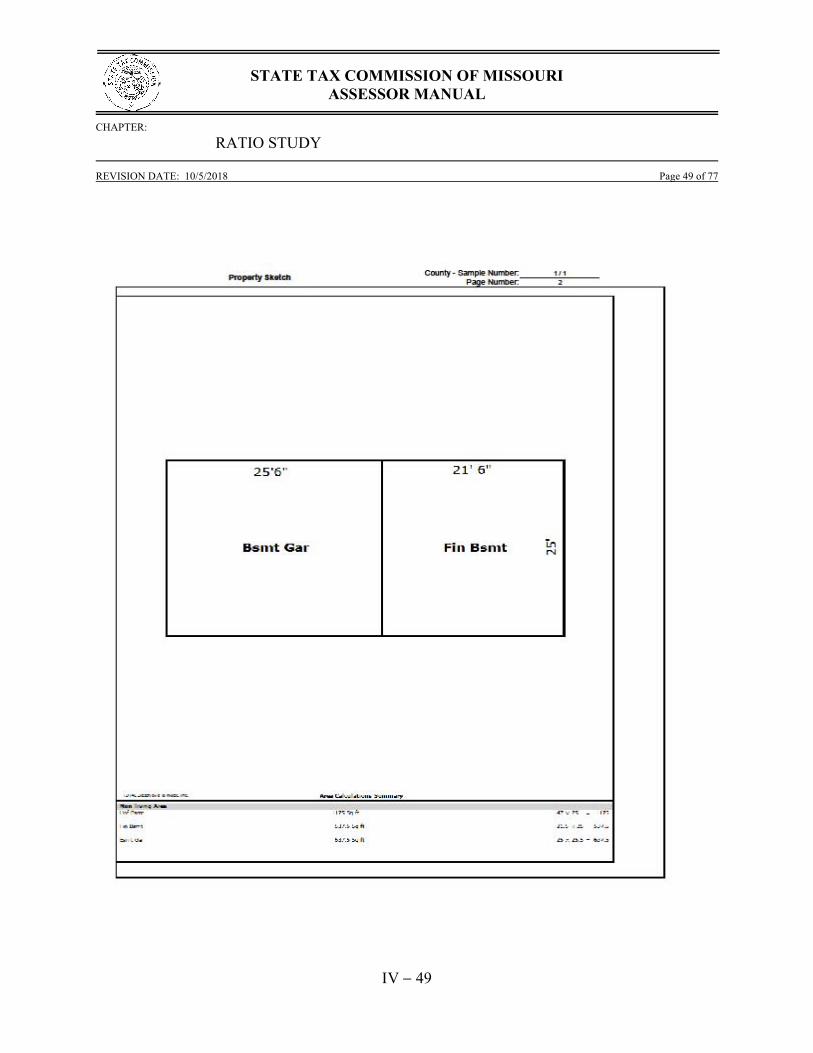
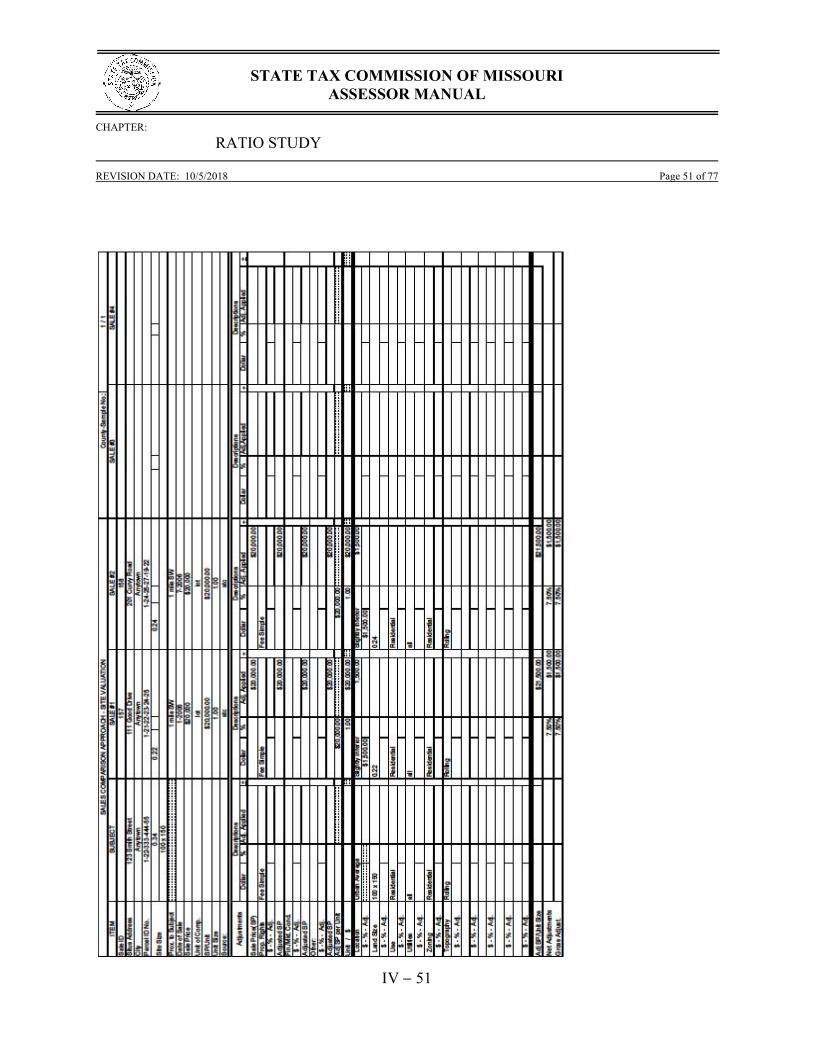
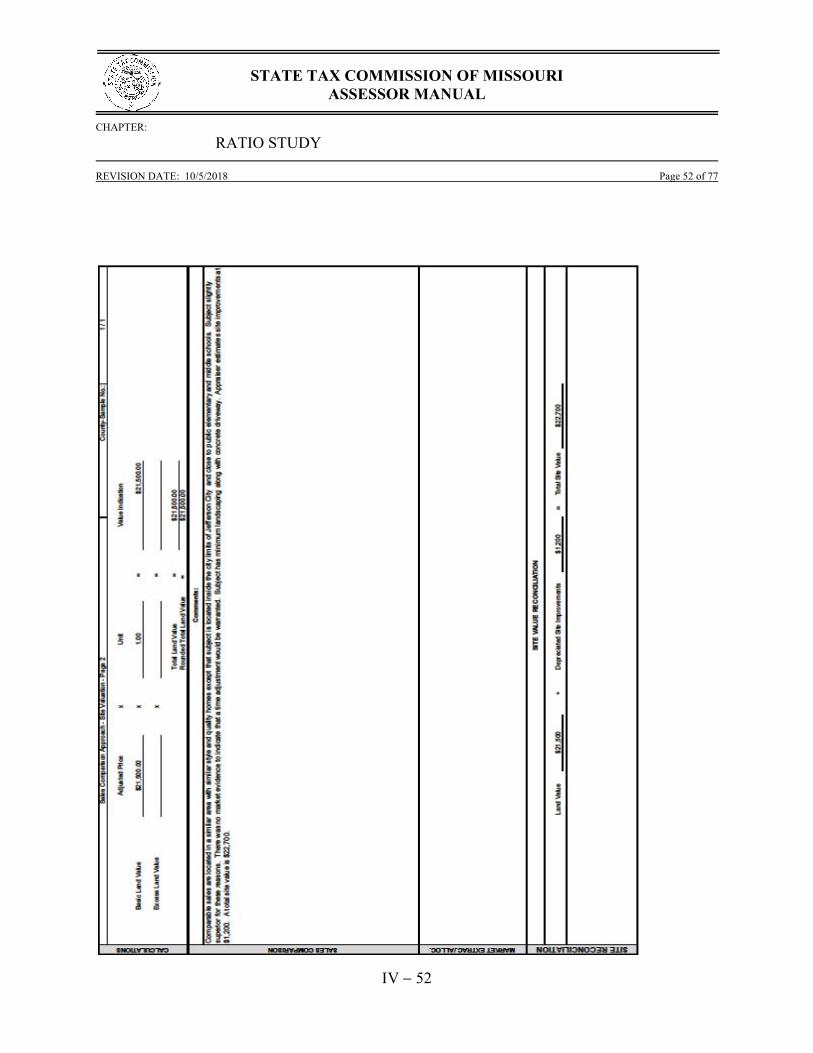
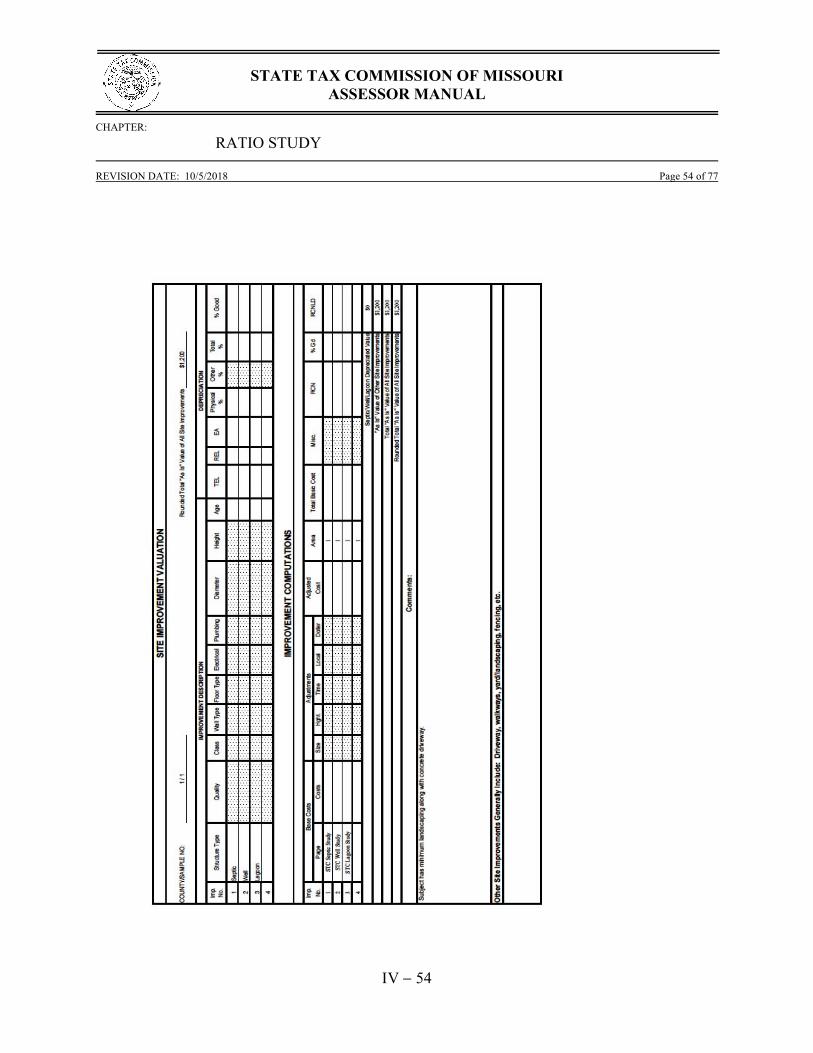
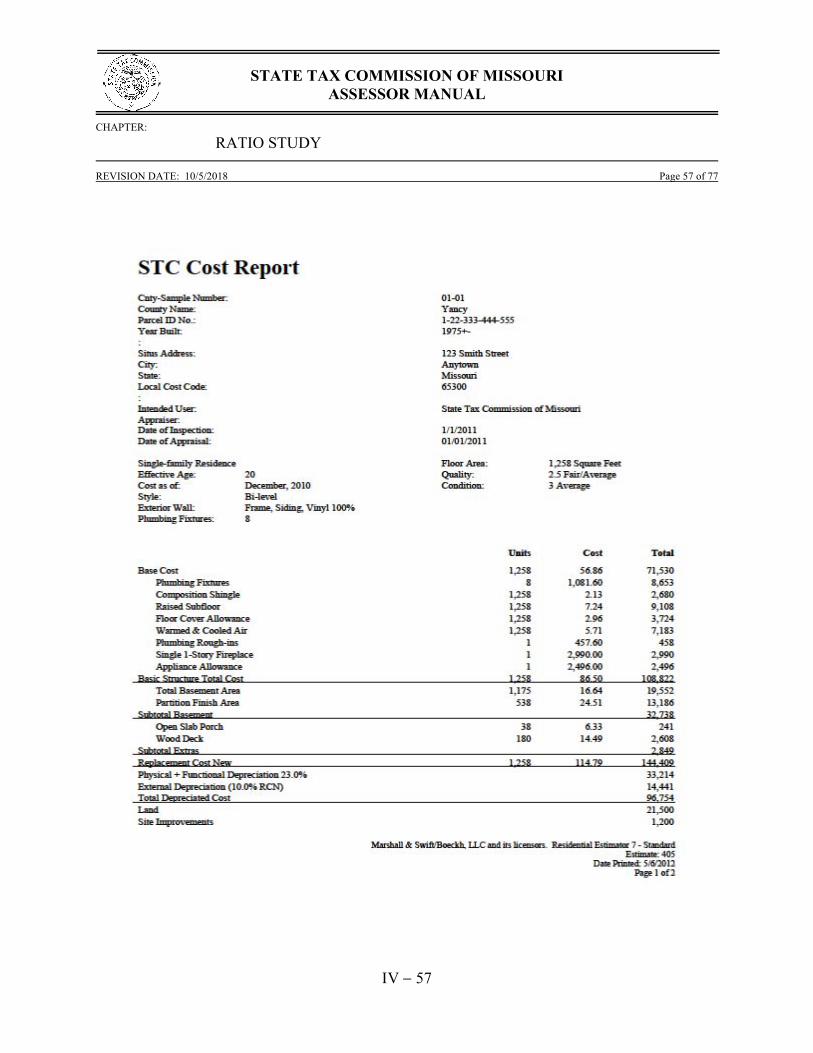
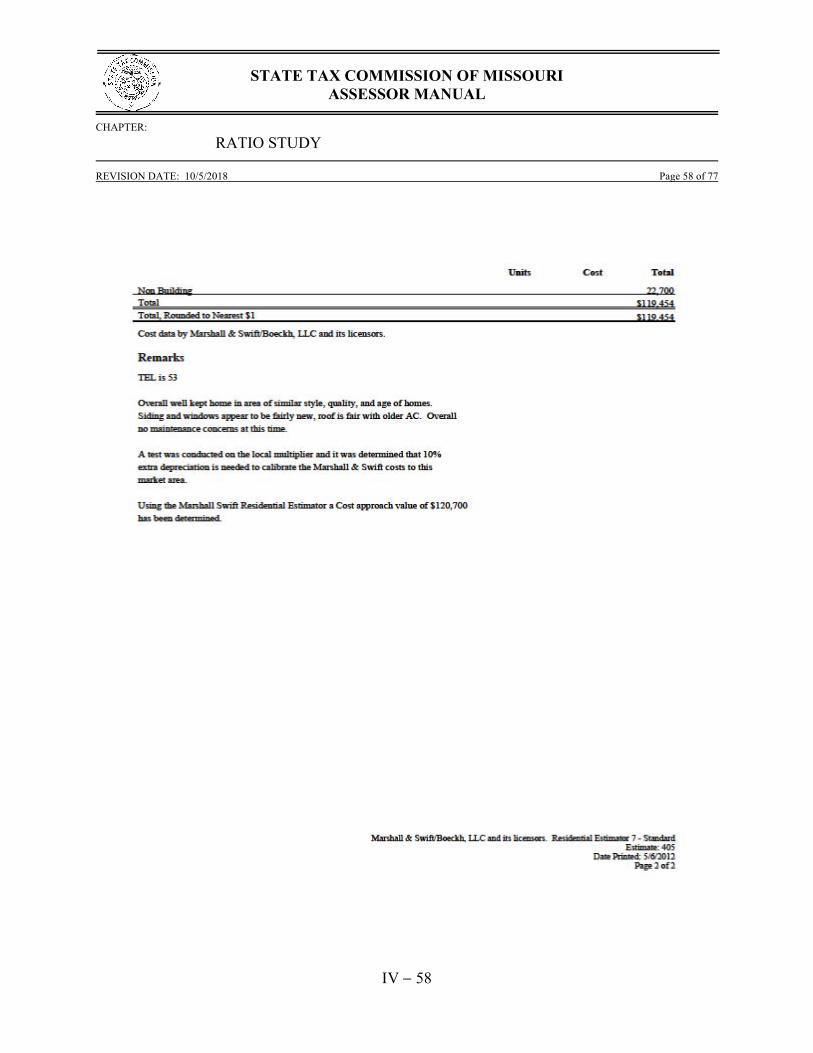
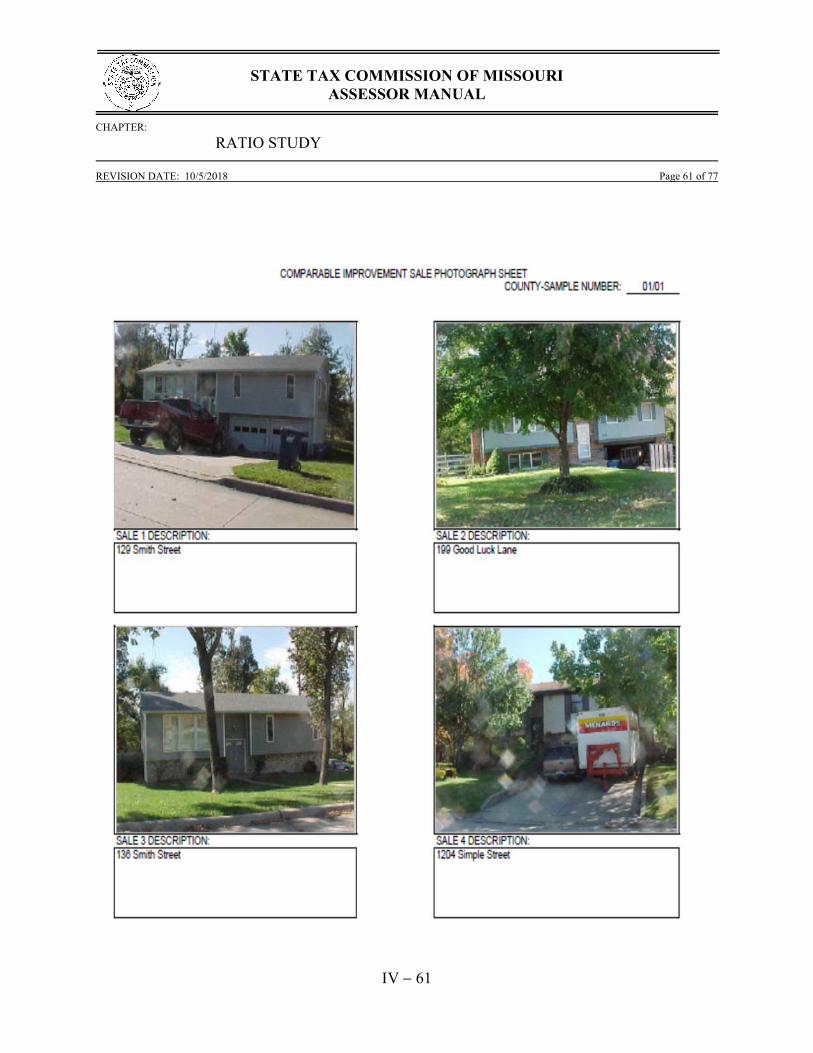
control purposes. The review is completed by the appraiser supervisor who checks for compliance with internal policies and procedures. Supervisors use the market information supplied by the appraiser plus any supplemental available market data that might be obtained in the review process. Desk audits are completed by Management staff on an ‘as needed’ basis to assist in maintaining quality control and adherence to policies and procedures. An illustrative sample of a residential appraisal report is shown in Exhibit 4-17. The appraisals may contain more information than is shown (zoning documents, maps, community information, etc).
STATE TAX COMMISSION OF MISSOURI
ASSESSOR MANUAL
CHAPTER:
RATIO STUDY
REVISION DATE: 10/5/2018 Page 45 of 77
V45
Exhibit 4-17

STATE TAX COMMISSION OF MISSOURI
ASSESSOR MANUAL
CHAPTER:
RATIO STUDY
REVISION DATE: 10/5/2018 Page 46 of 77
V46
STATE TAX COMMISSION OF MISSOURI
ASSESSOR MANUAL
CHAPTER:
RATIO STUDY
REVISION DATE: 10/5/2018 Page 47 of 77
V47

STATE TAX COMMISSION OF MISSOURI
ASSESSOR MANUAL
CHAPTER:
RATIO STUDY
REVISION DATE: 10/5/2018 Page 48 of 77
V48
STATE TAX COMMISSION OF MISSOURI
ASSESSOR MANUAL
CHAPTER:
RATIO STUDY
REVISION DATE: 10/5/2018 Page 49 of 77
V49

STATE TAX COMMISSION OF MISSOURI
ASSESSOR MANUAL
CHAPTER:
RATIO STUDY
REVISION DATE: 10/5/2018 Page 50 of 77
V50
STATE TAX COMMISSION OF MISSOURI
ASSESSOR MANUAL
CHAPTER:
RATIO STUDY
REVISION DATE: 10/5/2018 Page 51 of 77
V51
STATE TAX COMMISSION OF MISSOURI
ASSESSOR MANUAL
CHAPTER:
RATIO STUDY
REVISION DATE: 10/5/2018 Page 52 of 77
V52

STATE TAX COMMISSION OF MISSOURI
ASSESSOR MANUAL
CHAPTER:
RATIO STUDY
REVISION DATE: 10/5/2018 Page 53 of 77
V53
STATE TAX COMMISSION OF MISSOURI
ASSESSOR MANUAL
CHAPTER:
RATIO STUDY
REVISION DATE: 10/5/2018 Page 54 of 77
V54

STATE TAX COMMISSION OF MISSOURI
ASSESSOR MANUAL
CHAPTER:
RATIO STUDY
REVISION DATE: 10/5/2018 Page 55 of 77
V55

STATE TAX COMMISSION OF MISSOURI
ASSESSOR MANUAL
CHAPTER:
RATIO STUDY
REVISION DATE: 10/5/2018 Page 56 of 77
V56
STATE TAX COMMISSION OF MISSOURI
ASSESSOR MANUAL
CHAPTER:
RATIO STUDY
REVISION DATE: 10/5/2018 Page 57 of 77
V57
STATE TAX COMMISSION OF MISSOURI
ASSESSOR MANUAL
CHAPTER:
RATIO STUDY
REVISION DATE: 10/5/2018 Page 58 of 77
V58

STATE TAX COMMISSION OF MISSOURI
ASSESSOR MANUAL
CHAPTER:
RATIO STUDY
REVISION DATE: 10/5/2018 Page 59 of 77
V59

STATE TAX COMMISSION OF MISSOURI
ASSESSOR MANUAL
CHAPTER:
RATIO STUDY
REVISION DATE: 10/5/2018 Page 60 of 77
V60
STATE TAX COMMISSION OF MISSOURI
ASSESSOR MANUAL
CHAPTER:
RATIO STUDY
REVISION DATE: 10/5/2018 Page 61 of 77
V61

STATE TAX COMMISSION OF MISSOURI
ASSESSOR MANUAL
CHAPTER:
RATIO STUDY
REVISION DATE: 10/5/2018 Page 62 of 77
V62
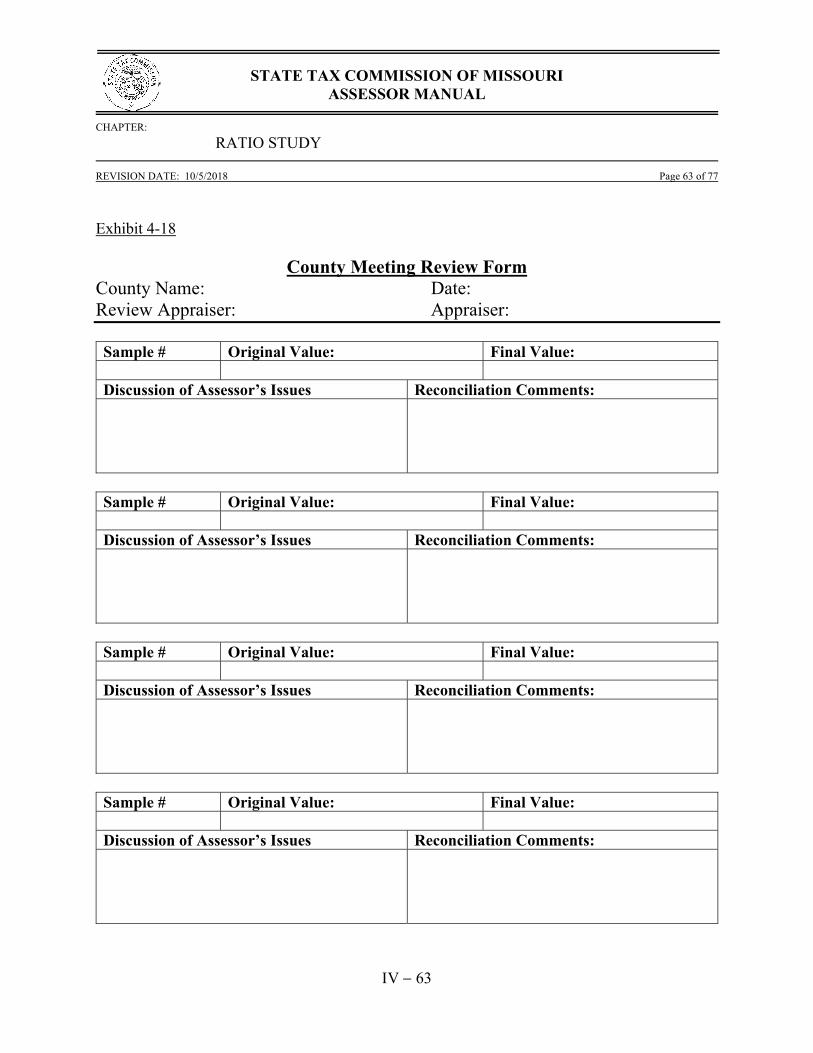
3. EXTERNAL REVIEW - County Meeting The external review phase is that part of the process that allows the assessor to have input into the appraisal study and may include a meeting at their request. Upon completion of the internal review, the Tentative Ratio Study is completed. The individual samples, their assessment, and staff appraised values are detailed in a Ratio Report, a corresponding Statistical Report in sample order, and a corresponding Statistical Report in Ratio Order. These three reports along with a digital copy of the Ratio appraiser’s county work are provided to the county assessor for review. The Ratio appraiser’s county work will include each individual appraisal, special studies performed, county-city data, flood maps if required, etc. The purpose of the external review is to secure any additional information that may assist the Commission in completing a fair and impartial study. The type of information typically obtained includes additional sales information, local factors that may have an impact on value, identification of incorrect parcels, land classification information, etc. A member of the Local Assistance staff contacts the assessor to ask if a meeting to discuss the appraisals is wanted. At the meeting the appraiser receives input along with supporting documentation from the assessor on those properties on which the assessor wishes to comment. The comments are recorded on the County Meeting Review Form as shown in Exhibit 4.18. The purpose of the meeting is to obtain additional information, discuss the statistics that appear on the Statistical Report and to record any comments and concerns.
STATE TAX COMMISSION OF MISSOURI
ASSESSOR MANUAL
CHAPTER:
RATIO STUDY
REVISION DATE: 10/5/2018 Page 63 of 77
V63
Exhibit 4-18
County Meeting Review Form County Name: Date: Review Appraiser: Appraiser: Sample # Original Value: Final Value: Discussion of Assessor’s Issues Reconciliation Comments:
Sample # Original Value: Final Value: Discussion of Assessor’s Issues Reconciliation Comments:
Sample # Original Value: Final Value: Discussion of Assessor’s Issues Reconciliation Comments:
Sample # Original Value: Final Value: Discussion of Assessor’s Issues Reconciliation Comments:
STATE TAX COMMISSION OF MISSOURI
ASSESSOR MANUAL
CHAPTER:
RATIO STUDY
REVISION DATE: 10/5/2018 Page 64 of 77
V64
After each meeting, the appraiser and review appraiser conduct site inspections of any properties for which new sales information is provided. They also re-inspect any property that requires a second review based upon information provided at the meeting. After the meeting and any additional field reviews are completed, the appraiser and appraiser supervisor meet to review the appraisals in light of the comments and information obtained at the meeting. When an adjustment or change is warranted, they will then document their recommendation on the County Meeting Review Form. The appraiser will make the necessary changes in accordance with their agreed recommendations. The final step in this part of the external review process is the generation of a revised ratio, referred to as the Final Ratio, and the redistribution of the final results to the county assessor. 4.8 DECISION MODEL The Decision Model is the logical process to determine if a county is in compliance with State Tax Commission criteria for acceptable assessment performance. The diagrams on the following pages are used to illustrate the necessary steps used in the decision making process. 1. RESIDENTIAL DECISION MODEL Beginning with the 2015 ratio study, there is a different decision model process for Traditional Sales Studies and Random Appraisal Studies. For residential property, the Commission attempts to perform a Traditional Sales Study in all 115 assessment jurisdictions. If the Traditional Sales Study cannot be completed, then the Random Appraisal Study will be utilized. For agricultural and commercial property, the Commission only utilizes Random Appraisal Studies. The diagrams on the following pages illustrate the steps in the decision model process for residential property.

STATE TAX COMMISSION OF MISSOURI
ASSESSOR MANUAL
CHAPTER:
RATIO STUDY
REVISION DATE: 10/5/2018 Page 65 of 77
V65
If possible, combine stratifications with sales less than 25, and analyze. This is for informational
purposes only.
In Complianc
Out of Compliance
Stratify sales by Assessed Value, Year Built, and Improved/Vacant.
This is for informational purposes only.
Stratify Sales by Location
No
Out of Compliance
Yes
No No
Yes
Appraisal Study
90% ≤ Median ≤ 110%
COD ≤ 25%
95% CI intersects 90% - 110%
In Complianc
Yes
No
Yes
No
No
Yes
For Each Stratification…
Trim outliers
Weight Study by Location and Time
90% ≤ Weighted Median ≤ 110%
Weighted COD ≤ 20%
95% Confidence Interval intersects 90% - 110%
Yes
Yes
Yes No
No
Residential Sales Study
Sales ≥ Min. Sample Size?
Pass Reliability Test?
STATE TAX COMMISSION OF MISSOURI
ASSESSOR MANUAL
CHAPTER:
RATIO STUDY
REVISION DATE: 10/5/2018 Page 66 of 77
V66
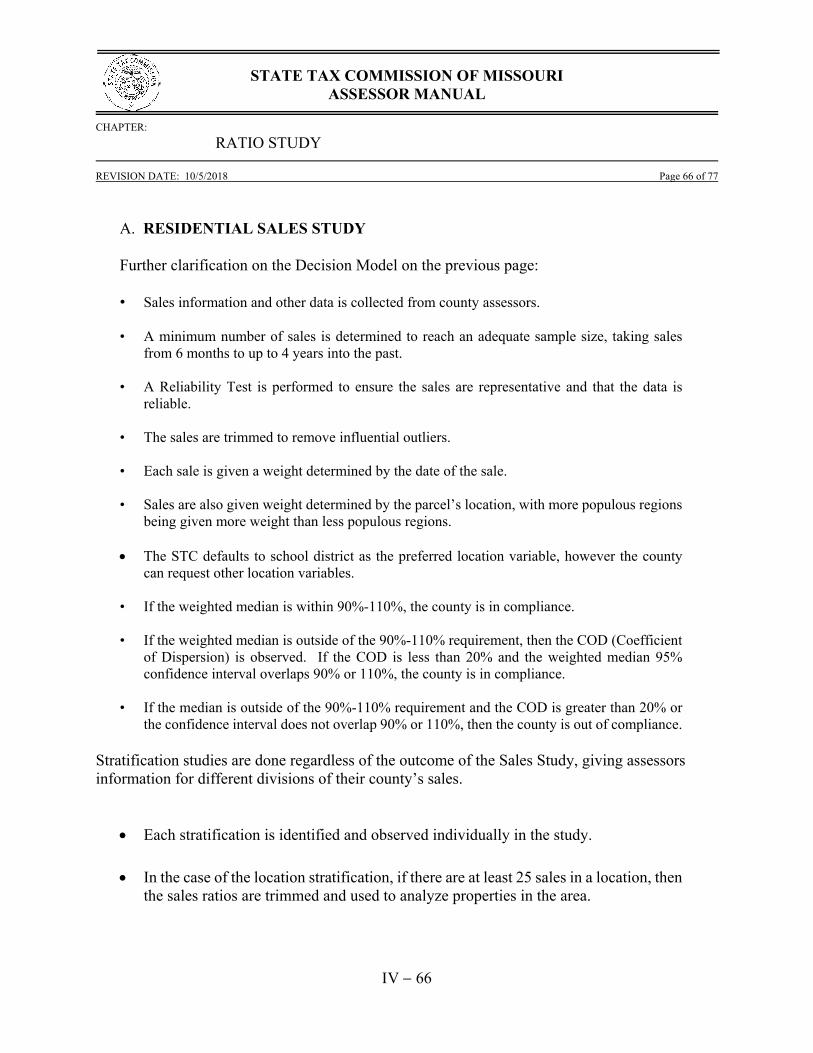
A. RESIDENTIAL SALES STUDY Further clarification on the Decision Model on the previous page: • Sales information and other data is collected from county assessors. • A minimum number of sales is determined to reach an adequate sample size, taking sales
from 6 months to up to 4 years into the past. • A Reliability Test is performed to ensure the sales are representative and that the data is
reliable. • The sales are trimmed to remove influential outliers. • Each sale is given a weight determined by the date of the sale. • Sales are also given weight determined by the parcel’s location, with more populous regions
being given more weight than less populous regions.
The STC defaults to school district as the preferred location variable, however the county can request other location variables.
• If the weighted median is within 90%-110%, the county is in compliance. • If the weighted median is outside of the 90%-110% requirement, then the COD (Coefficient
of Dispersion) is observed. If the COD is less than 20% and the weighted median 95% confidence interval overlaps 90% or 110%, the county is in compliance.
• If the median is outside of the 90%-110% requirement and the COD is greater than 20% or
the confidence interval does not overlap 90% or 110%, then the county is out of compliance.
Stratification studies are done regardless of the outcome of the Sales Study, giving assessors information for different divisions of their county’s sales.
Each stratification is identified and observed individually in the study.
In the case of the location stratification, if there are at least 25 sales in a location, then the sales ratios are trimmed and used to analyze properties in the area.

STATE TAX COMMISSION OF MISSOURI
ASSESSOR MANUAL
CHAPTER:
RATIO STUDY
REVISION DATE: 10/5/2018 Page 67 of 77
V67
If there are less than 25 sales in any location, then all locations with fewer than 25 sales are identified and then combined together.
Each subset of sales (each school district, generally) is analyzed and the statistics for the ratio data is calculated and weighted by time. Individual location statistics are also provided to the assessor for informational purposes.
The sales are also stratified by age (the year the building on the property is built), the assessed value, and whether the property is vacant or improved. These are split up into equal portions, usually quartiles, and each one is analyzed separately, providing information to the assessor.
B. RESIDENTIAL APPRAISAL STUDY
A random appraisal study is performed for approximately 25 randomly selected parcels in the county.
If the median is within the 90% - 110% range, then the county is in compliance.
Otherwise, if the median is outside of the 90%-110% range, then the COD is observed.
If both median and COD are out of tolerance, then the county is out of compliance.
If the COD is less than 25%, then the median confidence interval must overlap either 90% or 110% to be in compliance.
Yes
No
No No
Yes
Yes
Appraisal Study
90% ≤ Median ≤ 110%
COD ≤ 25%
95% CI overlaps 90% ‐ 110%
Out of Compliance
In Compliance
STATE TAX COMMISSION OF MISSOURI
ASSESSOR MANUAL
CHAPTER:
RATIO STUDY
REVISION DATE: 10/5/2018 Page 68 of 77
V68
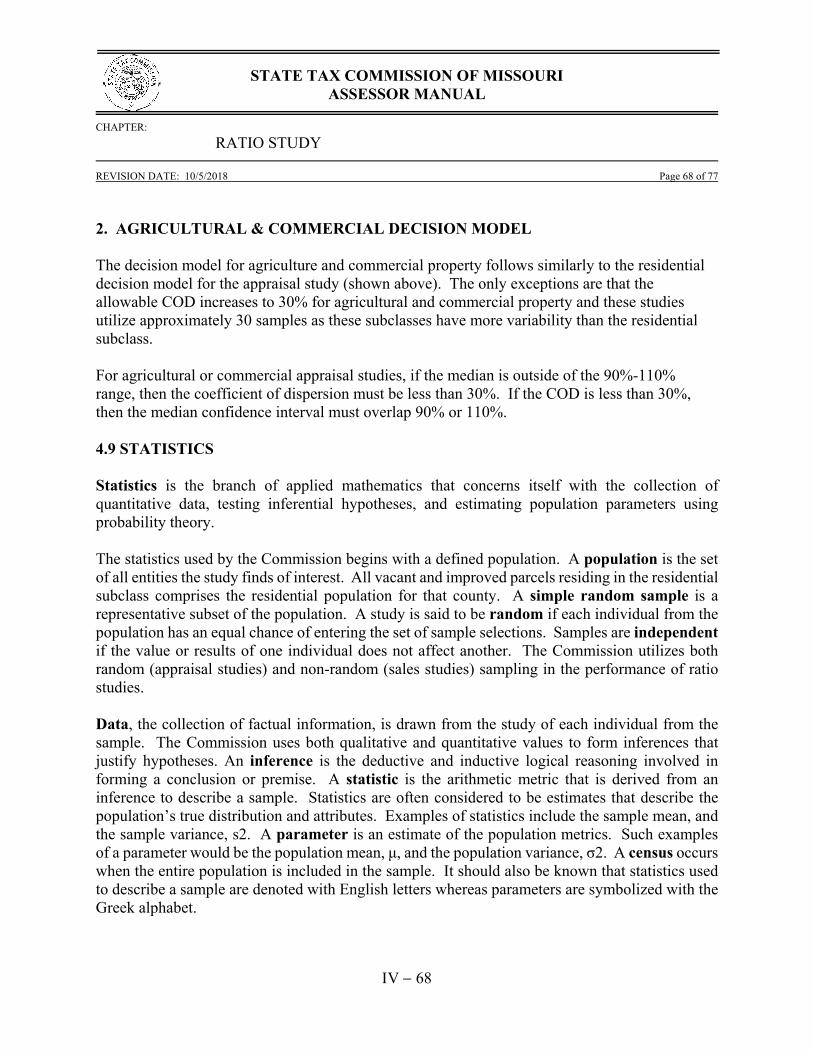
2. AGRICULTURAL & COMMERCIAL DECISION MODEL The decision model for agriculture and commercial property follows similarly to the residential decision model for the appraisal study (shown above). The only exceptions are that the allowable COD increases to 30% for agricultural and commercial property and these studies utilize approximately 30 samples as these subclasses have more variability than the residential subclass. For agricultural or commercial appraisal studies, if the median is outside of the 90%-110% range, then the coefficient of dispersion must be less than 30%. If the COD is less than 30%, then the median confidence interval must overlap 90% or 110%. 4.9 STATISTICS Statistics is the branch of applied mathematics that concerns itself with the collection of quantitative data, testing inferential hypotheses, and estimating population parameters using probability theory. The statistics used by the Commission begins with a defined population. A population is the set of all entities the study finds of interest. All vacant and improved parcels residing in the residential subclass comprises the residential population for that county. A simple random sample is a representative subset of the population. A study is said to be random if each individual from the population has an equal chance of entering the set of sample selections. Samples are independent if the value or results of one individual does not affect another. The Commission utilizes both random (appraisal studies) and non-random (sales studies) sampling in the performance of ratio studies. Data, the collection of factual information, is drawn from the study of each individual from the sample. The Commission uses both qualitative and quantitative values to form inferences that justify hypotheses. An inference is the deductive and inductive logical reasoning involved in forming a conclusion or premise. A statistic is the arithmetic metric that is derived from an inference to describe a sample. Statistics are often considered to be estimates that describe the population’s true distribution and attributes. Examples of statistics include the sample mean, and the sample variance, s2. A parameter is an estimate of the population metrics. Such examples of a parameter would be the population mean, μ, and the population variance, σ2. A census occurs when the entire population is included in the sample. It should also be known that statistics used to describe a sample are denoted with English letters whereas parameters are symbolized with the Greek alphabet.

STATE TAX COMMISSION OF MISSOURI
ASSESSOR MANUAL
CHAPTER:
RATIO STUDY
REVISION DATE: 10/5/2018 Page 69 of 77
V69
Descriptive statistics summarize the distribution of the collected data. Knowing such information provides the ability to analyze and interpret characteristics that will be important for the study. The following sections list the important descriptive statistics used by the Commission in the performance of ratio studies. 1. MEASUREMENTS OF CENTRAL TENDENCY The mean, also known as the arithmetic average, is created by adding together all individual samples and dividing by the number of samples. The sample mean x is computed as follows:
Let n represent the number of observations in the sample. Let xi represent the ith observation of the sample.
n
x
n
xxxxx
n
ii
nn
1121 ...
The mean ratio is a helpful statistic. Some advantages of using the mean ratio include the ease in understanding the concept, the value of every ratio is considered, and further statistical applications can be used that are based around the value of the mean.
Table 1
Assessed Sale Sample Value Value Ratio Ratio/0.19 1 $5,780 $42,200 0.1370 72.1%
2 $100 $500 0.2000 105.3%
3 $5,720 $31,800 0.1799 94.7%
4 $3,230 $17,400 0.1856 97.7%
5 $11,540 $59,100 0.1953 102.8%
6 $1,330 $16,200 0.0821 43.2%
7 $4,580 $25,900 0.1768 93.1%
8 $3,290 $20,800 0.1582 83.3%
9 $3,840 $22,300 0.1722 90.6%
10 $5,350 $35,700 0.1499 78.9%
11 $160 $700 0.2286 120.3%
*Ratio/0.19 considers the residential assessment rate

STATE TAX COMMISSION OF MISSOURI
ASSESSOR MANUAL
CHAPTER:
RATIO STUDY
REVISION DATE: 10/5/2018 Page 70 of 77
V70
For the mean ratio from the data provided in Table 1, one would add all of the ratio values together and divide by the number of samples. In this scenario,
%26.8919.01696.01696.0
11
8655.1
11
2286.01499.0...2000.01370.0
x
The mean is a biased statistic. A statistic is biased when the expected value is not equal to the population’s true value. The mean is biased because of the inherent properties of ratios. A ratio that is low can be overwhelmed by a ratio that is high. When a ratio of 50% (1:2) is averaged with a ratio of 200% (2:1), the result is 125% (5:4). The ratios signaling undervalued properties have a finite range of greater than 0 to less than 1, (0,1), and the ratios signaling overvalued properties have an infinite range of greater than 1 to infinity, (1,∞). The median, ,~x is the middle observation when the values of the data are arrayed (listed from smallest to largest; or listed from largest to smallest). If the number of observations is odd, If the number of observations is even,
thn
x
2
1~ ordered value.
2
2
1
2~
ththnn
x
ordered values.
That is, if the number of observations is odd, the middle observation of the ordered data is the median. When the number of observations is even, the average of the two middle-most ordered observations is the median.
Table 2
Assessed Sale Sample Value Value Ratio Rank 6 $1,330 $16,200 0.0821 1 1 $5,780 $42,200 0.1370 2 10 $5,350 $35,700 0.1499 3 8 $3,290 $20,800 0.1582 4 9 $3,840 $22,300 0.1722 5 7 $4,580 $25,900 0.1768 6 3 $5,720 $31,800 0.1799 7 4 $3,230 $17,400 0.1856 8 5 $11,540 $59,100 0.1953 9 2 $100 $500 0.2000 10 11 $160 $700 0.2286 11

STATE TAX COMMISSION OF MISSOURI
ASSESSOR MANUAL
CHAPTER:
RATIO STUDY
REVISION DATE: 10/5/2018 Page 71 of 77
V71
The median ratio is an ordered statistic that concerns itself only with the middlemost value(s). It is determined by listing the ratios in order and finding the one in the middle. Table 2 shows the ratios listed in an ascending (increasing) order. Since there are 11 samples, n=11.
%05.9319.01768.01768.06
2
12
2
111
2
1~
thththth
nx
The weighted median is a statistic with often similar results to the median, but accounting for weight toward certain aspects. In sales studies, we weight the median by both time (when the sale was made in comparison to the date of assessment), and location (most often school districts). It is calculated by assigning a weight to each sale ratio, ordering the data from lowest ratio to highest, and taking the cumulative weight at each ratio. The ratios that lie just prior and lust after the middle weighting are averaged, giving the weighted median. For example, the following data:
Assessed Sale Cumulative Sample Value Value Ratio Rank Weight Weight
6 $1,330 $16,200 0.0821 1 0.97431976 0.97431976 1 $5,780 $42,200 0.137 2 0.37591251 1.35023227 10 $5,350 $35,700 0.1499 3 0.68291225 2.03314452 8 $3,290 $20,800 0.1582 4 0.76941304 2.80255756 9 $3,840 $22,300 0.1722 5 0.87799612 3.68055368 7 $4,580 $25,900 0.1768 6 0.79930407 4.47985775 3 $5,720 $31,800 0.1799 7 0.58902894 5.06888669 4 $3,230 $17,400 0.1856 8 0.97559446 6.04448115 5 $11,540 $59,100 0.1953 9 0.96272843 7.00720958 2 $100 $500 0.2 10 0.83711521 7.84432479
11 $160 $700 0.2286 11 0.66527775 8.50960254

STATE TAX COMMISSION OF MISSOURI
ASSESSOR MANUAL
CHAPTER:
RATIO STUDY
REVISION DATE: 10/5/2018 Page 72 of 77
V72
The total cumulative weight of the data is 8.5096. Half this number is 4.2548. The weights prior and after this number are 3.6805 and 4.4798. The ratios at these weights are .1722 and .1768. Averaging these two numbers gives us
(.1722 + .1768) / 2 = .3490 / 2 = .1745 .1745/.19 = 91.84%
The weighted mean is another descriptive statistic that describes central tendency. Weighted means generally are used in physics to describe moments of inertia and the center of mass. However, the weighted mean can also be applied to population studies in statistics. The Commission measures the weighted mean in the ratio study. It is calculated by summing both the individual assessed values and the individual indicators of market value, sales prices or appraised values.
That is, for the weighted mean,
Appraised
Assessedxö .
The weighted mean reflects the relationship of the total assessed value to the total market value of each subclass. From Table 1, the weighted ratio would be discovered using the following formula:
%74.8619.01648.01648.0
600,272$
920,44$ˆ
Appraised
Assessedx
2. MEASUREMENTS OF VARIATION The Price Related Differential (PRD) is found by dividing the mean by the weighted mean. This comparison tests for equity between low market value properties and high value properties. Disparate values suggest that inequities may exist. Therefore, the State Tax Commission has adopted the IAAO Standard on Ratio Studies recommendation that price related differentials should lie between 0.98 and 1.03. A PRD above 1.00 suggests that the assessment values placed on high-value parcels are relatively lower than the assessment values placed on low-value parcels. The ratios for higher-valued properties would tend to be below the ratios for lower-valued properties. A PRD below 1.00 suggests that the assessment values placed on high value parcels are relatively higher than the assessment values placed on low-value parcels. The ratios for higher-valued properties would tend to be above the ratios for lower-valued properties.

STATE TAX COMMISSION OF MISSOURI
ASSESSOR MANUAL
CHAPTER:
RATIO STUDY
REVISION DATE: 10/5/2018 Page 73 of 77
V73
From the example above,
029.1%74.86
%26.89
anWeightedMe
MeanPRD
The Coefficient of Dispersion (COD) is a measurement of variability that assesses the horizontal uniformity of property. A lower Coefficient of Dispersion implies a lesser amount of variability. The COD measures the average percentage deviation of the ratios from the median ratio and is calculated from the following steps:
1. Subtracting the median from each ratio. 2. Taking the absolute value of the calculated differences. 3. Summing the absolute differences. 4. Dividing by the number of ratios to obtain the “average absolute deviation.” 5. Dividing by the median. 6. Multiplying by 100. From the data in Table 1, the coefficient of dispersion has been calculated:
Ratio 0.0821 0.1370 0.1499 0.1582 0.1722 0.1768 0.1799 0.1856 0.1953 0.2000 0.2286
Step 1 -0.0947 -0.0398 -0.0269 -0.0186 -0.0046 0.0000 0.0031 0.0088 0.0185 0.0232 0.0518
Step 2 0.0947 0.0398 0.0269 0.0186 0.0046 0.0000 0.0031 0.0088 0.0185 0.0232 0.0518
Step 3 0.2900
Step 4 0.0264
Step 5 0.1491
Step 6 14.9116 % Quartiles, like medians, are ordered statistics based on the nth observation. The median divides the data set into two distinct subsets: a lower subset and an upper subset. The lower subset consists of all data ranging from the minimum value to the median and the upper subset consists of all data ranging from the median to the maximum value. The first quartile is the median of the lower subset and the third quartile is the median of the upper subset. That is, when the data is ranked in ascending order, the data ranked at the 25th percentile is the first quartile and the data ranked at the 75th percentile is the third quartile. (The median can sometimes be considered as the second quartile.)
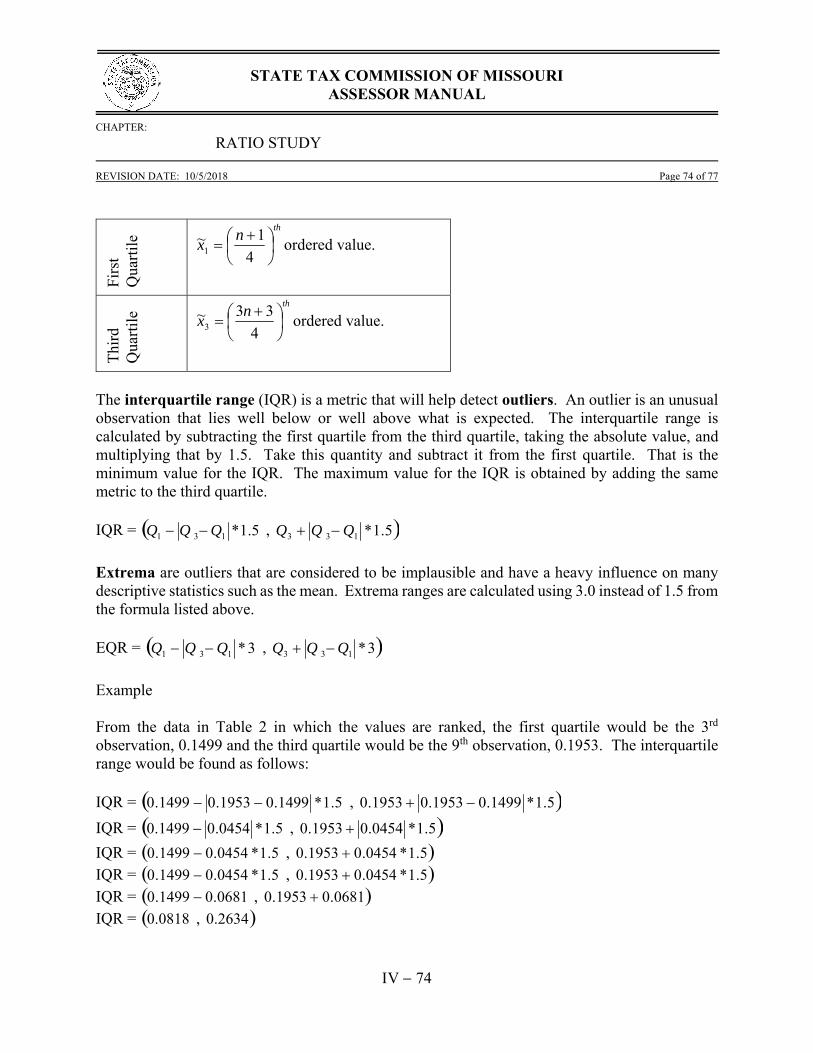
STATE TAX COMMISSION OF MISSOURI
ASSESSOR MANUAL
CHAPTER:
RATIO STUDY
REVISION DATE: 10/5/2018 Page 74 of 77
V74
Fir
st
Qua
rtil
e
thn
x
4
1~1 ordered value.
Thi
rd
Qua
rtil
e
thn
x
4
33~3 ordered value.
The interquartile range (IQR) is a metric that will help detect outliers. An outlier is an unusual observation that lies well below or well above what is expected. The interquartile range is calculated by subtracting the first quartile from the third quartile, taking the absolute value, and multiplying that by 1.5. Take this quantity and subtract it from the first quartile. That is the minimum value for the IQR. The maximum value for the IQR is obtained by adding the same metric to the third quartile. IQR = 5.1*131 QQQ , 5.1*133 QQQ
Extrema are outliers that are considered to be implausible and have a heavy influence on many descriptive statistics such as the mean. Extrema ranges are calculated using 3.0 instead of 1.5 from the formula listed above. EQR = 3*131 QQQ , 3*133 QQQ
Example From the data in Table 2 in which the values are ranked, the first quartile would be the 3rd observation, 0.1499 and the third quartile would be the 9th observation, 0.1953. The interquartile range would be found as follows: IQR = 5.1*1499.01953.01499.0 , 5.1*1499.01953.01953.0
IQR = 5.1*0454.01499.0 , 5.1*0454.01953.0
IQR = 5.1*0454.01499.0 , 5.1*0454.01953.0 IQR = 5.1*0454.01499.0 , 5.1*0454.01953.0 IQR = 0681.01499.0 , 0681.01953.0 IQR = 0818.0 , 2634.0

STATE TAX COMMISSION OF MISSOURI
ASSESSOR MANUAL
CHAPTER:
RATIO STUDY
REVISION DATE: 10/5/2018 Page 75 of 77
V75
The State Tax Commission’s trimming process uses the Interquartile Range method (with a 3.0 coefficient) applied to the logarithmic ratios.
1. Calculate the ratios for each individual in the sample. 2. Transform the ratios using the natural logarithm. 3. Compute trimming parameters using the logarithmic ratios.
a. First quartile 1Q ; (25th Percentile)
b. Third quartile 3Q ; (75th Percentile)
c. Interquartile Range; 13 QQ
4. Ratios below the lower limit, 3*131 QQQ , are removed.
5. Ratios above the upper limit, 3*133 QQQ , are removed.
The standard deviation measures a sample’s level of variability and spread. Calculating the standard deviation of a distribution without the aid of a computer spreadsheet application can easily become a difficult task.
Ste
p
The standard deviation of a sample is
11
2
n
xxs
n
ii
1 First, subtract the mean from each individual, xi xi- x 2 Square each of these differences. 2ix x 3 Add each of these differences together.
n
i
x1
2ix
4 Divide the sum of the squared differences by the number of observations minus 1.
1
x1
2i
n
xn
i
5 Take the square root of this value.
11
2
n
xxs
n
ii

STATE TAX COMMISSION OF MISSOURI
ASSESSOR MANUAL
CHAPTER:
RATIO STUDY
REVISION DATE: 10/5/2018 Page 76 of 77
V76
Using the data from Table 1, the Standard Deviation about the Mean would be calculated as follows:
Ratio 0.0821 0.1370 0.1499 0.1582 0.1722 0.1768 0.1799 0.1856 0.1953 0.2000 0.2286
Step 1 -0.0875 -0.0326 -0.0197 -0.0114 0.0026 0.0072 0.0103 0.0160 0.0257 0.0304 0.0590
Step 2 0.0077 0.0011 0.0004 0.0001 0.0000 0.0001 0.0001 0.0003 0.0007 0.0009 0.0035
Step 3 0.0147
Step 4 0.0015
Step 5 0.0384
To calculate a sample’s variance, another measurement of variability in a sample, use the same procedure as outlined above, but stop after step 4. That is, do not find the square root. The standard error in a mean ratio measures the extent to which each individual ratio in a sample differs from that of the predicted value. The standard error of the mean ratio can be estimated using a predicted value of the population’s standard deviation through the standard deviation of the sample. Standard Error
of Mean Ratio n
s .
Example: Recall s=0.0384, as observed in the standard deviation calculation. Recall n=11, which is the sample size.
The standard error of the mean ratio is 01158.011
0384.0
n
s
A confidence interval is a range in which the true estimator of the population is expected to lie based on a predetermined percent of accuracy. For example, a 95% confidence interval gives a range of values. These values predict that the true mean of the population from which the sample was taken lies within the interval. As the confidence level decreases from 95%, the range becomes smaller. Similarly, if the confidence level increases from 95%, the range becomes larger. The median confidence interval, unlike the confidence interval about the mean, is not based on the assumption of a normal distribution. It is found by ranking the data: sorting the data in order and assigning each data entry a number based on the value in relation to the others. If two or more data points are tied for the same rank, the rank assigned to these values is averaged. After ranking the data, determine if the number of entries is even or odd. If the number is even, the number of observations one must count up and down from the median to find the control limits for the 95% confidence interval about the median is found by:
2
96.1 nj

STATE TAX COMMISSION OF MISSOURI
ASSESSOR MANUAL
CHAPTER:
RATIO STUDY
REVISION DATE: 10/5/2018 Page 77 of 77
V77
If the number of observations is odd,
5.02
96.1
nj
After determining the value of j, round the value up to the highest integer. From the values that are ranked, find the median, and count up and down j data entries to find the limits of the confidence interval.