state street associates state street securities finance · state street associates state street...
TRANSCRIPT
State Street Associates
State Street Securities Finance
JANUARY 2013
Securities Lending: Assessing Portfolio Risk and Return
Securities Lending and the Asset-Liability Framework
The Loan Balance-at-Risk: An Empirical Look at Borrower Demand and its
Impact on the Size of the Loan Portfolio
The Cash Collateral Reinvestment Portfolio and the Importance of “Fat Tail”
Risk
Quantifying Product Risk to Aid the Institutional Investor in More Efficiently
Structuring its Securities Lending Program
State Street Associates
State Street Global Markets’ research
partnership with renowned academics,
State Street Associates, is creating a full
spectrum of proprietary investor behavior
indicators, risk indices, inflation series
and advisory research services.
State Street Global Markets
State Street Global Markets provides
specialized research, trading, securities
lending and innovative portfolio
strategies to owners and managers of
institutional assets.
Authors – State Street Associates
David Chua, PhD
Hans-Christian Lüdemann, PhD
Authors – State Street Securities
Finance
Crossan Barnes
Leslie Levine, CFA
Glenn Horner, CFA, FRM
Jeffrey Trencher, CFA
Please refer to the Appendix for
important legal information.

2
STATE STREET ASSOCIATES
STATE STREET SECURITIES FINANCE
Contents
Executive Summary p. 3
Securities Lending: A Brief Overview p. 4
The Relationship Between the Loan and Collateral Portfolios p. 5
The Loan Portfolio: Balance-at-Risk p. 7
Collateral Reinvestment p. 9
Summary p. 13
Appendix p. 14

3
STATE STREET ASSOCIATES
STATE STREET SECURITIES FINANCE
EXECUTIVE SUMMARY
The financial crisis of 2008 provided evidence of the effects of some well-known risks within securities lending programs. Most
obvious was the potential exposure that could result from a borrower default, such as Lehman Brothers. The crisis also
highlighted the potential impact of a default by an issuer of a security within a collateral reinvestment pool and the effects on
reinvestment net asset values that may result from widening credit spreads. However, one previously underestimated risk for
securities lenders that crystallized during late 2008 and early 2009 was liquidity risk.
During the financial crisis, equity markets declined by more than 40 percent,1 requiring lenders to return substantial amounts of
cash collateral to borrowers through the daily mark-to-market process. Typically, mark-to-market requirements were (and are
today) met with cash from maturing securities priced near par. As these securities became a lesser portion of the reinvestment
pools in 2008 and 2009, other securities that had declined in value had a more pronounced impact on the collateral pools’ total
net asset values. Moreover, the maturing liquidity within some lenders’ reinvestment pools was insufficient to meet required mark-
to-markets. These lenders then may have been faced with the difficult choice of either lending additional securities at unattractive
rebate rates and/or realizing losses from the sale of reinvestment assets that had declined in value due to widening credit
spreads.
Securities lending offers institutions an opportunity to generate additional income from their portfolios. That said, any discussion
regarding the desirability of participating in a securities lending program must include a thoughtful dialogue about program risks
and their role in producing income. We endeavor herein to further delineate and quantify the investment risk for lenders, focusing
on the asset-liability framework integral to any lending program for which cash collateral is accepted and reinvested.
We begin with a brief overview of the securities lending relationship from the institutional lender’s perspective. Thereafter, we
study the interaction between the components of a lender’s integrated portfolio. For the purpose of this paper, we focus on an
integrated portfolio comprised of a portfolio of loaned securities for which the lender receives cash collateral and a corresponding
collateral reinvestment portfolio.
Fluctuations in the value of the loan portfolio are driven by a multitude of factors, including the market prices for the loaned
securities, the demand to borrow these securities, underlying portfolio changes and the lender’s overarching lending program
guidelines. All of these elements determine a lender’s Loan Portfolio Balance-at-Risk.
Fluctuations in the value of the collateral reinvestment portfolio are driven by a variety of factors. In this paper we focus on the
impact of interest rate and spread changes and we highlight the need to properly consider the potential for rare but large tail
losses in the context of a cash collateral reinvestment portfolio.
Tying these two major elements together, we conclude that understanding and evaluating the characteristics of the lendable
asset base can help lenders better define the credit and maturity profile of their cash collateral portfolios.
1 The S&P 500, for example, fell from a value of 1,192.70 on September 15, 2008 to 676.53 on March 9, 2009, for a cumulative return of -43.3 percent.

4
STATE STREET ASSOCIATES
STATE STREET SECURITIES FINANCE
SECURITIES LENDING: A BRIEF OVERVIEW
Securities lending offers an opportunity for institutional investors to derive incremental income from the securities in their
portfolios by making these holdings available for loan. In a securities-lending transaction, a beneficial owner of securities acts as
a lender and temporarily transfers securities to another investor acting as a borrower.
An investor may seek to borrow securities for a variety of reasons, each of which ultimately involves the need to deliver a security
the investor does not have in its possession. Reasons to borrow include the requirement to deliver a sold security it has not
received, such as from a failed purchase, to create a short position in a security or as part of a financing strategy.
In exchange for the securities loan, the borrower delivers to the lender (or its agent) collateral plus margin, generally ranging
between 102 percent and 105 percent. The dollar amount of the margin is adjusted daily in response to price movements of the
loaned securities. The lender can terminate the loan in accordance with the contract specific to the securities loan, generally a
standard settlement cycle based on contractual obligations of the borrower.
Depending on the type of collateral delivered, lenders may earn income in two ways:
When a lender accepts cash collateral, the lender reinvests the cash, typically in a short-term fixed income portfolio, and captures
the yield of this portfolio. Borrowers, in turn, demand payment of interest on the cash they post as collateral. This interest is called
a rebate and its rate is specific for each securities loan transaction. The demand for borrowing said security may be driven by a
variety of factors including settlement needs, tax considerations, merger and acquisition or capital raising activity, short interest or
other arbitrage activity, and by its lendable supply. Note that in the current near 0 percent rate environment many loans are priced
with negative rebate rates that actually represent interest received from borrowers. The lender earns income according to the
difference between the earnings from the collateral reinvestment portfolio and the rebate paid to borrowers. A sample transaction
is outlined in the Appendix in Figure A-1.
When non-cash collateral is posted, the borrower pays a fee to the lender. Similar to the rebate rate, this fee is based on the
demand for borrowing a given security and its supply.
Typically, asset holders contract with an external service provider such as a master custodian or an unaffiliated lending agent to
manage the process of lending securities and reinvesting cash collateral. The revenue generated from lending securities is split
between the lender and the lending agent at a predetermined rate.
5
STATE STREET ASSOCIATES
STATE STREET SECURITIES FINANCE
THE RELATIONSHIP BETWEEN THE LOAN AND COLLATERAL PORTFOLIOS
An important part of the risk management process in securities lending is managing the relationship between the loan portfolio,
i.e., the liabilities, and the reinvestment portfolio, i.e., the assets.2 This relationship must be managed from both an interest rate
and liquidity perspective. Historically, much of the industry’s attention was directed toward managing the interest rate relationship
between the loan and reinvestment portfolios, particularly during periods of volatile and/or changing interest rate levels. Said
otherwise, participants focused on ensuring the yield of the collateral portfolio exceeded the rebate rate to be paid, while still
managing the reinvestment portfolio within guidelines. Although always important, the liquidity interrelationship of the two
portfolios did not attract substantial concern prior to the financial crisis of 2007-2008. Beginning at that time, however, declining
equity values, reduced borrowing demand, uncertain participation by asset holders and illiquidity in the short-term fixed income
market strained the liquidity of cash reinvestment pools just when the prices of the pools’ underlying assets were also under
pressure.
To frame our discussion, we introduce here a concept termed the Loan Portfolio Balance-at-Risk. At inception, the reinvestment
portfolio manager invests cash received from borrowers and the value of the collateral portfolio closely matches the value of the
loan portfolio. The collateral margin accounts for the difference. If the value of the loan portfolio rises, the reinvestment portfolio
manager can purchase more securities in the asset portfolio using the additional cash collateral received from the borrowers. If
the value of the loan portfolio falls, however, either the lending desk or the reinvestment portfolio manager must raise cash. The
lending desk may raise cash by lending additional securities. Additionally or alternatively, the reinvestment portfolio manager may
use existing overnight liquidity or sell assets from the collateral portfolio.
Generally, the reinvestment portfolio manager’s expected ability to meet liquidity requirements over a given time frame depends
on the following factors:
Loan Portfolio Balance-at-Risk: The expected change in the balance of the loan portfolio due to changes in the prices of the
underlying securities on loan and changes in the volume of securities on loan (utilization).
Both the speed and the extent of these changes are specific to the composition of the loan portfolio. All else equal, a loan
portfolio that consists of higher volatility assets or assets that exhibit larger variations in utilization will be subject to larger
fluctuations in value.
Collateral Liquidity: The fraction of the collateral that matures within a specified time frame.
If the collateral reinvestment portfolio does not contain sufficient cash (or shorter maturity assets rolling to cash) to return
requested collateral to borrowers, the reinvestment portfolio manager may be required to sell additional assets before they
mature. The portfolio manager may receive less than amortized cost upon the sale of the additional securities due to the price
impact of interest rate and credit spread volatility. Therefore, particularly in periods of market stress, required asset sales may
result in realized losses.
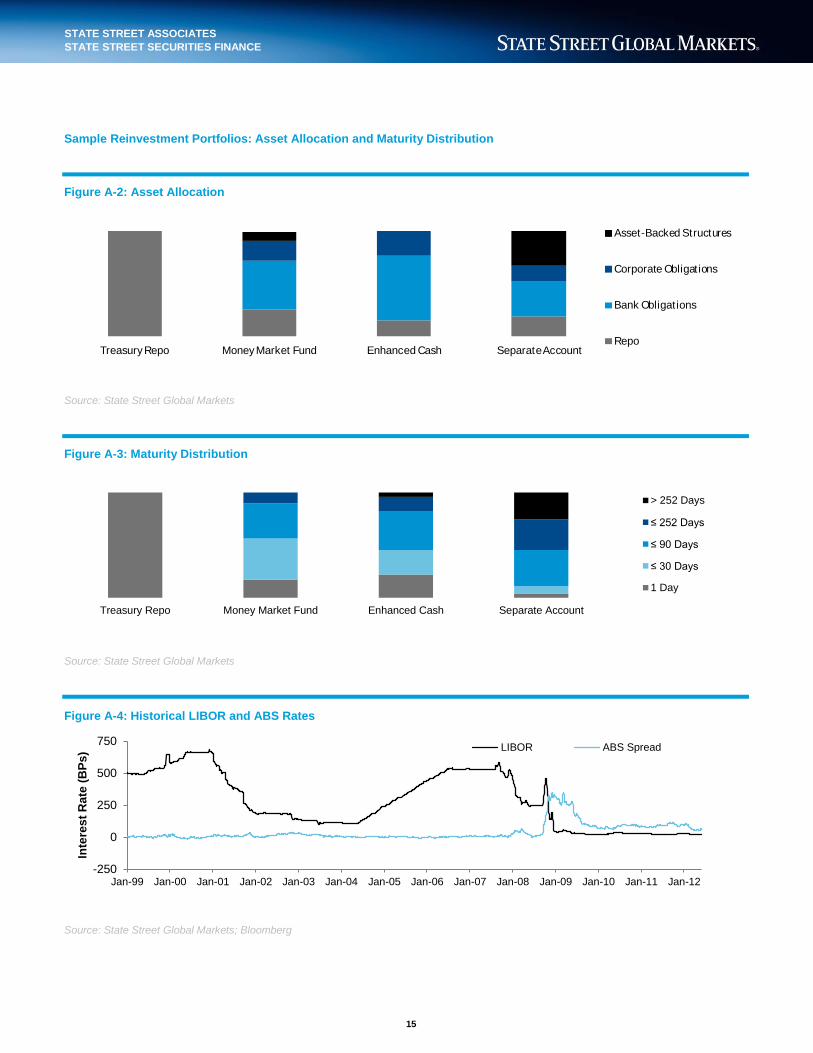
2 Figures A-2 and A-3 in the Appendix show the characteristics of sample collateral reinvestment portfolios.
6
STATE STREET ASSOCIATES
STATE STREET SECURITIES FINANCE
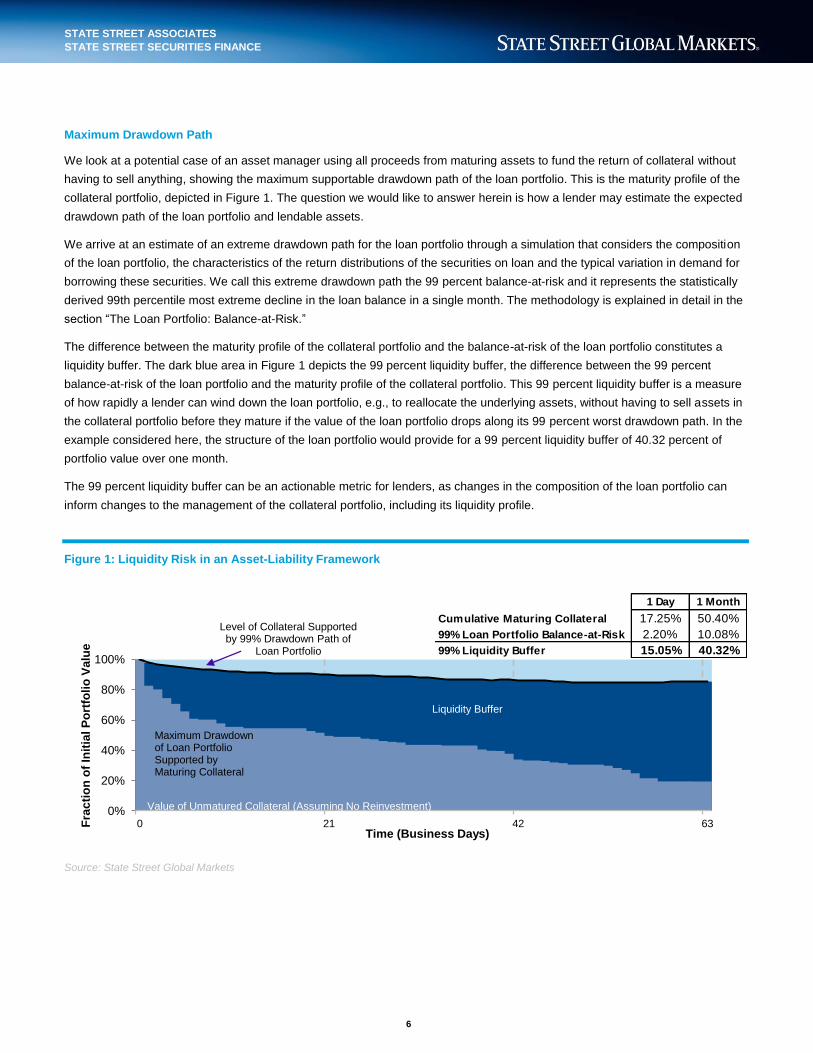
Maximum Drawdown Path
We look at a potential case of an asset manager using all proceeds from maturing assets to fund the return of collateral without
having to sell anything, showing the maximum supportable drawdown path of the loan portfolio. This is the maturity profile of the
collateral portfolio, depicted in Figure 1. The question we would like to answer herein is how a lender may estimate the expected
drawdown path of the loan portfolio and lendable assets.
We arrive at an estimate of an extreme drawdown path for the loan portfolio through a simulation that considers the composition
of the loan portfolio, the characteristics of the return distributions of the securities on loan and the typical variation in demand for
borrowing these securities. We call this extreme drawdown path the 99 percent balance-at-risk and it represents the statistically
derived 99th percentile most extreme decline in the loan balance in a single month. The methodology is explained in detail in the
section “The Loan Portfolio: Balance-at-Risk.”
The difference between the maturity profile of the collateral portfolio and the balance-at-risk of the loan portfolio constitutes a
liquidity buffer. The dark blue area in Figure 1 depicts the 99 percent liquidity buffer, the difference between the 99 percent
balance-at-risk of the loan portfolio and the maturity profile of the collateral portfolio. This 99 percent liquidity buffer is a measure
of how rapidly a lender can wind down the loan portfolio, e.g., to reallocate the underlying assets, without having to sell assets in
the collateral portfolio before they mature if the value of the loan portfolio drops along its 99 percent worst drawdown path. In the
example considered here, the structure of the loan portfolio would provide for a 99 percent liquidity buffer of 40.32 percent of
portfolio value over one month.
The 99 percent liquidity buffer can be an actionable metric for lenders, as changes in the composition of the loan portfolio can
inform changes to the management of the collateral portfolio, including its liquidity profile.
Figure 1: Liquidity Risk in an Asset-Liability Framework
Source: State Street Global Markets
0%
20%
40%
60%
80%
100%
0 21 42 63Time (Business Days)
Liquidity Buffer
Fra
cti
on
of
Init
ial P
ort
foli
o V
alu
e
Value of Unmatured Collateral (Assuming No Reinvestment)
Level of Collateral Supportedby 99% Drawdown Path of
Loan Portfolio
Maximum Drawdownof Loan PortfolioSupported by Maturing Collateral
1 Day 1 Month
Cumulative Maturing Collateral 17.25% 50.40%
99% Loan Portfolio Balance-at-Risk 2.20% 10.08%
99% Liquidity Buffer 15.05% 40.32%
7
STATE STREET ASSOCIATES
STATE STREET SECURITIES FINANCE
THE LOAN PORTFOLIO: BALANCE-AT-RISK
The value of the loan portfolio is influenced by the following key drivers:
Market movement: Changes in market prices of the securities on loan.
Demand for securities to borrow: Changes in demand influence asset utilization (i.e., the fraction of the lendable portfolio
that is on loan to borrowers).
Asset allocation and portfolio management: A lender, or asset manager acting on behalf of a lender, may wish to sell
assets that are currently on loan and purchase other assets. These new assets may not be lendable or may have different
utilization characteristics.
Operating cash flows: A lender may need to draw on the lendable portfolio, e.g., to make benefit payments, reducing
lendable assets.
Lender’s securities lending program guidelines, including:
Cash collateral portfolio yield: Generally, for loans versus cash (and excluding a scenario where the sale of
collateral assets may generate a realized loss), a lender seeks to maintain only those loans for which there is a
positive net spread between the cash collateral portfolio’s yield and the rebate rate due to the borrower.
Minimum spread requirements: A lender may wish to transact only loans with a minimum demand spread.
Approved counterparties
The first two drivers outlined above — changes in the market prices for the securities in the portfolio and changes in the demand
to borrow these securities (“utilization”) — are out of the lender’s control. The other factors are important, but we focus here on
measuring the potential risk in the factors that are independent of lender-directed actions, with the goal of helping lenders to
better inform their decision-making when establishing program parameters meant to suit their risk profile. To illustrate, we present
a typical client loan portfolio in Figure 2.
Figure 2: Composition of a Typical Loan Portfolio
Source: State Street Global Markets
Equities Fixed Income
US S&P 500 32.1% US Gov't. Treasury Bonds 10.7%
Russell 2000 10.7% Treasury Notes 10.7%
Japan Nikkei 225 8.7% USD Corp. Inv't. Grade 14.3%
France CAC 40 3.5%
Australia ASX 50 3.4%
Germany DAX 3.1%
Spain IBEX 1.3%
Hong Kong Hang Seng 1.1%
Norway OBX 0.4%
64.3% 35.7%
8
STATE STREET ASSOCIATES
STATE STREET SECURITIES FINANCE
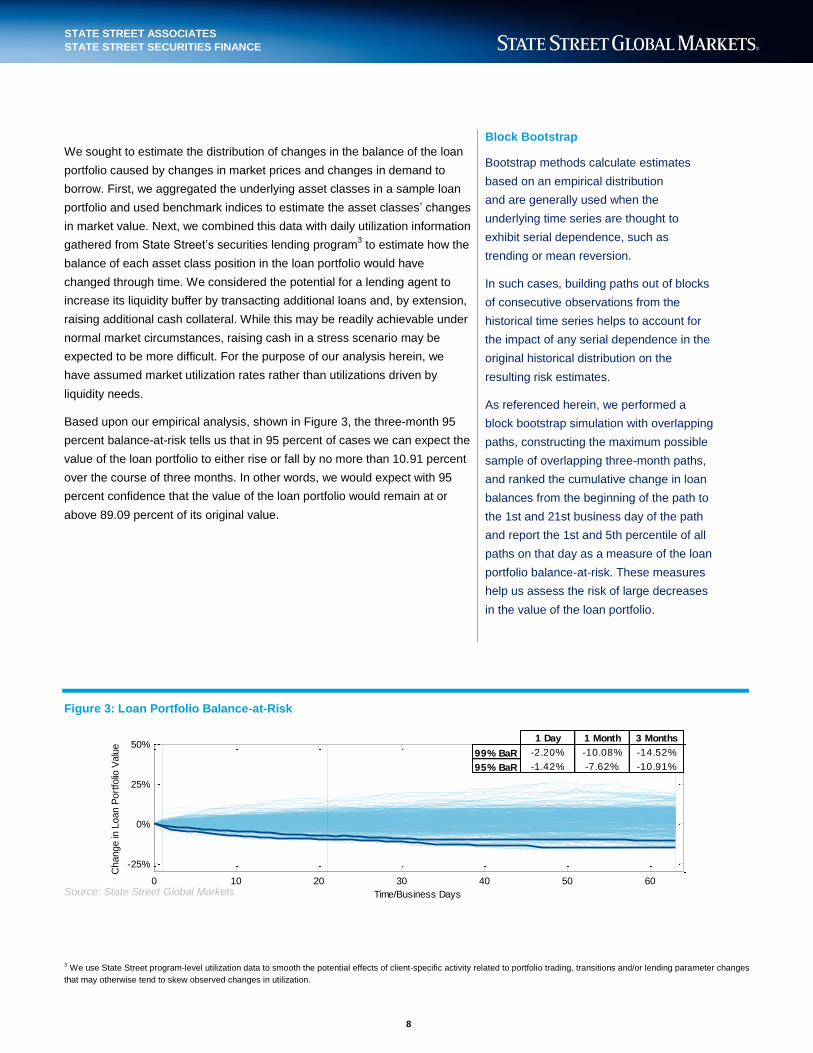
We sought to estimate the distribution of changes in the balance of the loan
portfolio caused by changes in market prices and changes in demand to
borrow. First, we aggregated the underlying asset classes in a sample loan
portfolio and used benchmark indices to estimate the asset classes’ changes
in market value. Next, we combined this data with daily utilization information
gathered from State Street’s securities lending program3 to estimate how the
balance of each asset class position in the loan portfolio would have
changed through time. We considered the potential for a lending agent to
increase its liquidity buffer by transacting additional loans and, by extension,
raising additional cash collateral. While this may be readily achievable under
normal market circumstances, raising cash in a stress scenario may be
expected to be more difficult. For the purpose of our analysis herein, we
have assumed market utilization rates rather than utilizations driven by
liquidity needs.
Based upon our empirical analysis, shown in Figure 3, the three-month 95
percent balance-at-risk tells us that in 95 percent of cases we can expect the
value of the loan portfolio to either rise or fall by no more than 10.91 percent
over the course of three months. In other words, we would expect with 95
percent confidence that the value of the loan portfolio would remain at or
above 89.09 percent of its original value.
Figure 3: Loan Portfolio Balance-at-Risk
Source: State Street Global Markets
3 We use State Street program-level utilization data to smooth the potential effects of client-specific activity related to portfolio trading, transitions and/or lending parameter changes
that may otherwise tend to skew observed changes in utilization.
Block Bootstrap
Bootstrap methods calculate estimates
based on an empirical distribution
and are generally used when the
underlying time series are thought to
exhibit serial dependence, such as
trending or mean reversion.
In such cases, building paths out of blocks
of consecutive observations from the
historical time series helps to account for
the impact of any serial dependence in the
original historical distribution on the
resulting risk estimates.
As referenced herein, we performed a
block bootstrap simulation with overlapping
paths, constructing the maximum possible
sample of overlapping three-month paths,
and ranked the cumulative change in loan
balances from the beginning of the path to
the 1st and 21st business day of the path
and report the 1st and 5th percentile of all
paths on that day as a measure of the loan
portfolio balance-at-risk. These measures
help us assess the risk of large decreases
in the value of the loan portfolio.
0 10 20 30 40 50 60
-25%
0%
25%
50%
Time/Business Days
Change in
Loan P
ort
folio
Valu
e
1 Day 1 Month 3 Months
99% BaR -2.20% -10.08% -14.52%
95% BaR -1.42% -7.62% -10.91%

9
STATE STREET ASSOCIATES
STATE STREET SECURITIES FINANCE
COLLATERAL REINVESTMENT
Having explored the potential for loan balance declines and their potential impact on collateral portfolio liquidity, we next focus on
the market factors that may negatively impact the amortized cost of the collateral investments. Specifically, we focus on the
market risk in the collateral reinvestment portfolio and analyze the effects of changes in benchmark interest rates and credit
spreads on a number of typical reinvestment portfolios.
Portfolio Choices and Market Risk
In seeking to generate high risk-adjusted returns from reinvesting collateral, an agent lender has the option to adjust the
composition of the reinvestment portfolio to optimally capture various incremental premiums. For a cash collateral reinvestment
portfolio, investment managers typically focus on the following:
• Term premium: By adjusting the duration of the reinvestment portfolio
• Credit premium: By investing in assets of different credit quality
Capturing either of these premiums exposes the reinvestment portfolio and the returns associated with the securities lending
program to market and liquidity risks: changes in interest rates and/or credit spreads may change the market value of the
securities in the reinvestment portfolio at the same time as a decrease in market prices or the demand for borrowing securities
reduces the value of the loan portfolio.
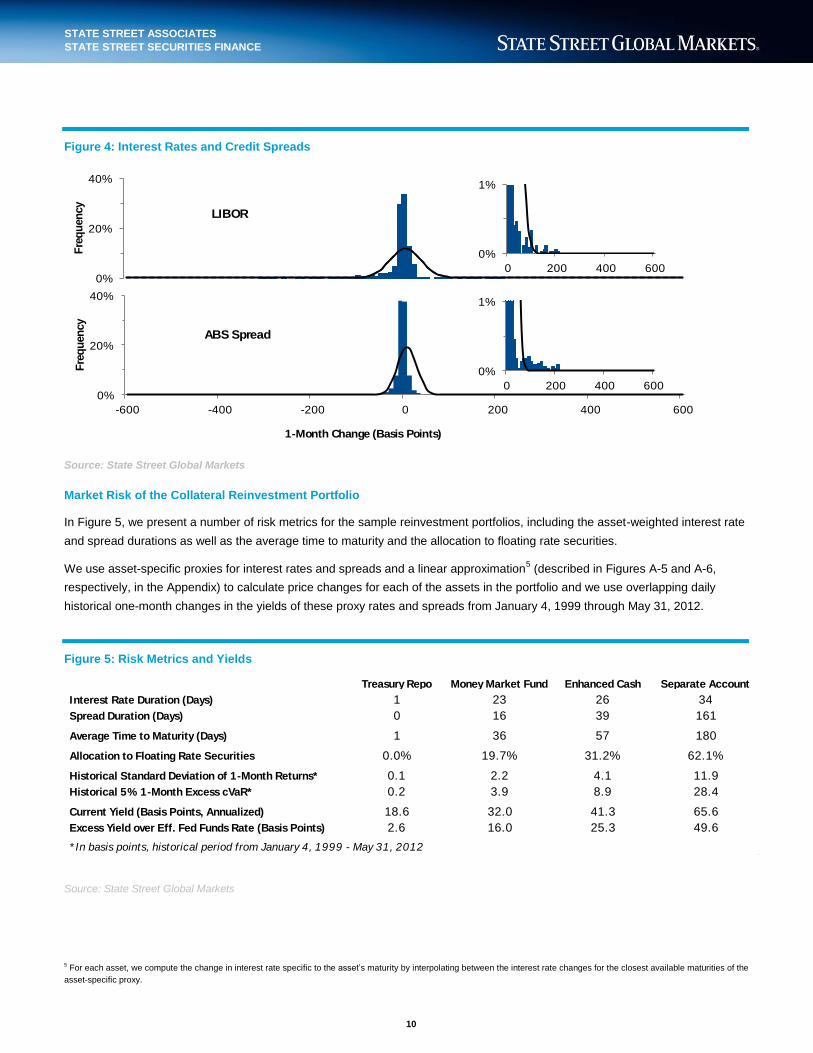
To illustrate the magnitude and distribution of interest rates and credit spreads and their potential impacts on security values, we
consider 30-day LIBOR as a benchmark interest rate and the two-year AAA Asset Backed Securities spread as a benchmark
credit spread.
In Figure 4 we show histograms of the overlapping one-month changes in rates and spreads as dark blue bars.4 The
superimposed black lines represent a normal distribution with the same mean and standard deviation as the empirical changes in
interest rates and credit spreads.
To illustrate that large changes in rates and spreads occur significantly more often than a normal probability distribution would
suggest (i.e., that the empirical distributions have significantly more pronounced “fat tails” — the tails of the distribution being the
far left and right sides that converge on the horizontal axis), we have magnified the section of the histogram depicting large
increases in rates and spreads. These increases correspond to losses in a collateral reinvestment portfolio. To properly account
for this deviation from normality, we use analytical methods that rely on historical data rather than a more traditional mean-
variance (normal distribution based) risk model. We consider tail-risk metrics such as the conditional Value-at-Risk (cVaR),
defined here as the mean of the worst 5 percent of one-month returns.
4 This is based on daily data from January 4, 1999 through May 31, 2012. In Figure A-4 in the Appendix, we show historical values for LIBOR and ABS spread for this time period.
10
STATE STREET ASSOCIATES
STATE STREET SECURITIES FINANCE
Figure 4: Interest Rates and Credit Spreads
Source: State Street Global Markets
Market Risk of the Collateral Reinvestment Portfolio
In Figure 5, we present a number of risk metrics for the sample reinvestment portfolios, including the asset-weighted interest rate
and spread durations as well as the average time to maturity and the allocation to floating rate securities.
We use asset-specific proxies for interest rates and spreads and a linear approximation5 (described in Figures A-5 and A-6,
respectively, in the Appendix) to calculate price changes for each of the assets in the portfolio and we use overlapping daily
historical one-month changes in the yields of these proxy rates and spreads from January 4, 1999 through May 31, 2012.
Figure 5: Risk Metrics and Yields
Source: State Street Global Markets
5 For each asset, we compute the change in interest rate specific to the asset’s maturity by interpolating between the interest rate changes for the closest available maturities of the
asset-specific proxy.
0%
20%
40%
-600 -400 -200 0 200 400 600
Fre
qu
en
cy
1-Month Change (Basis Points)
ABS Spread
0%
1%
0 200 400 600
0%
20%
40%
Fre
qu
en
cy
LIBOR
0%
1%
0 200 400 600
Treasury Repo Money Market Fund Enhanced Cash Separate Account
Interest Rate Duration (Days) 1 23 26 34
Spread Duration (Days) 0 16 39 161
Average Time to Maturity (Days) 1 36 57 180
Allocation to Floating Rate Securities 0.0% 19.7% 31.2% 62.1%
Historical Standard Deviation of 1-Month Returns* 0.1 2.2 4.1 11.9
Historical 5% 1-Month Excess cVaR* 0.2 3.9 8.9 28.4
Current Yield (Basis Points, Annualized) 18.6 32.0 41.3 65.6
Excess Yield over Eff. Fed Funds Rate (Basis Points) 2.6 16.0 25.3 49.6
* In basis points, historical period from January 4, 1999 - May 31, 2012

11
STATE STREET ASSOCIATES
STATE STREET SECURITIES FINANCE
With the information gleaned thus far, we consider in more detail the market
risk of the collateral reinvestment portfolio, alongside an assumed large
decrease in the dollar value of the securities on loan.
As we know, drawdowns in the loan portfolio may be caused by a drop in
market value of the securities on loan, by a drop in the demand for
borrowing these securities, by lender restrictions or by other portfolio
management related decisions.
Such a reduction in the value of the loan portfolio requires that the value of
the collateral reinvestment portfolio be reduced accordingly. In the event that
cash returned to borrowers is comprised of cash from maturing (i.e., short-
duration) assets, a reduction in the value of the loan portfolio will indirectly
increase the duration of the remaining collateral portfolio and may
exacerbate the effect of interest rate and spread changes on the unit price of
the remaining portfolio.
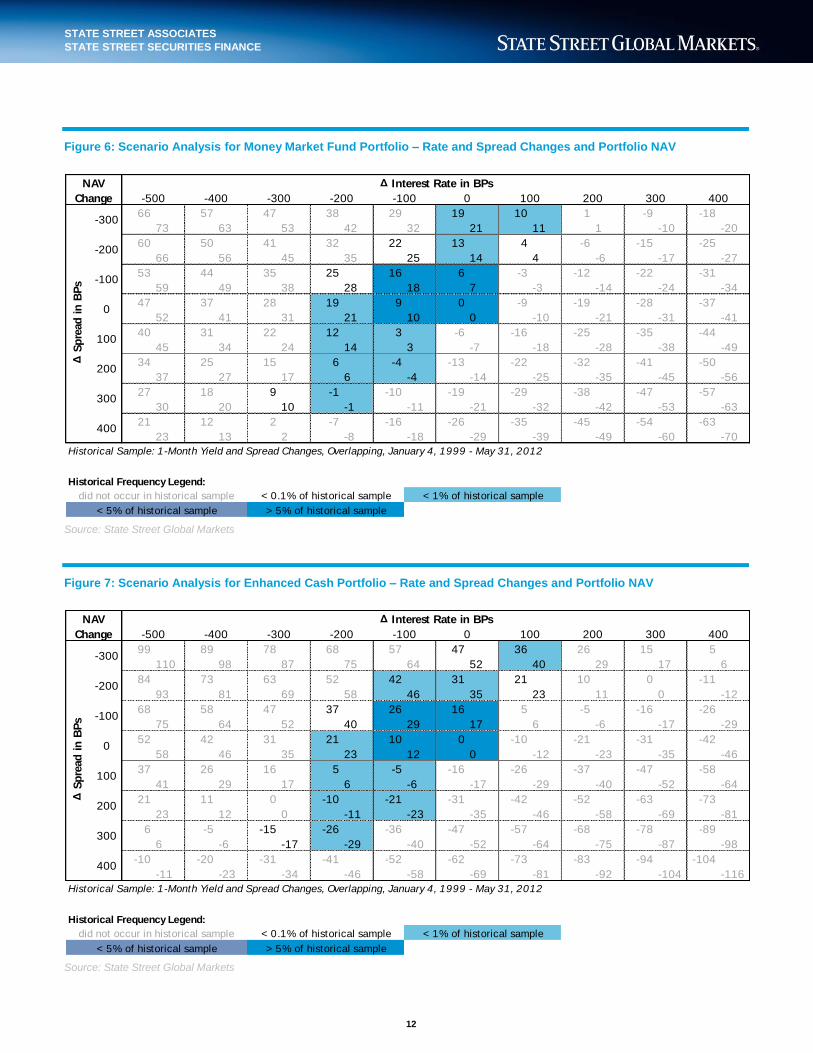
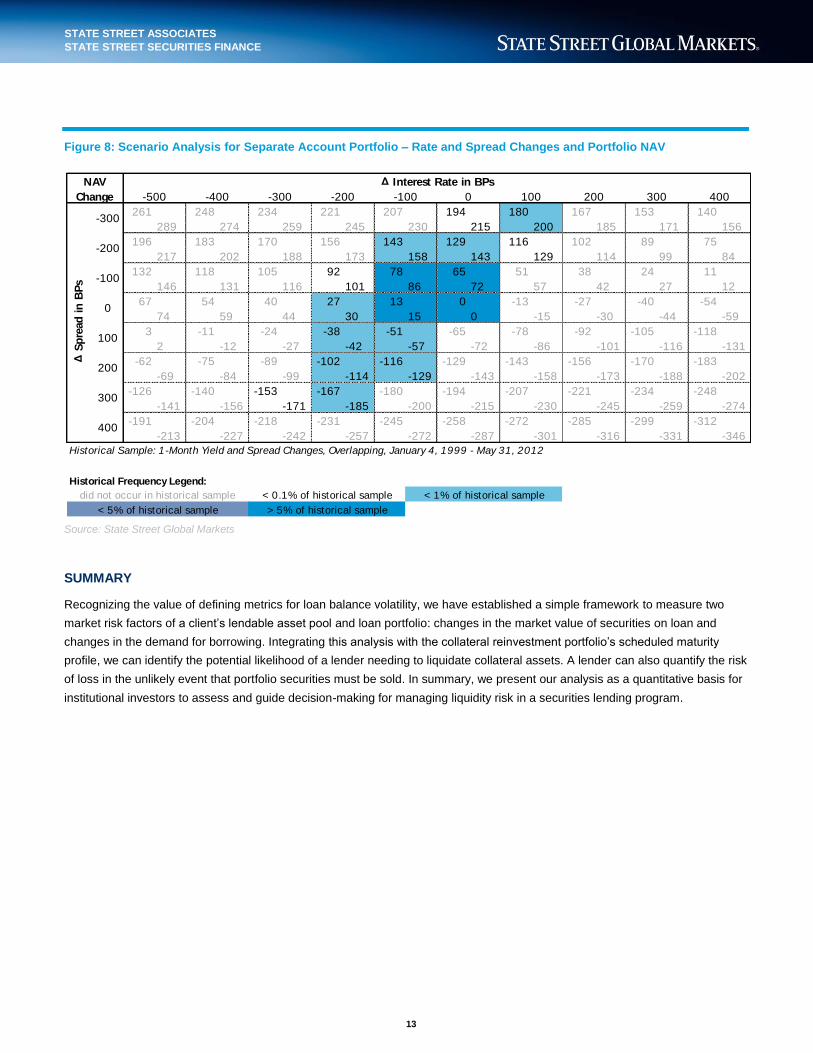
In Figures 6, 7 and 8, we present three scenario analyses of the effect of
different combinations of interest rate and spread changes on the value of
the lender’s reinvestment portfolio. In Figure 6, we assume the reinvestment
portfolio is a money market fund. In Figure 7, we assume the lender
reinvests cash collateral in an enhanced cash portfolio. In Figure 8, we
assume the lender reinvests cash collateral in a separate account portfolio
with relatively broader investment guidelines. The top left number in each
cell corresponds to the simulated change in the NAV of the reinvestment
portfolio (as of May 31, 2012) if interest rates changed by the amount in the
top row and spreads changed by the amount in the leftmost column. The
bottom right number in each cell corresponds to the simulated change in
NAV if the collateral portfolio simultaneously experiences a redemption
equal to 99 percent of the Loan Portfolio Balance-at-Risk.
The shading of the cell denotes the frequency with which this combination of asset-weighted yield and spread change over one
month was observed in the historical sample period. For the historical period we examined, simultaneous detrimental moves in
both interest rates and credit spreads occurred very infrequently. This methodology gives us another means of viewing the
potential for extreme events.
Note that for other portfolios, similar joint rate and spread changes may lead to larger or smaller changes in portfolio value,
depending on the characteristics of the portfolio.
Price Returns of the Collateral
Reinvestment Portfolio
The price of assets in the collateral portfolio
responds to changes in both interest rates
and credit spreads.
Throughout, we approximate the
interest rate duration or the change in
the price of an asset in response to a
change in interest rates for fixed rate
assets with the asset’s time to maturity.
The interest rate duration for floating rate
securities is assumed to be relatively small,
even for assets with a long time to maturity,
as their yield is quoted as a spread over a
specified benchmark interest rate, typically
LIBOR, and the benchmark rate resets at
pre-specified intervals of typically one or
three months.
Floating rate securities are, however,
subject to spread rate risk. When
credit spreads rise, the price of a floating
rate asset may fall substantially, as the
spread duration is approximately equal to
the time to expected maturity of the floating
rate asset.
12
STATE STREET ASSOCIATES
STATE STREET SECURITIES FINANCE
Figure 6: Scenario Analysis for Money Market Fund Portfolio – Rate and Spread Changes and Portfolio NAV
Source: State Street Global Markets
Figure 7: Scenario Analysis for Enhanced Cash Portfolio – Rate and Spread Changes and Portfolio NAV
Source: State Street Global Markets
66 57 47 38 29 19 10 1 -9 -18
73 63 53 42 32 21 11 1 -10 -20
60 50 41 32 22 13 4 -6 -15 -25
66 56 45 35 25 14 4 -6 -17 -27
53 44 35 25 16 6 -3 -12 -22 -31
59 49 38 28 18 7 -3 -14 -24 -34
47 37 28 19 9 0 -9 -19 -28 -37
52 41 31 21 10 0 -10 -21 -31 -41
40 31 22 12 3 -6 -16 -25 -35 -44
45 34 24 14 3 -7 -18 -28 -38 -49
34 25 15 6 -4 -13 -22 -32 -41 -50
37 27 17 6 -4 -14 -25 -35 -45 -56
27 18 9 -1 -10 -19 -29 -38 -47 -57
30 20 10 -1 -11 -21 -32 -42 -53 -63
21 12 2 -7 -16 -26 -35 -45 -54 -63
23 13 2 -8 -18 -29 -39 -49 -60 -70
Historical Sample: 1-Month Yield and Spread Changes, Overlapping, January 4, 1999 - May 31, 2012
Historical Frequency Legend:
< 5% of historical sample > 5% of historical sample
Δ S
pre
ad
in
BP
s
NAV
Change
did not occur in historical sample < 0.1% of historical sample < 1% of historical sample
0
100
200
300
400
Δ Interest Rate in BPs
-300-400-500
-300
-200
-100
4003002001000-100-200
99 89 78 68 57 47 36 26 15 5
110 98 87 75 64 52 40 29 17 6
84 73 63 52 42 31 21 10 0 -11
93 81 69 58 46 35 23 11 0 -12
68 58 47 37 26 16 5 -5 -16 -26
75 64 52 40 29 17 6 -6 -17 -29
52 42 31 21 10 0 -10 -21 -31 -42
58 46 35 23 12 0 -12 -23 -35 -46
37 26 16 5 -5 -16 -26 -37 -47 -58
41 29 17 6 -6 -17 -29 -40 -52 -64
21 11 0 -10 -21 -31 -42 -52 -63 -73
23 12 0 -11 -23 -35 -46 -58 -69 -81
6 -5 -15 -26 -36 -47 -57 -68 -78 -89
6 -6 -17 -29 -40 -52 -64 -75 -87 -98
-10 -20 -31 -41 -52 -62 -73 -83 -94 -104
-11 -23 -34 -46 -58 -69 -81 -92 -104 -116
Historical Sample: 1-Month Yield and Spread Changes, Overlapping, January 4, 1999 - May 31, 2012
Historical Frequency Legend:
400
did not occur in historical sample < 0.1% of historical sample < 1% of historical sample
< 5% of historical sample > 5% of historical sample
300 400
Δ S
pre
ad
in
BP
s
-300
-200
-100
0
100
200
300
NAV
Change
Δ Interest Rate in BPs
-500 -400 -300 -200 -100 0 100 200
13
STATE STREET ASSOCIATES
STATE STREET SECURITIES FINANCE
Figure 8: Scenario Analysis for Separate Account Portfolio – Rate and Spread Changes and Portfolio NAV
Source: State Street Global Markets
SUMMARY
Recognizing the value of defining metrics for loan balance volatility, we have established a simple framework to measure two
market risk factors of a client’s lendable asset pool and loan portfolio: changes in the market value of securities on loan and
changes in the demand for borrowing. Integrating this analysis with the collateral reinvestment portfolio’s scheduled maturity
profile, we can identify the potential likelihood of a lender needing to liquidate collateral assets. A lender can also quantify the risk
of loss in the unlikely event that portfolio securities must be sold. In summary, we present our analysis as a quantitative basis for
institutional investors to assess and guide decision-making for managing liquidity risk in a securities lending program.
261 248 234 221 207 194 180 167 153 140
289 274 259 245 230 215 200 185 171 156
196 183 170 156 143 129 116 102 89 75
217 202 188 173 158 143 129 114 99 84
132 118 105 92 78 65 51 38 24 11
146 131 116 101 86 72 57 42 27 12
67 54 40 27 13 0 -13 -27 -40 -54
74 59 44 30 15 0 -15 -30 -44 -59
3 -11 -24 -38 -51 -65 -78 -92 -105 -118
2 -12 -27 -42 -57 -72 -86 -101 -116 -131
-62 -75 -89 -102 -116 -129 -143 -156 -170 -183
-69 -84 -99 -114 -129 -143 -158 -173 -188 -202
-126 -140 -153 -167 -180 -194 -207 -221 -234 -248
-141 -156 -171 -185 -200 -215 -230 -245 -259 -274
-191 -204 -218 -231 -245 -258 -272 -285 -299 -312
-213 -227 -242 -257 -272 -287 -301 -316 -331 -346
Historical Sample: 1-Month Yield and Spread Changes, Overlapping, January 4, 1999 - May 31, 2012
Historical Frequency Legend:
-100 0 100 200 300 400
Δ S
pre
ad
in
BP
s
-300
-200
-100
0
100
200
300
NAV
Change
Δ Interest Rate in BPs
-500 -400 -300 -200
400
did not occur in historical sample < 0.1% of historical sample < 1% of historical sample
< 5% of historical sample > 5% of historical sample
14
STATE STREET ASSOCIATES
STATE STREET SECURITIES FINANCE
APPENDIX
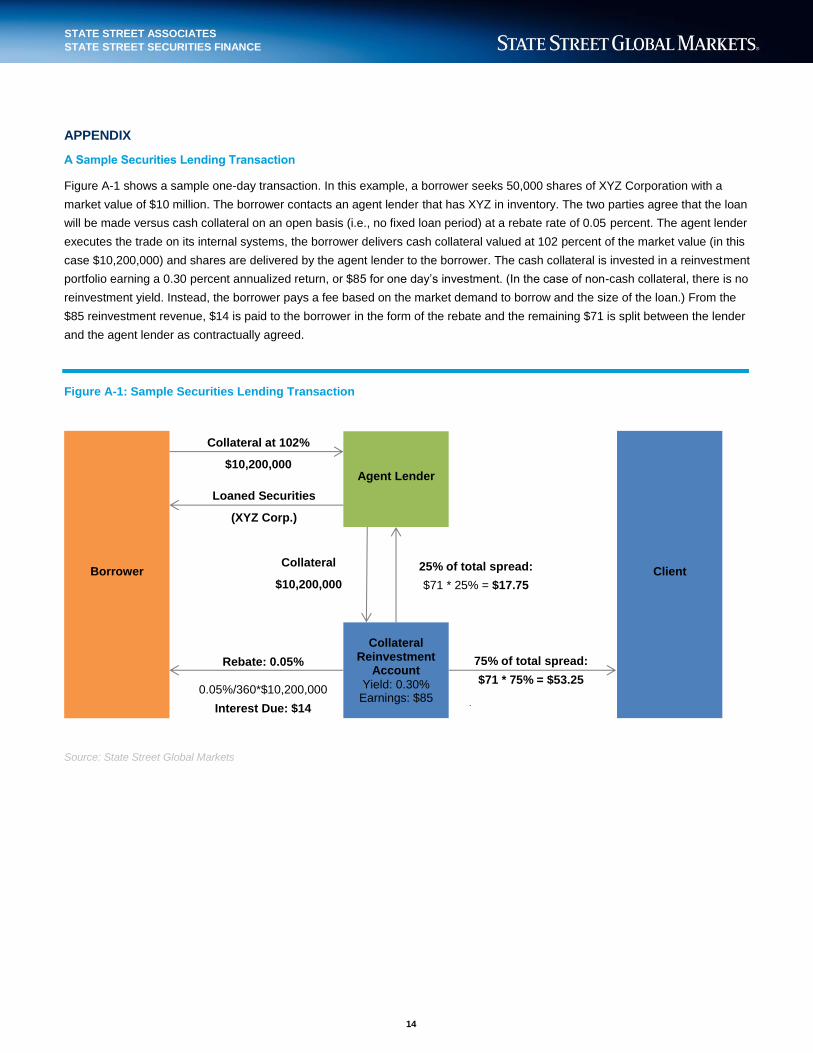
A Sample Securities Lending Transaction
Figure A-1 shows a sample one-day transaction. In this example, a borrower seeks 50,000 shares of XYZ Corporation with a
market value of $10 million. The borrower contacts an agent lender that has XYZ in inventory. The two parties agree that the loan
will be made versus cash collateral on an open basis (i.e., no fixed loan period) at a rebate rate of 0.05 percent. The agent lender
executes the trade on its internal systems, the borrower delivers cash collateral valued at 102 percent of the market value (in this
case $10,200,000) and shares are delivered by the agent lender to the borrower. The cash collateral is invested in a reinvestment
portfolio earning a 0.30 percent annualized return, or $85 for one day’s investment. (In the case of non-cash collateral, there is no
reinvestment yield. Instead, the borrower pays a fee based on the market demand to borrow and the size of the loan.) From the
$85 reinvestment revenue, $14 is paid to the borrower in the form of the rebate and the remaining $71 is split between the lender
and the agent lender as contractually agreed.
Figure A-1: Sample Securities Lending Transaction
Source: State Street Global Markets
Borrower Client
Agent Lender
Collateral Reinvestment
Account
Yield: 0.30% Earnings: $85
Collateral at 102%
$10,200,000
Loaned Securities
(XYZ Corp.)
Rebate: 0.05%
0.05%/360*$10,200,000
Interest Due: $14
75% of total spread:
$71 * 75% = $53.25
:
25% of total spread:
$71 * 25% = $17.75
Collateral
$10,200,000
15
STATE STREET ASSOCIATES
STATE STREET SECURITIES FINANCE
Sample Reinvestment Portfolios: Asset Allocation and Maturity Distribution
Figure A-2: Asset Allocation
Source: State Street Global Markets
Figure A-3: Maturity Distribution
Source: State Street Global Markets
Figure A-4: Historical LIBOR and ABS Rates
Source: State Street Global Markets; Bloomberg
Treasury Repo Money Market Fund Enhanced Cash Separate Account
Asset-Backed Structures
Corporate Obligations
Bank Obligations
Repo
Treasury Repo Money Market Fund Enhanced Cash Separate Account
> 252 Days
≤ 252 Days
≤ 90 Days
≤ 30 Days
1 Day
-250
0
250
500
750
Jan-99 Jan-00 Jan-01 Jan-02 Jan-03 Jan-04 Jan-05 Jan-06 Jan-07 Jan-08 Jan-09 Jan-10 Jan-11 Jan-12
Inte
res
t R
ate
(B
Ps
) LIBOR ABS Spread

16
STATE STREET ASSOCIATES
STATE STREET SECURITIES FINANCE
Figure A-5: Yield Curve Mapping
We assign a benchmark interest rate to each security in the collateral portfolio. For each security, we select the yield curve based
on Figure A-5 below and then interpolate between the changes in yield for the two nearest maturities, used here as a proxy for
duration.
Figure A-6: Linear Approximation of Price Changes
The change in the price of an asset in response to an interest rate shock (ΔIR) is approximated by
ΔNAVasset =-(Interest Rate Duration)*ΔIR
The change in price of an asset in response to a credit spread shock (ΔSpread) is approximated by
ΔNAVasset =-(Spread Duration)*ΔSpread
ΔNAVasset =-(Interest Rate Duration)asset *ΔIRasset -(Spread Duration)asset*ΔSpreadasset
Fixed Rate Securities Floating Rate Securities
Repo Overnight: Fed Funds, else LIBOR Floating Rate Swap Spread
Gov't Obligations
US Agency US Agency Curve Floating Rate Swap Spread
Bank Obligations
Bank Note
Time Deposit
Euro CD
Yankee CD
Corporate Obligations
Corporate
Commercial Paper, Interest Bearing
Asset-Backed Structures
Asset-Backed Securities LIBOR + ABS Spread
Asset-Backed Commercial Paper ACPA, ACPB Commercial Paper CurvesAAA ABS Floating Rate Swap Spread
LIBOR
DCDA, DCDB Curves
DCPA, DCPB Commercial Paper Curves Floating Rate Swap Spread
Index Interest Rate: LIBOR or
FEDSOPEN
Floating Rate Swap Spread

17
STATE STREET ASSOCIATES
STATE STREET SECURITIES FINANCE
State Street Global Markets is the investment research and trading
arm of State Street Corporation (NYSE: STT), one of the world’s
leading providers of financial services to institutional investors. www.statestreetglobalmarkets.com
NOTES AND DEFINITIONS
State Street Global Markets is the marketing name and a registered trademark of State Street Corporation used for its financial markets businesses. State Street Associates is a research
partnership between State Street Global Markets and academia and under which this communication is produced. State Street Associates is a registered trademark of State Street Corporation.
State Street Global Markets is a registered trademark of State Street Corporation used for its financial markets businesses. The products and services outlined in this document are offered
through either State Street Global Markets International Limited, State Street Bank Europe Limited or State Street Bank and Trust Company, London Branch, all of which are authorized and
regulated by the Financial Services Authority, and/or State Street Bank GmbH, London Branch, which is authorized and regulated by the Deutsche Bundesbank and the German Financial
Supervisory Authority (BaFin) and subject to limited regulation by the Financial Services Authority, details of which are available from us on request. Please note, certain foreign exchange
business (spot and certain forward transactions) are not regulated by the Financial Services Authority. This communication is not intended for and must not be provided to retail investors. This
communication is being distributed in the United States by State Street Bank and Trust Company.
Investing involves risk including the risk of loss of principal. Asset Allocation may be used in an effort to manage risk and enhance returns. It does not, however, guarantee a profit or protect
against loss. Diversification does not ensure a profit or guarantee against loss. Any performance figures contained herein are provided on a gross of fees basis only, but net of administrative
costs. The performance figures do not reflect the deduction of advisory or other fees which could reduce the return. Past performance is not a guarantee of future results. Clients should be
aware of the risk of trading foreign exchange.
Generally, among asset classes, stocks are more volatile than bonds or short-term instruments. Government bonds and corporate bonds have more moderate short-term price fluctuations than
stocks, but provide lower potential long-term returns. U.S. Treasury Bills maintain a stable value if held to maturity, but returns are generally only slightly above the inflation rate. Although bonds
generally present less short-term risk and volatility risk than stocks, bonds contain interest rate risks; the risk of issuer default; issuer credit risk; liquidity risk; and inflation risk.
The information provided does not constitute investment advice and is not a solicitation to buy or sell securities. It does not take into account any investor's particular investment objectives,
strategies or tax status. All material has been obtained from sources believed to be reliable but we make no representation or warranty as to its accuracy and you should not place any reliance
on this information. We, our affiliated companies and our and their directors and employees make no representation that the information and opinions contained in this communication comply
with local accounting standards or are accurate, complete or up to date and hereby exclude all warranties, conditions and other terms, whether express or implied, in relation to such information
and opinions and accept no liability, whether arising in contract, tort (including negligence) or for breach of statutory duty, misrepresentation or otherwise, for any losses, liabilities, damages,
expenses or costs arising from or connected with this communication and the information and opinions expressed herein, provided, however that nothing herein shall limit or exclude liability for
fraud or for any other liability to the extent that the same cannot be limited or excluded by applicable law. We also do not undertake, and are under no obligation, to update or keep current the
information or opinions contained in this communication to account for future events.
You may only use and copy this communication for internal purposes and may not forward, amend or distribute the communication outside your immediate organization without our prior written
consent. These terms are subject to any agreement between us governing the provision of the communication. This communication is not intended for distribution to, and may not be relied upon
by, any person or entity in any jurisdiction or country where such distribution or use would be contrary to applicable law or regulation.
Japan. This communication is disseminated in Japan by State Street Global Markets Japan Limited, which is regulated by the Financial Services Agency of Japan as a financial instruments firm.
Hong Kong. This communication is made available in Hong Kong by State Street Bank and Trust Company, which accepts responsibility for its contents, and is intended for distribution to
professional investors only (as defined in the Securities and Futures Ordinance). Australia. This communication is being distributed in Australia by State Street Bank and Trust Company ABN 70
062 819 630, AFSL 239679 and is intended only for wholesale clients, as defined in the Corporations Act 2001. Singapore. This communication is being disseminated by State Street Bank and
Trust Company, Singapore Branch (“SSBTS”), which holds a wholesale bank license by the Monetary Authority of Singapore. In Singapore, this communication is only distributed to accredited,
institutional investors as defined in the Singapore Financial Advisers Act (“FAA”). Note that SSBTS is exempt from Sections 27 and 36 of the FAA. When this communication is distributed to
overseas investors as defined in the FAA, note that SSBTS is exempt from Sections 26, 27, 29 and 36 of the FAA.
Please contact your sales representative for further information.