state review framework alabama - us epa · adem is commended for their web-based efile system which...
TRANSCRIPT

STATE REVIEW FRAMEWORK
Alabama
Clean Water Act, Clean Air Act, and
Resource Conservation and Recovery Act
Implementation in Federal Fiscal Year 2012
U.S. Environmental Protection Agency
Region 4, Atlanta
Final Report March 31, 2014

SRF Executive Summary
Introduction
State Review Framework (SRF) oversight reviews of the Alabama Department of Environmental
Management were conducted in April and May 2013 by EPA Region 4 permitting and
enforcement staff.
The Clean Water Act National Pollutant Discharge Elimination System (CWA-NPDES) program
was reviewed under both SRF and Permit Quality Review (PQR) protocols. The Clean Air Act
(CAA) Stationary Source and Resource Conservation and Recovery Act (RCRA) Subtitle C
programs were reviewed only under SRF.
SRF findings are based on file metrics derived from file reviews, data metrics, and conversations
with program staff. PQR findings, which are not a part of this report and will be finalized at a
later date, are based on reviews of permits, fact sheets, and interviews.
Priority Issues to Address
The following are the top priority issues affecting the state’s program performance based on the
findings in the year of review:
ADEM is commended for their web-based eFile system which greatly facilitated EPA’s
review of files for the SRF. The eFile system, which was instituted by ADEM in 2009
and contains over 1.1 million electronic documents, allows permittees, the public and
stakeholders access to documents stored in ADEM’s document management system.
This system is an effective and user-friendly interface for the retrieval of documents such
as public notices, permits, discharge monitoring reports, and enforcement-related
documents. Using eFile, EPA was able to conduct portions of the SRF file reviews
remotely which contributed to the efficiency and timeliness of developing this SRF
report.
ADEM needs to improve the accuracy of data in the national databases of record,
including ICIS-NPDES and RCRAInfo.
ADEM needs to implement procedures for penalty calculations to ensure appropriate
documentation of gravity and economic benefit and the rationale for differences between
initial and final penalties for CAA and RCRA.
Major SRF CWA-NPDES Program Findings
ADEM needs to implement revised procedures that ensure the accurate reporting of
enforcement and compliance data in ICIS-NPDES. EPA will monitor progress through
electronic file reviews and existing oversight calls and when sufficient improvement is
observed the recommendation will be considered satisfied.

ADEM needs to take steps to ensure that enforcement actions return facilities to
compliance. EPA will monitor progress through existing oversight calls and other
reviews and when sufficient improvement is observed the recommendation will be
considered satisfied.
ADEM needs to implement procedures that ensure that Significant Non-compliance
(SNC) is addressed timely and appropriately. This is a recurring issue from the Round 2
SRF. EPA will monitor progress through existing oversight calls and electronic file
reviews and when sufficient improvement is observed the recommendation will be
considered satisfied.
Major SRF CAA Stationary Source Program Findings
ADEM needs to implement procedures to ensure that the documentation of penalty
calculations show the consideration of gravity and economic benefit and the rationale for
differences between initial and final penalties. This is a recurring issue from SRF Rounds
1 and 2. When EPA observes appropriate documentation, this recommendation will be
considered satisfied.
Major SRF RCRA Subtitle C Program Findings
ADEM needs to develop and implement procedures to ensure the timely and accurate
entry of data into RCRAInfo. EPA will monitor progress using ADEM’s eFile system
and RCRAInfo and once sufficient improvement is observed the recommendation will be
considered complete.
ADEM needs to implement procedures to ensure that the documentation of penalty
calculations show the consideration of gravity and economic benefit and the rationale for
differences between initial and final penalties. This is a recurring issue from SRF Rounds
1 and 2. When EPA observes appropriate documentation, this recommendation will be
considered satisfied.
Major Follow-Up Actions
Recommendations and actions identified from the SRF review will be tracked in the SRF
Tracker.

Table of Contents
State Review Framework ............................................................................................................. 5
I. Background on the State Review Framework ..............................................................................................5
II. SRF Review Process ...................................................................................................................................6
III. SRF Findings..............................................................................................................................................7
Clean Water Act Findings ..................................................................................................................... 8
Clean Air Act Findings ....................................................................................................................... 26
Resource Conservation and Recovery Act Findings ........................................................................... 41

Final Report | Alabama | Page 5
State Review Framework
I. Background on the State Review Framework
The State Review Framework (SRF) is designed to ensure that EPA conducts nationally
consistent oversight. It reviews the following local, state, and EPA compliance and enforcement
programs:
Clean Air Act Stationary Source
Clean Water Act National Pollutant Discharge Elimination System
Resource Conservation and Recovery Act Subtitle C
Reviews cover these program areas:
Data — completeness, timeliness, and quality
Compliance monitoring — inspection coverage, inspection quality, identification of
violations, meeting commitments
Enforcement actions — appropriateness and timeliness, returning facilities to compliance
Penalties — calculation, assessment, and collection
Reviews are conducted in three phases:
Analyzing information from the national data systems
Reviewing a limited set of state files
Development of findings and recommendations
Consultation is also built into the process. This ensures that EPA and the state understand the
causes of issues and seek agreement on actions needed to address them.
SRF reports are designed to capture the information and agreements developed during the review
process in order to facilitate program improvements. EPA also uses the information in the reports
to develop a better understanding of enforcement and compliance nationwide, and to identify any
issues that require a national response.
Reports provide factual information. They do not include determinations of overall program
adequacy, nor are they used to compare or rank state programs.
Each state’s programs are reviewed once every four years. The first round of SRF reviews began
in FY 2004. The third round of reviews began in FY 2012 and will continue through FY 2017.

Final Report | Alabama | Page 6
II. SRF Review Process Review period: FY 2012
Key dates:
Kickoff letter sent to state: March 22, 2013
Kickoff meeting conducted: April 29, 2013
Data metric analysis and file selection list sent to state:
RCRA - March 29, 2013
CAA - April 5, 2013
CWA - April 12, 2013
On-site file review conducted:
RCRA - April 29 – May 2, 2013
CAA – April 29 – May 2, 2013
CWA - May 13 – May 17, 2013
Draft report sent to state: November 18, 2013
Revised draft report sent to state: March 14, 2014
Report finalized: March 31, 2014
Communication with the state: Every year, in the fall management from EPA Region 4 Office
of Environmental Accountability meet with State Enforcement staff to provide information on
enforcement priorities for the year ahead and to discuss enforcement and compliance issues of
interest to the state and EPA. The meeting with ADEM staff occurred on October 24, 2012 and
the schedule for conducting an integrated SRF-PQR review of AL using FY 2012 data was
discussed. A follow up letter was sent on March 22, 2013 outlining the process.
Appendix F contains copies of correspondence between EPA and ADEM.
State and EPA regional lead contacts for review:
AL Department of
Environmental Management
EPA Region 4
SRF Coordinator
Marilyn Elliott Becky Hendrix, SRF Coordinator
Kelly Sisario, OEA Branch Chief
CAA Christy Monk
Mark Fite, OEA Technical Authority
Steve Rieck, Air and EPCRA
Enforcement Branch
CWA Glenda Dean
Richard Hulcher
Ron Mikulak, OEA Technical Authority
Laurie Jones, Clean Water Enforcement
Branch
RCRA Phil Davis
Clethes Stallworth
Shannon Maher, OEA Technical
Authority
Paula Whiting, RCRA Alabama State
Coordinator

Final Report | Alabama | Page 7
III. SRF Findings
Findings represent EPA’s conclusions regarding state performance, and may be based on:
Initial findings made during the data and/or file reviews
Annual data metric reviews conducted since the state’s Round 2 SRF review
Follow-up conversations with state agency personnel
Additional information collected to determine an issue’s severity and root causes
Review of previous SRF reports, MOAs, and other data sources
There are four types of findings:
Good Practice: Activities, processes, or policies that the SRF metrics show are being
implemented at the level of Meets Expectations, and are innovative and noteworthy, and can
serve as models for other states. The explanation must discuss these innovative and noteworthy
activities in detail. Furthermore, the state should be able to maintain high performance.
Meets Expectations: Describes a situation where either: a) no performance deficiencies are
identified, or b) single or infrequent deficiencies are identified that do not constitute a pattern or
problem. Generally, states are meeting expectations when falling between 91 to 100 percent of a
national goal. The state is expected to maintain high performance.
Area for State Attention: The state has single or infrequent deficiencies that constitute a minor
pattern or problem that does not pose a risk to human health or the environment. Generally,
performance requires state attention when the state falls between 85 to 90 percent of a national
goal. The state should correct these issues without additional EPA oversight. The state is
expected to improve and achieve high performance. EPA may make recommendations to
improve performance but they will not be monitored for completion.
Area for State Improvement: Activities, processes, or policies that SRF data and/or file metrics
show as major problems requiring EPA oversight. These will generally be significant recurrent
issues. However, there may be instances where single or infrequent cases reflect a major
problem, particularly in instances where the total number of facilities under consideration is
small. Generally, performance requires state improvement when the state falls below 85 percent
of a national goal. Recommendations are required to address the root causes of these problems,
and they must have well-defined timelines and milestones for completion. Recommendations
will be monitored in the SRF Tracker.

Final Report | Alabama | Page 8
Clean Water Act Findings
CWA Element 1 — Data Completeness: Completeness of Minimum Data Requirements.
Finding 1-1 Meets Expectations
Description ADEM has ensured that the minimum data requirements (MDRs) were
entered into the Integrated Compliance Information System (ICIS).
Explanation
Element 1 is supported by SRF Data Metrics 1a through 1g and measures
the completeness of data in the national data system. EPA provided the
FY2012 data metric analysis (DMA) to ADEM in April 2013. While
several data communication/coordination issues have been noted between
ADEM and EPA, no data completeness issues were identified for Element
1. Element 1 includes 15 data verification metrics which the State has the
opportunity to verify annually. For the sake of brevity, these metrics are
not listed here, but can be found in Appendix A.
Relevant metrics Data Metrics 1a – 1g
State response
Since EPA did not, ADEM would like to point out that EPA’s finding for
element was Area for State Improvement in the last SRF review. ADEM
believes that the SRF report should note areas where performance has
improved.
Recommendation

Final Report | Alabama | Page 9
CWA Element 2 — Data Accuracy: Accuracy of Minimum Data Requirements.
Finding 2-1 Area for State Improvement
Description The accuracy of data between files reviewed and data reflected in ICIS
needs improvement.
Explanation File Review Metric 2b measures files reviewed where data are accurately
reflected in the national data system. Of the 36 files reviewed, 50% of the
files documented information being reported accurately into ICIS.
Common discrepancies or inconsistencies between the OTIS Detailed
Facility Reports (DFRs) and the State’s files were related to a facility’s
name or address, inspection type, dates, or enforcement action taken.
While 8 of the 36 files were inaccurate solely due to facility name and/or
address discrepancies, these data discrepancies while taken as a whole,
could result in inaccurate information being released to the public, and
potentially hinder EPA’s oversight efforts. Data accuracy was an Area for
State Attention identified during the Round 2 SRF review. Steps taken by
the State in response to the Round 2 finding have not fully addressed the
issue, so data accuracy remains as an issue and is now identified as an Area
for State Improvement.
Relevant metrics 2b: Files reviewed where data are accurately reflected in the national data
system: 18/36 = 50%
National Goal 95%
State response EPA found discrepancies in facility names/addresses in 12 of 36 files, and
this was clearly the most common problem found. For 9 of the 12
instances, it was the only valid problem found for this metric. First, it has
been ADEM’s experience that applicants/permittees are often inconsistent
in how facility names and addresses are provided on documents provided
to the Department. Second, only the Facility Site Name is transferred from
ICIS to OTIS/ECHO. The Permittee Name is not transferred. This may
account for many of the discrepancies when comparing the OTIS Detailed
Facility Reports to a facility’s name in the State’s files. Last, ADEM
believes that many of the discrepancies with names/addresses predated the
commencement of ADEM beginning its flow directly to ICIS.
Since EPA did not provide a list citing the specific discrepancies with
regard to names and addresses and did not provide copies of its detailed
facility reports (DFR), we are unable to discern whether the differences
were significant enough to have resulted in EPA or a member of the public
failing to properly identify the facility. ADEM does not believe that EPA
should include inconsequential discrepancies in its assessment of ADEM’s
performance.

Final Report | Alabama | Page 10
In the interest of transparency and to aid ADEM in its investigation of
issues EPA may raise during the SRF file review, ADEM requests that
EPA provide a copy of the DFR for each facility during the file review
process. In addition, we request that EPA’s comments be more detailed in
the “Facility-specific comments” section whenever EPA is noting a
discrepancy.
For two facilities, EPA’s comment regarding the availability of the CEI
report was inaccurate. The reports were available in eFile, the system
available to EPA and the public. EPA personnel had difficulty finding the
documents initially because of the search criteria they used.
For one facility, EPA’s comment that “the inspection type was not
indicated on the IR” is not appropriate under Metric 2b. This comment
should only appear under Metric 6a.
The remaining data discrepancies were random errors that do not depict a
systemic problem in ADEM’s procedures or performance. However,
ADEM is researching the errors and correcting them as necessary. Should
ADEM’s investigation indicate that procedural improvements or additional
staff training is needed, it will undertake those efforts.
In the previous EPA SRF review, EPA identified this metric as an Area for
State Attention. In that review, EPA did not note any discrepancies in
names or addresses. It is unclear whether none were found or whether
EPA chose not to mention them. Since half of the files only had
name/address discrepancies and the other discrepancies found were not
indicative of a systemic problem in ADEM’s procedures or performance,
ADEM believes that EPA’s finding of Area for State Improvement be
downgraded to Area of State Attention.
RE: EPA’s Recommendation, to research the many of the discrepancies
EPA found, ADEM will need the DFRs with EPA’s notes in order to
ensure that we understand the exact discrepancy.
Recommendation It is recommended that ADEM take appropriate steps to research the data
discrepancies and correct them as necessary. Should ADEM’s
investigation indicate that procedural improvements or additional staff
training are needed, the State should undertake those efforts to ensure that
information and data reported are accurate EPA Region 4 will assess
progress in ADEM’s performance through periodic on-site and/or
electronic file reviews. If by September 30, 2014, these periodic reviews
indicate that sufficient improvement in data accuracy is observed, this
recommendation will be considered complete.

Final Report | Alabama | Page 11
CWA Element 3 — Timeliness of Data Entry: Timely entry of Minimum Data
Requirements.
Finding 3-1 Unable to evaluate and make a finding
Description Element 3 is designed to measure the timeliness of mandatory data entered
into the national data system. Sufficient information to verify the
timeliness of data entry, however, does not currently exist.
Explanation The Office of Enforcement and Compliance Assistance (OECA) is
currently reviewing this Element and the inability to make a finding based
on the current design of ICIS. Modifications of this Element may be
reflected in future SRF reviews.
Relevant metrics
State response
Recommendation

Final Report | Alabama | Page 12
CWA Element 4 — Completion of Commitments: Meeting all enforcement and compliance
commitments made in state/EPA agreements.
Finding 4-1 Meets Expectations
Description ADEM met their inspection and non-inspection compliance/enforcement
(C/E) commitments outlined in their FY12 Compliance Monitoring
Strategy (CMS) Plan and FY 2012 CWA §106 Workplan.
Explanation Element 4 measures planned inspections completed (Metric 4a) and other
planned C/E activities completed (Metric 4b). The National Goal for this
Element is for 100% of commitments to be met. Under Metric 4a, the State
met or exceeded all FY 12 inspection commitments. Under Metric 4b, the
State met or exceeded its planned C/E activities related to data
management requirements; reporting/enforcement requirements;
pretreatment facilities requirements; and policy, strategy and management
requirements.
Relevant metrics Metric: Universe
4a: Planned Inspections Completed or exceeded
4b: Planned Commitments Completed or exceeded
National Goal 100%
State response Since EPA did not, ADEM would like to point out that EPA’s finding for
this element was Area for State Improvement in the last SRF review.
ADEM believes that the SRF report should note areas where performance
has improved.
Recommendation

Final Report | Alabama | Page 13
CWA Element 5 — Inspection Coverage: Completion of planned inspections.
Finding 5-1 Meets Expectations
Description Inspection goals for major and non-major traditional dischargers were
exceeded in FY 2012.
Explanation Element 5 addresses inspections reflected in the negotiated FY 12 CWA
§106 Workplan. ADEM negotiated an inspection coverage goal of 97
major facilities (50% of the permit universe of 193), 297 non-majors with
individual permits (20% of the permit universe of 1,485), and 155 non-
majors with general permits (5% of the permit universe of 3,108).
Relevant metrics Metric: Universe Completed/Committed
5a1: Inspection coverage of NPDES majors…..………..186/97 (192%)
5b1: Inspection coverage of NPDES non-majors
with individual permits….…………………………….…390/297 (131%)
5b2: Inspection coverage of NPDES non-majors
with general permits….…….……………………………283/155 (183%)
National Goal 100% of CMS Plan commitments
State response
Recommendation

Final Report | Alabama | Page 14
CWA Element 6 — Quality of Inspection Reports: Proper and accurate documentation of
observations and timely report completion.
Finding 6-1 Area for State Improvement
Description ADEM’s inspection reports, while providing “sufficient” documentation to
determine compliance, did not consistently provide “complete” information
and were not consistently completed in a timely manner.
Explanation Metric 6a addresses inspection reports reviewed that provide sufficient
documentation to determine compliance at the facility. Of the 34 files for
which inspection reports were reviewed, all were found to have
“sufficient” information to support a compliance determination and Metric
6a was found to Meet Expectations. However, only 11 files (32%) were
also determined to contain “complete” information as outlined in EPA’s
NPDES Compliance Inspection Manual. Construction storm water and
mining inspection reports appeared to be more complete than other sectors
of the program. Many of the 23 reports that were found to lack complete
information did not make a clear connection between observations noted in
the inspection checklist/report and the relevant regulatory or permit
requirements, did not describe the NPDES-regulated activity or facility
operations, or did not describe nor document field observations beyond the
Inspection Report’s Checklist. Without this type of information, it is
difficult for a reviewer to clearly determine compliance, compliance status,
or ascertain whether the findings are deficiencies needing correction or a
recommendation for improved performance. Additionally, many of the
inspection reports were missing other important or critical information that
hindered EPA’s review of compliance determinations made. EPA,
therefore, recommends that ADEM consider revising the State’s Inspection
Report preparation process to be more consistent with the procedures and
techniques outlined in EPA’s NPDES Compliance Inspection Manual to
ensure that the State’s Inspection Reports are more complete and that they
clearly describe the field observations and findings from an inspection.
Metric 6b addresses inspection reports completed within prescribed
timeframes, not timeframes for data entry. For this analysis, EPA’s
NPDES Enforcement Management System (EMS) was used as a guide for
reviewing the State’s timeliness for the completion of non-sampling
inspection reports (within 30 days) and sampling inspection reports (within
45 days). Thirty-four of the files reviewed contained inspection reports
that were evaluated under this metric. Twenty-six of the thirty-four or 77%
of the files were completed within the prescribed timeframes. The average
number of days from inspection to report completion was found to be 19
days; with the reports that were not timely ranging from 34 days to 92
days. Additionally, 2 inspection reports were not dated and were,

Final Report | Alabama | Page 15
therefore, not considered to be timely for this analysis. The degree to which
the State’s inspection reports were timely was an issue that was raised
during the Round 2 SRF review and was identified as an Area for State
Improvement. At the time of the Round 3 File Review, steps taken by the
State in response to the Round 2 recommendation for Metric 6b did not
fully address this issue, however, the State has shown progress in the
timely completion of Inspection Reports by recently revising its EMS and
establishing goals for the completion of Inspection Reports. A “spot-
check” of recently completed Inspection Reports, however, indicates that
52% of the State’s Inspection Reports met the “initial” timeliness goals of
the recent EMS (i.e., 2 weeks for a non-sampling inspection and 45 days
for a sampling inspection), but that no reports exceeded the EMS’s 90 day
“secondary” timeliness goal. The State is to be recognized for the progress
it has made in establishing timeliness goals in its EMS, however, because
improvement in the State’s performance in the timely completion of
Inspection Reports is still needed, this area will remain as an “Area for
State Improvement.”
Relevant metrics 6a: Inspection reports reviewed that provide “sufficient” documentation to
determine compliance at the facility: 34/34 = 100%.
(However, only 11/34 or 32% of the inspection reports contained
“complete” information).
National Goal: 100%
6b: Inspection reports completed within prescribed timeframes:
26/34 = 77%
National Goal 100%
State response Metric 6a: First, EPA made it clear that the content of the inspection
reports was sufficient to determine compliance at the facility. An
inspection is a fact finding activity, and ADEM’s inspection reports are
only meant to reflect the information gathered during an inspection. The
reports are not intended to be an in-depth overview of the facility or a final
compliance determination. ADEM documents its final compliance
determinations via correspondence sent to the facility be it a letter
documenting the results or an actual enforcement action. When
compliance issues are found, each enforcement action makes it clear for
which specific permit condition or regulation the permittee was not in
compliance.
EPA is comparing the content of ADEM’s inspection reports to the content
prescribed in EPA’s NPDES Compliance Inspection Manual. Based on
ADEM’s organizational structure, we do not find it necessary to include all
of the information EPA’s policy/guidance suggests should be included in
an inspection report. ADEM believes it is a waste of resources to

Final Report | Alabama | Page 16
reproduce facility/permit information that is already readily available to
our staff, EPA, and the public through our eFile system. Our
staff/management has ready access to all of the information necessary to
make a determination without duplicating it in the inspection report.
ADEM would like to point out that EPA is unable to meet the timeliness
guidelines in following NPDES Compliance Inspection Manual for the
content of its inspection reports. ADEM has observed that it often takes
EPA 6 months to a year to finalize its inspection reports. ADEM believes
that its resources are best spent conducting inspections in the field and
producing inspection reports that gather the key data necessary to make a
compliance determination rather than producing a lengthy document that
includes information already available elsewhere.
Metric 6b: In FY2012, for inspections conducted by Water Division
staff, ADEM’s practice was to complete a compliance determination
before finalizing the inspection report. This sometimes resulted in
reports not being finalized within EPA’s prescribed timeframes. During
FY2013, the Water Division changed its standard practice to finalize the
inspection report prior to conducting a compliance determination since
the report is only a statement of findings/observations. As appropriate,
the cover letter transmitting the report to the facility indicates that the
compliance determination has not been completed.
ADEM has also updated its internal CMS/EMS (Rev. 4/17/2013) to state
that it is ADEM’s goal to finalize inspection reports within 2 weeks of
the inspection, if no sampling analyses are required, or within 45 days of
obtaining sampling analyses, but in no case more than 90 days after the
inspection date. ADEM personnel are expected to adhere to these
timeframes as strictly as possible. No timeframes were specified in our
previous CMS/EMS.
Recommendation In light of the recent progress the State has made in establishing timeliness
goals in its EMS for the completion of Inspection Reports, EPA Region 4
will assess progress in ADEM’s performance through periodic electronic
file reviews. If by September 30, 2014, these periodic reviews indicate that
sufficient improvement in the timeliness of Inspection Report completion
is observed, this recommendation will be considered complete.

Final Report | Alabama | Page 17
CWA Element 7 — Identification of Alleged Violations: Compliance determinations
accurately made and promptly reported in national database based on inspection reports
and other compliance monitoring information.
Finding 7-1 Area for State Attention
Description The inspection reports reviewed included accurate compliance
determinations, however, the State needs to focus attention on entering
SEVs and closing out longstanding compliance schedule violations.
Explanation SEVs are one-time or long-term violations discovered by the permitting
authority typically during inspections and not through automated reviews of
Discharge Monitoring Reports. Data metrics 7a1 tracks SEVs for active
majors and 7a2 tracks SEVs for non-majors reported in ICIS. Both data
metrics indicated that ADEM entered one SEV for each metric for FY 2012.
To determine the extent to which the State is discovering/reporting SEVs, 22
files were reviewed. This review showed that the State is identifying but not
entering SEVs into the national database since no SEVs were entered for the
files reviewed. The State has, however, indicated that since December 2012,
they have been flowing SEV information into ICIS. EPA has verified this
practice and will continue to monitor the State’s progress through regular
oversight reviews. Data metric 7b1 reports facilities with compliance
schedule violations. ADEM’s data shows facilities with 85 violations of
compliance schedule milestones in FY 2012. The file review confirmed this
and noted that three facilities had longstanding compliance schedule violations
from 2004, 2006, and 2007. It is recommended that the State analyze these
compliance schedule violations and take the necessary steps to resolve/close
these cases. File Metric 7e addresses Inspection Reports reviewed that led
to an accurate compliance determination. Of the 34 files containing
Inspection Reports, 31 (91%) contained accurate compliance
determinations. The three files without an accurate compliance
determination were noted because there was no enforcement
response/compliance determination follow-up by the State subsequent to
the issues identified by the inspection.
Relevant metrics 7a1: # of majors with SEVs: 1
7a2: # of non-majors with SEVs: 1
7b1: Compliance schedule violations: 85
7e: Inspection reports reviewed that led to an accurate compliance
determination: 31/34 = 91%
National Goal 100%
State response ADEM is working to clean up data that erroneously indicates compliance
schedule violations. A majority of these predated ADEM’s direct flow of
enforcement data to ICIS. As resources allow, ADEM continues to work

Final Report | Alabama | Page 18
toward flowing SEVs
Recommendation
CWA Element 8 — Identification of SNC and HPV: Accurate identification of significant
noncompliance and high-priority violations, and timely entry into the national database.
Finding 8-1 Meets Expectations
Description ADEM’s identification, reporting and tracking of major facilities in SNC
and single-event violations (SEVs) that were determined as a result of an
inspection meet expectations.
Explanation Data Metric 8a2 addresses the percent of major facilities in SNC. ADEM
identified that 19% of their major facilities are in SNC – the National
Average is 21%. Metric 8b addresses the percentage of SEVs that are
accurately identified as SNC or non-SNC. Of the 22 files reviewed in
which potential SEVs were identified in an inspection report, all were
accurately identified as SNC or non-SNC. Metric 8c addresses the
percentage of SEVs identified as SNC that are reported timely at major
facilities. One SEV at a major facility was reported and entered into ICIS,
however, the SEV was not a SNC, therefore, a finding for this metric is not
applicable. As noted in Element 7, the State started flowing SEV
information into ICIS. This effort should be an important tool in more
effectively reporting and tracking SEVs. ADEM is encouraged to continue
this new practice and EPA will monitor the State’s progress through regular
oversight reviews.
Relevant metrics 8a2: Percent of Major Facilities in SNC: 19%
National Average: 21%
8b: Percentage of Single-Event Violations that are accurately identified as
SNC or non-SNC: 22/22 = 100%
National Goal: 100%
8c: Percentage of SEVs identified as SNC that are reported timely at major
facilities: NA
National Goal: 100%

Final Report | Alabama | Page 19
State response Since EPA did not, ADEM would like to point out that EPA’s finding for
this element was Area for State Improvement in the last SRF review.
ADEM believes that the SRF report should note areas where performance
has improved.
Recommendation

Final Report | Alabama | Page 20
CWA Element 9 — Enforcement Actions Promote Return to Compliance: Enforcement
actions include required corrective action that will return facilities to compliance in
specified timeframe.
Finding 9-1 Area for State Improvement
Description Enforcement actions do not consistently result in violators returning to
compliance within a certain timeframe.
Explanation File Review Metric 9a shows the percentage of enforcement responses that
have returned or will return a non-compliant facility to compliance. From
a review of the files, 57% (16 of 28) of the facilities had documentation in
the files showing that the facility had returned to compliance, or that the
enforcement action required the facility to return to compliance within a
certain timeframe. The rationales for the 12 facilities that did not have
documentation include: continued non-compliance despite the State’s
action; lack of a facility’s response in the file to the State’s enforcement
action; longstanding Compliance Schedule Violations; or the State
implemented its Escalating Enforcement Response Policy as outlined in
their EMS, but the escalation action occurred after the review timeframe
for this SRF.
Relevant metrics 9a: Percentage of enforcement responses that returned or will return a
source in violation to compliance: 16/28 = 57%
National Goal: 100%
State response ADEM is working to clean up data that erroneously indicates compliance
schedule violations. A majority of these predated ADEM’s direct flow of
enforcement data to ICIS. In addition, ADEM would like to note that the
number of major SNC violations has declined, which indicates that
ADEM’s escalated enforcement approach is effective.
Recommendation By September 30, 2014, ADEM should take steps to ensure that
enforcement actions promote a return to compliance. EPA Region 4 will
assess progress in implementation of the improvements through existing
oversight calls and other periodic reviews. If by December 31, 2014, these
periodic reviews indicate that sufficient improvement in promoting a return
to compliance is observed, this recommendation will be considered
complete

Final Report | Alabama | Page 21
CWA Element 10 — Timely and Appropriate Action: Timely and appropriate enforcement
action in accordance with policy relating to specific media.
Finding 10-1 Area for State Improvement
Description SNCs are not being addressed in a timely and appropriate manner.
Explanation Data Metric 10a1 indicates that ADEM completed none (0/10) of the
enforcement actions that address SNC violations for major facilities with
timely action as appropriate. File Metric 10b focuses on the State’s
enforcement responses that address SNC that are appropriate to the
violations. Of the eight major facilities with SNC, the State issued a
formal Administrative Order for two (2/8 or 25%) of the facilities. For six
of the eight facilities, the State’s enforcement response was an informal
action - a Warning Letter or a Notice of Violation (NOV). According to
State and EPA guidance, all SNC violations must be responded to in a
timely and appropriate manner by administering agencies. The responses
should reflect the nature and severity of the violation, and unless there is
supportable justification, the response must be a formal action, or a return
to compliance by the permittee. Furthermore, the State’s January 2011
EMS defines Warning Letters and NOVs as informal responses.
Therefore, while the State did document enforcement responses for
facilities with SNC, six of eight major facilities in SNC were responded to
with an informal enforcement action with no supporting justification
documenting why a formal action was not taken. The State’s informal
enforcement actions are not consistent with the above-referenced EPA
EMS and 1989 guidance. The degree to which the State takes timely
enforcement actions was an issue raised during the Round 2 SRF review.
Steps taken by the State in response to the Round 2 recommendation have
not fully addressed the issue and this Element remains as an Area for State
Improvement.
Relevant metrics 10a1: Major NPDES facilities with timely action, as appropriate:
0/10 = 0%
National Goal: 98%
10b: Enforcement responses reviewed that address SNC that are
appropriate to the violations: 2/8 = 25%
Goal: 100%
State response Metric 10a1: ADEM would like to point out that for FY2013, the current
National Average for this metric is 0%, and for FY2012, the National
Average was 3.6%. Given the disparity between the National Average and
EPA”s National Goal of 98%, EPA should either reevaluate how this

Final Report | Alabama | Page 22
metric is calculated or reconsider the timeliness criteria that is the basis for
this metric.
Metric 10b1: States should retain their authority for enforcement
discretion, and ADEM uses an escalated enforcement approach. As we
clarified in the April 2013 revision to our CMS/EMS submitted to EPA,
ADEM considers Notices of Violation to be formal actions. As mentioned
before, the number of major SNC violations has declined, which indicates
that ADEM’s escalated enforcement approach is effective.
Recommendation By September 30, 2014, ADEM should implement procedures to improve
the timeliness and appropriateness of SNC addressing actions, including
the use of appropriate enforcement responses that: include injunctive
relief, include a compliance schedule, contain consequences for
noncompliance that are independently enforceable, and subject the facility
to adverse legal consequences for noncompliance. The timeliness and
appropriateness of SNC addressing actions will be monitored by the EPA
Region 4 through the existing oversight calls between ADEM and EPA and
other periodic on-site and/or electronic file reviews. If by December 31,
2014, these periodic reviews indicate sufficient improvement in the
preparation of timely and appropriate enforcement responses, this
recommendation will be considered complete.

Final Report | Alabama | Page 23
CWA Element 11 — Penalty Calculation Method: Documentation of gravity and economic
benefit in initial penalty calculations using BEN model or other method to produce results
consistent with national policy and guidance.
Finding 11-1 Area for State Attention
Description EPA observed improvement since the previous SRF reviews in ADEM’s
practice to include and document the rationale for the gravity and
economic benefit (EB) components of penalty calculations, however, the
practice is not applied consistently.
Explanation Element 11 examines the documentation of penalty calculations, including
the calculation of gravity and EB. In Round 2, ADEM did not maintain
any penalty calculations for NPDES enforcement actions. The state now
includes a “Penalty Synopsis” chart in the final NPDES Administrative
Consent Orders that outlines the violations and considered in determining
the penalty amount. The Penalty Synopsis chart also includes “Other
Factors” for adjustments to the penalty, which include Results
Reported/Permit Limit, Pollutant Characteristics, 303(d) Listing Status,
Preventative Action Taken, Significance of Violation, Duration of
Violation, and the Repeat Nature of the Violation. Of the eight files
reviewed in which penalties were assessed one file contained a penalty that
was issued via Court Order, not by ADEM and was, therefore, not included
as part of this review. Of the seven remaining files, 4 files (57%) contained
penalty documentation that included consideration of both gravity and EB,
1 file contained gravity but EB was not included because of the lack of
information on the injunctive relief needed for EB calculations, and 2 files
did not contain documentation for either gravity or EB.
The degree to which the State documents gravity and EB in penalty
calculations was an issue raised during the SRF Rounds 1 and 2 reviews.
In response to the Round 2 recommendation, the State indicated that it
would continue to refine its penalty calculation process. Since the State
has made considerable recent progress, as demonstrated during this SRF
review, in refining and documenting its penalty calculations, this Element
is now considered to be an Area of State Attention. EPA recommends that
ADEM continue its progress in refining, documenting and implementing
its penalty calculation process. EPA will conduct periodic on-site reviews
to ensure that progress continues.

Final Report | Alabama | Page 24
Relevant metrics 11a: Penalty determinations reviewed that document the State’s penalty
process, including gravity and economic benefit components:
4 of 7 enforcement actions analyzed 57%
National Goal: 100%
State response
Recommendation

Final Report | Alabama | Page 25
CWA Element 12 — Final Penalty Assessment and Collection: Differences between initial
and final penalty and collection of final penalty documented in file.
Finding 12-1 Area for State Attention
Description ADEM did not consistently document the rationale for initial and final
assessed penalty differences, but did regularly provide information
documenting the collection of all final penalties.
Explanation Metric 12a provides the percentage of enforcement actions that
documented the difference and rationale between the initial and final
assessed penalty. Of the 7 enforcement actions reviewed, 5 files (71%)
provided documentation between the initial and final assessed penalty. In
the 2 instances where the differences between the initial and final penalties
were not documented, the file either did not contain the initial assessed
penalty or the rationale for the difference between the initial and final
assessed penalty. The lack of documentation in these cases appear to be
related to staff transition and file maintenance and not a systemic issue and
is, therefore, considered an Area of State Attention. It is recommended that
the State analyze these file issues and take the necessary steps to correct the
lack of consistent file documentation. Metric 12b provides the percentage
of enforcement files reviewed that document the collection of a penalty.
Of the 8 cases evaluated, 8 (100%) of the cases documented the collection
of the penalty. One of the cases evaluated in this metric involved the
issuance of a Final Order issued by a Circuit Court and was not, therefore,
evaluated in Metric 12a above.
Relevant metrics 12a: Documentation of the difference between the initial and final penalty
and rationale: 5/7 (71%)
National Goal 100%
12b: Penalties collected: 8/8 (100%)
National Goal 100%
State response
Recommendation

Final Report | Alabama | Page 26
Clean Air Act Findings
CAA Element 1 — Data Completeness: Completeness of Minimum Data Requirements.
Finding 1-1 Meets Expectations
Description ADEM has ensured that minimum data requirements (MDRs) were entered
into the AFS.
Explanation
Element 1 of the SRF is designed to evaluate the extent to which the State
enters MDRs into the national data system. No issues were identified for
Element 1 in the Data Metrics Analysis (DMA).
Relevant metrics
Element 1 includes 33 data verification metrics which the State has the
opportunity to verify annually. For the sake of brevity, these metrics were
not listed here, but can be found in the DMA in Appendix A.
State response
Recommendation

Final Report | Alabama | Page 27
CAA Element 2 — Data Accuracy: Accuracy of Minimum Data Requirements.
Finding 2-1 Area for State Attention
Description There were some inaccuracies in the MDR data reported by ADEM into
AFS. However, these were minor deficiencies which ADEM has corrected
without the need for additional EPA oversight.
Explanation File Review Metric 2b indicates that 25 of the 35 (71.4%) files reviewed
documented all MDRs being reported accurately into AFS. The remaining
10 files had one or more discrepancies identified. The majority of
inaccuracies related to missing or inaccurate subparts for MACT or NSPS
in AFS. Some facilities did not have the appropriate pollutants included in
AFS, and a few files had inaccuracies in city, government ownership,
operating status, etc. Finally, two files had duplicate activities entered in
AFS. As noted in ADEM’s response, the State has made the necessary
corrections to AFS and taken steps to ensure that accurate data is
maintained in the future. Therefore, this Element is designated as an Area
for State Attention.
Relevant metrics State National Goal
2b – Accurate MDR Data in AFS: 25/35 = 71.4% 100%
State response ADEM has made all appropriate corrections to AFS. With the exception of
the lack of pollutant data for several facilities, ADEM believes the
inaccuracies found do not represent a systemic problem but merely
oversights by responsible personnel. Air Division management brought
the missing data issue to the attention of the responsible personnel and
reminded all personnel of the necessity to update the Air Division’s
database with this data. ADEM has corrected its batch upload to include
pollutants for each facility.
Recommendation

Final Report | Alabama | Page 28
CAA Element 3 — Timeliness of Data Entry: Timely entry of Minimum Data
Requirements.
Finding 3-1 Meets Expectations
Description MDRs are being entered timely into AFS.
Explanation The data metrics for Element 3 indicate that ADEM is entering MDRs for
compliance monitoring and enforcement activities into AFS within the
appropriate timeframe. ADEM entered 100% of stack test and enforcement
related MDRs into AFS within 60 days. In addition, most compliance
monitoring MDRs (94.3%) were entered into AFS within 60 days.
Relevant metrics State National Goal
3b1 – Timely Reporting of Compliance
Monitoring MDRs: 870/923 = 94.3% 100%
3b2 – Timely Reporting of Stack Test
MDRs: 863/863 = 100% 100%
3b3 – Timely Reporting of Enforcement
MDRs: 35/35 = 100% 100%
State response
Recommendation

Final Report | Alabama | Page 29
CAA Element 4 — Completion of Commitments: Meeting all enforcement and compliance
commitments made in state/EPA agreements.
Finding 4-1 Meets Expectations
Description ADEM met all enforcement and compliance commitments outlined in their
FY 2012 Compliance Monitoring Strategy (CMS) Plan and their FY 2012
Air Planning Agreement.
Explanation Element 4 evaluates whether the State met its obligations under the CMS
plan and the Air Planning Agreement (APA) with EPA. ADEM follows a
traditional CMS plan, which requires them to conduct a full compliance
evaluation (FCE) every 2 years at Major sources and every 5 years at
Synthetic Minor 80% (SM80) sources. ADEM met these obligations by
completing over 100% of planned FCEs at both Major and SM80 sources.
In addition, ADEM met all of its enforcement and compliance
commitments (100%) under the FY 2012 Air Planning Agreement with
EPA Region 4. Therefore, this element Meets Expectations.
Relevant metrics State National Goal
4a1 – Planned Evaluations Completed:
Title V Major FCEs: 326/314 = 103.8% 100%
4a2 – Planned Evaluations Completed:
SM80 FCEs: 240/214 = 112.1% 100%
4b – Planned Commitments Completed:
CAA compliance and enforcement
commitments other than CMS
commitments: 12/12 = 100% 100%
State response
Recommendation

Final Report | Alabama | Page 30
CAA Element 5 — Inspection Coverage: Completion of planned inspections.
Finding 5-1 Meets Expectations
Description ADEM met the negotiated frequency for compliance evaluations of CMS
sources and reviewed Title V Annual Compliance Certifications.
Explanation Element 5 evaluates whether the negotiated frequency for compliance
evaluations is being met for each CMS source, and whether the State
completes the required review of Title V Annual Compliance
Certifications. ADEM met the national goal for all of the relevant metrics,
so this element Meets Expectations.
Relevant metrics State National Goal
5a – FCE Coverage Major: 310/310 = 100% 100%
5b – FCE Coverage SM-80: 201/201 = 100% 100%
5e – Review of Title V Annual Compliance
Certifications Completed: 306/307 = 99.7% 100%
State response
Recommendation

Final Report | Alabama | Page 31
CAA Element 6 — Quality of Inspection Reports: Proper and accurate documentation of
observations and timely report completion.
Finding 6-1 Meets Expectations
Description ADEM documented all required elements in their Full Compliance
Evaluations (FCEs) and compliance monitoring reports (CMRs) as
required by the Clean Air Act Stationary Source Compliance Monitoring
Strategy (CMS Guidance).
Explanation Metric 6a indicated that ADEM documented all seven required elements of
an FCE for most files reviewed (91.2% or 31 of 34). In addition, Metric 6b
indicated that 32 of the 34 files reviewed with an FCE (94.1%) also
included the seven CMR elements required by the CMS Guidance.
Therefore this Element Meets Expectations.
EPA notes that a number of required CMR elements (i.e. facility
information, applicable requirements, and enforcement history) are not
routinely included in ADEM’s inspection reports (CMRs), but they are
available to EPA and the public through ADEM’s E-file system. This
electronic records management system makes enforcement, compliance,
and permitting documentation maintained by ADEM easily accessible
online.
Relevant metrics 6a – Documentation of FCE elements: 32/34 = 94.1%
National Goal 100%
6b – Compliance Monitoring Reports (CMRs) that provide sufficient
documentation to determine compliance of the facility: 0/34 = 0%
National Goal 100%
State response
Recommendation

Final Report | Alabama | Page 32
CAA Element 7 — Identification of Alleged Violations: Compliance determinations
accurately made and promptly reported in national database based on inspection reports
and other compliance monitoring information.
Finding 7-1 Meets Expectations
Description Compliance determinations are accurately made and promptly reported into
AFS based on inspection reports and other compliance monitoring
information.
Explanation Based on the File Review and DMA, EPA determined that ADEM makes
accurate compliance determinations based on inspections and other
compliance monitoring information.
Relevant metrics State National Goal
7a – Accuracy of Compliance Determinations:
34/34 = 100% 100%
7b1 – Alleged Violations Reported Per
Informal Enforcement Actions: 14/14 = 100% 100%
7b3 – Alleged Violations Reported
Per HPV Identified: 6/6 = 100% 100%
State response
Recommendation

Final Report | Alabama | Page 33
CAA Element 8 — Identification of SNC and HPV: Accurate identification of significant
noncompliance and high-priority violations, and timely entry into the national database.
Finding 8-1 Meets Expectations
Description EPA Region 4 determines which violations are HPVs and enters them into
AFS on the State’s behalf. As a result, HPVs are accurately identified,
although several were not entered into the national system in a timely
manner.
Explanation Element 8 is designed to evaluate the accuracy and timeliness of the
State’s identification of high priority violations. EPA Region 4 and
ADEM have a long-standing arrangement in which EPA determines which
violations are HPVs and enters them into AFS on the State’s behalf. With
respect to the accuracy of HPV identification, all HPV designations
reviewed were accurate. Although four out of six HPVs identified in FY12
were entered late (>60 days) into AFS, three of these late entries were the
responsibility of EPA, and they were only 2, 11, and 15 days late,
respectively. EPA program staff will work to ensure that in the future,
these entries are made into AFS within 60 days. One exception was a case
that was entered 107 days after Day Zero. ADEM advises that they
contacted the facility numerous times to gather key information needed to
develop the Notice of Violation (NOV), but the facility was not
responsive. In situations like this, the HPV policy allows up to 90 days
from the date the agency first receives information to set the Day Zero. It
is recommended that when ADEM experiences delays caused by the
source, that this be communicated to EPA to ensure that the flexibilities
allowed in the HPV policy are maximized. Since this situation does not
constitute a significant pattern of deficiencies, and EPA was responsible
for the majority of the late entries, this is element meets expectation.
Relevant metrics State National Goal
8c – Accuracy of HPV Determinations: 9/9 = 100% 100%
3a1 – Timely Entry of HPV Determinations: 2
3a2 – Untimely Entry of HPV Determinations: 4 0
State response
Recommendation

Final Report | Alabama | Page 34
CAA Element 9 — Enforcement Actions Promote Return to Compliance: Enforcement
actions include required corrective action that will return facilities to compliance in
specified timeframe.
Finding 9-1 Meets Expectations
Description Enforcement actions include required corrective action that will return
facilities to compliance in a specified timeframe.
Explanation All enforcement action files reviewed (14 of 14) returned the source to
compliance. For enforcement actions that were penalty only actions, the
files documented the actions taken by the facility to return to compliance
prior to issuance of the order. ADEM met the national goal for all relevant
metrics, so this element Meets Expectations.
Relevant metrics State National Goal
9c – Formal enforcement returns facilities
to compliance: 14/14 = 100% 100%
State response
Recommendation

Final Report | Alabama | Page 35
CAA Element 10 — Timely and Appropriate Action: Timely and appropriate enforcement
action in accordance with policy relating to specific media.
Finding 10-1 Meets Expectations
Description HPVs are being addressed in a timely and appropriate manner.
Explanation Element 10 is designed to evaluate the extent to which the State takes
timely and appropriate action to address HPVs. All HPVs reviewed had an
appropriate enforcement response that will return the source to compliance.
With respect to timeliness, seven out of eight (87.5%) of the HPVs
reviewed were addressed within 270 days. The remaining action was
resolved in 278 days, which is not a significant concern. Therefore this
element Meets Expectations.
Relevant metrics State National Goal
10a – Timely action taken to address HPVs: 7/8 = 87.5% 100%
10b – Appropriate Enforcement Responses
for HPVs: 8/8 = 100% 100%
State response
Recommendation

Final Report | Alabama | Page 36
CAA Element 11 — Penalty Calculation Method: Documentation of gravity and economic
benefit in initial penalty calculations using BEN model or other method to produce results
consistent with national policy and guidance.
Finding 11-1 Area for State Improvement
Description ADEM did not adequately consider and document economic benefit using
the BEN model or other method which produces results consistent with
national policy and guidance.
Explanation Element 11 examines the state documentation of penalty calculations, as
provided in the 1993 EPA “Oversight of State and Local Penalty
Assessments: Revisions to the Policy Framework for State/EPA
Enforcement Agreements.” In order to preserve deterrence, it is EPA
policy not to settle for less than the amount of the economic benefit of
noncompliance plus a gravity portion of the penalty. Specifically, file
review metric 11a evaluates whether the state penalty calculations
adequately document both gravity and economic benefit considerations.
Metric 11a indicated that ADEM did not adequately consider and
document economic benefit in the 14 penalty calculations reviewed.
EPA notes that ADEM has made significant improvements since the
Round 2 SRF by including a narrative discussion of penalty factors
considered and a “Penalty Synopsis” chart in each final Consent Order.
However, two key issues remain a concern for EPA: First, the rationale for
not calculating or assessing economic benefit in a specific case is not
provided in sufficient detail in the Consent Order. Instead more general
statements are used such as “the Department is not aware of any significant
economic benefit from these violations.” This was the case for 9 of 14
penalties evaluated.
The second concern is that when ADEM determines that an economic
benefit was likely gained, no calculations using the BEN model or another
method are maintained in the file. This happened in 5 of the 14 penalties
evaluated. As an example, one order (which addressed two facilities)
included a statement that the Department believed that economic benefit
was derived, but the “Penalty Synopsis” did not reflect any economic
benefit, and the file did not include any supporting information that EPA
could evaluate to determine if the amount was appropriate to the
violation(s) and consistent with national policy.
This issue was identified as an Area for State Improvement in the SRF
Round 1 and 2 reports. Therefore, this finding will continue to be an Area
for State Improvement in Round 3.

Final Report | Alabama | Page 37
Relevant metrics State National
Goal
11a – Penalty calculations reviewed that consider
and include gravity and economic benefit: 0/14 = 0% 100%
State response ADEM disagrees with EPA’s finding. Each order contains a paragraph
indicating whether ADEM determined that the facility realized an
economic benefit as a result of the violation(s). For instances where a
significant economic benefit is realized, the amount of the penalty
attributed to economic benefit is listed in the Penalty Synopsis.
ADEM’s current process includes review of the available economic impact
data and the results are entered on the Penalty Synopsis Worksheet. In
cases where there is no significant benefit derived from the violation, the
worksheet reflects zero and corresponding language is placed in the order.
ADEM will modify the language in the order to reflect that the economic
benefit was analyzed and determined to be insignificant.
Recommendation By June 30, 2014, ADEM should implement procedures to ensure
appropriate consideration and documentation of economic benefit in their
initial and final penalties. For verification purposes, ADEM should
submit the following documents to EPA Region 4 for review for one year
following issuance of the final SRF report:
(1) all proposed administrative orders and penalty calculations from the
initiation of enforcement order negotiations (versus the proposed consent
orders that are placed on public notice at the end of negotiations); and,
(2) all final consent orders and penalty calculations.
If, by the end of one year appropriate penalty documentation is being
observed, this recommendation will be considered completed.

Final Report | Alabama | Page 38
CAA Element 12 — Final Penalty Assessment and Collection: Differences between initial
and final penalty and collection of final penalty documented in file.
Finding 12-1 Area for State Improvement
Description The collection of final penalty payments is documented in the files.
However, the rationale for any differences between the initial and final
penalty is not consistently documented.
Explanation Part of the goal of the SRF is to ensure equable treatment of violators
through national policy and guidance, including systematic methods of
penalty calculations. Without the availability of state penalty calculations,
EPA is unable to assess the quality of the state’s overall enforcement
program.
Metric 12a provides the percentage of formal enforcement actions that
documented the difference and rationale between the initial and final
assessed penalty. A total of 14 enforcement actions were reviewed where
the state issued a proposed Consent Order and then negotiated a final
Consent Order with the facility. In the files, there were no copies of the
proposed Consent Orders sent to the respondent from the initiation of
enforcement negotiations (versus the proposed consent orders that are
placed on public notice at the end of negotiations). In addition no initial
penalty calculations were made available for review for any of the 14
cases. Only the final Consent Orders were maintained in the files. .
EPA’s “Oversight of State and Local Penalty Assessments: Revisions to
the Policy Framework for State/EPA Enforcement Agreements” outlines
the expectation that states maintain this documentation and “make case
records available to EPA upon request and during an EPA audit of State
performance.” EPA notes that the ADEM Water program preserves their
initial penalty calculations from the proposed Administrative Orders,
although the RCRA and Air programs do not follow this same practice of
record retention.
In five of their orders, ADEM documented an adjustment to the final
penalty and the rationale, including “ability to pay”, “other factors”, or
“mitigating factors.” For the remaining nine orders, initial penalty
calculations were not provided, so reviewers could not ascertain whether
an adjustment was made. Clearly articulating the rationale for penalty
adjustments is essential in maintaining consistency and providing
transparency This is a continuing problem from the SRF Round 1 and 2
Reports, and therefore remains as an Area for State Improvement for
Round 3.
Metric 12b provides the percentage of enforcement files reviewed that
document the collection of a penalty. All of the 14 files reviewed provided
evidence that ADEM had collected penalties, or were in the process of

Final Report | Alabama | Page 39
seeking collection of penalties from enforcement actions. Therefore this
metric Meets Expectations.
Relevant metrics State National Goal
12a – Documentation on difference between
initial and final penalty and rationale: 5/14 = 35.7% 100%
12b – Penalties collected: 14/14 = 100% 100%
State response EPA’s reference to the practices of ADEM’s Water program is not
appropriate for this Element given the significant differences in the types
of violations identified by the two programs. The most common Air
violations involve one time violation of the regulations. This is unlike the
CWA program where the most common violations involve multiple self-
reported excursion from a permitted discharge limit . These vastly
different violation profiles do not lend themselves to the same penalty
assessment methodology and should not be compared.
As a result of previous SRF reviews, the Department has revised its penalty
documentation. These revisions were implemented during the period of
concern for this SRF review. The Penalty Summary sheet is our
documentation of the initial and final penalty and the adjustments made
between the initial penalty and final penalty. There are no changes made to
the amounts under "Seriousness of Violation", "Standard of Care",
"History of Previous Violations", or "Economic Benefit" unless the facility
provides evidence that our initial assessment in these areas was inaccurate,
thereby making any such changes "corrections" not "adjustments".
Adjustments made due to negotiations are reflected in the sections for
"Mitigation Factors", "Ability to Pay", or "Other Factors". For the
majority of Orders, "Other Factors" is the adjustment made and typically
reflects a facility's good faith for negotiating. When no amounts are
recorded in "Mitigation Factors", "Ability to Pay", or "Other Factors", it
means that no adjustments to the initial penalty were made.
Of the 26 orders issued in FY12 (the SRF review year), 13 were not
reduced by negotiation and were issued with the initial proposed penalty.
Therefore the Penalty Synopsis Worksheet reflected no reduced amount in
the “Other Factors”. Ten of the proposed penalties were reduced by
negotiations and the amounts reduced were reflected in “Other Factors” on
the Penalty Synopsis Worksheet. Three of the orders were issued prior to
the change in procedure made as a result of the Round 2 SRF (explained
above). In FY13, there were 14 orders issued with 8 penalties not being
reduced during negotiation and 6 negotiated reductions with the amount of
the penalty reductions reflected on the synopsis worksheet. Again
ADEM’s process is truly transparent and efficient.
The Penalty Synopsis Worksheet was designed to reflect the initial and
final penalty on one sheet so that it could be made available to the public

Final Report | Alabama | Page 40
during the 30 day comment period. Based on this explanation, the Penalty
Synopsis identifies the initial and final penalty and demonstrates that this
Element (12) should be classified as “Meets Expectations”.
Recommendation By June 30, 2014, ADEM should implement procedures to ensure
appropriate documentation of the rationale for any difference between the
initial and final penalty. For verification purposes, ADEM should submit
the following documents to EPA Region 4 for review for one year
following issuance of the final SRF report:
(1) all proposed administrative orders and penalty calculations from the
initiation of enforcement order negotiations (versus the proposed consent
orders that are placed on public notice at the end of negotiations); and,
(2) all final consent orders and penalty calculations.
If, by the end of one year appropriate penalty documentation is being
observed, this recommendation will be considered completed.

Final Report | Alabama | Page 41
Resource Conservation and Recovery Act Findings
RCRA Element 1 — Data Completeness: Completeness of Minimum Data Requirements.
Finding 1-1 Meets Expectations
Description ADEM’s Minimum Data Requirements for compliance monitoring and
enforcement activities were complete in RCRAInfo.
Explanation
RCRA Element 1 is supported by SRF Data Metrics 1a through 1g, and
measures the completeness of the data in RCRAInfo, which is the National
Database for the RCRA Program. EPA provided the FY2012 RCRA data
metric analysis (DMA) to ADEM on March 29, 2013. No issues were
identified for Element 1 in the DMA, so this element Meets Expectations.
A complete list of the Data Metrics can be found in Appendix A.
Relevant metrics
State response No response necessary
Recommendation

Final Report | Alabama | Page 42
RCRA Element 2 — Data Accuracy: Accuracy of Minimum Data Requirements.
Finding 2-1 Area for State Improvement
Description During the SRF evaluation, 77% of files were identified with data
inaccuracies.
Explanation The RCRA Enforcement Response Policy (ERP) says that a secondary
violator (SV) should be resolved within 240 days or elevated to a
significant non-complier (SNC) status. Data metric 2a indicated that there
were three SV facilities that had violations open for longer than 240 days:
- Two cases were being pursued through formal enforcement actions
by ADEM, but were not designated as SNCs in RCRAInfo until
after this was brought to the state’s attention in the RCRA SRF file
review. Both facilities were subsequently designated as SNCs in
RCRAInfo.
- The third facility had open violations that had not been returned to
compliance, even though the facility was a SNC and had been
resolved through formal enforcement. Once the violations are
closed out this facility will no longer show up in Metric 2a.
File Review Metric 2b verifies that data in the file is accurately reflected in
RCRAInfo. A file is considered inaccurate if the information about the
facility regulatory status, the inspection reports, enforcement actions, or
compliance documentation is missing or reported inaccurately in
RCRAInfo. Metric 2b indicated only 8 of 35 files (22.9%) reviewed had
accurate data input into RCRAInfo. A large number of inaccuracies were
due to inconsistent internal ADEM procedures for entering the dates of
enforcement actions. There were also inaccuracies related to
incorrect/missing violation citations and facility compliance status. This is
a continuing issue from the SRF Round 2 evaluation, where data accuracy
was identified as an Area for State Attention. For this review, data
accuracy is considered an Area for State Improvement.
Relevant metrics State
2a – Longstanding Secondary Violators 3
2b – Accurate Entry of Mandatory Data 22.9% (8/35)
State response The timeliness of formal enforcement actions can be complicated by many
factors including penalty negotiations. Such was the case in two of the
instances EPA identified in Metric 2a of its review. In the 3rd
case, the
violator ceased operations and closed its facility very soon after the SNC
violations were identified. ADEM saw no efficacy in pursuing formal
enforcement in this situation and are working to update our files and

Final Report | Alabama | Page 43
RCRAInfo inputs accordingly.
Regarding metric 2b, following EPA’s identification of this issue as part of
the SRF Review, ADEM changed its procedures regarding the entry of
enforcement action dates into RCRAInfo to avoid this issue in the future.
Recommendation By March 31, 2014, ADEM should develop and implement procedures for
timely and accurate entry of data into RCRAInfo. At the end of 2014, after
allowing the state to implement the procedures, EPA will conduct a remote
file review using ADEM’s eFile system and RCRAInfo to assess progress
in implementation of the improvements. If by December 31, 2014,
sufficient improvement is observed this recommendation will be
considered complete.

Final Report | Alabama | Page 44
RCRA Element 3 — Timeliness of Data Entry: Timely entry of Minimum Data
Requirements.
Finding 3-1 Unable to make a finding
Description Sufficient evidence to establish a finding for this Element does not
currently exist.
Explanation Element 3 measures the timely entry of data into RCRAInfo. The RCRA
ERP requires all violation data to be entered by Day 150 from the first day
of inspection, and other types of data entered by timelines established in
state policies, MOAs, PPA/PPGs, etc. In reviewing files, there is no
method of determining when data was entered into RCRAInfo, only if the
data was accurate (covered under Element 2). RCRAInfo does not have a
date stamp to show when data is entered, therefore a determination of
timely data entry could not be made.
Relevant metrics
State response No response necessary
Recommendation

Final Report | Alabama | Page 45
RCRA Element 4 — Completion of Commitments: Meeting all enforcement and
compliance commitments made in state/EPA agreements.
Finding 4-1 Meets Expectations
Description ADEM met the FY2012 Grant projections for non-inspection activities.
Explanation Metric 4a measures the percentage of non-inspection commitments
completed in the fiscal year of the SRF review. In their FY2012 grant work
plan, ADEM included projections (versus commitments) for show-cause
meetings, and informal and formal enforcement actions. Since these types
of activities are not completely within the control of ADEM, they are
considered grant workplan projections for resource planning versus
workplan commitments (like inspections). ADEM’s FY2012 End-of-Year
report documented that the state fulfilled the majority of these projections.
Relevant metrics 4a - Planned non-inspection commitments completed 100%
State response No response necessary
Recommendation

Final Report | Alabama | Page 46
RCRA Element 5 — Inspection Coverage: Completion of planned inspections.
Finding 5-1 Meets Expectations
Description ADEM met the inspection coverage for operating TSDs and LQGs.
Explanation Element 5 measures three types of required inspection coverage that are
outlined in the EPA RCRA Compliance Monitoring Strategy: (1) 100%
coverage of operating Treatment Storage Disposal (TSD) facilities over a
two-year period, (2) 20% coverage of LQGs every year, and (3) 100%
coverage of LQGs every five years. In FY2012, ADEM met or exceeded
all inspections in these areas.
Relevant metrics Data Metric State National Goal
5a – Two-year inspection coverage 100% 100%
for operating TSDFs (11/11)
5b – Annual inspection coverage 48.9% 20%
for LQGs (111/227)
5c – Five-year inspection coverage 100% 100%
For LQGs (227/227)
State response No response necessary
Recommendation

Final Report | Alabama | Page 47
RCRA Element 6 — Quality of Inspection Reports: Proper and accurate documentation of
observations and timely report completion.
Finding 6-1 Meets Expectations
Description ADEM’s inspection reports provided sufficient documentation to
determine compliance at the facility, and were completed in a timely
manner.
Explanation File Review Metric 6a assesses the completeness of inspection reports and
whether the reports provide sufficient documentation to determine
compliance at the facility. Of the inspection reports reviewed, 93.5% (29 of
31) were complete and had sufficient documentation to determine
compliance at the facility. The content and narrative of the reports varied
widely across inspection staff, but in general the reports provided sufficient
information for compliance determinations. File Review Metric 6b
measures the timely completion of inspection reports. According to the
RCRA ERP, violation determination should be made within 150 days of
the first day of inspection. ADEM considers issue date of the informal
enforcement action as the date of violation determination. In the file
review, it was found that 94.1% of the reports were completed in by Day
150. The two criteria for inspection report quality meets SRF expectations.
Relevant metrics File Metric State National Goal
6a – Percentage of inspection reports that are
complete and provide documentation
to determine compliance (29/31) 93.5% 100%
6b – Percentage of inspection reports
that are completed timely (32/34) 94.1% 100%
State response No response necessary
Recommendation
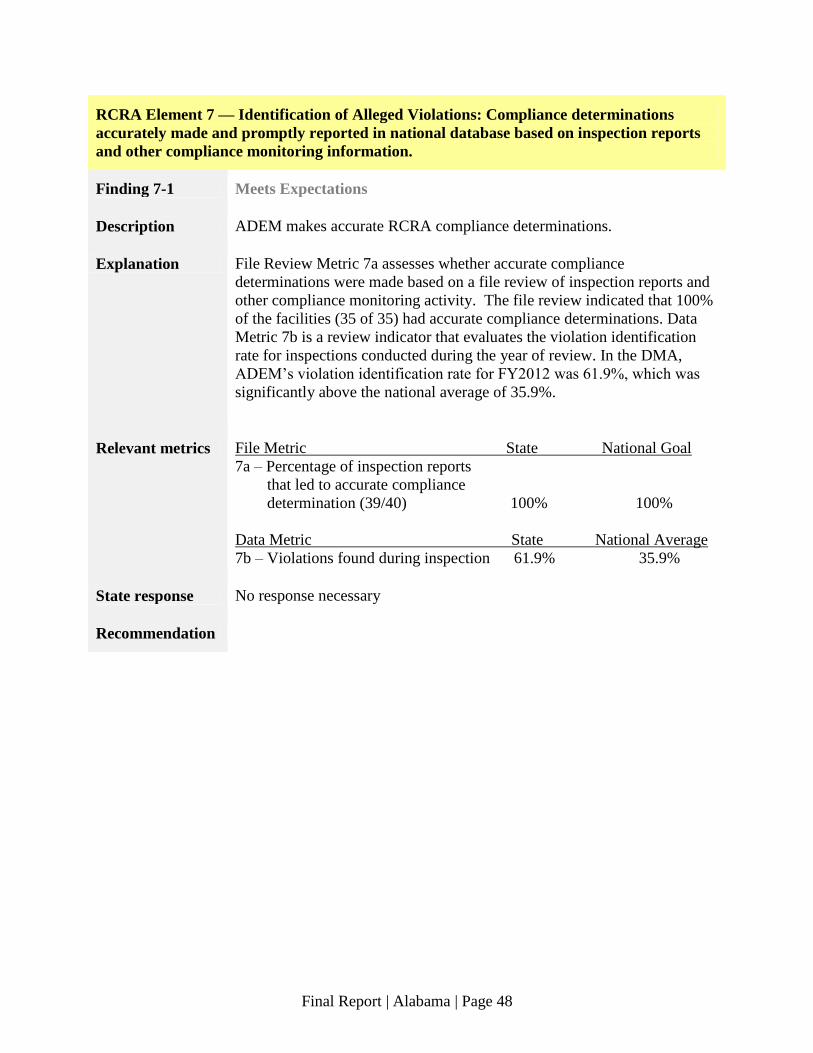
Final Report | Alabama | Page 48
RCRA Element 7 — Identification of Alleged Violations: Compliance determinations
accurately made and promptly reported in national database based on inspection reports
and other compliance monitoring information.
Finding 7-1 Meets Expectations
Description ADEM makes accurate RCRA compliance determinations.
Explanation File Review Metric 7a assesses whether accurate compliance
determinations were made based on a file review of inspection reports and
other compliance monitoring activity. The file review indicated that 100%
of the facilities (35 of 35) had accurate compliance determinations. Data
Metric 7b is a review indicator that evaluates the violation identification
rate for inspections conducted during the year of review. In the DMA,
ADEM’s violation identification rate for FY2012 was 61.9%, which was
significantly above the national average of 35.9%.
Relevant metrics File Metric State National Goal
7a – Percentage of inspection reports
that led to accurate compliance
determination (39/40) 100% 100%
Data Metric State National Average
7b – Violations found during inspection 61.9% 35.9%
State response No response necessary
Recommendation

Final Report | Alabama | Page 49
RCRA Element 8 — Identification of SNC and HPV: Accurate identification of significant
noncompliance and high-priority violations, and timely entry into the national database.
Finding 8-1 Area for State Attention
Description In the majority of cases, ADEM makes timely and accurate SNC
determinations.
Explanation Data Metric 8a identifies the percent of facilities that received a SNC
designation in FY2012, the year of data reviewed for ADEM’s SRF
evaluation. ADEM’s SNC identification rate was 4.8% which was above
the national average of 1.7%. Data Metric 8b measures the number of
SNC determinations that were made within 150 days of the first day of
inspection. Timely SNC designation is important so that significant
problems are addressed in a timely manner. In FY2012, ADEM reported
85.7% (18 of 21) of their SNC designations by Day 150.
In the 1998 RCRA Memorandum of Agreement between ADEM and EPA
Region 4, the state has agreed to take timely and appropriate enforcement
action as defined in the 1996 RCRA ERP. The ERP provides the national
definition of SNC facilities, and includes the criteria for taking timely and
appropriate enforcement at these violating facilities. File Review Metric
8c measures the percentage of violations in the files that were accurately
determined to be a SNC. Of the files reviewed, there were three facilities
that were SNC-caliber, but were designated as Secondary Violators by the
state and the violations were addressed through informal enforcement
rather than appropriate formal enforcement actions. Thus, the percentage of
files reviewed where the violation was accurately determined to be a SNC
was 88% (22 of 25 SNC facilities). The accurate identification of SNC
facilities and the timely entry of SNC designations into RCRAInfo are
considered an Area for State Attention. The data entry procedures for SNC
designations should be reviewed for possible efficiencies for timely data
entry. ADEM should also refer to the criteria outlined in the RCRA ERP
for accurate identification of SNC-caliber facilities. It is the expectation
that by following these steps, the accurate identification of SNCs and
timely entry of SNC designations will improve without further oversight
by EPA.
Relevant metrics State National Average
8a – SNC identification rate 4.8% 1.7%
State National Goal
8b – Percentage of SNC determinations
entered into RCRAInfo by Day 150 (18/21) 85.7% 100%
8c – Percentage of violations in files

Final Report | Alabama | Page 50
reviewed that were accurately
determined to be SNCs (22/25) 88% 100%
State response EPA identified three facilities with violations that it indicated should have
been determined SNC’s rather that Secondary Violations. ADEM does not
agree with this assessment. In the three cases EPA identified, ADEM
determined that the violations cited during the compliance evaluation
inspections posed low potential threat of exposure to hazardous waste or
hazardous waste constituents and decided no actual or imminent
endangerment to human health or the environment. The facilities did not
have known or documented histories of recalcitrant or non-compliant
behavior with respect to the management of hazardous wastes and the
nature of violations (i.e., failure to comply with certain administrative
requirements of the Hazardous Waste Program regulations rather than
failure to act or be in accordance with the substantive requirements of State
law or regulations) was such that the sites could be expected to (and in fact
did) return to compliance with the applicable rules.
The RCRA ERP provides generalized guidelines for determining which
violations of RCRA constitute significant non-compliance. However, the
ERP does not definitively or specifically categorize RCRA violations as
instances of SNC or as Secondary Violations. This makes a SNC
determination largely a judgment call.
ADEM acknowledges EPA’s role in evaluating State enforcement
programs and its use of the ERP to guide its oversight efforts. But since a
SNC determination is a judgment call of the enforcement authority, ADEM
does not believe it would be inappropriate for EPA to substitute its
judgment for the Department’s.
Recommendation

Final Report | Alabama | Page 51
RCRA Element 9 — Enforcement Actions Promote Return to Compliance: Enforcement
actions include required corrective action that will return facilities to compliance in
specified timeframe.
Finding 9-1 Meets Expectations
Description ADEM consistently issues enforcement responses that have returned or
will return a facility in SNC or SV to compliance.
Explanation File Review Metric 9a shows the percentage of SNC enforcement
responses reviewed that have documentation that the facility has returned
or will return to compliance. The file review showed 100% (18 of 18) of
the SNC facilities had documentation in the files showing that the facility
had returned to compliance, or that the enforcement action required the
facility to return to compliance within a certain timeframe. At the time of
drafting this report, there are an additional four SNC facilities that are in
the process of negotiating consent orders that were not counted in this
metric. File Review Metric 9b gives the percentage of SV enforcement
responses reviewed that have documentation that the facility has returned
or will return to compliance. The file review showed 100% of the SVs (12
of 12) had documentation showing that the facility had returned to
compliance, or that the enforcement action required them to return to
compliance within a certain timeframe.
Relevant metrics File Metric State National Goal
9a - Percentage of enforcement responses
that have or will return site in SNC
to compliance (18/18) 100% 100%
9b - Percentage of enforcement responses
that have or will return a SV
to compliance (12/12) 100% 100%
State response No response necessary
Recommendation

Final Report | Alabama | Page 52
RCRA Element 10 — Timely and Appropriate Action: Timely and appropriate
enforcement action in accordance with policy relating to specific media.
Finding 10-1 Meets Expectations
Description ADEM takes timely and appropriate enforcement actions.
Explanation Data Metric 10a indicated that ADEM completed 100% (10 out of 10) of
the formal enforcement actions at SNC facilities within 360 days of the
first day of inspection, the timeline outlined in the RCRA ERP. ADEM
exceeded the national goal of 80% of enforcement actions meeting this
timeline. This is a significant improvement from the SRF Rounds 1 and 2
evaluations. File Review Metric 10b assesses the appropriateness of
enforcement actions for SVs and SNCs, as defined by the RCRA ERP. In
the files reviewed, 91.4% of the facilities with violations (32 of 35) had the
appropriate enforcement response to addressing the identified violations.
There were three SNC-caliber facilities that were addressed through
informal actions rather than formal actions as required by the RCRA ERP.
Relevant metrics State National Goal
Data Metric 10a:
Timely enforcement to address SNCs (10/10) 100% 80%
File Metric 10b:
Percentage of files with appropriate
enforcement responses (32/35) 91.4% 100%
State response No response necessary
Recommendation

Final Report | Alabama | Page 53
RCRA Element 11 — Penalty Calculation Method: Documentation of gravity and
economic benefit in initial penalty calculations using BEN model or other method to
produce results consistent with national policy and guidance.
Finding 11-1 Area for State Improvement
Description ADEM has implemented procedures to better document gravity and
economic benefit in penalty calculations, but there is room for
improvement on documenting penalty rationale.
Explanation Element 11a examines the state documentation of penalty calculations as
provided in the 1993 EPA “Oversight of State and Local Penalty
Assessments: Revisions to the Policy Framework for State/EPA
Enforcement Agreements.” In order to preserve deterrence, it is EPA
policy not to settle for less than the amount of the economic benefit of
noncompliance and a gravity portion of the penalty. File review metric 11a
determines if the state penalty includes both gravity and economic benefit
considerations. In the SRF Round 2 evaluation, ADEM did not maintain
any penalty calculations for RCRA enforcement actions. Since that time,
the state has made significant improvement by including a “Civil Penalty
Synopsis” chart in the final RCRA Administrative Consent Orders.
However, two key issues remain a concern for EPA: First, the rational for
not calculating or assessing economic benefit in each case is not
consistently provided in sufficient detail. Second, when ADEM determines
that an economic benefit was likely gained, no supporting calculations
using the BEN model or another method are maintained in the file
A total of 18 penalty calculations were reviewed, and all included the
equivalent of a gravity component in the penalty calculation. However
only three penalties included the appropriate consideration of economic
benefit in the narrative of the orders. The remaining 15 orders included
either:
(1) A statement to the effect that there was no evidence indicating
avoided or delayed economic benefit, or
(2) A dollar amount for economic benefit in the “Civil Penalty
Synopsis” without any supporting information to determine if the
amount was appropriate to the violation(s) and consistent with
national policy.
This is not sufficient information to determine the appropriateness of the
ADEM penalties. This issue was identified as an Area for State
Improvement in both Round 1 and Round 2 SRF reports, and now again in
SRF Round 3. This finding will continue to be an Area for State
Improvement in Round 3, as 16.7% of the enforcement cases reviewed had
the complete penalty documentation for both gravity and economic benefit

Final Report | Alabama | Page 54
of noncompliance.
Relevant metrics State National Goal
11a – Penalty calculations consider and
include a gravity and economic
benefit (3 of 18) 16.7% 100%
State response ADEM disagrees with EPA’s finding. Each order contains a paragraph
indicating whether ADEM determined that the facility realized an
economic benefit as a result of the violation(s). For instances where a
significant economic benefit is realized, the amount of the penalty
attributed to economic benefit is listed in the Penalty Synopsis. ADEM’s
current process includes review of the available economic impact data and
the results are entered on the Penalty Synopsis Worksheet. In cases where
there is no significant benefit derived from the violation, the worksheet
reflects zero and corresponding language is placed in the order. ADEM
will modify the language in the order to reflect that the economic benefit
was analyzed and determined to be insignificant.
Recommendation By June 30, 2014, ADEM should implement procedures to ensure
appropriate documentation of both gravity and economic benefit in penalty
calculations, appropriately using the BEN model or another method that
produces results consistent with national policy to calculate economic
benefit. For verification purposes, for one year following issuance of the
final SRF report, EPA shall review all initial and final ADEM orders and
penalty calculations, including the calculations for the economic benefit of
noncompliance. ADEM should submit to EPA:
(1) all proposed administrative orders and penalty calculations from the
initiation of enforcement order negotiations (versus the proposed consent
orders that are placed on public notice at the end of negotiations); and,
(2) all final consent orders and penalty calculations. If by the end of one
year it is determined that appropriate penalty calculation documentation is
being implemented, this recommendation will be considered complete

Final Report | Alabama | Page 55
RCRA Element 12 — Final Penalty Assessment and Collection: Differences between initial
and final penalty and collection of final penalty documented in file.
Finding 12-1 Area for State Improvement
Description ADEM enforcement actions did not provide the adjustment rationale
between the initial and final assessed penalty. There was documentation of
the majority of final penalty collections.
Explanation Part of the goal of the SRF is to ensure equable treatment of violators
through national policy and guidance, including systematic methods of
penalty calculations. Without the availability of state penalty calculations
(including economic benefit calculations), EPA is unable to assess the
quality of the state’s overall enforcement program.
Metric 12a provides the percentage of formal enforcement actions that
documented the difference and rationale between the initial and final
assessed penalty. A total of 13 enforcement actions were reviewed where
the state issued a proposed Administrative Order and then negotiated a
final Consent Order with the facility.
In the files, there were no copies of the proposed Administrative Orders
from the initiation of enforcement negotiations (versus the proposed
consent orders that are placed on public notice at the end of negotiations),
and no initial penalty calculations available for review for any of the 13
cases. EPA was informed that the proposed RCRA Administrative Orders
are destroyed, and only the final Consent Orders were maintained in the
files. EPA’s “Oversight of State and Local Penalty Assessments:
Revisions to the Policy Framework for State/EPA Enforcement
Agreements” outlines the expectation that states maintain this
documentation and “make case records available to EPA upon request and
during an EPA audit of State performance.” EPA notes that the ADEM
Water program preserves their initial penalty calculations from the
proposed Administrative Orders, although the RCRA and Air programs do
not follow this same practice of record retention.
Rationale for penalty adjustments are essential in maintaining consistency
and providing transparency; noting offsets for supplemental environmental
projects or inability to pay issues; and ensuring that the final penalties
recover any economic benefit due to noncompliance. This is a continuing
problem from Round 1 and 2 SRF reports, and will continue as an Area for
State Improvement in Round 3. Metric 12b provides the percentage of
enforcement files reviewed that document the collection of a penalty. In
93.3% of the files reviewed (15 of 16), there was evidence that ADEM had
collected penalties, or were in the process of seeking collection of penalties
from enforcement actions.

Final Report | Alabama | Page 56
Relevant metrics State National Goal
12a – Formal enforcement actions that
document the difference and rationale
between the initial & final penalty (0 of 13) 0 % 100%
12b – Final formal actions that documented
the collection of a final penalty (15 of 16) 93.8% 100%
State response EPA’s reference to the practices of ADEM’s Water program is not
appropriate for this Element given the significant differences in the types
of violations identified by the two programs. The most common RCRA
violations involve the discreet failure to perform specific preventative
actions required by the regulations. This is unlike the CWA program
where the most common violations involve the self-reported excursion
from a permitted discharge limit. These vastly different violation profiles
do not lend themselves to the same penalty assessment methodology and
should not be compared. As a result of previous SRF reviews, the
Department has revised its penalty documentation. These revisions were
implemented during the period of concern for this SRF review. The
Penalty Summary sheet is our documentation of the initial and final penalty
and the adjustments made between the initial penalty and final penalty.
There are no changes made to the amounts under "Seriousness of
Violation", "Standard of Care", "History of Previous Violations", or
"Economic Benefit" unless the facility provides evidence that our initial
assessment in these areas was inaccurate, thereby making any such changes
"corrections" not "adjustments". Adjustments made due to negotiations are
reflected in the sections for "Mitigation Factors", "Ability to Pay", or
"Other Factors". For the majority of Orders, "Other Factors" is the
adjustment made and typically reflects a facility's good faith for
negotiating. When no amounts are recorded in "Mitigation Factors",
"Ability to Pay", or "Other Factors", it means that no adjustments to the
initial penalty were made. All ten RCRA orders issued during the SRF
review year used this outlined process. Two order were issued with no
adjustment from the initial to the final penalty (the Penalty Synopsis
Worksheet showed no adjustment). The remaining eight orders had
adjustments made to the initial penalty. All were documented on the
Penalty Synopsis Worksheet. This methodology is transparent in that it
identifies the final penalty and all the compromises from the initial penalty.
This documentation allows all citizen the ability to review not only the
final penalty but the compromises between the initial and final penalty.
Since the order (including the Penalty Synopsis Worksheet) is subject to a
30 day comment prior to actual issuance of the order, ADEM process
provides complete transparency. Based on this explanation, the Penalty
Synopsis identifies the initial and final penalty and demonstrates that this
Element (12) should be classified as “Meets Expectations”.

Final Report | Alabama | Page 57
Recommendation By June 30, 2014 ADEM should implement procedures to ensure
appropriate documentation of the rationale for any difference between the
initial and final penalty. For verification purposes, for one year following
issuance of the final SRF report, EPA shall review all initial and final
ADEM orders and penalty calculations, including the calculations for the
economic benefit of noncompliance. ADEM should submit to EPA:
(1) all proposed administrative orders and penalty calculations from the
initiation of enforcement order negotiations (versus the proposed consent
orders that are placed on public notice at the end of negotiations); and,
(2) all final consent orders and penalty calculations. If by the end of one
year it is determined that appropriate penalty calculation documentation is
being implemented, this recommendation will be considered completed.

Final Report | Alabama | Page 58

1
Appendix A: Data Metric Analysis
Attached below are the results of the SRF data metric analyses. All data metrics are analyzed prior to the on-site file review. This provides reviewers with
essential advance knowledge of potential problems. It also guides the file selection process as these potential problems highlight areas for supplemental
file review.
The initial findings are preliminary observations. They are used as a basis for further investigation during the file review and through dialogue with the
state. Where applicable, this analysis evaluates state performance against the national goal and average. Final findings are developed only after evaluating
the data alongside file review results and details from conversations with the state. Through this process, initial findings may be confirmed or modified.
Final findings are presented in Section III of this report.
Clean Water Act
Metric
ID Metric Name Metric Type Agency National
Goal National
Average Alabama Count Universe Not
Counted Initial
Finding Explanation
1a1 Number of
Active NPDES
Majors with
Individual
Permits
Data
Verification State 190 Meets
Expectations
1a2 Number of
Active NPDES
Majors with
General
Permits
Data
Verification State 0 Meets
Expectations
1a3 Number of
Active NPDES
Non-Majors
with Individual
Permits
Data
Verification State 1,401 State
Attention A count
discrepancy
exists
among the
106
workplan,
CMS and
the verified
data.

2
1a4 Number of
Active NPDES
Non-Majors
with General
Permits
Data
Verification State 15,366 State
Attention A count
discrepancy
exists
between the
CMS and
the verified
data. 1b1 Permit Limits
Rate for Major
Facilities
Goal State >= 95% 98.3% 100% 190 190 0 Meets
Expectations
1b2 DMR Entry
Rate for Major
Facilities.
Goal State >= 95% 97.9% 99.8% 6836 6849 13 Meets
Expectations
1b3 Number of
Major
Facilities with
a Manual
Override of
RNC/SNC to a
Compliant
Status
Data
Verification State 19 Meets
Expectations
1c1 Permit Limits
Rate for Non-
Major
Facilities
Informational
only State 67.2% 74.2% 1040 1401 361 Meets
Expectations
1c2 DMR Entry
Rate for Non-
Major
Facilities.
Informational
only State 83.1% 90.7% 10629 11718 1089 Meets
Expectations
1e1 Facilities with
Informal
Actions
Data
Verification State 2,099 Meets
Expectations
1e2 Total Number
of Informal
Actions at
CWA NPDES
Facilities
Data
Verification State 2,204 Meets
Expectations

3
1f1 Facilities with
Formal Actions Data
Verification State 78 Meets
Expectations
1f2 Total Number
of Formal
Actions at
CWA NPDES
Facilities
Data
Verification State 77 Meets
Expectations
1g1 Number of
Enforcement
Actions with
Penalties
Data
Verification State 55 Meets
Expectations
1g2 Total Penalties
Assessed Data
Verification State $1,283,250 Meets
Expectations
2a1 Number of
formal
enforcement
actions, taken
against major
facilities, with
enforcement
violation type
codes entered.
Data
Verification State 0 Meets
Expectations
5a1 Inspection
Coverage -
NPDES Majors
Goal metric State 57.6% 98.9% 188 190 2 Meets
Expectations
5b1 Inspection
Coverage -
NPDES Non-
Majors
Goal metric State 25.6% 27% 378 1401 1023 Meets
Expectations
5b2 Inspection
Coverage -
NPDES Non-
Majors with
General
Permits
Goal metric State 5.9% 13.9% 2139 15366 13227 Meets
Expectations

4
7a1 Number of
Major
Facilities with
Single Event
Violations
Data
Verification State 1 State
Attention The low
rate of
SEVs will
be further
examined
during the
file
reviews. 7a2 Number of
Non-Major
Facilities with
Single Event
Violations
Informational
only State 1 State
Attention The low
rate of
SEVs will
be further
examined
during the
file
reviews. 7b1 Compliance
schedule
violations
Data
Verification State 85 State
Attention The high
rate of
compliance
schedule
violations
will be
further
examined
during the
file
reviews. 7c1 Permit
schedule
violations
Data
Verification State 1 Meets
Expectations
7d1 Major
Facilities in
Noncompliance
Review
Indicator State 60.3% 52.1% 99 190 91 Meets
Expectations
7f1 Non-Major
Facilities in
Category 1
Noncompliance
Data
Verification State 493 Meets
Expectations

5
7g1 Non-Major
Facilities in
Category 2
Noncompliance
Data
Verification State 196 Meets
Expectations
7h1 Non-Major
Facilities in
Noncompliance
Informational
only State 44.8% 627 1401 774 Meets
Expectations
8a1 Major
Facilities in
SNC
Review
indicator
metric
State 37 Meets
Expectations
8a2 Percent of
Major
Facilities in
SNC
Review
indicator
metric
State 20.6% 19.1% 37 194 157 Meets
Expectations
10a1 Major facilities
with Timely
Action as
Appropriate
Goal metric State 3.6% 0% 0 10 10 State
Improvement The low
rate of
timely
action as
appropriate
will be
further
examined
during the
file
reviews.
Clean Air Act
Metric
ID Metric Name
Metric
Type Agency
National
Goal National
Average
Alabama
(state
only) Count Universe
Not
Counted Initial
Finding Explanation
1a1 Number of Active
Major Facilities
(Tier I)
Data
Verification State 316
Meets
Expectations
1a2 Number of Active
Synthetic Minors
(Tier I)
Data
Verification State 241
Meets
Expectations

6
1a3 Number of Active
NESHAP Part 61
Minors (Tier I)
Data
Verification State 2
Meets
Expectations
1a4
Number of Active
CMS Minors and
Facilities with
Unknown
Classification (Not
counted in metric
1a3) that are
Federally-
Reportable (Tier I)
Data
Verification State 3
Meets
Expectations
1a5
Number of Active
HPV Minors and
Facilities with
Unknown
Classification (Not
counted in metrics
1a3 or 1a4) that are
Federally-
Reportable (Tier I)
Data
Verification State 0
Meets
Expectations
1a6
Number of Active
Minors and Facilites
with Unknown
Classification
Subject to a Formal
Enforcement Action
(Not counted in
metrics 1a3, 1a4 or
1a5) that are
Federally-
Reportable (Tier II)
Data
Verification State 13
Meets
Expectations
1b1
Number of Active
Federally-
Reportable NSPS
(40 C.F.R. Part 60)
Facilities
Data
Verification State 245
Meets
Expectations

7
1b2
Number of Active
Federally-
Reportable
NESHAP (40
C.F.R. Part 61)
Facilities
Data
Verification State 27
Meets
Expectations
1b3
Number of Active
Federally-
Reportable MACT
(40 C.F.R. Part 63)
Facilities
Data
Verification State 321
Meets
Expectations
1b4
Number of Active
Federally-
Reportable Title V
Facilities
Data
Verification State 307
Meets
Expectations
1c1
Number of Tier I
Facilities with an
FCE (Facility
Count)
Data
Verification State 571
Meets
Expectations
1c2 Number of FCEs at
Tier I Facilities
(Activity Count)
Data
Verification State 571
Meets
Expectations
1c3 Number of Tier II
Facilities with FCE
(Facility Count)
Data
Verification State 11
Meets
Expectations
1c4 Number of FCEs at
Tier II Facilities
(Activity Count)
Data
Verification State 11
Meets
Expectations
1d1
Number of Tier I
Facilities with
Noncompliance
Identified (Facility
Count)
Data
Verification State 27
Meets
Expectations
1d2
Number of Tier II
Facilities with
Noncompliance
Identified (Facility
Count)
Data
Verification State 6
Meets
Expectations

8
1e1
Number of Informal
Enforcement
Actions Issued to
Tier I Facilities
(Activity Count)
Data
Verification State 15
Meets
Expectations
1e2
Number of Tier I
Facilities Subject to
an Informal
Enforcement Action
(Facility Count)
Data
Verification State 14
Meets
Expectations
1f1 Number of HPVs
Identified (Activity
Count)
Data
Verification State 6
Meets
Expectations
1f2
Number of Facilities
with an HPV
Identified (Facility
Count)
Data
Verification State 6
Meets
Expectations
1g1
Number of Formal
Enforcement
Actions Issued to
Tier I Facilities
(Activity Count)
Data
Verification State 14
Meets
Expectations
1g2
Number of Tier I
Facilities Subject to
a Formal
Enforcement Action
(Facility Count)
Data
Verification State 14
Meets
Expectations
1g3
Number of Formal
Enforcement
Actions Issued to
Tier II Facilities
(Activity Count)
Data
Verification State 4
Meets
Expectations
1g4
Number of Tier II
Facilities Subject to
a Formal
Enforcement Action
(Facility Count)
Data
Verification State 4
Meets
Expectations

9
1h1 Total Amount of
Assessed Penalties Data
Verification State
$272,250
Meets
Expectations
1h2
Number of Formal
Enforcment Actions
with an Assessed
Penalty
Data
Verification State 18
Meets
Expectations
1i1 Number of Stack
Tests with Passing
Results
Data
Verification State 862
Meets
Expectations
1i2 Number of Stack
Tests with Failing
Results
Data
Verification State 1
Meets
Expectations
1i3 Number of Stack
Tests with Pending
Results
Data
Verification State 0
Meets
Expectations
1i4 Number of Stack
Tests with No
Results Reported
Data
Verification State 0
Meets
Expectations
1i5 Number of Stack
Tests Observed &
Reviewed
Data
Verification State 485
Meets
Expectations
1i6 Number of Stack
Tests Reviewed
Only
Data
Verification State 378
Meets
Expectations
1j
Number of Title V
Annual Compliance
Certifications
Reviewed
Data
Verification State 341
Meets
Expectations
2a
Major Sources
Missing CMS
Source Category
Code
Review
Indicator State 1
Meets
Expectations Supplemental file
selection
3a1 Timely Entry of
HPV
Determinations
Review
Indicator State 2
State
Improvement
Two-thirds of
HPVs entered late
into AFS (> 60
days)

10
3a2 Untimely Entry of
HPV
Determinations Goal State 0 4
State
Improvement
Two-thirds of
HPVs entered late
into AFS (> 60
days).
Supplemental file
selection.
3b1
Timely Reporting of
Compliance
Monitoring
Minimum Data
Requirements
Goal State 100% 80% 94.3% 870 923 53 Meets
Expectations
All of the late
entries are Title V
Annual
Compliance
Certification
reviews.
Timeframes range
from 61 to 436
days late.
Supplemental file
selection.
3b2
Timely Reporting of
Stack Test
Minimum Data
Requirements
Goal State 100% 73.1% 100% 863 863 0 Meets
Expectations
3b3
Timely Reporting of
Enforcement
Minimum Data
Requirements
Goal State 100% 73.7% 100% 35 35 0 Meets
Expectations
5a FCE Coverage
Major Goal State 100% 90.4% 100% 310 310 0
Meets
Expectations
5b FCE Coverage SM-
80 Goal State 100% 93.4% 100% 201 201 0
Meets
Expectations
5c FCE Coverage
Synthetic Minors
(non SM-80) Goal State 100% 53.8% 0/0 0 0 0
Meets
Expectations NA
5d FCE Coverage
Minors Goal State 100% 26.7% 0/0 0 0 0
Meets
Expectations NA

11
5e
Review of Title V
Annual Compliance
Certifications
Completed
Goal State 100% 81.8% 99.7% 306 307 1 Meets
Expectations
7b1
Alleged Violations
Reported Per
Informal
Enforcement
Actions (Tier I only)
Goal State 100% 59.7% 100% 14 14 0 Meets
Expectations
7b2 Alleged Violations
Reported Per Failed
Stack Tests
Review
Indicator State 40.8% 100% 1 1 0
Meets
Expectations
7b3 Alleged Violations
Reported Per HPV
Identified Goal State 100% 53.4% 100% 6 6 0
Meets
Expectations
8a HPV Discovery
Rate Per Major
Facility Universe
Review
Indicator State 4.3% 1.9% 6 316 310
State
Attention
Discovery rate is
below national
average, but EPA
makes HPV
determinations on
behalf of State.
8b
HPV Reporting
Indicator at Majors
with Failed Stack
Tests
Review
Indicator State 20.5% 0% 0 1 1
Meets
Expectations
10a
HPV cases which
meet the timeliness
goal of the HPV
Policy
Review
Indicator State 70.5% 87.5% 7 8 1
State
Attention
Only one HPV
exceeded the 270-
day timeline, and it
was just 8 days
late. The one
source that was
untimely was
selected as a
representative file,
and will be
discussed with the
state during the file
review

12
Resource Conservation and Recovery Act
Metric Metric Name Metric Type Agency National
Goal National
Average Alabama Count Universe
Not
Counted Initial
Finding Comments
1a1 Number of operating
TSDFs Data
Verification State 11
Meets SRF
Expectations
1a2 Number of active LQGs Data
Verification State 313
Meets SRF
Expectations
1a3 Number of active SQGs Data
Verification State 1130
Meets SRF
Expectations
1a4 All other active sites Data
Verification State 3483
Meets SRF
Expectations
1a5 Number of BR LQGs Data
Verification State 227
Meets SRF
Expectations
1b1 Number of sites
inspected Data
Verification State 294
Meets SRF
Expectations
1b2 Number of inspections Data
Verification State 301
Meets SRF
Expectations
1c1 Number of sites with new
violations during review
year
Data
Verification State 203
Meets SRF
Expectations
1c2
Number of sites in
violation at any time
during the review year
regardless of
determination date
Data
Verification State 219
Meets SRF
Expectations
1d1 Number of sites with
informal enforcement
actions
Data
Verification State 46
Meets SRF
Expectations
1d2 Number of informal
enforcement actions Data
Verification State 62
Meets SRF
Expectations
1e1 Number of sites with new
SNC during year Data
Verification State 19
Meets SRF
Expectations

13
1e2 Number of sites in SNC
regardless of
determination date
Data
Verification State 25
Meets SRF
Expectations
1f1 Number of sites with
formal enforcement
actions
Data
Verification State 10
Meets SRF
Expectations
1f2 Number of formal
enforcement actions Data
Verification State 10
Meets SRF
Expectations
1g Total dollar amount of
final penalties Data
Verification State $109,200
Meets SRF
Expectations
1h Number of final formal
actions with penalty in
last 1 FY
Data
Verification State 4
Meets SRF
Expectations
2a Long-standing secondary
violators Review
Indicator State 3
Area for
State
Attention
Discuss with state
during file review
5a Two-year inspection
coverage for operating
TSDFs Goal State 100% 88.9% 100% 11 11 0
Meets SRF
Expectations
5b Annual inspection
coverage for LQGs Goal State 20% 21.7% 48.9% 111 227 116
Meets SRF
Expectations
5c Five-year inspection
coverage for LQGs Goal State 100% 64.2% 100% 227 227 0
Meets SRF
Expectations
5d Five-year inspection
coverage for active SQGs Informational
Only State 10.9% 20% 226 1130 904
Meets SRF
Expectations
5e1 Five-year inspection
coverage at other sites
(CESQGs)
Informational
Only State 232
Meets SRF
Expectations
5e2 Five-year inspection
coverage at other sites
(Transporters)
Informational
Only State 42
Meets SRF
Expectations
5e3 Five-year inspection
coverage at other sites
(Non-notifiers)
Informational
Only State 6
Meets SRF
Expectations

14
5e4
Five-year inspection
coverage at other sites
(not covered by metrics
5a-5e3)
Informational
Only State 453
Meets SRF
Expectations
7b Violations found during
inspections Review
Indicator State 35.9% 61.9% 179 289 110
Meets SRF
Expectations
8a SNC identification rate Review
Indicator State 1.7% 4.8% 14 289 275
Meets SRF
Expectations
8b Timeliness of SNC
determinations Goal State 100% 78.7% 85.7% 18 21 3
Area for
State
Attention
Discuss with state
during file review
10a Timely enforcement
taken to address SNC Review
Indicator State 80% 83.2% 100% 10 10 0
Meets SRF
Expectations

15
Appendix B: File Metric Analysis
This section presents file metric values with EPA’s initial observations on program performance. Initial findings are developed by EPA at the conclusion
of the file review.
Initial findings are statements of fact about observed performance. They should indicate whether there is a potential issue and the nature of the issue. They
are developed after comparing the data metrics to the file metrics and talking to the state.
Final findings are presented above in the CWA Findings section.
Because of limited sample size, statistical comparisons among programs or across states cannot be made.
Clean Water Act
State: Alabama Year Reviewed: FY 2012
CWA
Metric
# Description Numerator Denominator
Metric
Value Goal
Initial
Findings Details
2b
Files reviewed where data are
accurately reflected in the national
data system: Percentage of files
reviewed where data in the file are
accurately reflected in the national data
systems
18 36 50.0% 95% State
Improvement
There are many discrepancies
between information in the
OTIS DFRs and the file - most
commonly related to names
and addresses; several did
have discrepancies between
compliance and enforcement
actions.
3a Timeliness of mandatory data
entered in the national data system 0 0 NA 100% NA
4a1 Pretreatment compliance inspections
and audits NA NA NA 100% NA
4a2 Significant industrial user (SIU)
inspections for SIUs discharging to
non-authorized POTWs 303 303 100.0% 100%
Meets
Expectations

16
4a3 EPA and state oversight of SIU
inspections by approved POTWs NA NA NA 100% NA
4a4 Major CSO inspections NA NA NA 100% NA
4a5 SSO inspections NA NA NA 100% NA
4a6 Phase I MS4 audits or inspections 1 1 100.0% 100% Meets
Expectations
4a7 Phase II MS4 audits or inspections 5 5 100.0% 100% Meets
Expectations
4a8 Industrial stormwater inspections 63 63 100.0% 100% Meets
Expectations
4a9 Phase I and II stormwater
construction inspections 750 750 100.0% 100%
Meets
Expectations
4a10 Inspections of large and medium
NPDES-permitted CAFOs 86 60 143.3% 100%
Meets
Expectations
4a11 Inspections of non-permitted CAFOs NA NA NA 100% NA
4b
Planned commitments completed:
CWA compliance and enforcement
commitments other than CMS
commitments, including work
products/commitments in PPAs, PPGs,
grant agreements, MOAs, MOUs or
other relevant agreements
6 6 100.0% 100% Meets
Expectations

17
6a Inspection reports reviewed that
provide sufficient documentation to
determine compliance at the facility 34 34 100.0% 100%
While "sufficient" for
compliance determinations,
many inspection reports are
not "complete", i.e., the
checklist may be marked as
"yes or no" but it's difficult to
determine what was evaluated
during the inspection and why
the facility was compliant or
not - there is little or no
documentation on how a
compliance determination was
reached. Many reports do not
include important elements
such as a narrative describing
the field activities and
observations, permit status
(particularly when the permit
has expired), facility
description, identifying the
water body discharged to,
regulatory citations, permit
citations, dates and signatures,
etc.
6b
Inspection reports completed within
prescribed timeframe: Percentage of
inspection reports reviewed that are
timely
26 34 76.5% 100% State
Improvement
Many inspection reports are
not timely using 30 days for a
non-sampling inspection and
45 for sampling…2 of these
had no date for an inspection
report completion, therefore,
they are recorded as not
timely...
7e Inspection reports reviewed that led
to an accurate compliance
determination 31 34 91.2% 100%
Meets
Expectations Meets Expectations

18
8b Single-event violation(s) accurately
identified as SNC or non-SNC 22 22 100.0% 100%
Meets
Expectations
SEVs were not being entered
into ICIS….ADEM has
apparently made progress in
this area and SEVs data are
now flowing...
8c
Percentage of SEVs Identified as SNC
Reported Timely: Percentage of SEVs
accurately identified as SNC that were
reported timely
NA NA NA 100% NA NA - no SEVs were identified
as SNC…
9a Percentage of enforcement responses
that return or will return source in
SNC to compliance 16 28 57.1% 100%
State
Improvement
Many of the enforcement
responses have not returned
the source to compliance - in
several cases, there has been
no response to the State's
enforcement action and
noncompliance continues or
noncompliance continues
despite the State's actions.
There were 3 cases in which
compliance schedule
violations are ongoing and 1 in
which the State escalated but
after the review period.
10b Enforcement responses reviewed that
address violations in a timely manner 2 8 25.0% 100%
State
Improvement
6 of 8 State enforcement
actions were informal with no
supporting justification
documenting why a formal
action was not taken.
11a
Penalty calculations that include
gravity and economic benefit:
Percentage of penalty calculations
reviewed that consider and include,
where appropriate, gravity and
economic benefit
4 7 57.1% 100% State
Attention
1 muni case with no EB and 1
with partial EB (for failure to
sample but not eff vio), 2 older
mining cases with no Gravity
or EB. Methodologies are
now being implemented to
better document penalty
calculations…

19
12a
Documentation on difference between
initial and final penalty: Percentage of
penalties reviewed that document the
difference between the initial and final
assessed penalty, and the rationale for
that difference
5 7 71.4% 100% State
Attention
2 older mining cases with no
documentation on the
difference between initial and
final penalties….
12b Penalties collected: Percentage of
penalty files reviewed that document
collection of penalty 8 8 100.0% 100%
Meets
Expectations
Finding Categories Good Practice: Activities, processes, or policies that the SRF metrics show are being implemented at the level of Meets Expectations, and are
innovative and noteworthy, and can serve as models for other states. Meets Expectations: Describes a situation where either: a) no performance deficiencies are identified, or b) single or infrequent deficiencies are
identified that do not constitute a pattern or problem. Generally, states are meeting expectations when falling between 91 to 100 percent of a national
goal. Area for State Attention: The state has single or infrequent deficiencies that constitute a minor pattern or problem that does not pose a risk to human
health or the environment. Generally, performance requires state attention when the state falls between 85 to 90 percent of a national goal. Area for State Improvement: Activities, processes, or policies that SRF data and/or file metrics show as major problems requiring EPA oversight.
These will generally be significant recurrent issues. However, there may be instances where single or infrequent cases reflect a major problem,
particularly in instances where the total number of facilities under consideration is small. Generally, performance requires state improvement when the
state falls below 85 percent of a national goal.

20
Clean Air Act
State: Alabama Year Reviewed: FY 2012
CAA
Metric
#
CAA File Review Metric
Description Numerator Denominator Percentage Goal
Initial
Findings Details
2b
Accurate MDR data in AFS:
Percentage of files reviewed where
MDR data are accurately reflected
in AFS
23 35 65.7% 100% State
Improvement
Discrepancies between the files
and AFS were identified in
about one third of the files
reviewed.
4a1 Planned evaluations completed:
Title V Major FCEs 326 314 103.8% 100%
Meets
Requirements
4a2 Planned evaluations completed: SM-80 FCEs
240 214 112.1% 100% Meets
Requirements
4b
Planned commitments completed: CAA compliance and enforcement
commitments other than CMS
commitments
12 12 100.0% 100% Meets
Requirements
6a
Documentation of FCE elements:
Percentage of FCEs in the files
reviewed that meet the definition of
a FCE per the CMS policy
31 34 91.2% 100% Meets
Requirements
6b
Compliance Monitoring Reports
(CMRs) or facility files reviewed
that provide sufficient
documentation to determine
compliance of the facility: Percentage of CMRs or facility files
reviewed that provide sufficient
documentation to determine facility
compliance
0 34 0.0% 100% State
Improvement
Although compliance
monitoring reports (CMRs)
provided sufficient
documentation to determine
compliance at the facility, all
CMRs were missing one or
more key elements required by
the CMS Guidance.
7a
Accuracy of compliance
determinations: Percentage of
CMRs or facility files reviewed that
led to accurate compliance
determinations
34 34 100.0% 100% Meets
Requirements

21
8c
Accuracy of HPV determinations: Percentage of violations in files
reviewed that were accurately
determined to be HPVs
9 9 100.0% 100% Meets
Requirements
9a
Formal enforcement responses
that include required corrective
action that will return the facility
to compliance in a specified time
frame: Percentage of formal
enforcement responses reviewed
that include required corrective
actions that will return the facility to
compliance in a specified time
frame
14 14 100.0% 100% Meets
Requirements
10a
Timely action taken to address
HPVs: Percentage of HPV
addressing actions that meet the
timeliness standard in the HPV
Policy
7 8 87.5% 100% Meets
Requirements
10b
Appropriate Enforcement
Responses for HPVs: Percentage of
enforcement responses for HPVs
that appropriately address the
violations
8 8 100.0% 100% Meets
Requirements
11a
Penalty calculations reviewed that
consider and include gravity and
economic benefit: Percentage of
penalty calculations reviewed that
consider and include, where
appropriate, gravity and economic
benefit
0 14 0.0% 100% State
Improvement
ADEM did not consider and
document economic benefit
using the BEN model or other
method which produces results
consistent with national policy
and guidance.
12a
Documentation on difference
between initial and final penalty
and rationale: Percentage of
penalties reviewed that document
the difference between the initial
and final assessed penalty, and the
rationale for that difference
5 14 35.7% 100% State
Improvement
The rationale for any
differences between the initial
and final penalty is not
consistently documented.

22
12b Penalties collected: Percentage of
penalty files reviewed that
document collection of penalty 14 14 100.0% 100%
Meets
Requirements
Finding Category Descriptions Good Practice: Activities, processes, or policies that the SRF metrics show are being implemented at the level of Meets Expectations, and are
innovative and noteworthy, and can serve as models for other states. Meets Expectations: Describes a situation where either: a) no performance deficiencies are identified, or b) single or infrequent deficiencies are
identified that do not constitute a pattern or problem. Generally, states are meeting expectations when falling between 91 to 100 percent of a national
goal. Area for State Attention: The state has single or infrequent deficiencies that constitute a minor pattern or problem that does not pose a risk to
human health or the environment. Generally, performance requires state attention when the state falls between 85 to 90 percent of a national goal. Area for State Improvement: Activities, processes, or policies that SRF data and/or file metrics show as major problems requiring EPA oversight.
These will generally be significant recurrent issues. However, there may be instances where single or infrequent cases reflect a major problem,
particularly in instances where the total number of facilities under consideration is small. Generally, performance requires state improvement when the
state falls below 85 percent of a national goal.

23
Resource Conservation and Recovery Act
State: Alabama Year Reviewed: FY 2012
RCRA
Metric
# Name and Description Numerator Denominator
Metric
% Goal
Initial
Findings Details
2b
Accurate entry of mandatory data:
Percentage of files reviewed where
mandatory data are accurately
reflected in the national data system
8 35 22.9% 100% Area for
Improvement
3a
Timely entry of mandatory data:
Percentage of files reviewed where
mandatory data are entered in the
national data system in a timely
manner
0 0 N/A 100% Cannot make a finding, no
method to determine timeliness
data entry in file review.
4a
Planned non-inspection
commitments completed: Percentage
of non-inspection commitments
completed in the review year
3 3 100.0% 100% Meets
Requirements
The enforcement activities in
the grant workplan are
projections, rather than
commitments, which are
outside the control of ADEM.
Counting actual activities
rather than grant categories,
ADEM completed 99% of the
grant projections.
6a
Inspection reports complete and
sufficient to determine compliance:
Percentage of inspection reports
reviewed that are complete and
provide sufficient documentation to
determine compliance
29 31 93.5% N/A Meets
Requirements
6b
Timeliness of inspection report
completion: Percentage of inspection
reports reviewed that are completed in
a timely manner
32 34 94.1% 100% Meets
Requirements
7a
Accurate compliance
determinations: Percentage of
inspection reports reviewed that led to
accurate compliance determinations
35 35 100.0% 100% Meets
Requirements

24
8c
Appropriate SNC determinations:
Percentage of files reviewed in which
significant noncompliance (SNC)
status was appropriately determined
during the review year
22 25 88.0% 100% Area for
Attention
Three facilities were not
identified as SNC, and were
addressed through informal
enforcement by the state
9a
Enforcement that returns SNC sites
to compliance: Percentage of
enforcement responses that have
returned or will return a site in SNC to
compliance
19 19 100.0% 100% Meets
Requirements
9b
Enforcement that returns SV sites to
compliance: Percentage of
enforcement responses that have
returned or will return a secondary
violator to compliance
12 12 100.0% 100% Meets
Requirements
10b
Appropriate enforcement taken to
address violations: Percentage of files
with enforcement responses that are
appropriate to the violations
32 35 91.4% 100% Meets
Requirements
Three facilities were not
identified as SNC, and were
addressed through informal
enforcement by the state
11a
Penalty calculations include gravity
and economic benefit: Percentage of
reviewed penalty calculations that
consider and include, where
appropriate, gravity and economic
benefit
3 18 16.7% 100% Area for
Improvement
12a
Documentation on difference
between initial and final penalty:
Percentage of penalties reviewed that
document the difference between the
initial and final assessed penalty, and
the rationale for that difference
0 14 0.0% 100% Area for
Improvement No initial penalties for review
to compare with final order
12b Penalties collected: Percentage of
files that document collection of
penalty 15 16 93.8% 100%
Meets
Requirements
Finding Categories Good Practice: Activities, processes, or policies that the SRF metrics show are being implemented at the level of Meets Expectations, and are
innovative and noteworthy, and can serve as models for other states.

25
Meets Expectations: Describes a situation where either: a) no performance deficiencies are identified, or b) single or infrequent deficiencies are
identified that do not constitute a pattern or problem. Generally, states are meeting expectations when falling between 91 to 100 percent of a national
goal. Area for State Attention: The state has single or infrequent deficiencies that constitute a minor pattern or problem that does not pose a risk to
human health or the environment. Generally, performance requires state attention when the state falls between 85 to 90 percent of a national goal.
Area for State Improvement: Activities, processes, or policies that SRF data and/or file metrics show as major problems requiring EPA oversight.
These will generally be significant recurrent issues. However, there may be instances where single or infrequent cases reflect a major problem,
particularly in instances where the total number of facilities under consideration is small. Generally, performance requires state improvement when the
state falls below 85 percent of a national goal.

26
Appendix C: File Selection
Files are selected according to a standard protocol using a web-based file selection tool. These are designed to provide consistency and transparency to the
process. Based on the description of the file selection process below, states should be able to recreate the results in the table.
Clean Water Act
File Selection Process
Using the OTIS File Selection Tool, 40 FY 2012 Representative Files were selected for review as part of Round 3 of the Alabama State Review
Framework (SRF) review to be conducted from May 13 - 17, 2013. As specified in the SRF File Selection Protocol, between 35 and 40 files are to be
selected for a state with a universe greater than 1,000 facilities. Since Alabama’s universe is greater than 1,000; 40 files were selected for the SRF review
and between 35 and 40 files will be reviewed during the on-site file review. The Permit Quality Review (PQR)/SRF Integrated File Selection Process calls
for additional files to be selected and reviewed as part of the integrated review. Common files that will be reviewed by permits and enforcement staff
include files selected for the PQR core review and additional files randomly selected from the Regional Topics.
There are 190 major individual permits, 1,401 non-major individual permits and 15,366 non-major general permits in the Alabama universe of facilities.
Of the 40 files to review: 55 percent (or 22) of the files selected are majors, and 45 percent (or 18) of the files are non-majors.
For the major facilities, the Alabama universe was sorted based on Inspections, Significant Noncompliance (SNC), Single Event Violations (SEV),
Violations, Informal/Formal Actions and Penalties. Twenty-two major facilities were then randomly selected for a file review.
For non-major facilities, the Alabama universe was also sorted based on Inspections, SNC, SEVs, Violations, Informal/Formal Actions and Penalties.
Eighteen non-major facilities were then randomly selected for a file review.
Using the sorting criteria noted above, the 40 facilities selected for the SRF file review include facilities with a total of 37 inspections, 28 violations, 1
SEV, 17 SNCs, 22 informal actions, 9 formal actions, and 9 penalties.
Of the 40 files selected for the SRF review, 14 of the files include those selected for the integrated PQR/SRF review as follows: 9 are Core Permits, and 5
permits are covered by Regional Topics (i.e., Compliance Schedules, Quarry/Sand and Gravel Mines, and Coal Bed Methane). The remaining files were
selected for SRF review purposes; however, several files selected for the SRF review will include a focus on major facilities with timely action as
appropriate and storm water construction general permits.

27
CWA File Selection Table
# ID Number Facility Name City Univer
se
Permit
Componen
ts
Inspectio
ns
Violati
on
Single
Event
Violatio
ns
SNC Inform
al
Action
s
Forma
l
Actio
ns
Penaltie
s
1 AL000011
6
DECATUR
FACILITY
(ASCEND)
DECATUR Major 1 No 0 No 0 0 0
2 AL000086
8
ARCLIN USA
INC
RIVER
FALLS
Major 1 Yes 0 SNC 0 0 0
3 AL000284
4
POWER
SOUTH
ENERGY
COOPERATI
VE
ANDALUSIA Non-
Major
1 Yes 0 Categor
y 1
1 0 0
4 AL002004
4
ENTERPRISE
SOUTHEAST
LAGOON
ENTERPRISE Major POTW,
Pretreatme
nt
2 Yes 0 SNC 0 1 16400
5 AL002015
0
GUNTERSVI
LLE WWTP
GUNTERSVI
LLE
Major Biosolids,
POTW,
Pretreatme
nt
2 Yes 0 No 1 0 0
6 AL002099
1
BRIDGEPOR
T LAGOON
BRIDGEPOR
T
Major POTW,
Pretreatme
nt
2 Yes 0 No 2 0 0
7 AL002199
7
MASLAND
CARPETS
INC
ATMORE Major 1 Yes 0 No 1 0 0
8 AL002220
9
PHENIX
CITY WWTP
PHENIX
CITY
Major POTW,
Pretreatme
nt
1 Yes 1 No 1 0 0
9 AL002276
4
OMMUSSEE
CREEK
(DOTHAN)
DOTHAN Major Biosolids,
POTW,
Pretreatme
nt
1 No 0 No 0 0 0
1
0
AL002311
6
HELENA
WWTP
HELENA Major POTW,
Pretreatme
nt
1 Yes 0 SNC 1 0 0
1
1
AL002458
9
COLUMBIAN
A WWTP
COLUMBIAN
A
Major POTW,
Pretreatme
nt
1 Yes 0 No 0 0 0

28
1
2
AL002478
3
J AND M
CYLINDERS
GASES INC
DECATUR Non-
Major
1 Yes 0 Categor
y 1
1 0 0
1
3
AL002598
4
TUSKEGEE
SOUTH
WPCP
TUSKEGEE Major POTW,
Pretreatme
nt
1 Yes 0 SNC 0 1 175000
1
4
AL002659
0
JIM WALTER
MINE 4
BROOKWOO
D
Major 2 Yes 0 SNC 1 0 0
1
5
AL002772
3
PINE CREEK
WASTEWAT
ER TRMT
PLT
PRATTVILLE Major Biosolids,
POTW,
Pretreatme
nt
1 Yes 0 No 1 0 0
1
6
AL002797
9
DEEP SEA
FOODS INC
BAYOU LA
BATRE
Non-
Major
1 Yes 0 Categor
y 1
1 0 0
1
7
AL004084
3 (Core)
HANCEVILL
E FACILITY
(AM.
PROTEIN)
HANCEVILL
E
Major 3 Yes 0 No 1 0 0
1
8
AL004410
5
BRUNDIDGE
WWTP
BRUNDIDGE Non-
Major
POTW,
Pretreatme
nt
2 Yes 0 No 1 0 0
1
9
AL004750
3
EVERGREEN
LAGOON
EVERGREEN Major POTW,
Pretreatme
nt
1 Yes 0 No 0 0 0
2
0
AL005013
0
OPELIKA
WESTSIDE
WWTP
OPELIKA Major POTW,
Pretreatme
nt
1 Yes 0 No 0 0 0
2
1
AL005042
3
CULLMAN
WWTP
CULLMAN Major Biosolids,
POTW,
Pretreatme
nt
2 Yes 0 SNC 1 0 0
2
2
AL005093
8
CALERA
POLLUTION
CONTROL
PLANT
CALERA Major POTW,
Pretreatme
nt
1 Yes 0 SNC 1 0 0
2
3
AL005433
0 (Core)
FOX
VALLEY
APARTMEN
TS LAGOON
MAYLENE Non-
Major
0 Yes 0 Categor
y 1
1 0 0
2
4
AL005463
1
CLANTON
CITY OF
CLANTON Major POTW,
Pretreatme
1 Yes 0 SNC 1 0 0

29
nt
2
5
AL005585
9
MOBILE
FACILITY
(SHELL)
SARALAND Major 1 No 0 No 0 0 0
2
6
AL005619
7
CUMBERLA
ND HEALTH
AND REHAB
BRIDGEPOR
T
Non-
Major
1 Yes 0 No 0 0 0
2
7
AL005687
1
CAHABA
PARK WEST
LAGOON
SELMA Non-
Major
1 Yes 0 Categor
y 1
2 0 0
2
8
AL005765
7
ATTALLA
WASTEWAT
ER
TREATMENT
LAGOON
RAINBOW
CITY
Major POTW,
Pretreatme
nt
1 Yes 0 SNC 1 0 0
2
9
AL005772
0
AUTAUGAVI
LLE WWTP
AUTAUGAVI
LLE
Non-
Major
POTW,
Pretreatme
nt
0 Yes 0 Categor
y 1
0 1 2400
3
0
AL005840
8
OXFORD
TULL C
ALLEN
WWTP
OXFORD Major POTW,
Pretreatme
nt
1 Yes 0 SNC 0 1 20450
3
1
AL006021
6
MAXWELL
CROSSING
FACILITY
BUHL Non-
Major
1 No 0 No 0 0 0
3
2
AL006178
6
MINE NO. 1
(TACOA
MINERALS)
MONTEVAL
LO
Non-
Major
1 No 0 No 0 1 75000
3
3
AL006890
0
NORTH
ALABAMA
SAND AND
GRAVEL
PHIL
CAMPBELL
Non-
Major
2 No 0 No 0 1 40000
3
4
AL007323
7
MALBIS PIT SPANISH
FORT
Non-
Major
1 No 0 No 1 0 0
3
5
AL007567
1
MADISON
MATERIALS
GUNTERSVI
LLE
QUARRY
GUNTERSVI
LLE
Non-
Major
1 No 0 No 1 1 16250

30
3
6
AL007775
5
RUSSELL
MATERIALS
PIT
KENT Non-
Major
1 No 0 No 0 0 0
3
7
AL007814
0
COOSA
VALLEY
WATER
TRMT PLT
RAGLAND Non-
Major
0 Yes 0 Categor
y 1
2 0 0
3
8
ALR10732
6
HONS AT
SAVANNAH
WOODS
SPANISH
FORT
Non-
Major
3 No 0 No 3 0 0
3
9
ALR16EB
XG
LESLIE
GREENE
CUTRATE
GRADING
PHENIX
CITY,
Non-
Major
2 No 0 No 0 2 27000
4
0
ALR16EG
RK
PARK PLACE ENTERPRISE Non-
Major
3 No 0 No 0 1 24800

31
Clean Air Act
File Selection Process
Using the OTIS File Selection Tool, 35 files were selected for review during the April 2013 file review visit (28 representative and 7 supplemental). As
specified in the File Selection Protocol, since the Alabama universe includes 584 sources, 30 to 35 files must be reviewed.
Representative Files
The file review will focus on sources with compliance and enforcement activities occurring during the review period (FY12). Therefore, the targeted
number of representative files to review was determined to be approximately 30, with 5 available for supplemental review.
Enforcement files: In order to select files with enforcement related activity, the facility list was sorted to identify those sources that had a formal
enforcement action during the review period. There were 14 Tier 1 sources with a formal enforcement action in FY12, so all of these were selected for
review.
Compliance files: There were about 570 remaining sources with full compliance evaluations (FCEs) during FY12. This list was sorted by universe
(major, SM, etc.), and every 38th file was selected, resulting in 14 additional representative files.
Supplemental Files
Metric 2a: The Data Metrics Analysis (DMA) indicated 1 major source that was missing the CMS source category code, so this was selected for
supplemental review (0107100010).
Metric 3a2: The DMA identified 4 sources that had an untimely High Priority Violation (HPV) entry in AFS. All but one had already been selected as
representative files because they had a formal enforcement action. The remaining source (0100300039) took 107 days to enter the HPV, and it did not
have a formal enforcement action, so it was selected for supplemental review.
Metric 3b1: The DMA identified 53 sources with late compliance monitoring activity data entry. All of these sources had a late Title V Annual
Compliance Certification (ACC) review, so two of these were selected for supplemental review (0109708026 & 0111700004) to facilitate further
discussion with the State during the file review.
Universe Distribution: A review of the representative and supplemental files selected indicated a preponderance of Major sources, and only 7 SM
sources, so 3 additional SM sources were randomly selected for supplemental review (0100100005, 0105900010, & 0110100025), bringing the total
number of files to 35.

32
CAA File Selection Table
ID Number City ZIP
CODE LCON Universe FCEs
Stack Tests Failed
Violations HPVs Informal Actions
Formal Actions
Penalties Flag Value
1 0100100001 PRATTVILLE 36067 00 Major 1 0 0 0 0 0 0 Representative
2 0100100005 PRATTVILLE 36067 00
Synthetic Minor
1 0 0 0 0 0 0 Supplemental
3 0100300039 FAIRHOPE 36532 00 Major 1 0 1 1 1 0 0 Supplemental
4 0101500068 JACKSONVILLE 36265 00
Synthetic Minor
1 0 0 0 0 0 0 Representative
5 0101900001 LEESBURG 35983 00 Major 1 0 1 0 0 1 24000 Representative
6 010250S003 FULTON 36446 00 Major 1 0 1 0 0 1 4000 Representative
7 010270S008 ASHLAND 36251 00 Major 1 0 0 0 0 0 0 Representative
8 0104500014 DOTHAN 36303 00 Major 1 0 0 0 0 0 0 Representative
9 0105300082 ATMORE 36502 00
Synthetic Minor
1 0 0 0 0 0 0 Representative
10 0105300086 NOT GIVEN 00
Tier I Minor
1 0 1 0 0 1 17500 Representative
11 0105300088 EVERGREEN 00 Major 1 0 1 0 0 1 17500 Representative
12 0105300090 BROOKLYN 36401 00 Major 1 0 1 0 0 1 7500 Representative
13 0105900010 RED BAY 35582 00
Synthetic Minor
1 0 0 0 0 0 0 Supplemental
14 0107100010 SCOTTSBORO 35769 00 Major 1 0 0 0 0 0 0 Supplemental
15 0107900001 COURTLAND 35618 00 Major 1 0 0 0 0 0 0 Representative
16 0108300025 ATHENS 35611 00
Synthetic Minor
1 0 0 0 0 0 0 Representative
17 0109100012 DEMOPOLIS 36732 00
Synthetic Minor
0 0 1 0 0 1 10000 Representative
18 0109500014 GUNTERSVILLE 35976 00 Major 1 0 1 0 1 1 10000 Representative
19 0109700009 MOBILE 36601 00 Major 1 0 0 0 0 0 0 Representative
20 0109700095 CALVERT 36513 00 Major 1 1 1 1 2 1 75000 Representative
21 0109700106 CALVERT 36513 00 Major 1 0 1 1 1 1 20000 Representative
22 0109704005 NOT IN A CITY 36606 00 Major 1 0 1 1 1 1 10000 Representative
23 0109708026 THEODORE 36582 00 Major 1 0 0 0 0 0 0 Supplemental
24 0110100025 MONTGOMERY 36108 00
Synthetic Minor
1 0 0 0 0 0 0 Supplemental

33
25 0110100033 MONTGOMERY 36108 00
Synthetic Minor
1 0 0 0 0 0 0 Representative
26 0110100078 MONTGOMERY 36104 00 Major 1 0 0 0 0 0 0 Representative
27 0110300005 DECATUR 35602 00 Major 1 0 1 0 1 1 10000 Representative
28 0110300009 DECATUR 35609 00 Major 1 0 1 0 0 1 6000 Representative
29 0111100026 ROANOKE 36274 00
Synthetic Minor
1 0 0 0 0 0 0 Representative
30 0111300004 NOT IN A CITY 36851 00 Major 1 0 1 1 1 1 16000 Representative
31 0111500028 RAGLAND 35131 00 Major 1 0 0 0 0 0 0 Representative
32 0111700004 CALERA 35040 00 Major 1 0 0 0 0 0 0 Supplemental
33 0112500058 TUSCALOOSA 35401 00 Major 1 0 0 0 0 0 0 Representative
34 0112500111 TUSCALOOSA 35401 00
Synthetic Minor
1 0 0 0 0 0 0 Representative
35 0112900022 MCINTOSH 36553 00 Major 1 0 1 1 1 1 25000 Representative

34
Resource Conservation and Recovery Act
File Selection Process
Using the OTIS File Selection Tool, 35 files were selected for review in the April 2013 file review. As outlined in the SRF File Selection
Protocol, between 30 and 35 files must be reviewed for states with between 301 and 1000 compliance and enforcement activities during the
review period. ADEM had 322 RCRA activities during FY2012 review period, and a total of 35 files were selected for review. The general
process used to identify the files is provided below.
A random, representative selection of facilities was completed using the OTIS File Selection Tool. As outlined in the SRF File Selection
Protocol, at least half of the facilities selected should have compliance monitoring activity, and if possible, half should have enforcement
activity.
Enforcement files - In order to identify files with enforcement related activity, the list of RCRA facilities with FY2012 activities was sorted
to identify those facilities which had a final formal enforcement action during the review period. There were ten facilities with a formal
enforcement action finalized in FY2012 in Alabama, and all ten facilities were selected for review.
Compliance Monitoring files - For the remaining 25 files, the OTIS File Selection Tool was then sorted on the following categories:
SNC - Ten files were selected for facilities that were identified as SNCs in FY2012, but did not have formal enforcement actions taken
during that fiscal year;
Informal Action - Ten facilities that received informal enforcement actions (but were not SNCs) in FY2012 were then selected;
Evaluations - The remaining five files were then selected from facilities that had inspections during FY2012, but did not have any
informal or formal enforcement action during that period.
In all instances, a mix of RCRA facility types was included in the selection. There were no supplemental files selected as part of the file
review.

35
RCRA File Selection Table
Facility Name Program ID City Eval-
uation Violation SNC
Informal Action
Formal Action
Penalty Universe
1 TECHTRIX, INC ALD982167678 GADSDEN 1 20 1 1 1 0 LQG
2 THYSSENKRUPP STEEL USA, LLC ALR000042689 CALVERT 1 13 1 1 1 15,000 LQG
3 PLAINS PIPELINE, LP ALR000049700 EIGHT MILE 1 10 1 1 1 19,300 LQG
4 LP EVERGREEN ALD000653097 EVERGREEN 0 0 1 1 1 0 SQG
5 ALABAMA STATE PORT AUTHORITY- AWTC SITE
ALD058221326 MOBILE 1 3 1 1 1 8,400 TSD(LDF)
6 DUNBARTON CORPORATION REDIFRAME DIVISION
ALR000012674 DOTHAN 0 0 1 0 1 0 LQG
7 BERG SPIRAL PIPE ALR000044453 MOBILE 0 0 1 0 1 11,500 LQG
8 AAR PRECISION SYSTEMS - HUNTSVILLE
ALD084948157 HUNTSVILLE 0 0 0 0 1 24,000 LQG
9 YOUNG OIL SERVICE ALR000000364 OAKMAN 0 0 0 0 1 0 OTH
10 U.S. ARMY CENTER OF EXCELLENCE
AL6210020776 FORT RUCKER 0 1 0 0 1 31,000 TSD(LDF)
11 NEXEO SOLUTIONS LLC OHR000162800 DUBLIN 2 2 2 2 0 0 OTH
12 CLEAN TIDE CONTAINER ALR000043976 ROBERTSDALE 1 7 2 2 0 0 SQG
13 METAL MANAGEMENT ALABAMA INC
ALR000014431 BIRMINGHAM 2 6 1 1 0 0 CES
14 UNIVERSITY OF ALABAMA AT BIRMINGHAM
ALD063690705 BIRMINGHAM 1 15 1 1 0 0 LQG
15 ALFAB INC ALD983171638 ENTERPRISE 1 15 1 1 0 0 LQG
16 GRAVES PLATING COMPANY, INC ALD004012050 FLORENCE 1 11 1 1 0 0 LQG

36
17 STELLA-JONES CORPORATION ALD983166653 WARRIOR 1 10 1 1 0 0 LQG
18 EUROFINS MWG OPERON ALR000038919 HUNTSVILLE 1 16 1 1 0 0 LQG
19 PI PROTEOMICS LLC ALR000041202 HUNTSVILLE 1 9 1 1 0 0 SQG
20 TENNESSEE VALLEY AUTHORITY ENVIRONMENTAL RESEARCH CENTER
AL3640090004 MUSCLE SHOALS 0 7 1 1 0 0 TSD(LDF)
21 TITAN COATINGS, INC AL0000266569 BESSEMER 1 17 0 1 0 0 LQG
22 EMERSON FABRICATION GROUP LLC- PAINT B2
ALR000051490 ONEONTA 1 13 0 1 0 0 LQG
23 WELLBORN CABINET, INC ALD031482037 ASHLAND 1 12 0 1 0 0 LQG
24 UTILITY TRAILER MANUFACTURING COMPANY
ALD077911915 ENTERPRISE 1 9 0 1 0 0 LQG
25 MOBIS ALABAMA LLC ALR000034207 MONTGOMERY 1 14 0 1 0 0 LQG
26 ALTEC INDUSTRIES INC ALD004001731 BIRMINGHAM 1 13 0 1 0 0 LQG
27 METALPLATE GALVANIZING, L.P ALD003398575 BIRMINGHAM 1 7 0 1 0 0 LQG
28 GERMAN MOTOR WORKS LLC ALR000051045 ENTERPRISE 1 2 0 1 0 0 OTH
29 EMERSON FABRICATION BLOUNTVILLE LLC
ALR000047878 BLOUNTSVILLE 1 17 0 1 0 0 SQG
30 ANNISTON ARMY DEPOT AL3210020027 ANNISTON 1 4 0 1 0 0 TSD(COM)
31 TETLP-CODEN ALR000034769 CODEN 1 4 0 0 0 0 CES
32 FONTAINE TRAILER MILITARY PRODUCTS
ALR000009308 JASPER 1 10 0 0 0 0 LQG
33 PEMCO WORLD AIR SERVICES ALD009825944 DOTHAN 1 9 0 0 0 0 LQG

37
34 SOUTHEAST ALABAMA FABRICARE INC
ALR000026864 DOTHAN 1 8 0 0 0 0 SQG
35 T.R. MILLER MILL COMPANY, INC ALD008161416 BREWTON 2 7 0 0 0 0 TSD(LDF)

38
Appendix D: Status of Past SRF Recommendations
During the Round 1 and 2 SRF reviews of Alabama’s compliance and enforcement programs, EPA Region 4 recommended actions to address
issues found during the review. The following table contains all outstanding recommendations for Round 1, and all completed and
outstanding actions for Round 2. The statuses in this table are current as of Select date.
For a complete and up-to-date list of recommendations from Rounds 1 and 2, visit the SRF website.
Status Due Date Media E# Element Finding Recommendation
ROUND
1
Long
Term
Resolution
9/30/2010 CAA E7 Penalty
Calculations
No written penalty
policy
It is recommended that ADEM develop a
comprehensive penalty policy.
ROUND
1
Long
Term
Resolution
9/30/2010 CAA E8 Penalties
Collected
ADEM does not
document how they
calculate penalties.
ADEM needs to document its implementation of the
six factors used when determining a penalty.
ROUND
1
Not
Completed
in Round
1 -
Identified
in Round
2
9/30/2010 CWA E4 SNC Accuracy False SNC data entries
impacting Watchlist
ADEM should develop and submit to EPA for
review procedures to improve the quality of data
entry so that ICIS-NPDES can accurately identify
SNCs and prevent the identification of false SNCs.
ROUND
1
Long
Term
Resolution
9/30/2010 CWA E7 Penalty
Calculations
Need for a written
penalty policy
ADEM should develop a comprehensive written
penalty policy
ROUND
1
Long
Term
Resolution
9/30/2010 CWA E8 Penalties
Collected
Need for a written
penalty policy
ADEM should develop a comprehensive written
penalty policy
ROUND
1
Not
Completed
in Round
1 -
Identified
in Round
2
9/30/2010 CWA E10 Data Timely Data entry issues Alabama should ensure timely implementation of the
NMS.

39
ROUND
1
Not
Completed
in Round
1 -
Identified
in Round
2
9/30/2010 CWA E11 Data Accurate Data entry issues Alabama should continue to utilize the current
standard operating procedures, or update it as
necessary, for entering all required data into PCS
both timely and accurately until NMS can be relied
on.
ROUND
1
Not
Completed
in Round
1 -
Identified
in Round
2
9/30/2010 RCRA E6 Timely &
Appropriate
Actions
SNC identification
issues
EPA recommends that ADEM closely review the
RCRA Enforcement Response Policy for the
appropriate identification of SNC facilities, as well to
determine the appropriate response to violations at
RCRA facilities.
ROUND
1
Long
Term
Resolution
9/30/2010 RCRA E7 Penalty
Calculations
Lack of a written
penalty policy
ADEM should develop a comprehensive written
penalty policy
ROUND
1
Long
Term
Resolution
9/30/2010 RCRA E8 Penalties
Collected
No written penalty
policy
ADEM should develop a comprehensive written
penalty policy
ROUND
2
Completed 12/31/2011 CAA E2 Data Accuracy The state’s reporting of
the compliance status of
HPV sources is not
consistent with national
policy.
ADEM should implement procedures that ensure that
the compliance status and HPV status codes are
properly entered into AFS consistent with national
HPV Policy. Reviews indicate that ADEM is
accurately reporting the compliance status of sources
into AFS.
ROUND
2
Long
Term
Resolution
9/30/2013 CAA E11 Penalty
Calculation
Method
Alabama does not
maintain penalty
documentation in their
enforcement files, and
no other penalty
calculations were
provided to EPA upon
request.
Alabama should develop and implement procedures
for the documentation of initial and final penalty
calculation, including both gravity and economic
benefit calculations, appropriately using the BEN
model or other method that produces results
consistent with national policy.

40
ROUND
2
Long
Term
Resolution
9/30/2013 CWA E11 Penalty
Calculation
Method
Alabama does not
maintain penalty
documentation in their
enforcement files, and
no other penalty
calculations were
provided to EPA upon
request.
Alabama should develop and implement procedures
for the documentation of initial and final penalty
calculation, including both gravity and economic
benefit calculations, appropriately using the BEN
model or other method that produces results
consistent with national policy.
ROUND
2
Long
Term
Resolution
9/30/2013 CWA E12 Final Penalty
Assessment and
Collection
Alabama did not
provide EPA with
documentation of the
rationale between their
initial and assessed
penalty.
Alabama should develop and implement procedures
for the documentation of initial and final penalty
calculation, including both gravity and economic
benefit calculations, appropriately using the BEN
model or other method that produces results
consistent with national policy.
ROUND
2
Completed 12/31/2011 CWA E1 Data
Completeness
Upon examination of
the MDRs in PCS for
Alabama, it was
determined that the data
was not complete.
ADEM should develop and submit to EPA for
review a protocol that ensures data is entered
completely.
Region 4’s FY 10 end-of-year review found that the
State met the required 95% entry level for every
month in FY 10. Region 4 confirmed that data in
ICIS largely reflects the same information in NMS
for FY 11.
ROUND
2
Completed 3/31/2012 CWA E4 Completion of
Commitments
Six grant commitments
were not met.
ADEM should promptly take actions to fulfill the
commitments in the CWA §106 Grant Workplan and
the requirements of the EPA/ADEM NPDES MOA.
Region 4 confirmed that ADEM was in full
compliance with their FY11 grant commitments

41
ROUND
2
Completed 4/17/2013 CWA E6 Quality of
Inspection
Reports
The review identified
issues with the
completeness and
timeliness of the state's
inspection reports.
ADEM submitted a revised EMS to EPA on April
17, 2013, which adequately addresses the
recommendation on this finding that two inspection
report timeframes be clearly incorporated and
implemented through the CWA EMS: one for non-
sampling inspections and another for sampling
inspections that depend on laboratory results.
ROUND
2
Completed 6/30/2012 CWA E8 Identification of
SNCs
Alabama does not
adequately identify and
report SNCs into the
national database.
ADEM should develop and submit to EPA for
review procedures to improve the quality of data
entry so that ICIS-NPDES can accurately identify
SNCs and prevent the identification of false SNCs.
Region 4 has verified that ADEM has done an
outstanding job reducing false SNCs by improving
their DMR entry rates.
ROUND
2
Completed 12/31/2011 CWA E10 Timely &
Appropriate
Actions
Alabama does not take
timely enforcement
action for their SNCs in
accordance with CWA
policy.
ADEM should implement procedures to ensure that
timely enforcement is taken in accordance with
CWA policy. Progress by ADEM has been observed
and it no longer appears to be a systemic issue.
ROUND
2
Completed 6/30/2012 RCRA E8 Identification of
SNCs
Alabama is not entering
the required SNC
information into
RCRAInfo in a timely
manner.
ADEM should ensure that the timelines in the RCRA
Enforcement Response Policy (ERP) are met. Region
4 reviews in FY2010 and FY2011 showed the timely
SNC entry rate was 94.4% and 100% respectively.
ROUND
2
Completed 9/30/2011 RCRA E10 Timely &
Appropriate
Actions
Timely enforcement
response for SNC
violations is a
continuing concern for
Alabama.
ADEM should ensure that the timelines in the RCRA
Enforcement Response Policy are met. A review of
FY 2010 data in RCRAInfo showed a pattern of
timely enforcement actions.

42
ROUND
2
Long
Term
Resolution
9/30/2013 RCRA E11 Penalty
Calculation
Method
Alabama does not
maintain penalty
documentation in their
enforcement files, and
no other penalty
calculations were
provided to EPA upon
request.
Alabama should develop and implement procedures
for the documentation of initial and final penalty
calculation, including both gravity and economic
benefit calculations, appropriately using the BEN
model or other method that produces results
consistent with national policy.
ROUND
2
Long
Term
Resolution
9/30/2013 RCRA E12 Final Penalty
Assessment and
Collection
Alabama did not
provide EPA with
documentation of the
rationale between their
initial and assessed
penalty.
Alabama should develop and implement procedures
for the documentation of initial and final penalty
calculation, including both gravity and economic
benefit calculations, appropriately using the BEN
model or other method that produces results
consistent with national policy.

43
Appendix E: Program Overview

44
Appendix F: SRF Correspondence
Kick Off Letter
March 22, 2013
Mr. Lance R. LeFleur
Director
Alabama Department of
Environmental Management
Post Office Box 301463
Montgomery, Alabama 36130-4163
Dear Director LeFleur:
As we discussed last Fall during our annual visit with you and your staff, Region 4 is initiating a
review this year of the enforcement and compliance programs of the Alabama Department of
Environmental Management (ADEM) using the Round 3 State Review Framework (SRF)
protocol. The review will look at ADEM’s Clean Air Act (CAA) Stationary Source program,
Resource Conservation and Recovery Act (RCRA) Subtitle C program and the Clean Water Act
(CWA) National Pollutant Discharge Elimination System (NDPDES) program, which will
include an NPDES Permit Quality Review (PQR) along with the Round 3 CWA SRF. The SRF
and NPDES PQR will be conducted by regional staff and will be based on inspection and
enforcement activities from federal fiscal year 2012 and from permitting actions taken during
federal fiscal years 2010, 2011, 2012 and 2013.
While discussions are beginning between our staff and yours regarding logistics and scheduling,
we thought it would be helpful to provide additional background and context for the upcoming
review.
SRF Background
The SRF is a continuation of a national effort that allows EPA to ensure that State agencies meet
agreed-upon minimum performance levels in providing environmental and public health
protection. The SRF looks at twelve program elements covering data (completeness, timeliness,
and quality); inspections (coverage and quality); identification of violations; enforcement actions
(appropriateness and timeliness) and penalties (calculation, assessment and collection). The
review is conducted in three phases: analyzing information from the national data systems,
reviewing a limited set of state files, and the development of findings and recommendations.
Alabama’s CAA, RCRA and CWA NPDES enforcement and compliance programs were
reviewed under the SRF protocol in 2006 and 2010. A copy of these reports can be found on the
SRF website at: http://www.epa.gov/compliance/state/srf/

45
Permit Quality Review and the Integrated Review Background
EPA reviews state NPDES programs every four years as part of the PQR process. The PQR
assesses the State’s implementation of the requirements of the NPDES program as reflected in
the permit and other supporting documents (e.g., fact sheet, calculations, etc.).
As part of the Clean Water Act Action Plan, the Office of Water (OW) and the Office of
Enforcement and Compliance Assurance (OECA) have developed a process to integrate
oversight of state NPDES permitting and enforcement programs by integrating the SRF and the
PQR at the regional level. In FY2011, a workgroup was formed to revise the PQR process, and
develop guidance for implementation of these reviews. The revised PQR process will continue to
assess how well states implement NPDES program requirements as reflected in permits and
other supporting documents, and shifts responsibility for conducting reviews from EPA
Headquarters to the regional offices. This integrated approach will also provide a better
appreciation of the work and challenges of a state NPDES program by coordinating the SRF and
PQR processes, and allow increased transparency by making the PQR and SRF results publically
available on EPA’s website.
For your information, a Permitting for Environmental Results review of Alabama’s NPDES
program was conducted in 2005. The resulting report is available on the EPA website at:
http://www.epa.gov/npdes/pubs/alabama_final_profile.pdf. The Office of Wastewater
Management, Water Permits Division at EPA Headquarters performed the most recent PQR for
Alabama in November of 2010; a report detailing the findings of that PQR is pending.
Overview of the Process for Reviews
Staff from the Region’s Office of Environmental Accountability (OEA) and the Water Protection
Division will be conducting the SRF/PQR integrated review. As mentioned previously the SRF
will also include a review of the State’s CAA and RCRA programs. An integral part of the
integrated review process is the visit to state agencies. State visits for this review will include:
Discussions between Region 4 and ADEM program managers and staff
Examination of data in EPA and ADEM data systems
Review of selected permitting, inspection and enforcement files and policies
The EPA Region 4 Integrated SRF/PQR Review Team members, their responsibilities, and
contact information are as follows:
Becky Hendrix – SRF Review Coordinator: (404) 562-8342; [email protected]
Mark Fite – CAA SRF Technical Authority (404) 562-9740; [email protected]
Shannon Maher – RCRA SRF Technical Authority (404) 562-9623;
Ron Mikulak – CWA SRF Technical Authority (404) 562-9233;
Alicia Thomas – PQR/Wastewater: (404) 562-8059; [email protected]

46
Sam Sampath – PQR/Pesticides and Industrial Stormwater: (404) 562-9229;
Michael Mitchell – PQR/Municipal Separate Storm Sewer Systems and construction
General Permits: (404) 562-9303; [email protected]
David Phillips – PQR/Industrial Pretreatment: (404) 562-9773; [email protected]
To facilitate the on-site file and permit review and to ensure that we maintain effective and open
communication between our offices, we will be coordinating with program contacts identified by
your management. We will also work closely with Marilyn Elliott as the point of contact for
management review.
Following the SRF and PQR file reviews, which will be coordinated with your staff and are
tentatively scheduled for April and May, Region 4 will summarize findings and
recommendations in a draft report. Your management and staff will be provided an opportunity
to review the draft report and provide a response to the findings, which will be incorporated in
the final report.
Region 4 and ADEM are partners in carrying out the review. If any areas for improvement are
identified, we will work with you to address them in the most constructive manner possible. As
we have discussed, we are committed to conducting these reviews as efficiently as possible and
we will work with your staff to ensure this is accomplished.
Next Steps
After the Data Verification Process is concluded later in March, we will provide ADEM points
of contact with an analysis of the SRF CWA, CAA and RCRA Data Metrics that will be used for
the review, along with a list of selected facility enforcement files to be reviewed. Later in the
fiscal year, the Regional PQR coordinator will provide a list of permits to be reviewed and set a
schedule for the PQR file review. We will continue to work with your staff to coordinate
convenient times for our on-site file reviews.
Should you have questions or wish to discuss this matter in greater detail, please feel free to
contact either of us through Scott Gordon, Associate Director of OEA, at (404) 562-9741.
Sincerely,
/s/ /s/
Nancy Tommelleo James D. Giattina
Acting Regional Counsel and Director of the Director
Office of Environmental Accountability Water Protection Division

47
Transmittal of DMA and File Selections
CAA To: Christy Monk and RFH at ADEM Fri 4/5/2013
As promised in our kickoff letter, I’m forwarding the following SRF Round 3 materials for your
review:
(1) EPA’s Data Metrics Analysis (DMA) which is our analysis of Alabama’s CAA SRF data
metrics (using the FY2012 "frozen data" on EPA's OTIS website);
(2) the files that have been selected for the CAA SRF file review (35 total);
(3) the file selection logic explaining the process used to select the files.
The CAA SRF schedule is as follows:
April 29 @ 11:30 Central – Opening Conference
April 29 – May 2 - File Review
May 2 @ 10 Central – Closing Conference
As with previous SRF reviews, we ask that ADEM provide the following types of paper or
electronic records for the selected files for the review year (Federal FY12): current permit,
inspection reports, notices of violation, enforcement documents and related correspondence,
penalty calculations and payment documentation, stack test reports, annual and semi-annual
compliance reports, etc.
If you have any questions about the attached materials or the above schedule, please feel free to
email or call. I will be out on Spring Break vacation next week, but will respond when I return.
I look forward to working with you over the next several months on this Round 3 review.
Thanks!
Mark J. Fite Acting Chief, Analysis Section Enforcement & Compliance Planning & Analysis Branch Office of Environmental Accountability U.S. EPA Region 4 61 Forsyth St., SW Atlanta, GA 30303 [email protected] 404.562.9740

48
RCRA March 11, 2013
Clethes Stallworth ([email protected])
Cc: [email protected]; [email protected]; [email protected]; [email protected]
[email protected]; [email protected], [email protected],
[email protected], [email protected]
Hi Clethes,
After discussing schedules internally here at EPA, I think we might have a tentative roll-out for
the RCRA portion of the SRF. My understanding is that the ADEM SRF kick-off letter is being
prepared, so ADEM should receive that before long. Here is the tentative RCRA schedule that
we’ve pulled together:
March 14 – FY2012 data is “frozen” in EPA’s national data systems (and will be available for review
on March 18). This is the data will be used in the SRF Data Metric Analysis.
March 29 – By this date, I plan to send you the initial RCRA SRF Data Metric Analysis and list of
facilities for the RCRA File Review;
April 1-26 – EPA will review the files remotely using ADEM’s impressive eFile system;
Meeting during April 29 week – Paula Whiting and I propose to meet in person to wrap up any
questions from the file review and conduct the exit conference. We are thinking that the meeting
should last the afternoon of one day, and morning of the next. We will wait to hear from you on
what the best dates are for this meeting.
If this looks like a compressed time frame, it’s due to in large part to conflicting schedules. Paula
and I are trying to wrap up most of the SRF field work in April, since there are only a handful of
days were both Paula and I are in the office in May. If the week of April 29 doesn’t work for an
onsite visit, let me know and we can start looking for a couple of days in May as an alternative.
If there are any questions or concerns with any part of the proposed schedule, please don’t
hesitate to contact me. Looking forward to working with you.
Thanks, Shannon Maher
U.S. Environmental Protection Agency – Region 4 │ Office of Environmental Accountability
61 Forsyth Street, SW │ Atlanta, GA 30303
Voice: 404-562-9623 │ Fax: 404-562-9487 │ Email: [email protected]

49
March 29, 2013
[email protected]; [email protected]; [email protected];
[email protected]; [email protected]
Richard Hulcher ([email protected])
Hi everyone,
As outlined in a previous email, I’m forwarding the following SRF Round 3 materials
for your review:
(1) EPA’s analysis of Alabama’s RCRA SRF data metrics (using the FY2012 "frozen
data" on EPA's OTIS website);
(2) the files that have been selected for the RCRA SRF file review (35 total);
(3) the file selection logic explaining the process used to select the files.
From here, the RCRA SRF schedule looks like this:
April 1-26 (File Review) – During the month of April, Paula Whiting (the EPA
RCRA Alabama State Coordinator) and I will meet periodically to review the RCRA
SRF files using ADEM’s eFile system. If questions about the facilities come up
during the file review, do we continue to contact Clethes Stallworth directly?
May 1 & 2 (Onsite Visit) – We plan to arrive about 1:00 pm (CST) the afternoon
of May 1, 2013. That afternoon we plan to wrap up any questions on the file review
and data metric analysis. If schedules permit, we would like to conduct the SRF
exit conference at 9:00 am (CST) Thursday morning, May 2.
If there are any questions about the attached materials or the above schedule,
please let me know. I look forward to working with you over the next couple of
months.
Thanks, Shannon Maher
U.S. Environmental Protection Agency – Region 4 │ Office of Environmental
Accountability
61 Forsyth Street, SW │ Atlanta, GA 30303
Voice: 404-562-9623 │ Fax: 404-562-9487 │ Email: [email protected]

50
CWA Fri 4/12/2013 3:45 PM
Poolos, Ed
Hulcher, Richard
Smart, Daphne Y
As noted in the attached kickoff letter, I am forwarding the following State Review Framework
(SRF) Round 3 materials for your review:
(1) EPA’s Data Metrics Analysis (DMA) which is our analysis of Alabama’s CWA SRF
data metrics (using the FY2012 "frozen data" on EPA's OTIS website);
(2) the files that have been selected for the CWA SRF file review (40 total);
(3) the file selection logic explaining the process used to select the files.
The CWA SRF schedule is as follows:
May 13th at 9:00 a.m. Central Time – Opening Conference
May 13th through May 17th - File Review
May 17th at 10:00 a.m. Central Time – Closing Conference
As with previous SRF reviews, we ask that ADEM provide the following types of paper or
electronic records for the selected files for the review year (Federal FY12): current permit,
inspection reports, notices of violation, enforcement documents and related correspondence,
penalty calculations and payment
documentation, etc.
If you have any questions about the attached materials or the above schedule, please feel free to
email or call.
I look forward to working with you over the next several months on this Round 3 SRF review.
Thanks - Ron
Ronald J. Mikulak
Water Technical Authority
Office of Environmental Accountability
EPA - Region 4
Phone #: 404-562-9233
e-mail: [email protected]

51
Other communication with State
June 3, 2013 Email to [email protected] Marilyn Elliott, ADEM From: [email protected]
Marilyn,
As we begin drafting the Round 3 State Review Framework report, we are asking
for your input to the Program Overview section of the report which deals with
ADEM’s organization, resources, staffing and training, data reporting systems and
architecture, and major state priorities and accomplishments. This information will
be incorporated in the report as Appendix E. We would appreciate the information
in 30 days. It can be sent electronically to Becky Hendrix
If you have any questions, please give me a call at 404-562-9054.
Thanks,
Kelly
July 26, 2013 Marilyn, Just wanted to follow-up on a couple SRF related items. One is the penalty calculation issue. Did you get a chance to talk with your RCRA and CAA folks about their documentation of economic benefit and the documentation between the initial and final penalties? Before we finalize our language for those two Elements of the report, I wanted to be sure we had all the documents available for review. Secondly, if you could fill out the State background information in the attachment by August 15th and return it to Becky Hendrix, that would be very helpful. Please give me a call if you have any questions or want to discuss further. Thanks, Kelly

STATE REVIEW FRAMEWORK
Jefferson County, Alabama
Clean Air Act
Implementation in Federal Fiscal Year 2014
U.S. Environmental Protection Agency
Region 4, Atlanta
Final Report
December 19, 2016

(Page left intentionally blank)

Executive Summary
Introduction
EPA Region 4 enforcement staff conducted a State Review Framework (SRF) enforcement
program oversight review of the Jefferson County Department of Health (JCDH).
EPA bases SRF findings on data and file review metrics, and conversations with program
management and staff. EPA will track recommended actions from the review in the SRF Tracker
and publish reports and recommendations on EPA’s ECHO web site.
Areas of Strong Performance
JCDH made accurate compliance determinations for both HPV and non-HPV violations.
Enforcement actions bring sources back into compliance within a specified timeframe.
Priority Issues to Address
The following are the top-priority issues affecting the local program’s performance:
JCDH needs to improve the accuracy of data reported into the National Data System
(formerly Air Facility Subsystem (AFS), but now ICIS-Air). Data discrepancies were
identified in 65% of the files reviewed.
Most Significant CAA Stationary Source Program Issues
The accuracy of enforcement and compliance data entered by JCDH in AFS needs
improvement. The recommendation for improvement is for JCDH to document efforts to
identify and address the causes of inaccurate Minimum Data Requirements (MDR)
reporting and make corrections to existing data to address discrepancies identified by
EPA. EPA will monitor progress through the annual Data Metrics Analysis (DMA) and
other periodic data reviews.

Table of Contents
I. Background on the State Review Framework ........................................................................ 4
II. SRF Review Process................................................................................................................. 5
III. SRF Findings .......................................................................................................................... 6
Clean Air Act Findings ............................................................................................................................. 7

State Review Framework Report | Jefferson County, Alabama | Page 4
I. Background on the State Review Framework
The State Review Framework (SRF) is designed to ensure that EPA conducts nationally
consistent oversight. It reviews the following local, state, and EPA compliance and enforcement
programs:
Clean Water Act National Pollutant Discharge Elimination System
Clean Air Act Stationary Sources (Title V)
Resource Conservation and Recovery Act Subtitle C
Reviews cover:
Data — completeness, accuracy, and timeliness of data entry into national data systems
Inspections — meeting inspection and coverage commitments, inspection report quality,
and report timeliness
Violations — identification of violations, determination of significant noncompliance
(SNC) for the CWA and RCRA programs and high priority violators (HPV) for the CAA
program, and accuracy of compliance determinations
Enforcement — timeliness and appropriateness, returning facilities to compliance
Penalties — calculation including gravity and economic benefit components, assessment,
and collection
EPA conducts SRF reviews in three phases:
Analyzing information from the national data systems in the form of data metrics
Reviewing facility files and compiling file metrics
Development of findings and recommendations
EPA builds consultation into the SRF to ensure that EPA and the state or local program
understand the causes of issues and agree, to the degree possible, on actions needed to address
them. SRF reports capture the agreements developed during the review process in order to
facilitate program improvements. EPA also uses the information in the reports to develop a better
understanding of enforcement and compliance nationwide, and to identify issues that require a
national response. Reports provide factual information. They do not include determinations of
overall program adequacy, nor are they used to compare or rank state and local programs.
Each state’s programs are reviewed once every five years. Local programs are reviewed less
frequently, at the discretion of the EPA Regional office. The first round of SRF reviews began in
FY 2004, and the second round began in FY 2009. The third round of reviews began in FY 2013
and will continue through 2017.

State Review Framework Report | Jefferson County, Alabama | Page 5
II. SRF Review Process
Review period: 2014
Key dates: June 15, 2015, letter sent to Local program kicking off the Round 3 review
July 14 – 16, 2015, on-site file review for CAA
Local Program and EPA key contacts for review:
Jefferson County EPA Region 4
SRF Coordinator Corey Masuca Kelly Sisario, OEC
CAA Jason Howanitz Mark Fite, OEC
Stephen Rieck, APTMD

State Review Framework Report | Jefferson County, Alabama | Page 6
III. SRF Findings
Findings represent EPA’s conclusions regarding state or local program performance and are
based on observations made during the data and/or file reviews and may also be informed by:
Annual data metric reviews conducted since the program’s last SRF review
Follow-up conversations with agency personnel
Review of previous SRF reports, Memoranda of Agreement, or other data sources
Additional information collected to determine an issue’s severity and root causes
There are three categories of findings:
Meets or Exceeds Expectations: The SRF was established to define a base level or floor for
enforcement program performance. This rating describes a situation where the base level is met
and no performance deficiency is identified, or a state or local performs above national program
expectations.
Area for State1 Attention: An activity, process, or policy that one or more SRF metrics show as
a minor problem. Where appropriate, the state or local should correct the issue without additional
EPA oversight. EPA may make recommendations to improve performance, but it will not
monitor these recommendations for completion between SRF reviews. These areas are not
highlighted as significant in an executive summary.
Area for State Improvement: An activity, process, or policy that one or more SRF metrics
show as a significant problem that the agency is required to address. Recommendations should
address root causes. These recommendations must have well-defined timelines and milestones
for completion, and EPA will monitor them for completion between SRF reviews in the SRF
Tracker.
Whenever a metric indicates a major performance issue, EPA will write up a finding of Area for
State Improvement, regardless of other metric values pertaining to a particular element.
The relevant SRF metrics are listed within each finding. The following information is provided
for each metric:
Metric ID Number and Description: The metric’s SRF identification number and a
description of what the metric measures.
Natl Goal: The national goal, if applicable, of the metric, or the CMS commitment that
the state or local has made.
Natl Avg: The national average across all states, territories, and the District of Columbia.
State N: For metrics expressed as percentages, the numerator.
State D: The denominator.
State % or #: The percentage, or if the metric is expressed as a whole number, the count.
1 Note that EPA uses a national template for producing consistent reports throughout the country. References to
“State” performance or responses throughout the template should be interpreted to apply to the Local Program.

State Review Framework Report | Jefferson County, Alabama | Page 7
Clean Air Act Findings
CAA Element 1 — Data
Finding 1-1 Meets or Exceeds Expectations
Summary MDRs were entered timely into AFS, EPA’s national data system for air
enforcement and compliance information.
Explanation Data Metric 3a2 (0) indicated there were no untimely HPV
determinations.
Data Metric 3b1 indicated that 90.5% of compliance monitoring MDRs
(38 of 42) were reported timely into AFS.
Data Metric 3b2 indicated that JCDH entered 100% (18 of 18) of stack
tests into AFS within 120 days. However, EPA notes that no results were
reported into AFS. This issue will be addressed under Finding 1-2.
Data Metric 3b3 (100%) indicated that the one reported enforcement
related MDR was entered into AFS within 60 days.
Relevant metrics Metric ID Number and Description
Natl
Goal
Natl
Avg
State
N
State
D
State
% or #
3a2 Untimely entry of HPV determinations 0 0
3b1 Timely reporting of compliance monitoring
MDRs 100% 83.3% 38 42 90.5%
3b2 Timely reporting of stack test MDRs 100% 80.8% 18 18 100%
3b3 Timely reporting of enforcement MDRs 100% 77.9% 1 1 100%
State response
Recommendation

State Review Framework Report | Jefferson County, Alabama | Page 8
CAA Element 1 — Data
Finding 1-2 Area for State Improvement
Summary The accuracy of MDR data reported by JCDH into AFS needs
improvement. Discrepancies between the files and AFS were identified
in 65% of the files reviewed.
Explanation Metric 2b indicated that only 35% (7 of 20) of the files reviewed
reflected accurate entry of all MDRs into AFS. The remaining 13 files
had one or more discrepancies between information in the files and data
entered into AFS. The majority of inaccuracies related to full compliance
evaluations (FCEs) missing in AFS (9 sources). In addition, no stack test
results were reflected in AFS. Two sources had missing or inaccurate air
programs or subparts for Maximum Achievable Control Technology
(MACT) or other regulations in AFS. Several other miscellaneous
inaccuracies were noted. Since the file review, JCDH has identified the
causes of the inaccurate or missing data, addressed those issues, and
made needed corrections. In particular, FCEs and stack test results are
now being reported into ICIS-Air. JCDH is also working to address
Compliance Monitoring Strategy (CMS) corrections in ICIS-Air which
affect their inspection coverage metrics under 5a and 5b.
Relevant metrics Metric ID Number and Description
Natl
Goal
Natl
Avg
State
N
State
D
State
% or #
2b Accurate MDR data in AFS 100% 7 20 35%
State response Regarding the discrepancies with the FCEs, JCDH was able to identify
cause and has since corrected it. With regards to other issues with
ICIS/AFS the JCDH has worked extensively with EPA contractors on
trying to get the system communicating correctly for a few years. JCDH
has successfully updated its software and is reporting all of the required
elements automatically every month to ICIS. JCDH will continue to
manually enter NOVs on ICIS to ensure proper entry. JCDH believes a
review of this by EPA would satisfy the documentation requirement
since this it is an automatic monthly push now.
Recommendation JCDH has identified the causes of and made significant progress in
addressing the discrepancies EPA identified during the file review.
These changes are expected to ensure that in the future, MDRs are
accurately entered into ICIS-Air. If by March 31, 2017, EPA’s review of
the FY16 frozen data determines that JCDH’s efforts appear to be
adequate to meet the national goal, the recommendation will be
considered complete.

State Review Framework Report | Jefferson County, Alabama | Page 9
CAA Element 2 — Inspections
Finding 2-1 Meets or Exceeds Expectations
Summary FCEs and CMRs included all required elements, including the review of
Title V ACCs.
Explanation Metric 5e indicates that 31 of 34 (91.2%) Title V ACCs were reviewed
by the local program and recorded in AFS.
Metric 6a indicates that all 16 FCEs reviewed (100%) included the seven
elements required by the Clean Air Act Stationary Source Compliance
Monitoring Strategy (CMS Guidance).
Metric 6b indicates that 17 of 18 (94.4%) CMRs included all seven
elements required by the CMS Guidance.
Relevant metrics Metric ID Number and Description
Natl
Goal
Natl
Avg
State
N
State
D
State
% or #
5e Review of Title V annual compliance
certifications 100% 78.8% 31 34 91.2%
6a Documentation of FCE elements 100% 16 16 100%
6b Compliance monitoring reports reviewed
that provide sufficient documentation to
determine facility compliance 100% 17 18 94.4%
State response
Recommendation

State Review Framework Report | Jefferson County, Alabama | Page 10
CAA Element 2 — Inspections
Finding 2-2 Area for State Attention
Summary Although JCDH reported an insufficient number of FCEs in AFS to meet
the minimum inspection frequencies required in the CMS Guidance, the
file review indicated the FCEs were conducted.
Explanation Metrics 5a and 5b (24% and 5.7%, respectively) indicated that JCDH did
not ensure that each major source was inspected at least once every 2
years, and each SM-80 source was inspected at least once every 5 years,
in accordance with EPA’s CMS Guidance. Because of a concern that this
may have been a data problem rather than a coverage issue, EPA
selected 6 supplemental files for review which were slated to receive an
FCE based on the CMS plan, but no FCE was shown in AFS. This
supplemental review confirmed that each of these sources had received
an FCE, but inspectors had not properly entered the inspection
information into the Local database. JCDH addressed this issue with
staff during the file review. In addition, FY15 frozen data and FY16
production data show significant improvements in inspection coverage.
Since this is primarily a data issue, EPA will evaluate progress through
implementation of the recommendation for finding 1-2.
Relevant metrics Metric ID Number and Description
Natl
Goal
Natl
Avg
State
N
State
D
State
% or #
5a FCE coverage: majors and mega-sites 100% 85.7% 6 25 24.0%
5b FCE coverage: SM-80s 100% 91.7% 3 53 5.7%
State response JCDH will continue to work with EPA Region IV to ensure proper data
is received.
Recommendation

State Review Framework Report | Jefferson County, Alabama | Page 11
CAA Element 3 — Violations
Finding 3-1 Meets or Exceeds Expectations
Summary JCDH made accurate compliance determinations for both HPV and non-
HPV violations.
Explanation Metric 7a indicated that JCDH made accurate compliance determinations
in 18 of 20 files reviewed (90%).
Metric 8a indicated that the HPV discovery rate for majors (0%) was
below the national average of 3.1%. A low HPV discovery rate is not
unusual for small local programs.
Metric 8c confirmed that JCDH’s HPV determinations were accurate for
the 2 files reviewed with violations identified (100%).
Relevant metrics Metric ID Number and Description
Natl
Goal
Natl
Avg
State
N
State
D
State
% or #
7a Accuracy of compliance determinations 100% 18 20 90%
8a HPV discovery rate at majors 3.1% 0 35 0%
8c Accuracy of HPV determinations 100% 2 2 100%
State response
Recommendation

State Review Framework Report | Jefferson County, Alabama | Page 12
CAA Element 4 — Enforcement
Finding 4-1 Meets or Exceeds Expectations
Summary Enforcement actions bring sources back into compliance within a
specified timeframe, and HPVs are addressed in a timely and appropriate
manner.
Explanation Metric 9a indicated that all formal enforcement actions reviewed brought
sources back into compliance through corrective actions in the order, or
compliance was achieved prior to issuance of the order.
Metric 10a indicated that the one HPV concluded in the review year
(FY2014) was addressed in 270 days. In addition, Metric 10b indicated
that appropriate enforcement action was taken to address all HPVs.
Relevant metrics Metric ID Number and Description
Natl
Goal
Natl
Avg
State
N
State
D
State
% or #
9a Formal enforcement responses that include
required corrective action that will return the
facility to compliance in a specified timeframe
100% 2 2 100%
10a Timely action taken to address HPVs 73.2% 1 1 100%
10b Appropriate enforcement responses for
HPVs 100% 1 1 100%
State response
Recommendation

State Review Framework Report | Jefferson County, Alabama | Page 13
CAA Element 5 — Penalties
Finding 5-1 Meets or Exceeds Expectations
Summary JCDH considered gravity and economic benefit when calculating
penalties; the collection of penalties and any differences between initial
and final penalty assessments was also documented.
Explanation Metric 11a indicated that JCDH considered gravity and economic benefit
in both penalty calculations reviewed (100%). For both penalty actions
reviewed, JCDH determined that no economic benefit was derived from
the violation. However, EPA recommends that JCDH document a more
detailed rationale when no economic benefit is assessed.
Metric 12a indicated that both penalty calculations reviewed (100%)
documented any difference between the initial and the final penalty
assessed. Finally, Metric 12b confirmed that documentation of all
penalty payments made by sources was included in the file.
Relevant metrics Metric ID Number and Description
Natl
Goal
Natl
Avg
State
N
State
D
State
% or #
11a Penalty calculations include gravity and
economic benefit 100% 2 2 100%
12a Documentation on difference between
initial and final penalty 100% 2 2 100%
12b Penalties collected 100% 2 2 100%
State response
Recommendation