state park economic impact study
TRANSCRIPT

8/3/2019 State Park Economic Impact Study
http://slidepdf.com/reader/full/state-park-economic-impact-study 1/72
1
The Economic Impact of
State Parks, Forests and Natural Resources under the
Management of Department of Environmental Protection
June 15, 2011
Peter Gunther
Kathryn Parr
Marcello Graziano
Fred Carstensen
Connecticut Center for Economic AnalysisUniversity of Connecticut
Storrs, CT 06269
Prof. Fred Carstensen, Director

8/3/2019 State Park Economic Impact Study
http://slidepdf.com/reader/full/state-park-economic-impact-study 2/72
2
Executive Summary
The parks and state forests that the Department of Environmental Protection (DEP) manages deliver
significant economic benefit to Connecticut residents and park visitors. In 2010, resident and
nonresident visitors to Connecticut’s 107 State Parks and 32 Forests spent 8.5 million visitor-days
touring within the state. Of those days, at least 4.6 million days were spent partially at for-fee parks
and forests managed by DEP. DEP activities generate the following direct and indirect economic
impacts:
8.8 thousand jobs currently, that in the absence of DEP managed parks and forests and
activities would be reduced to 6.7 thousand in 2020 as personnel found alternative
employment;
$343 million in personal income growing in current dollars to $595 million in 2020;
$253 in personal disposable income, that generates choices for citizens, increasing to $471
million by 2020; and,
Net present value in state revenues over expenditures of $30 million in constant dollars.
In addition, owners of single residences in Connecticut derived amenity values of $270 million
annually from overlooking DEP managed venues. If not preserved, alienation of any of that green
space from pestilence, such as Western North America has experienced from mountain spruce
budworm, or harvesting of the forests and industrialization would erode those benefits.
In establishing the net benefits of DEP services, CCEA estimated the total number of visitor days, the
value that these visitors placed on various key activities net of fees paid (measured as consumer
surplus), the value adjacent property owners derived from their location, and the aggregate
expenditures inclusive of direct, indirect and induced expenditures and employment that result from
these activities. These benefits are then aggregated into annual estimated benefits derived from DEP
managed state venues1. As noted above, both the economic impact of expenditures and the
economic value people derive from the parks, vastly exceeds the annual cost to the state of
husbanding nature’s assets for Connecticut citizens and out-of-state visitors.
In 2010 visitors to these venues spent an estimated $544 million in general tourism activities in
Connecticut. In addition, 189,000 sportspersons, holding 293,600 licenses and permits issued by DEP,
spent additional funds to pursue their specific sporting activities:
o $264 million for angling, of which 90% came from Connecticut residents;
o
$100 million for hunting, of which $95.1 million came from Connecticut residents;o $36.8 million for recreational boating, attributed to DEP-managed boat launches and
training activities, net of anglers’ boating expenditures;
o $26.2 million for skiing and attending educational and other venues;
1 “Venues,” is used usually herein to refer to state parks and forests as well as those areas outside of the parks
governed by DEP issued licenses for hunting, fishing, boating and any commutations and permutations thereof.
Occasionally, the context will limited its meaning to state parks and forests.
8/3/2019 State Park Economic Impact Study
http://slidepdf.com/reader/full/state-park-economic-impact-study 3/72
3
o Participation in other sports located in the parks and forests or to attend them.
Visitor fees at the parks and forests, including late day visitors, were in the $3.0 to $3.3 million dollar
range from 2005 to 2009. Increasing rates in 2010 set the stage for an increase to $5.2 million in future
years. These same visitors are estimated to have spent $94 million in Connecticut. DEP charges
visitors: entrance, parking, and camping fees, cabin and pavilion rents, ice and firewood sales andrelated sales taxes. These revenues all flow to Connecticut’s General Fund.
Recreational activities also generated licensing and permit fees as well as training and educational
revenues. 2010 revenues generated from DEP licensing and permitting of key activities included
angling ($3.8 million), hunting ($2.3 million), and combined hunting and angling licenses ($1.6 million).
Recreational boat training, testing, and licensing generated a further ($3.2 million.)2. Including
camping and all activity fees, DEP collected $18.3 million from fees paid by participants and attracted
$5.4 million in federal transfers from the federal Sport Fish Restoration (SFR) and Wildlife Restoration
(WR) programs. These direct revenues indicate that Connecticut residents, nonresidents and the
Federal Government valued DEP managed state venues. Before taking account of a one-time $1.1
million credit program to assist adjusting to the higher fees, direct revenues and transfers in 2010
covered all but $2.6 million of Connecticut state expenses of $26.3 million including parks, forest, and
hatchery operations. Property taxes stemming from vistas dependent on DEP managed venues added
a $4.2 million to state revenues, more than sufficient to cover DEP operating and capital expenditures.
In addition, indirect revenues from other taxable tourist and sporting expenditures further
contributed to state revenues.
The well known downward slope of demand curves for each activity implies that all but the least
enthusiastic person undertaking each activity derives quality of life benefits over and above expenses
incurred, what economists refer to as “Consumer surplus”. CCEA has estimated consumer surpluses
accruing to Connecticut citizens by major activities:
o Camping (S124.1 million)
o Hunting ($17.8 million)
o Inland Angling ($67.4 million)
o Marine Angling ($36.9 million)
o Swimming at four parks ($570,000).
In addition to the $246.9 million accruing to residents in consumer surplus, out-of-state visitors
undertaking these activities derived a further $25.1 million in consumer surplus, led by campers at
$18.4 million. Total estimated consumer surplus for campers at DEP venues is 26% of Connecticuttourism expenditures made by them.3 In-state estimates of consumer surplus remain modest due to
the close proximity of venues to the population. CCEA did not extrapolate its consumer surplus
2These revenues were partially offset on a one-time credit totaling about $1.14 million.
3Charles H. Strauss and Lord, Bruce E. A. Case Study The economic impacts of a heritage tourism system, Journal of
Retailing and Consumer Services 8 (2001) 199}204.

8/3/2019 State Park Economic Impact Study
http://slidepdf.com/reader/full/state-park-economic-impact-study 4/72
4
estimates for people using these parks for alternative purposes or accessing fee-free parks, such as
non-developed ones.
Consumer surpluses in addition to their expenditures suggest that, in recent years, visitors to DEP
managed venues derived more than $1.25 billion dollars in annual benefits. CCEA’s very conservative
approach to estimating consumer surpluses underlines the significance of these estimates.
Another source of benefit is the value that owners of homes adjacent to the parks and forest derive.
Connecticut residents overlooking the parks from single family dwellings realized annual amenity
benefits most days of the year of a further $258 to $309 million. Positive attributes of these
residences, captured in the assessed value of their properties, generated $3.1 to $5.4 million annually
in government revenues, but did not account for the value of the vistas of overlooking DEP managed
parks and forests. The expected long-term net present value of this possible revenue stream to the
state discounted at 5% over 20 years is $390.2 to $679.7 million in 2010 dollars. The net present value
may also be viewed as placing a capital value on the assets that DEP maintains in its management of
Connecticut parks and forests. More fully assessing amenity values, from their currently unassessed
status on 12-13% of properties overlooking green spaces, would significantly increase property tax
revenues.
Because DEP operations and related government revenues already exist in the economy, the method
for assessing their economic impact is to withdraw those activities. That is, to assess the impacts of
their hypothetical immediate cessation in 2012, and then to project longer term economic
adjustments and reactions. The resulting differences from the current case represent economic
impacts of DEP-managed venues in Connecticut. With closure of all DEP-managed facilities and
elimination of all public access to DEP-managed forest and park lands, the resulting impacts would
mean losses in employment and incomes, as well as losses in tax revenues. As noted at the outset of
this Executive Summary, the harshness of such losses in the near term is stark, but the dynamic
elements of the economy which REMI captures adjust to the loss of those resources. Over time, the
economy adjusts and ameliorates, to a degree, economic impacts through emigration and some
movement into alternative jobs. Rather than depict these losses as negatives, this report treats these
as the positive impacts that DEP operations have on the Connecticut economy.

8/3/2019 State Park Economic Impact Study
http://slidepdf.com/reader/full/state-park-economic-impact-study 5/72
5
Table of Contents
1. Introduction .......................................................................................................................................... 8
1.1 Purpose ............................................................................................................................................... 8
1.2 Benefits ............................................................................................................................................... 9
2. Tourism Activities ................................................................................................................................ 10
2.1 Introduction ...................................................................................................................................... 10
2.2 DEP Tourism Revenue Sources ......................................................................................................... 10
2.3 Park Related Tourism Expenditures .................................................................................................. 12
2.4 Extrapolations ................................................................................................................................... 14
2.4.1 Connecticut Expenditures by Visitors to State Parks ................................................................. 142.4.2 Expenditures in Connecticut by Visitors to State Forests .......................................................... 15
2.4.3 Visitor Expenditures ................................................................................................................... 17
2.5 Conclusions ....................................................................................................................................... 17
3. Other Direct Activities ......................................................................................................................... 17
3.1 Introduction and Overview ............................................................................................................... 17
3.2 Hunting .............................................................................................................................................. 19
3.3 Fishing ............................................................................................................................................... 22
3.4 Recreational Boaters ......................................................................................................................... 26
3.4.1 Introduction ............................................................................................................................... 26
3.4.2 Power Boats ............................................................................................................................... 27
3.4.3 Human Powered Boats .............................................................................................................. 27
3.4.4 Boating Conclusions ................................................................................................................... 27
3.5 Other DEP Activities .......................................................................................................................... 28
3.5.1 Introduction ............................................................................................................................... 28
3.5.2 Mohawk Mountain Ski Area....................................................................................................... 283.5.3 Harkness Memorial State Park ................................................................................................... 29
3.5.4 Enhanced Education .................................................................................................................. 31
3.6 Conclusions ....................................................................................................................................... 31
4. Consumer Surpluses............................................................................................................................ 31
4.1 Introduction ...................................................................................................................................... 31

8/3/2019 State Park Economic Impact Study
http://slidepdf.com/reader/full/state-park-economic-impact-study 6/72
6
4.2 Consumer Surplus ............................................................................................................................. 32
4.3 Camping ............................................................................................................................................ 33
4.4 Fishing ............................................................................................................................................... 34
4.5 Hunting .............................................................................................................................................. 35
4.6 Day Trippers ...................................................................................................................................... 36
5.7 Conclusions ....................................................................................................................................... 37
5. Amenity Benefits ..................................................................................................................................... 38
5.1 Introduction ...................................................................................................................................... 38
5.2 Number of Houses Overlooking Parks and State Forests ................................................................. 38
5.3 Assessing “Green Space Bonus” for Residences Overlooking DEP Parks and Forests ...................... 39
5.4 Amenity Estimates ............................................................................................................................ 41
5.5 Fiscal Implications ............................................................................................................................. 43
5.6 Conclusions ....................................................................................................................................... 43
6. Total Expenditure Impacts .................................................................................................................. 44
6.1 Introduction ...................................................................................................................................... 44
6.2 Counterfactual .................................................................................................................................. 44
6.3 Direct Expenditures Dependent on DEP Park and Forests Related Activities................................... 45
6.4 Economic Impacts ............................................................................................................................. 47
6.4.1 Introduction ............................................................................................................................... 47
6.4.2 Population; DEP and the Quality of Life Matters ....................................................................... 48
6.4.3 Jobs ............................................................................................................................................ 49
6.4.4 Current Personal Income ........................................................................................................... 51
6.4.5 Personal Disposable Income ...................................................................................................... 52
6.4.6 Fiscal Impacts ............................................................................................................................. 53
6.5 Conclusions ........................................................................................................................................... 53
7. Conclusions ......................................................................................................................................... 53
Appendix A: Data ........................................................................................................................................ 56
A-1. Background ...................................................................................................................................... 56
A-2. Melding the Data Sets ..................................................................................................................... 56
Appendix B: Campsites ............................................................................................................................... 58
Appendix C: Technical Considerations: Elasticities and Consumer Surplus ............................................... 59
C.1 Consumers Surplus Definitions ......................................................................................................... 59

8/3/2019 State Park Economic Impact Study
http://slidepdf.com/reader/full/state-park-economic-impact-study 7/72
7
C.2 Consumers Surplus Estimates ........................................................................................................... 60
C.3 Statistical Findings ............................................................................................................................ 63
C.4 Estimating Elasticities and Travel Time for Late Day Trippers .......................................................... 64
C.5 Literature .......................................................................................................................................... 67
Appendix D: Reasons for Excluding Some Residential Sales from Fair Market Prices ............................... 68
Appendix E: Bibliography ....................................................................................................................... 70
E-1: Texts ................................................................................................................................................. 70
U.S. Fish and Wildlife Service, 2006 National Survey of Fishing Hunting and Wildlife-Associated
Recreation, Connecticut E-2: Databases ................................................................................................. 71
E-2: Databases ......................................................................................................................................... 72

8/3/2019 State Park Economic Impact Study
http://slidepdf.com/reader/full/state-park-economic-impact-study 8/72
8
1. Introduction
1.1 PurposeThis report documents the Connecticut Center for Economic Analysis (CCEA) analysis of the economic
impact of parks, forests, and outdoor recreation licensing operations of the Connecticut Department of
Environmental Protection (DEP). This research investigated general tourism as well as specific key
activities such as camping, angling, hunting, swimming, recreational marine, education, and
accommodation activities at the Harkness Memorial State Park. Aside from attendance data, this study
does not cover other related activities such as hiking, bird watching, biking, horse-back riding, etc. DEP
collects entrance and various activity fees at 32 parks; it records the number of park visitors at 43 sites
out of the 107 parks and 32 Connecticut state forests under its management.
CCEA’s ability to project benefits from DEP data is most substantial when based on DEP data sets for the
32 parks with visitor days and activity fees paid by a large proportion of attendees, represented by the
center of the circles in Chart 1.1.1. Fees cover both venue access and some specific activities. This core
data set also includes park users who may be counted but avoid fees because they arrive during off-
hours or out-of-season. An additional component of this core data set includes zip codes for hunters,
anglers, boaters and campers. The middle-ring, checker-board surface represents park visitors to 12
sites where DEP maintains counts but does not charge for its services. The external ring, polka-dot
surface covers the remaining 63 parks where access may occur but is not measured. Analysis of the two
outer rings required developing assumptions with which to estimate annual visitor activities, and
tourism expenditures in Connecticut.
Chart 1.1.1 Data Quality and Extrapolations
Users, activity fees, origin, & destination
Counts only
Locale and size of development parks
Not included in Chart 1.1.1 are the 32 state forests, where attendance data is collected at twelve and
fees charged at four, to form quite a small database. In this research, the park and forest venues are
treated separately as are the Harkness Memorial State Park and DEP’s three education venues.

8/3/2019 State Park Economic Impact Study
http://slidepdf.com/reader/full/state-park-economic-impact-study 9/72
9
Recreational boaters also benefit from 112 fee-free boat launch sites throughout the state, training and
licensing.
CCEA has calculated the direct economic benefit of visitors to DEP-managed facilities from both
recorded and extrapolated data. The database differentiated major visitor activities by campers,
hunters, anglers, and swimmers, in order to derive consumer surpluses for each group, providing anopportunity to allocate direct economic impacts for each user group.4 CCEA has exercised a fair amount
of caution in developing its extrapolations, to avoid exaggerating the economic impacts of DEP-operated
state parks and forests. In addition, CCEA has assessed the amenity benefits accruing to owners of
properties overlooking and adjacent to DEP-managed properties.
The next chapter focuses on DEP operations at State Parks and State Forests as they cater to residents
and attract nonresidents to the state, particularly campers. The third chapter examines benefits
accruing within the state from specific recreational activities and other DEP operations including marine
training seminars, leasing of Mohawk Mountain Ski Area, DEP operations at the Harkness Memorial
State Park, and several educational venues. The next two chapters concentrate on additional social
benefits with the fourth chapter covering consumer surpluses accruing to visitors and the fifth, amenity
benefits accruing to property owners who overlook parks and forest green spaces via higher residential
sales prices and the related impact on property assessments and taxes and therefore government
revenues. The penultimate chapter utilizes Regional Economic Analysis Inc’s Model “REMI” to assess the
total impacts and fiscal implications. Direct and indirect impacts on state government revenues are also
included within the REMI analysis. The final chapter contains conclusions.
1.2 Benefits
Benefits from DEP’s State Park and Forest operations accrue to Connecticut from resident tourists
staying within the state to camp and nonresidents who undertake other out-door recreational activities
including many athletic endeavours offered by state parks and forests. In addition, parks have been
designed to appeal to tourists interested in history from ancient dinosaurs through to more up-to-date
navy facilities.
In addition, residents overlooking vistas provided by state parks and forests reap amenity benefits. Such
benefits normally occur throughout the year and are captured through higher land prices for residential
homes. As such, the amenity benefits may be partially monetized through higher assessed and selling
values that add to the Connecticut’s property tax base. These additions to the tax base create revenue
flows for state and local governments. A second major source of amenity benefits is the increasedsafety stemming from training and licensing of boaters resulting in reduced boating accidents5.
4Sun, Ya-Yen, Wong, Kam-Fai, and Lai, Hsein-Chung, Statistical properties and survey design of tourism
expenditures using segmentation, Tourism Economics, 2010, 16(4), 807-832.5
In 2010, 150,000 recreational boaters resulted in 10 deaths in Connecticut.

8/3/2019 State Park Economic Impact Study
http://slidepdf.com/reader/full/state-park-economic-impact-study 10/72
10
Other studies of larger jurisdictions have excluded resident participation in recreational activities from
impacts on local economies on grounds that residents would undertake alternative activities within the
area so that expenditures by residents are not incremental6. While there is some truth to such
assertions they do not ring true for either residents of a relatively small state with ready access to
similar venues in nearby states or avid sportspersons. This study takes the opposite approach and
includes all participation by residents in order to identify expenditures by residents and benefits
accruing to citizens. Without survey data to know alternative uses of funds currently allocated to
activities at DEP-managed venues, it is left to the reader to mentally make such adjustments.
2. Tourism Activities
2.1 Introduction
The Connecticut Center for Economic Analysis (CCEA) has derived tourism activities in DEP-operated
Connecticut state parks and forests from visitor data provided by DEP and other sources. Appendix A
documents CCEA’s estimating procedures carried out on these data. The first section describes DEP
revenues from fees and services charged by it and tourism expenditures at DEP for-fee venues. The
second expands these modest expenditures to cover the entire spending at venues where visitor counts
are kept and then by park and forests users at DEP venues within the state. The next chapter adds to
the above by including activities where DEP licenses are deployed both within and outside of its parks
and forests boundaries by using licensing data for hunting, angling, boating, skiing, educational
activities, and special events at the Harkness Memorial State Park that contribute to DEP’s economic
impacts.
2.2 DEP Tourism Revenue Sources
Annual data are extrapolated from information by park on daily activities paid for by residents and
nonresidents. Full-day parking and campsite data apply to fee-paying parties of residents and
nonresident whereas data on walk-in attendees apply to individuals. To be additive, this mixture of
parties and individuals were converted to estimates of individuals utilizing DEP venues by using average
sizes of parties from the 2008 intercept survey7 of 3.5 persons for resident parties and 4.2 persons for
nonresident parties. Utilizing these data CCEA attained estimates of the number of parties and people
using each park. Aggregated among the 29 state parks and 4 state forests included in the database, the
annual number days visitors parked or camped is presented in Table 2.2.1 and is split between parks and
forests in Appendix B. Due to their exceptional roles, educational centers and the Harkness Memorial
State Park are excluded and assessed elsewhere. Outcomes are expressed as “Visitor days.” This term is
deployed because the same individual may park or camp several times within a year so that these data
6Bergstrom, John C. H. Cordell, Ken, Watson, Alan E. and Ashley Gregory A. The Economic Impacts of State Parks
on State Economies in the South, Southern Journal of Economics Dec. 1990.7
Witan Intelligence Strategies Inc. Vision Intercept Study Connecticut edition 2008, Table 5.

8/3/2019 State Park Economic Impact Study
http://slidepdf.com/reader/full/state-park-economic-impact-study 11/72
11
do not count the number of individuals making use of DEP venues. In total, by 2010 4.6 million visitor
days were spent by fee paying customers in DEP parks and forests.
Table 2.2.1 Park and Forests Paid Visitor Days: Camping, Parking both Full Day and Late Day (1,000s)
1999 2000 2001 2002 2003 2004 2005 2006 2007 2008 2009 201
Residents 3,132.5 2,842.8 3,262.2 3,735.1 3,143.7 3,331.7 3,797.2 3,635.6 3,876.1 3,525.2 3,451.3 3,
Nonresidents 932.1 746.3 833.7 948.3 738.6 712.9 904.5 791.0 815.7 722.0 798.4 1,
Walk-ins - - - - - 1.1 22.7 28.0 32.1 27.7 21.5
Total 4,064.6 3,589.1 4,096.0 4,683.4 3,882.2 4,045.7 4,724.4 4,454.6 4,724.0 4,275.0 4,271.2 4,
Source: CCEA estimates assessed on DEP records.
A special group of visitors included above are those who pay late fees, mostly for parking at beaches.
Because the average distance travelled by residents paying late-day fees is short8, their expenditures,
over and above parking fees, are applied to transportation only. Because they are half-day visitors
rather than full-day ones, no expenses for meals in Connecticut have been included.
Late day fees were instituted in 2003 and have been a fixture since. The estimate of visitor days by
residents can be gained by multiplying the total residents paying late day fees by 3.5 the average
occupancy of Connecticut vehicle from the intercept survey. By the same token, half-days of use by
nonresidents may be attained using a 4.2 occupancy rate. Parties paying late parking fees are shown in
Table 2.2.2 with total visitor days appearing in the last row in 1,000s of persons. Comparing that line
with the previous indicates that late day visitors comprise a small percentage of total visitor days.
Table 2.2.2 Parties Paying Late Day Parking Fees 2003-2010
Residence and Timing 2003 2004 2005 2006 2007 2008 2009 2010Resident Week Day 6,071 5,959 4,819 5,140 6,071 5,959 4,819 5,140
Resident Weekend 7,545 7,695 7,222 6,890 7,545 7,695 7,222 6,890
Nonresident Week Day 1,533 1,040 1,427 1,662 1,533 1,040 1,427 1,662
Nonresident Weekend 1,615 1,678 1,879 1,735 1,615 1,678 1,879 1,735
Total Resident 13,616 13,654 12,041 12,030 13,616 13,654 12,041 12,030
Total Nonresident 3,148 2,718 3,306 3,397 3,148 2,718 3,306 3,397
Grand Total Parties 16,764 16,372 15,347 15,427 16,764 16,372 15,347 15,427
Visitor Days (1,000s) 60.9 59.2 56.0 56.4 65.1 66.2 79.6 78.3
Late Day attendees are concentrated among those utilizing beaches. Given the natural warmth of the
afternoon and optimal levels of exposure to the sun, these beach goers are treated as enjoying benefits
similar to full day visitors.
Annual visitor fees at the parks, including late day visitors, were in the $3.0 to $3.3 million dollar range
from 2005 to 2009. Fees have risen due to rate increases in 2009, and introduction of pavilion user fees.
The rate and facilities changes have set the stage for annual revenue to rise to $5.2 million in future
years. Also note that DEP fees for parking, camping, occupying cabins and pavilions and consuming ice
8See chapter 5.

8/3/2019 State Park Economic Impact Study
http://slidepdf.com/reader/full/state-park-economic-impact-study 12/72
12
and firewood and related sales taxes are deposited in Connecticut’s General Fund. Chart 2.2.1 captures
annual variations in these fees for visitors to state parks and forests.
Chart 2.2.1 Annual Variations in Fees Paid by Visitors to DEP-managed Forests and Parks (Millions $)
2.3 Park Related Tourism Expenditures
Estimates of DEP parks and forests related tourism expenditures are first derived for paying users at
DEP’s facilities. Amounts for trip costs have been established by a 2008 intercept survey of Connecticuttourist established both average party sizes and average daily expenditures for each resident and
nonresident. The average size of a Connecticut tourism party in 2008 was 3.5 people with a daily spend
per party of $233.45 inclusive of accommodation and $175.24 net of average payments for
accommodations. Parallel figures for daily tourist nonresidents for parties of 4.2 people were $230.34
and $183.99 net of their accommodation payments. Because only five percent of visitors in the
intercept survey utilized campgrounds and because overnight campground fees are lower than hotel or
motel accommodations, that part of expenditures was adjusted downward for campers.
Based on expenditures by all fee paying customers inclusive of those paying late day fees and those
travelling in buses, Chart 2.3.1 illustrates that DEP administered fees are a relatively small percentage of
total expenditures by parks and forests visitors in Connecticut. Fee-paying visitors spent $88.4 million to
$97.7 million annually in Connecticut. The lion’s share of these annual expenditures, $74.3 million to
$84.8 million for 2005 to 2010, was by Connecticut residents as illustrated by the burlap covered area in
the Chart. Walk-in visitor expenditures appear as the minutely thin green line at the top of the graph.
Valued in 2008 dollars, daily per capita expenditures have been in the low to mid $60 to $63 range per
visitor per day throughout the period. Substantiating evidence for the above per capita expenditures
comes from a survey of overnight campers in U.S. national forests. In 2004, their average daily
expenditures were $66.68 and $58.67 for non-locals and locals respectively9.
9Daniel J. Stynes and White D.J. Spending Profiles of National Forest Visitors, NVUM Four Year Report, 2006 pp.
12 and 34. http://www.fs.fed.us/recreation/programs/nvum/NVUM4YrSpending.pdf

8/3/2019 State Park Economic Impact Study
http://slidepdf.com/reader/full/state-park-economic-impact-study 13/72
13
Chart 2.3.1 Expenditures in Connecticut of Paying Visitors Who Utilize For-Fee State Parks and Forests
(Millions 2008 $)
Source: CCEA Based on DEP records and Witan Intelligence Strategies Inc. Vision Intercept Study
Connecticut edition 2008.
While the recent recession led to a downturn in total expenditures by paying visitors to state parks and
forests in 2008 and 2009, expenditures recovered in 2010 albeit insufficiently to regain 2007 levels.
Reflecting the increased number of users in each of the last two years, total expenditures have been
expanding. Due to the opening additional parks and rising attendance and activity fees, expenditures at
state parks and forests have more than doubled since 2002. As a share of total trip expenditures by
these travelers fees remain a relatively small – below 3%.
Table 2.3.1 breaks out tourism expenditures by those who paid fees collected by DEP for their
accommodation and other expenditures with the other expenditures being allocated among
Connecticut residents and nonresidents. The preponderance of expenditures is clearly by Connecticut
resident parties.
Table 2.3.1: Total Annual Expenditures by Paying Visitors (Millions 2008 $)
1999 2000 2001 2002 2003 2004 2005 2006 2007 2008 2009 2010Accommodations 19.3 17.4 20.0 22.9 18.9 19.8 23.1 21.9 23.2 20.9 15.2 16.6
Non-Accommodations
Resident 51.9 47.3 54.4 62.3 51.9 55.0 62.9 60.2 64.2 58.4 62.4 63.4Nonresident 10.7 8.7 9.9 11.3 8.8 8.4 10.8 9.4 9.8 8.7 10.4 13.5
Campers 0.0 0.0 0.0 0.0 0.0 0.0 0.4 0.5 0.6 0.5 0.4 0.4
Sub-total 62.6 56.0 64.2 73.6 60.7 63.5 74.1 70.1 74.6 67.6 73.2 77.4
Total 82.0 73.4 84.2 96.5 79.6 83.3 97.2 92.0 97.8 88.6 88.4 94.0
Source: CCEA Based on DEP records and Witan Intelligence Strategies Inc. Vision Intercept Study Connecticut edition
2008.

8/3/2019 State Park Economic Impact Study
http://slidepdf.com/reader/full/state-park-economic-impact-study 14/72
14
2.4 Extrapolations
CCEA has extrapolated the above in three stages. Paying clients represent only a portion of park visitors.
Out-of-season and off-hour visitors are captured in gate counts but did not pay. For that reason the
number of park visitors exceeded those who paid to use attributes of many for-fee parks. This group of
visitors is larger than the uninitiated reader might expect because some DEP venues charge only on
weekends, so that weekday visitors to those facilities do not pay for parking. In addition, other parks and
forests do not offer camping or established parking facilities and/or do not require fees but are included
in the attendance counts. There is then a second group of counted park visitors benefiting from the use
of these other “fee-free” parks. A third set of parks and forests while still under development offer
activities and attract visitors. DEP keeps no counts of this third set, albeit some of the activities offered
require licenses discussed elsewhere in the analysis so that care has to be taken to avoid double
counting.
2.4.1 Connecticut Expenditures by Visitors to State Parks
Park visitors are assumed to spend the average amounts and experience the average length of stays for
tourists in Connecticut dependent on their residency. Because the sample coverage is better for thoseutilizing state parks rather than state forests, this analysis is broken out for parks and forests.
For 2005, CCEA estimates total visitors to be the 2004 total visitors from DEP’s 2005 SCORP (Statewide
Comprehensive Outdoor Recreation Plan) report assumed to grow at rate of growth in paying visitors
1999 to 200910. This process adds 182.1 thousand visitors in 2005 in order to cover development parks
devoid of visitor counts. That benchmark is adjusted proportionately to known visitor counts annually
out to 2010.
This level of adjustment for parks under development is justified by their numbers and available
activities, not covered elsewhere. The 39 fee-free state parks provide venues for 120 activities of
which 49 are covered by licensing revenues and other estimated expenditures covered elsewhere in this
report. Table 2.4.1 outlines these and the remaining main activities are outlined in. Of the 71 venues
not covered elsewhere, 52 involve walking or jogging activities. The number of venues provided at state
forests was lower with the same emphasis on hunting and hiking and related activities.
10Gat counts covered 6,116 thousand visitors in 2005 compared to SCORPs 6,223 thousand in 1964 to all parks
(SCORP p.16) in 2004 and 1,112 to State Forests compared to 1,759 (SCORP p.16).

8/3/2019 State Park Economic Impact Study
http://slidepdf.com/reader/full/state-park-economic-impact-study 15/72
15
Table 2.4.1 Activity Venues Provided at Fee-Free State Parks
Activities Covered State Parks Venues State Forests Venues
Hunting 13 8
Angling 21 3
Boating 6 1
Boat Launching 5 1
Historic 3 1
Downhill Skiing 0 1
Group Youth Camps 1 1
Total Covered before Adjusting Attendance Data 49 16
Activities x Venues Not Covered by Data 71 36
Hiking 34 13
Biking 8 5
Bird Watching 7 3
Letterbox Guided 11 7
Other 11 8
Total Activities x Venues 120 52
By 2010, visitor days at all state parks reached 6.8 million persons using this methodology. This figure is
extrapolated conservatively from 2009 at the average rate of growth 2005-2009, at a miniscule 0.76%.
In contrast, visitor days at State fee-charging parks 2009 to 2010 were up 5.59%. By 2010, paid fees
covered 1.5 million visitor days at state parks. Another 3.6 million visits occurred in the same parks but
these visitors did not pay fees another 1.6 million were counted at not-for-fee parks. In addition,
developing parks are estimated to have reached 182.1 thousand by 2010 undertaking activities not
covered elsewhere.
Table 2.4.2 lays out the extrapolations for expenditures in Connecticut by visitors to state parks. By
2010, expenditures in Connecticut by state park visitors reached $425.1 million in 2010 dollars, down
$7.2 million from the recent peak in 2007. This estimate assumes that non-paying visitors had similar
average length trips and were divided in the same proportion of residents and nonresidents as were fee-
paying visitors. Accommodation expenses have been estimated conservatively by using rates paid by
the average non-resident person. Because both resident day-trippers who paid late fees and bus
travelers are included in the base numbers, this process leads to lower than average lengths of stays for
tourists captured in the intercept survey. Expenditure estimates using the average length of stay for
tourists would be $13.0 million higher than the above 2010 estimate.
2.4.2 Expenditures in Connecticut by Visitors to State Forests
Among nine state forests for which attendance is tracked, only three forests and the Pachaug
Campground are included. For this reason the sample is not as strong as it is for state parks, albeit there
is little difference between the per capita expenditures between state park and state forest visitors.
That lack of difference engenders confidence in the forest data despite the small sample. By 2010, 22.2
thousand

8/3/2019 State Park Economic Impact Study
http://slidepdf.com/reader/full/state-park-economic-impact-study 16/72
16
Table 2.4.2 Extrapolated Connecticut Expenditures by Visitors to State Parks
(Millions 2008 $)
2005 2006 2007 2008 2009 2010
Fee-Paying VisitorsResidents 81.7 78.3 83.3 75.7 74.4 75.9
Nonresidents 13.4 11.6 12.1 10.8 12.5 16.1
Camper Walk-in 0.4 0.5 0.6 0.5 0.4 0.4
Total Fee-Paying 95.5 90.4 96.1 87.0 87.2 92.5
Out-of-Season & Off-HourVisitor Days at Fee-PayingState Parks 201.0 233.2 232.1 216.8 226.5 222.3
Counted Visitors to Not-For-Fee State Parks 88.8 92.1 91.7 89.7 96.8 98.1
Visitors to DevelopmentState Parks 11.1 12.0 12.1 11.4 11.9 11.9
Direct Trip Expenditures 396.8 428.1 432.3 405.2 422.6 425.1
Source: Visitor days from DEP based on park gate records except for total for 2010 which is a log-linear extrapolation of the
series. Fee paying Visitors are from individual park records.
visitors paid attendance fees while 388.7 thousand accounted for unpaid attendance. Based on the
number of total forest visitors counted, augmented by 50% to capture visitors to DEP forests where no
counting occurred including 14 development forests, and to be consistent with visitor data in SCORP
visits to DEP forests, another 1,287.6 thousand visited not-for-fee state forests. In total 1,669 thousand
visited DEP forests. Table 2.4.3 shows these visitors’ trip expenditures amounted to $119.3 million
down by $4.9 million from the previous year’s peak in 2009.
Table 2.4.3: Extrapolated Connecticut Expenditures by Visitors to State Forests
(Millions $)
2005 2006 2007 2008 2009 2010
Fee-Paying VisitorsResidents 1.4 1.3 1.5 1.3 0.9 1.2
Nonresidents 0.1 0.1 0.1 0.1 0.1 0.2Walk-ins 0.0 0.0 0.0 0.0 0.0 0.0
Total Fee-Paying Days 1.5 1.4 1.6 1.4 1.1 1.4
Out-of-Season & Off-HourVisitor Days at Fee-PayingState Forests 31.8 32.4 31.2 31.5 29.5 27.3
Counted Visitors to Not-For-Fee Forests 46.5 47.4 49.7 44.0 52.1 50.7
Visitors to DevelopmentState Forests 40.0 40.6 41.4 38.6 41.4 39.8
Direct Trip Expenditures 119.9 121.8 123.9 115.6 124.2 119.3
Source: Visitor days from DEP based on park gate records except for total for 2010 which is a log-linear
extrapolation of the series. Fee paying Visitors are from individual park records. Data on total visitor days at

8/3/2019 State Park Economic Impact Study
http://slidepdf.com/reader/full/state-park-economic-impact-study 17/72
17
forests was adjusted upwards to cover unlisted forests based on SCORP data. These adjustments also impacted
estimated expenditures of those visiting not-for-fee forests.
2.4.3 Visitor Expenditures
Total estimated direct expenditures for each type of visitor are the sum of the above appearing in Table
2.4.4. Valued in 2008 dollars, 2010 trip expenditures by DEP-managed parks and forests generated
$544.3 million in direct expenditures in Connecticut.
Table 2.4.4: Extrapolated Connecticut Expenditures by Visitors to State Parks and Forests
(Millions 2008 $)
2005 2006 2007 2008 2009 2010
Fee-Paying Visitors 97.4 92.1 98.0 88.7 88.6 94.2
Out-of-Season & Off-HourVisitor Days at Fee-PayingState Parks and Forests 232.8 265.6 263.3 248.3 256.0 249.6
Counted Visitors to Not-For-Fee State Parks andForests 130.6 133.6 135.6 128.5 151.0 148.6
Visitors to DevelopmentState Parks 51.2 52.7 53.5 49.9 53.3 51.7
Direct Trip Expenditures 494.6 525.8 532.4 498.7 549.0 544.3
Sources: See notes to Table 5a and 5b
2.5 Conclusions
Combining the expenditures for the state parks and forests sizes the total direct tourism monies spent
annually from 2001-2010. During 8.5 million tourism days in 2010, visitors to DEP parks spent $544.3
million. The vast majority of these expenditures were generated by visitors to state parks rather than to
forests and by Connecticut residents rather than nonresidents. The number of fee-paying visitors rose
in 2010, while out-of-season visitors are estimated to have declined as did those visiting not-for-fee
parks and forests in the last year. Less conservative projections could inflate these results by close to
three percent. Of these expenses 17% to 18% were for accommodations including camping.
3. Other Direct Activities
3.1 Introduction and Overview
In addition to general tourism captured in the previous chapter, DEP management facilitates specific
activities both within parks and forests and externally to them. Key among these activities are hunting,
fishing and boating. Licenses are awarded to both hunting and angling whereas permits are only for
hunting. The relative licensing effort devoted to hunting and fishing is clear from Table 3.1.1 below

8/3/2019 State Park Economic Impact Study
http://slidepdf.com/reader/full/state-park-economic-impact-study 18/72
18
provides basic data on the number of licenses and permits issued for the 2010 season starting on Dec 1,
2009, going through to December 31, 2010. It excludes December 1 to December 31 sales for the 2011
season and therefore represents DEP revenues for the single season. The vast majority of license and
permit sales are to Connecticut residents.
Table 3.1.1 DEP Sportspersons’ Licenses and Permits Issued: 2010
Residents Nonresidents Total
Fishing 154,907 14,445 169,352
Hunting 88,079 5,684 93,763
Hunting & Fishing 29,472 283 29,755
Trapping 750 2 752
Total 273,208 20,414 293,622
Because many of the licensees above hold more than one license and/or permit, there are fewer
sportspersons than licenses and permits issued. When holding of multiple licenses and permits is taken
into account, the number of sportspersons is shown in Table 3.2. The number of anglers’ licensees is
then the number of those with licenses strictly for angling plus the number of sportspersons holding a
combination license allowing both hunting and fishing. Of the 752 trapping licenses, all but 37 went to
persons holding either a hunting, fishing or combination license. For this reason hunting activities are
broadened slightly to include trapping in the rest of this chapter.
Table 3.1.2 DEP Sportspersons with Licenses: 2010
Residents Nonresidents Total
Fishing 132,000 13,810 145,810
Hunting 17,916 2,543 20,459
Hunting & Fishing 22,073 214 22,287
Trapping 36 1 37
Total 172,025 16,568 188,593
Source: DEP licensing data with deletion of sequential same name and address deleted.
Contributing to the number of trips taken per hunter and per angler will be the number and diversity of
licenses and permits held. That topic is discussed in greater detail in the following sections. The overlap
is necessary because many anglers hold combination licenses or separate licenses covering multiple
activities. Because the type of fishing, marine or inland, dramatically impacts costs of undertaking each
activity inclusive of travel distances, marine and inland fishing are treated as two different but
overlapping activities within the report.

8/3/2019 State Park Economic Impact Study
http://slidepdf.com/reader/full/state-park-economic-impact-study 19/72
19
3.2 Hunting
DEP contributes to the Connecticut hunts by both restocking and issuing licenses. In 2010 the DEP
purchased a total of 15,775 pheasants based on revenues from the sale of pheasant stamps in 2009.”11
It also controlled the hunt by issuing licenses that are specific by species and technique and in time.
The difference between licenses and permits issued and the number of hunters underlines themultiplicity of licenses and permits held by hunters. It is clear that much of this multiplicity will involve
frequent trips to exercise licenses and each related permit:
Licenses are specific to equipment deployed (shotguns, firearms, muskets of various types, and
bows and arrows);
With the exception of Connecticut’s Harvest Information Permits (HIP), permits are specific to
certain game – migratory birds, deer etc.;
Hunting techniques also differ among the types of hunts as illustrated by the blinds for
migratory bird hunts versus tracking techniques for deer; and,
Hunters hold permits for hunting in specific seasons, such as both a spring turkey and fall turkeyhunting, requiring separate trips.
Table 3.2.1 reveals the size of the licensed hunting community in Connecticut. This enumeration of
licensed hunters includes resident and nonresident hunters as well as the total. The first line indicates
the number of permits, other than CT HIP. HIP aside, permits are for specific game and therefore time
limited either by fiat or the seasonality of available game, each permit is likely to be matched by a trip
for the permit holder. Because many licensed hunters hold in excess of one permit, it is necessary to
establish the total number of hunting licenses, the sum of lines two and three of the table. The Bureau
of the Census found that Connecticut hunters make 12.2 single day trips per resident licensee and three
days for nonresident licensees.
12
Using this data facilitates estimating the number of hunting tripsshown in the last line of Table 3.2.1.
Table 3.2.1: Resident and Nonresident Licensed Hunters Holding Permits: 2010
Residents Nonresidents Total
Permits for Hunting 59,365 2,816 62,181
Hunting Licenses 33,644 2,987 36,631
Hunting & Fishing Licenses 29,472 283 29,755
Hunters and Hunting & Fishing Licenses 63,116 3,267 66,386
Number of Hunting Trips 770,024 9,801 779,825
Source: DEP licensing data.
The 3,267 non-resident hunting licenses issued in 2010 included hunting 1,468 archery, 96 junior
licenses and 284 combination licenses.
11http://www.ct.gov/dep/cwp/view.asp?a=2700&q=394896&depNav_GID=1633
12The only permit holders treated as equivalent to licensees were those holding archery permits for deer who did
not appear to need a license involving any type of firearms.

8/3/2019 State Park Economic Impact Study
http://slidepdf.com/reader/full/state-park-economic-impact-study 20/72
20
Most nonresident hunters originate in Massachusetts and elsewhere in New England accompanied by a
strong contingent from New York, as noted in Chart 3.2.1. There is considerably less hunting in
Connecticut by those originating in New Jersey, and Pennsylvania.

8/3/2019 State Park Economic Impact Study
http://slidepdf.com/reader/full/state-park-economic-impact-study 21/72
21
Chart 3.2.1: Origins of Nonresidents
Source: DEP Licensing Data.
An improved estimate of the number of trips comes from the average number of trips per hunter
determined from a 2006 survey by the U.S. Fish and Wildlife Service. It indicates that resident hunters
averaged 12.2 trips and nonresidents 3.0 trips in Connecticut13. Based on 2010 hunting licensees,
resident hunters undertook 770.0 thousand trips and nonresident hunters 9.8 thousand. The resulting
expenditures for those hunting in Connecticut are illustrated in Table 3.2.2. Per trip expenditures weresimilar for both residents ($120.19) and nonresidents ($470.10).
Table 3.2.2: Hunting Trips and Expenditures by Resident and Nonresident Hunting Licensees (1,000 s)
Resident Nonresident Total
Total Number of Trips (1,000s) 768.1 9.8 777.9
Total Expenditures in Connecticut (1,000s 2006 $) 92,317 4,607 96,924
Source: DEP Licensing Data and average spending data from U.S. Fish and Wildlife Service.
The U.S. Fish and Wildlife Service also breaks out all expenditures on hunting in Connecticut as noted in
Table 3.2.3. That break out is shown in 2006, 2008 and 2010 dollars. The 2008 dollar values are used in
REMI simulations while 2010 values are more readily comprehended than their 2006 counterparts. In all
cases, the industry purchases have been adjusted through Consumer Price Indexes (CPIs) tailored to
them. The last item included licensing fees so the 2010 number has been adjusted to include DEP’s rate
13U.S. Fish and Wildlife Service, 2006 National Survey of Fishing Hunting and Wildlife-Associated Recreation,
Connecticut, Derived from Table 3.

8/3/2019 State Park Economic Impact Study
http://slidepdf.com/reader/full/state-park-economic-impact-study 22/72
22
increases. The small number of spenders indicates that many participating in the survey did not spend
in all sectors and that the sample size is a little small. The number purchasing books and recreational
magazines is small and the expenditures based on residual estimators from the rest of the data.
Table 3.2.3: Detailed Hunter Connecticut Expenditures by Licensees (1,000s $)
Spenders 2006 $ 2008 $ 2010 $
Food and Lodging 40 2,520.3 2,751.7 2,801.5
Transportation 25 5,032.2 5,457.2 5,365.5
Other Trip Costs 32 920.7 1,105.2 993.8
Hunting Equipment 13 29,220.0 29,324.8 29,266.3
Auxiliary Equipment 30 5,886.4 5,860.1 5,773.8
Special Equipment 13 35,836.2 37,879.1 39,309.3
Magazines and Books 478.0 491.6 495.1
Membership Dues and Contributions 8 2,371.8 2,443.8 2,391.8
Other 7 14,658.1 15,102.9 22,898.4Total 37 96,923.9 100,416.5 109,295.3
Source: (1) DEP 2010 Licensing data, (2) U.S. Fish and Wildlife Service Table 22 for the breakout of expenditures
and (3) U.S. Bureau of Labor Statistics for CPI inflators.
The derived overall escalators for the hunting activity in 2008 and 2010 from the 2006 base are then
1.03 and 1.14 respectively. Total expenditures in Connecticut are in 2010 dollars are impressive at
$109.3 million in 2010 dollars.
3.3 Fishing
DEP supports both recreational and commercial fisheries by restocking lakes, ponds and rivers as well as
controlling recreational fishing by licenses. For the 2010 season DEP issued 169,352 licenses strictly forfishing and another 29,755 covering both fishing and hunting, so that it issued a total of 199,107 licenses
for fishing. There were three major types of fishing licenses – Marine, Inland Waters, and All Waters as
shown in Table 3.2.
Table 3.3.1 DEP Issued Licenses and Licensees by Type of Fishery: 2010
Marine Inland All
Waters
Total
Licenses 53,308 81,325 64,474 199,107
Licensed to a Person Holding Another Specific Activity License 204 494 165 863Licensees 53,104 80,831 64,309 198,244
As with hunting some individuals hold multiple licenses for each type of activity. Thus the 53,308
licenses classified as Marine only, were held by 53,204 licensees. Similarly, the 81,325 licenses
specifically issued for the inland fishery were held by 80,831 licensees. Adding All Waters licenses and
licensees to the fishery specific licenses and licensees means that 117,782 licenses for Marine fishing
8/3/2019 State Park Economic Impact Study
http://slidepdf.com/reader/full/state-park-economic-impact-study 23/72
23
were held by 117,413 licensees while 145,799 licenses issued for the inland fishery facilitated
involvement of 145,140 licensees in inland waters.
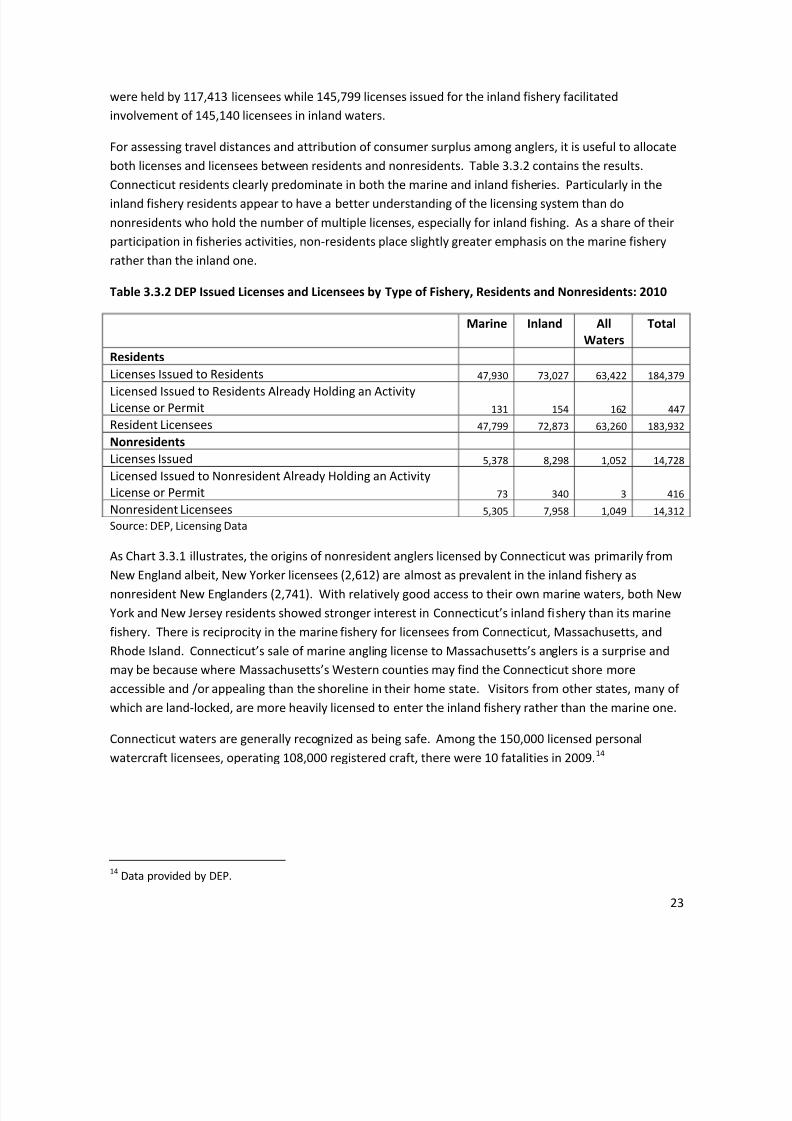
For assessing travel distances and attribution of consumer surplus among anglers, it is useful to allocate
both licenses and licensees between residents and nonresidents. Table 3.3.2 contains the results.
Connecticut residents clearly predominate in both the marine and inland fisheries. Particularly in theinland fishery residents appear to have a better understanding of the licensing system than do
nonresidents who hold the number of multiple licenses, especially for inland fishing. As a share of their
participation in fisheries activities, non-residents place slightly greater emphasis on the marine fishery
rather than the inland one.
Table 3.3.2 DEP Issued Licenses and Licensees by Type of Fishery, Residents and Nonresidents: 2010
Marine Inland All
Waters
Total
Residents
Licenses Issued to Residents 47,930 73,027 63,422 184,379Licensed Issued to Residents Already Holding an Activity
License or Permit 131 154 162 447
Resident Licensees 47,799 72,873 63,260 183,932
Nonresidents
Licenses Issued 5,378 8,298 1,052 14,728
Licensed Issued to Nonresident Already Holding an Activity
License or Permit 73 340 3 416
Nonresident Licensees 5,305 7,958 1,049 14,312
Source: DEP, Licensing Data
As Chart 3.3.1 illustrates, the origins of nonresident anglers licensed by Connecticut was primarily fromNew England albeit, New Yorker licensees (2,612) are almost as prevalent in the inland fishery as
nonresident New Englanders (2,741). With relatively good access to their own marine waters, both New
York and New Jersey residents showed stronger interest in Connecticut’s inland fishery than its marine
fishery. There is reciprocity in the marine fishery for licensees from Connecticut, Massachusetts, and
Rhode Island. Connecticut’s sale of marine angling license to Massachusetts’s anglers is a surprise and
may be because where Massachusetts’s Western counties may find the Connecticut shore more
accessible and /or appealing than the shoreline in their home state. Visitors from other states, many of
which are land-locked, are more heavily licensed to enter the inland fishery rather than the marine one.
Connecticut waters are generally recognized as being safe. Among the 150,000 licensed personal
watercraft licensees, operating 108,000 registered craft, there were 10 fatalities in 2009.14
14Data provided by DEP.

8/3/2019 State Park Economic Impact Study
http://slidepdf.com/reader/full/state-park-economic-impact-study 24/72
24
Chart 3.3.1 Origins of Licensees for Marine, Inland and all Water Fisheries: 2010
In all cases the licensees constitute the base for estimating direct participation in each fishery. The U.S.
Fish and Wildlife Service’s 2006 National Survey of Angling, Hunting and Wildlife-Associated Recreation
identified more Anglers participating in the Connecticut fishery than are licensed by Connecticut to
participate. This outcome is understandable from the survey techniques deployed by the U.S. Fish and
Wildlife Service. A main determinant of Connecticut’s nonresident licenses issued in the marine fishery
is that licenses between Connecticut, Rhodes Island and Massachusetts are reciprocal so that licensees
from those states are not required to be licensed by Connecticut. Due to the reciprocity a Connecticut
licensees have access to marine angling grounds in other participating states. Reciprocity is the main
reason for the ratios of nonresident participating anglers relative to CT licensees are particularly high.The ratios of 2006 surveyed anglers to 2010 licensed ones in Table 3.3.3.
Table 3.3.3: Ratio of Anglers in Connecticut 2006 to Connecticut Licensed Anglers in 2010
Marine Including “All Waters” Inland including “All Waters”
Resident 1.09 1.31
Nonresident 5.67 2.89
Due to assembling data on the number of trips, the survey suggested more angling activity than do the
minimums from the licensing data. These higher trip figures would set angler participation at the levels
appearing in Table 3.3.4. Notice, the word “participation,” is deployed here to capture both licensees
and anglers unlicensed in Connecticut. The first two columns cannot be added to get the total because
those participating in both the Marine and Inland fishery would be double counted.

8/3/2019 State Park Economic Impact Study
http://slidepdf.com/reader/full/state-park-economic-impact-study 25/72
25
Table 3.3.4: Fishery Participants in 2010
Marine Including “All
Waters”
Inland including “All Waters”
Resident 121,000 178,000
Nonresident 36,000 26,000
Total 157,000 204,000
The inland fishery has a higher percentage of resident participants and the marine one a higher share of
nonresident participants. Given the reciprocal use of licenses this outcome is to be expected.
A component of estimating average expenditures per participant is the number of trips taken by the
average participant as well as the total number of trips. Not unexpectedly, residents make more trips to
fish in Connecticut than do nonresidents. These results appear in Table 3.3.5.
Table 3.3.5: Trips per Participant 2010
Marine Including “All
Waters”
Inland including “All Waters”
Resident 8.8 18.2
Nonresident 5.5 3.9
Bearing in mind that nonresidents visiting Connecticut will spend while en route and returning home as
well as the smaller number of trips to Connecticut fisheries relative to residents, nonresidents can be
expected to spend somewhat less per participant in Connecticut than its residents. These lower
expenditures by nonresidents are documented in Table 3.3.6.nonresident participants. Per capita per
day the average resident spends $35.60 and average nonresident $30.30.
Table 3.3.6: Expenditures by Participants in the Connecticut Fishery 2010 (Millions 2006 $)
Marine Inland Total
Expenditures (Millions 2006 $)
Resident 79.1 112.1 191.2
Nonresident 16.6 4.7 21.3
Total 95.7 116.8 212.5
The above expenditures cover only expenditures incurred in Connecticut to undertake angling activities,within DEP’s sphere of influence. They exclude expenditures in Connecticut to undertake angling
activities elsewhere than in Connecticut. The U. S. Fish and Wildlife Service provides a useful breakout
of expenditures by industry for this larger expenditure inclusive of expenditures in Connecticut to
pursue out-of-state angling. The breakout of expenditures is shown in Table 3.3.7 in 2006, 2008 and
2010 dollars. The 2008 dollar values are used in REMI simulations while the 2010 values are more
readily comprehended than their 2006 counterparts. In all cases, the industry purchases have been

8/3/2019 State Park Economic Impact Study
http://slidepdf.com/reader/full/state-park-economic-impact-study 26/72
26
adjusted through CPIs tailored to them. The escalator applied to boat operations was the price of
gasoline. The last item included park fees so the 2010 number has been adjusted to include DEP’s rate
increases. While there was significant escalation 2006 to 2008, there was a slight decrease for 2008
through 2010, despite the inclusion of DEP’s fee increase.
Table 3.3.7: All Angling Expenditures in Connecticut (1,000 $)
Purchases Spenders Expenditures
2006 2008 2010
Food 199 32,505 35,615 36,555
Lodging 22 5,405 5,719 5,397
Transportation 201 30,819 33,422 32,860
Privilege Fees 43 9,224 9,504 9,302
Boat Costs 67 38,836 49,047 42,167
Bait 175 9,674 10,359 10,502
Ice 100 4,049 4,336 4,395
Heating and Cooking Fuel 240 309 288Angling Equipment 192 49,268 49,445 49,346
Auxiliary Equipment (Tents and clothing) 48 12,667 12,610 12,425
Boats, Campers 41,044 43,384 45,022
Magazines and Books 52 1,696 1,744 1,756
Memberships and Contributions 27 1,269 1,308 1,280
Other including Permits and Fees 147 6,856 7,064 10,710
Total Adjusted for Price Changes 199 243,552 263,865 262,004
Source: (1) DEP 2010 Licensing data, (2) U.S. Fish and Wildlife Service Table 16 and 19 for the breakout of
expenditures and (3) U.S. Bureau of Labor Statistics for CPI inflators.
Inflation was a more important factor from 2006 to 2008 than 2008-2010 with prices showing a slight
decline over the last two-years despite DEP increasing fees. This outcome reflects the minor role of
licensing fees in the overall costs of angling.
3.4 Recreational Boaters
3.4.1 Introduction
DEP operates 112 boat launches of which 85 are for trailers. It is assumed that recreational boats
launched at sites providing trailer access operate under power or sail, hereafter referred to as “power
boat launches” in contrast with the launches for human powered or small motor craft from car roof
tops. Further, of the 85 power boat launches 10 are on the coast and the rest on fresh water. Usage of
seagoing boats and freshwater ones will differ in that seagoing recreational boats are more apt to
remain in the water for the season than are freshwater boats where boaters may visit several boat
launches over the season ether for a variety of venues or for competitive events. The purpose here is
to estimate the expenditures from these activities utilizing DEP venues and human resources. Estimates

8/3/2019 State Park Economic Impact Study
http://slidepdf.com/reader/full/state-park-economic-impact-study 27/72
27
of interest in assessing DEP park and forest activities do not cover the entire impact of the recreational
activity throughout Connecticut, just by those using DEP facilities.
DEP provides training and operator licenses for recreational boaters. Currently, DEP assists anglers by
stocking state lakes, ponds and rivers. There are currently 108,000 licensed recreational boats in
Connecticut with at least 150,000 licensees holding safe boating personal watercraft certificates.
Due to higher fees, the PWCs licensing expenditures incurred by new licensees rose from $148,285 in
2009 to $288,500 in 2010. In 2009, DEP issued a further 2,232 licenses and certificates worth $47,285
related to boat and boater safety and replacement of lost licenses. Parallel figures for 2010 include
1,607 licenses and certificates at $37,465.
While anglers are involved in operating recreational boats not all recreational boaters are anglers and
not all anglers are boaters. Because various angler licensees are including the overall data set for DEP,
licensed boaters have been estimated as the residual of the above licensing activities.
3.4.2 Power BoatsAssuming the costs of operating recreational power boats in Connecticut are roughly line with those on
the Great Lakes15, owners of Connecticut registered boats spend $472 million on recreational boating of
which $173 million was spent on their crafts. Of this amount anglers spent $43.4 million on their
recreational boats so that amount in already included in the study leaving non angling recreational boats
spending $130 million on their craft and $353 million in aggregate when their trip expenditures are
included. Remembering that boaters’ expenditures are not all attributable to DEP operations, even ten
percent of the $353 million or $35.3 million is not out of line with its 112 boat launches.
This estimate is likely low because it takes very little account of the proliferation of Personal Water Craft
(PWCs) on freshwater lakes and rivers.
3.4.3 Human Powered Boats
The remaining boat launches cater to boats carried on car roof tops. While some of these may involve
the use of light electric motors (e.g. electrically driven trolling propellers) or even small easily portable
outboards, they are treated here as human powered craft. Generally human powered recreational
boating activities such as canoeing, rowing and kayaking constitute about 2-3 percent of the
expenditures of the power boat and sailing recreational marine16. Given the number of launch sites in
Connecticut and the distances being driven to them, the resulting estimate of $1.5 million appears to be
fairly conservative.
3.4.4 Boating ConclusionsThe above data estimate expenditures on total boating activities in Connecticut. They are conservative
in that the sea going capabilities, the average length of boat in Connecticut is likely longer than on the
Great Lakes. In addition maintaining boats in freshwater is generally less expensive than in saltwater.
15 Great Lakes Boating’s economic punch, Great Lakes Commission des Grands Lacs,
http://www.glc.org/recboat/pdf/rec-boating-final-small.pdf 16
Goss Gilroy Inc. Economic Analysis of Recreational Boating in Canada: 2001, Executive Summary. And

8/3/2019 State Park Economic Impact Study
http://slidepdf.com/reader/full/state-park-economic-impact-study 28/72
28
Nevertheless with DEP’s emphasis on freshwater boat launches, the approximation based on 4.3 million
Great Lakes recreational boats is reasonable. In addition DEP generates amenity benefits to boaters
through its training and licensing programs in order to save lives.
3.5 Other DEP Activities
3.5.1 Introduction
This section looks at three DEP operations targeting specific activities, - skiing at Mohawk Mountain Ski
Area, the Harkness Memorial State Park with its 230 acre grounds, and educational activities at 5
venues. These training venues are designed to assist both teachers and students in upgrading the
quality of environmental education.
3.5.2 Mohawk Mountain Ski Area
Mohawk Mountain Ski Area attracts skiers from Connecticut and surrounding states. Since 1986,Mohawk Mountain gross revenues after deducting receipts for ski rentals have risen from $1.7 million to
$4.3 million. By 2008 ski rentals amounted to $4,700. While rentals have been added to gross revenues
they are insufficient to notice after rounding. Projecting 2009 at the average growth rates for 1986 to
2008, gross revenues annual for the entire year of 2008 reached $4.4 million with fees to DEP of
$80,851. In setting these fees Mohawk Mountain Ski Area utilizes a complex rate schedule noted in
Table 3.5.1.
Table 3.5.1: Mohawk Daily Ski Pass Rates
Adult
(16 & older)
Junior/Seniors
(5-15 yrs / 65 yrs & up)
Child
(4 & under)
ALL DAY 8:30 - 6pm or 1 - 10pm $52 $44 $15
SUNDAY ALL DAY 8:30 - 4pm $52 $44 $15
MORNING 8:30 - 1pm $45 $37 $15
AFTERNOON 1 - 6pm $45 $37 $15
TWILIGHT 4 - 10pm $45 $37 $15
NIGHT FRI/SAT 6 - 10pm $24 $24 $15
SUNDAY SPECIAL 1 - 4pm $37 $37 $15
Source: http://www.mohawkmtn.com/lift_tickets.html .
This complexity is compounded by special ski packages, free ski lessons and veterans discounts17.
Two studies provide breakouts of skiers’ expenditures by activity that indicate about a quarter of their
expenditures are for lift tickets as noted in Table 3.5.2. Utilizing the more up-to-date of these two, skier
expenditures from Mohawk skiing activities would amount to $13.8 million.
17http://www.mohawkmtn.com/lift_tickets.html.

8/3/2019 State Park Economic Impact Study
http://slidepdf.com/reader/full/state-park-economic-impact-study 29/72
29
Table 3.5.2: Skiers’ Expenditures by Activity (%)
Region Midwest2 North Carolina3
Time 1968-69 2002-2003
Lodging & Meals 28.3 37.5
Lift Tickets 24.1
Lift Tickets and Rentals 32.7
After-Ski Entertainment 8.5 1.7
Transportation 16.5 11.1
Other1 22.6 17.0(1) For Midwest includes equipment rental and repairs, lessons, package plans, and, other miscellaneous items with rentals
excluded for North Carolina. (2). W. A. Leushner and Herrington, R. B. The Skier: His Characteristics and Preferences.
http://nrs.fs.fed.us/pubs/other/recsym/recreation_symposium_proceedings_135.pdf Table 10. (3) Steven W. Millsaps,
Groothius, P. A. The Economic Impact of the North Carolina Ski Areas on the Economy of North Carolina 2002-2003 Season,
Table 2 http://www.goskinc.com/economics/2002-2003/NCSAA-Economic-Impact.pdf.
3.5.3 Harkness Memorial State Park
The Harkness Memorial State Park on average hosted 65 events in the historic mansion, primarily
weddings over the last three years. The average group size was 130 implying 8,450 guests. The average
costs per capita at the site were $250, of which $175 is for food, beverages and accommodations and
$75 for incidentals, primarily entertainment. Of these guests about 75% used commercial
accommodation for at least one night and immediate families of bridal parties two nights. Because
most weddings occur during peak season local accommodation prices average $175 per night.
There are a further 25 amphitheatre weddings a year at lower costs per capita and with fewer guests
staying in commercial accommodations. Amphitheatre costs are $375 per event and per capita costs
about $25. Their use of local accommodations is also lower at 25% of guests.
Additional costs for food then add to the total expenditures in Connecticut attracted by the Harkness
Memorial State Park illustrated in Table 3.5.3.
The various food and beverage and off-site accommodation charges cover bridal parties and guests over
one or two nights. The entertainment costs are for bands and other entertainment the weddings. The
expenditures are significant because out-of-state wedding participants, particularly Boston and New
York, dominate bookings at the Harkness Memorial State Park.

8/3/2019 State Park Economic Impact Study
http://slidepdf.com/reader/full/state-park-economic-impact-study 30/72
30
Table 3.5.3: Expenditures Attributable to Operations at the Harkness Memorial State Park
Activity Expenditures
Weddings Utilizing the Historic Mansion
Food, Beverages and Accommodation at the Site 1,803,750
Entertainment 633,750
Offsite Accommodations 1,109,063
Offsite Food 380,250
Travel 117,696
Wedding Deploying the Amphitheatre
Food, Beverages and Accommodation at the Site 71,250
Entertainment 126,750
Offsite Accommodations 82,013
Offsite Food 28,125
Travel 26,116
Other Wedding Parties (Pictures only) 3,750
General Admittance 159,929
Total Expenditures 4,542,460
Donation 347,170
Total 4,889,630
Source: DEP staff.
Harkness accommodation fees are modest in per capita terms as noted from its fee schedule below;
Weddings & Parties:
The rental fee of $4,450 includes exclusive use of the first floor of the mansion and southcourtyard tent for 5 hours with an additional 2 ½ hours set up and breakdown. Purchase
additional time for $875 per hour to the midnight curfew.
Day Use Fees:
Seminars, conferences, luncheons and meetings have a four hour base rate Tuesday - Friday, 8a.m. to 4 p.m. (March 1 to Memorial Day and Columbus Day to December 23)
Music Room: 80 guests maximum, base rate: $565, additional time $220 per hour Dining Room: 40 guests maximum, base rate: $440, additional time $160 per hour Breakfast Room: 30 guests maximum, base rate: $375, additional time $140 per hour.
Visitors to its events however spend a considerable amount in Connecticut as noted in the table. Staff is
noticing increasing number of parties from out-of-state so that increasing shares of the revenues are
attributable to its presence in Connecticut as opposed to locale couples getting married elsewhere in
lieu of availability of the Harkness Memorial State Park.
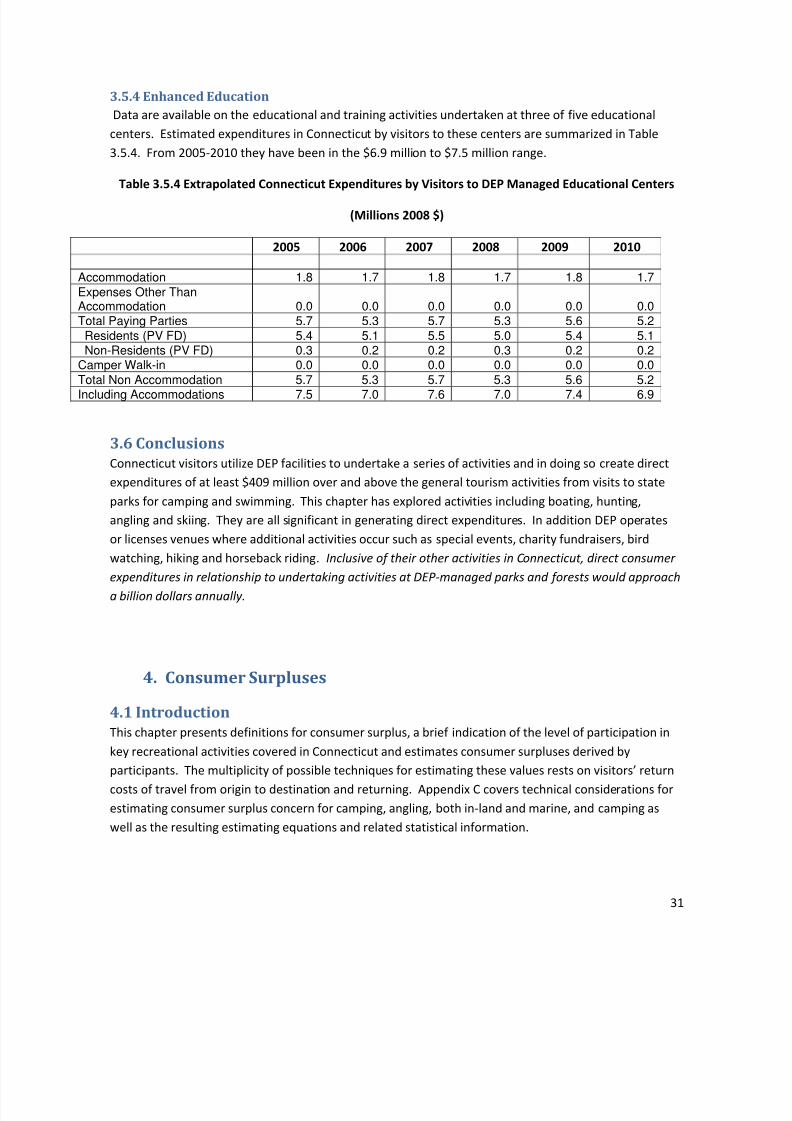
8/3/2019 State Park Economic Impact Study
http://slidepdf.com/reader/full/state-park-economic-impact-study 31/72
31
3.5.4 Enhanced Education
Data are available on the educational and training activities undertaken at three of five educational
centers. Estimated expenditures in Connecticut by visitors to these centers are summarized in Table
3.5.4. From 2005-2010 they have been in the $6.9 million to $7.5 million range.
Table 3.5.4 Extrapolated Connecticut Expenditures by Visitors to DEP Managed Educational Centers
(Millions 2008 $)
2005 2006 2007 2008 2009 2010
Accommodation 1.8 1.7 1.8 1.7 1.8 1.7
Expenses Other ThanAccommodation 0.0 0.0 0.0 0.0 0.0 0.0Total Paying Parties 5.7 5.3 5.7 5.3 5.6 5.2
Residents (PV FD) 5.4 5.1 5.5 5.0 5.4 5.1Non-Residents (PV FD) 0.3 0.2 0.2 0.3 0.2 0.2
Camper Walk-in 0.0 0.0 0.0 0.0 0.0 0.0
Total Non Accommodation 5.7 5.3 5.7 5.3 5.6 5.2Including Accommodations 7.5 7.0 7.6 7.0 7.4 6.9
3.6 Conclusions
Connecticut visitors utilize DEP facilities to undertake a series of activities and in doing so create direct
expenditures of at least $409 million over and above the general tourism activities from visits to state
parks for camping and swimming. This chapter has explored activities including boating, hunting,
angling and skiing. They are all significant in generating direct expenditures. In addition DEP operates
or licenses venues where additional activities occur such as special events, charity fundraisers, bird
watching, hiking and horseback riding. Inclusive of their other activities in Connecticut, direct consumer expenditures in relationship to undertaking activities at DEP-managed parks and forests would approach
a billion dollars annually.
4. Consumer Surpluses
4.1 Introduction
This chapter presents definitions for consumer surplus, a brief indication of the level of participation in
key recreational activities covered in Connecticut and estimates consumer surpluses derived byparticipants. The multiplicity of possible techniques for estimating these values rests on visitors’ return
costs of travel from origin to destination and returning. Appendix C covers technical considerations for
estimating consumer surplus concern for camping, angling, both in-land and marine, and camping as
well as the resulting estimating equations and related statistical information.

8/3/2019 State Park Economic Impact Study
http://slidepdf.com/reader/full/state-park-economic-impact-study 32/72
32
Consumer surplus has also been derived for day trippers to beaches for this relative small user group
described in considerably more detail than in the same appendix than in the following text in order to
support and clarify the various approaches
4.2 Consumer Surplus
Consumers’ surplus18
is the benefit derived by visitors to parks over and above what they pay foraccessing parks. .19 These benefits, sometimes called non-pecuniary benefits, are particularly germane
to public resources like parks because visitors pay either no fee or only a nominal fee to use these
services. This follows from the unique characteristics of parks. Parks may be consumed by many
individuals at once, without reducing the benefits to others (non-rival consumption). Also, it is generally
costly to exclude individuals from using the good (non-excludability).20 Pricing for these types of goods
typically do not capture their full benefits. As the economist Frank Cesario stated over thirty years ago,
“The Consumers’ surplus criterion is gaining widespread acceptance as a way of estimating the primary
economic benefits of outdoor recreation sites and facilities.” (Cesario, 1976) And, indeed, this approach
remains the most widely utilized and accepted today.
When considering public spaces, measuring consumers’ surplus follows one of two methods. The first
method uses a survey to elicit what people think they would be willing-to-pay to make the resource
available.21 A second method is to estimate what people actually spend in order to access these
resources in addition to any price they pay to enter. This report follows the later approach; know as the
travel cost method (TCM). At a minimum, TCM estimates the costs associated with traveling to and
from the park. The assumption is that individuals must value the resource at least as much as they
spend on traveling to and from the resource. Some TCM analyses also additional non-pecuniary costs
such as the time spent traveling to the park and the time spent at the park. Often, TCM uses intercept
surveys as is basis; asking individuals how far they have traveled, how long they spend at the park and
how many times a year they come to the park. Limitations to analyses are discussed in appendix C.Despite this, travel cost analysis remains our best tool for valuing the recreational experience.22
Even in the presence of comprehensive data, obtaining a reliable measurement of consumers’ surplus
can be challenging. Other states have conducted intercept surveys to estimate the number of trips and
travel time for park users (MD). Survey data are not available for Connecticut, but Connecticut collects
18 “Consumers’ surplus” should not to be confused with, or substituted for, “consumer’s surplus”; the former is a
measurement of benefit to one individual, while the latter represents the benefits to an entire group. See Mas-
Colell, Winston, & Green (1995) for additional information.19
“*Consumers’ surplus] measures the net benefits from consuming n units of the discrete good: the utility u(n)
minus the reduction in the expenditure on consumption of the other good.” (Varian, page 353) 20 For example, consider the difference between a ‘public good’, like public open space and a ‘market good’, like a
piece of gum, which lacks these characteristics. Only one individual consumes gum at a time, whereas many
people can simultaneously be in a park. Gum is readily excludable as the physical barrier of being in someone’s
mouth. Park benefits such as looking at natural vistas, preservation of biodiversity, etc. are available to all in
proximity to the park.21
“Washington State Parks Centennial 2013 Survey,” Responsive Management, (2006)
http://www.parks.wa.gov/Centennial2013/2006%20Survey.pdf 22
Haab, TC and KE McConnell (2002) Valuing Environmental and Natural Resources: Econometrics of Non-Market
Valuation USA: Edward-Elgar Publishing.

8/3/2019 State Park Economic Impact Study
http://slidepdf.com/reader/full/state-park-economic-impact-study 33/72
33
addresses for all individuals who reserve camp spaces and purchase licenses. Using spatial analysis,
distances can be measured using visitor addresses and geocoded parks data. A small percent of visitor
data were found to have invalid or “non-geocodable” addresses. These instances were mostly for non-
residents accessing Connecticut attractions. Where addresses were obviously false, the information
was deleted from the sample on which estimates were made but the numbers of omitted licensees
reintegrated with the estimates based on the estimated averages in order to more fully capture
consumer surpluses from these activities.
Individuals who are out of state can also purchase these licenses. In the case of marine angling licenses,
Rhode Island, Massachusetts and New York offer reciprocity. CT residents may purchase marine angling
licenses in other states and use them in Connecticut’s Marine fishery and vice versa. Because DEP’s
database is limited to Connecticut, using Connecticut license purchases only necessarily leads to a lower
bound estimate of the consumer surplus derived from Connecticut’s marine resources. Ideally the
exercise would be conducted among all members operating under reciprocity agreements. The
Connecticut data do not include addresses for individuals who attend parks for other sporting activities.
This omission underestimates of the true consumer surplus for Connecticut’s state parks and forests.
Because DEP data contain only addresses of origin, exact distances traveled are unknown as are the
potential for multiple destinations, number of people in each party, and the number of visits per person.
For individuals coming from farther away (such as Texas), exact travel costs can be difficult to measure
accurately. In addressing these issues the CCEA has remained conservative in its assumptions. CCEA has
assumed that people travel directly from their origins to their nearest destination offering the activity
and return the same way. This distance is ‘as the crow flies’ as opposed to road mileage. All visitors go
to the nearest DEP location that offers their particular activity. Connecticut and its New England
counterparts are physically smaller than most other states, leading to smaller distances traveled in-state
to recreation facilities, and smaller travel costs. Given the relatively small portion of visitors from verydistant states, their travel distance is included. Visitors not from the contiguous USA are excluded. This
approach tends to understate local travel disproportionately to long-distance travel; thereby
undervaluing Connecticut consumer surplus. CCEA has assumed travel costs of $0.585 per mile and the
average numbers of persons in parties for CT and the rest from the visitor’s survey. Where party sizes
allow, it may be less expensive for more distant visitors to use alternative modes of transit. These
estimates are for people going to state parks and forests specifically for camping or licensed activities.
CCEA did not extrapolate its results to cover visitors going to other state parks and forests or visitors to
the same state forests and parks for undertaking different activities.
4.3 CampingIn 2010, CCEA had complete data on 161,327 resident campers and 23,971 non-resident camper visitors
who spent nights in DEP campgrounds. In doing so, each experienced the ambience and communed
with nature and fellow travelers in ways that campgrounds facilitate. When the individual was gaining
more satisfaction than he or she had paid for his or her trip that individual visitor was realizing consumer
surplus. Based on established travel-distance methods (Appendix C) for deriving consumer surplus,
CCEA estimate for the consumer surplus accruing to resident campers is at least $124.1 million while

8/3/2019 State Park Economic Impact Study
http://slidepdf.com/reader/full/state-park-economic-impact-study 34/72
34
$18.4 million accrued visitors to the state. The average consumer surplus per occupant was $769, in-
line with the range of earlier studies after adjusting for higher transportation costs23.
There are some confounders in this estimating process. Individuals who travel from greater distances
are more likely to have multiple destinations on their trip. For these consumers, only part of their travel
expenses can be reasonably allocated to Connecticut’s parks. Yet, without survey data, there is no basisto reasonably judge what percentage of their travel is based on their desire to engage in activities at
Connecticut’s parks. The farther the distance away, the fewer individuals make these trips. Statistically,
they play only a small role in estimating consumer surplus.
Secondly, data are only available for individuals in parties who actually paid to attend parks. This
information gap is a problem when trying to estimate consumer surplus for individuals who might come
to the parks for fee-free activities, simply drive through them or if park amenities change. For this
reason, the consumer estimates are limited to current conditions and those activities for which data is
available. By the same analogy, drive though traffic is unaccounted for and also excluded from the
estimates. These motorists may also be enjoying the scenic wonders of some of the parks.
4.4 Fishing
Because the costs of undertaking inland and marine fishing including travel are quite different a
separate analysis has been undertaken on consumer surpluses for each group of anglers. While holders
of all waters licenses belong to both groups, the satisfaction derived from deep sea fishing as opposed
to inland fishing may be quite different even for the same person. In addition, the marine estimate is
constrained. The existence of reciprocity among many Eastern seaboard states for the sale and use of
marine fishing licenses means that the sale of Connecticut licenses to out-of-state offshore anglers may
not reflect distances traveled to participate in marine activities. Taking these factors into consideration
CCEA’s sample included 98,264 resident and 8,825 nonresident inland anglers. The more expensive
marine fishery attracted 65,974 resident and 6,201 nonresident anglers.
Under these conditions the estimate of the consumer surplus in the inland fishery is understated at
$67.4 million for residents with a further $3.3 million accruing to nonresidents. Of those included in the
estimate, this consumer surplus averaged $500 per license. This estimate is high compared to the range
of consumer surpluses summarized from the literature in the appendix at $26-$208 but consistent with
the close proximity of housing to sites for angling that facilitates frequent use of licenses and higher fuel
costs that underpin current rather than earlier estimates.
23 With an average of 3 nights per stay per visitor, the average consumer surplus per night per visitor is $256. A
similar study of camping in three Maryland parks found camping consumer surplus per night per visitor ranged
between $194 to $350 (in US$2010) (Wienland and Horowitz, 2007). Our estimate is roughly half-way between
their lower and upper estimates for visitors per night. A study of an Australian recreational area estimated
consumer surplus to be $158 per adult per visit per day (in US$2010) (Rolfe and Dyack, 2010). Because this study
did not differentiate between overnight and day visits, this value is lower than our camping value as expected, but
supports the plausibility of this estimate.

8/3/2019 State Park Economic Impact Study
http://slidepdf.com/reader/full/state-park-economic-impact-study 35/72
35
Average distances used for estimating consumer surplus in this report for residents were eight miles
with average distances expanding for non-residents coming from more distance states. Because fewer
and fewer anglers travelled long distances, this process places less and less emphasis on them.
Earlier estimates suggest that CCEA distance assumptions are conservative. In their compilation of
travel distance data collected from 1988-1995 at 85 sites on 53 streams located throughout the State of CT of 4,643 anglers Hagstrom et al found the average distance travelled by all inland anglers was 12.1
miles and that the 90% traveling the furthest drove 23.5 miles or more 24. Because out-of-state anglers
are apt to travel further than residents, and only 2% of fishing trips are undertaken by non-residents,
this survey suggests but does not substantiate a tendency for CCEA’s distances assumptions for
residents to be downward biased. A second survey data of 3,138 anglers encompassing five different
fishing areas on the Farmington River suggest that distances travelled ranged from 7.8 to 25.6 miles
depending on the site and the season25. Average distance travelled to only one site in spring was lower
than the eight miles assumed in this report indicating the report’s travel distances for inland anglers are
conservative as is the resulting estimate of consumer surplus.
Inland fisheries are assisted by DEP fish hatcheries through the restocking of lakes, ponds and rivers. In
particular, the excitement of hooking and retaining a brown trout and other species on a line is fostered
and perpetuated by their release. Inland angling has a faithful following of Connecticut residents who
participate frequently as notes above. This level of participation drives up their collective consumer
surplus derived from the marine fishery to $36.9 million for residents and $2.9 million for nonresidents.
Consumer surplus estimates are for a modest $370 per license.
The bottom line is DEP managed venues contribute at least $104.3 million in consumer surplus to
resident Connecticut anglers and a further $6.1 million to other North Americans, part of the magnet
that attracts them to spend their sporting dollars in Connecticut.
4.5 Hunting
According to the U.S. Fish and Wildlife Services, Connecticut residents spend $100 million a year on
hunting trips and related retail expenditures in the state. In addition, non-residents spend nearly
another $5 million in the state. Aside from licenses limited to one or three days, there are good reasons
to expect that hunting licenses will be used on multiple occasions:
24Hagstrom, N. T., M. Humphreys, W. A. Hyatt, and W. B. Gerrish. 1998. A survey of Connecticut stream and rivers.
Federal Aid in Sport Fish Restoration , F-66-R Final Report, State of Connecticut Department of Environmental
Protection, Hartford, CT. Table 3225 Hyatt, W. A. 1986, An angler survey and economic study of the Farmington River fishery resource. Federal Aid in
Sport Fish Restoration , F-59-R Final Report, State of Connecticut Department of Environmental Protection,
Hartford, CT. Table 13.

8/3/2019 State Park Economic Impact Study
http://slidepdf.com/reader/full/state-park-economic-impact-study 36/72
36
The Bureau of the Census found that Connecticut hunters make 12 single day trips per resident
licensee and three days for nonresident licensees26;
Seasons for types of game, e.g. spring and fall turkey shoots, are different; and,
Hunting techniques vary – shotgun or bow and arrow – and many of the permits under the
licenses are for different hunting techniques – using blinds in hunting migratory birds to tracking
deer – a hunter holding all these permits and/or tags would undertake multiple trips.
CCEA’s initial estimates of consumer surpluses among hunters are conservatively $17.8 million for
residents and $566,000 for nonresidents or $268 per license. To the extent that hunters travel to
different venues and/or extend their trips beyond a day, the consumer surplus would be larger than
estimated.
4.6 Day Trippers
Since 2003, it has been possible to pay late fees rather than full-day fees, particularly at beaches. Such
fees have been differentiated between residents and nonresidents and between weekday and weekend
visitors. The advantage of such fees for both resident and nonresident visitor groups is that they affordvisitors choices based on price ranges. Especially at beaches where characteristics derived from going
to the beach may be quite similar for full day and half day visitors different behaviors may reveal their
preferences. Lower fees, the brevity of exposure to the sun, convenience, and enhanced warmth
available to late day visitors may be preferable to some visitors relative to the full-day experience. For
others the length of time at the beach may be more important. Consumer actions reveal visitor
preferences among these choices. Using this approach in lieu of data on distances traveled as well as
linear approximation yield a relatively low assessment of $570,000 in consumer surplus accruing to
Connecticut consumer benefit from four beaches and $80,000 to nonresidents.
In addition for resident day trippers, reverse engineering reveals estimates (See CC.5 in Appendix C) of
the average distances traveled by various classes of visitors. The costs for late day resident parties
visiting the beach are equal to their entrance fee and travel costs to get there and back. These visitors
do not generally face costs for either meals or accommodation. They are simply driving to the beach
from their points of origin and returning to them. They may decide to diverge from their most direct
route in order to undertake other activities along the way, but those travel costs can be allocated to
those other activities.
This choice has facilitated estimating demand elasticities relative to fees charged and transportation
expenditures involved both within a given year and among years for 2009 and 2010 as described in
Appendix C. CCEA estimated elasticities revealed by late day trippers for 2009 and 2010 as -0.98339 and
-0.79571. These results suggest further rate reduction for late day trippers would erode rather than
enhance government revenues.
Yet all other things remaining equal, these estimates would be expected to be roughly similar between
the years. The response is that at all other things, including transportation costs were not similar.
26The only permit holders treated as equivalent to licensees were those holding archery permits for deer who did
not appear to need a license involving any type of firearms.

8/3/2019 State Park Economic Impact Study
http://slidepdf.com/reader/full/state-park-economic-impact-study 37/72
37
These elasticities for residents are of particular interest because they can also be reverse engineered to
provide a guide to distance driven. The difference in costs per mile is derived from a combination of
government rates grant to employees per mile drive in 2009 of $0.58527 with an escalator for personal
travel in the Northeast that grew by 8.7 percent from 2009 to 2010 thereby causing an increase of
$0.0509 per mile to move five cents a mile past the 2009 costs. This results in an estimated weighted
round trip distance 6.4 miles. Using this distance to derive transportation expenditures per trip incurred
in undertaking beach activities for residents and the estimate of 100 miles for nonresidents yields the
transportation costs for this group. The results appear in Table 4.6.1.
Table 4.6.1: Transportation Costs Related to Day Visitor Days (2010$)
2003 2004 2005 2006 2007 2008 2009 2010
Resident Week Day 17,867 17,681 15,079 16,309 40,478 44,223 59,524 53,144
Resident Weekend 1,529 21,973 19,471 24,442 54,259 13,672 7,803 7,218
Nonresident WeekDay 97,480 66,131 90,739 105,682 131,562 87,152 112,203 233,978
NonresidentWeekend 102,694 106,700 119,481 110,324 28,805 4,815 4,446 8,914
Total Resident 19,395 39,655 34,550 40,751 94,737 57,895 67,327 60,361
Total Nonresident 200,173 172,831 210,220 216,007 160,368 91,967 116,649 242,892
Grand Total 219,569 212,485 244,770 256,758 255,105 149,862 183,976 303,254
5.7 Conclusions
CCEA has estimated consumer surpluses accruing to Connecticut citizens by major activities:
o Camping (S124.1 million)
o Hunting ($17.8 million)
o Inland Angling ($67.4 million)
o Marine Angling ($36.9 million)
o Swimming/day use at four parks ($570,000).
In addition to the $246.9 million accruing to residents in consumer surplus, out-of-state visitors
undertaking these activities derived a further $25.1 million, led by campers at $18.4 million. Total
estimated consumer surplus for camping is 26% of tourism expenditures made by campers in
Connecticut.28 Had there been sufficient survey data available to justify extrapolating the estimates of
consumer benefits to other DEP venues where less detailed records and other activities are undertaken,
it is highly likely that those estimates would indicate that DEP operations provide significantly more
benefits to citizens of the state. These estimates take no account of the amenity benefits accruing toresidents overlooking the “permanent” green space created by the parks. That task is left to the next
chapter.
27This rate is particularly researched. Employee unions insist on their members not being under reimbursed and
Auditor Generals ensure that government coffers are not being plundered.28
Strauss, Charles H. and Lord, Bruce E. A. Case Study The economic impacts of a heritage tourism system, Journal
of Retailing and Consumer Services 8 (2001) 199}204

8/3/2019 State Park Economic Impact Study
http://slidepdf.com/reader/full/state-park-economic-impact-study 38/72
38
5. Amenity Benefits
5.1 IntroductionOn Long Island the amenity value for overlooking green space is 12.8% relative to house values devoid of
such vistas. Due to the abundance of green space in Connecticut, expectations are for a lower green
space bonus but such expectations can be offset by the quality of Connecticut’s green space, breadth of
vistas, and permanence offered by state parks and forests. This chapter illustrates CCEA’s derivation of
this value and the total amenity values accruing to Connecticut residents overlooking DEP-managed
parks and forests. Like all property evaluations, they are subject to change. Since 2007, the average
value of housing permits in Connecticut has risen by 3.2517% while house prices have declined.
This green space bonus value has then been applied to CCEA’s estimate of 6,158 residences overlooking
state parks and forests. This estimate is based on enumerating all single detached residencessurrounding state parks and forests. In purposeful samples of locales defined to be spread out across
the state house selling prices were determined from OPM data for both those overlooking parks and the
average selling prices in the same locale. The results were also tested against an estimate of those
backing onto green belts along state trails based on a sample of a 100 mile stretch of trail to see if there
is a difference backing onto state parks or forests. Of these sampled homes, 1,078 overlook parks and
1,024 state forests.
This process has involved identifying residences overlooking DEP-managed parks, forests and hiking
trails using sophisticated GIS systems as well as any 2007 sales of both those houses and those in the
same towns, thereby forming two sets of data. The first allows residents to enjoy vistas while the latter
on average contains few properties without such access. Percentage differences in assessed values then
provide an initial base for expecting residential selling prices to differ between residences overlooking
DEP husbanded green spaces and those not overlooking them. After adjusting for those expected
differences, residences overlooking DEP-managed green spaces still attracted a 12.2% to 13.3% pricing
bonus.
Sections of this chapter address the methodology to identify the number of residences overlooking DEP-
managed venues, methodology for assessing green space bonuses, amenity estimates, fiscal
implications, and conclusions.
5.2 Number of Houses Overlooking Parks and State ForestsCCEA assessed the total number of houses overlooking State parks and State forests using visual
recognition from GIS sources. CCEA research for residences with a direct access overlooking green
spaces managed by the Connecticut DEP and designated as State Parks or State Forests. Visual
recognition may not be the best procedure, although in this particular case it has been considered the
only viable way in order to include only single residential buildings while excluding multiple unit
buildings and non-residential ones.
8/3/2019 State Park Economic Impact Study
http://slidepdf.com/reader/full/state-park-economic-impact-study 39/72
39
Current Geographic Information Systems (GIS) software (e.g. Imagine) are based on light
reflection/refraction samplings are useful in identifying buildings but do little to differentiate between
commercial (especially small business) and residential buildings. These attributes are particularly
germane for statewide studies. Furthermore, the characteristic of directly overlooking particular green
spaces needed to be addressed with care, because similar structures (e.g. other houses) may create
barriers that sample-based techniques cannot overcome. CCEA recognized residences by downloading
the shapefile (.shp) provided by the DEP through its GIS on-line Data center29. This file “… contains
property that comprises DEP facilities such as state forests, parks and wildlife management areas”30,
with a 1:24,000 scale, NAD 1983 StatePlane Connecticut FIPS 0600 Feet coordinate system, 01/12/2010
release. CCEA then imported this file into ArcGIS 9.3.1, deployed for data preparation and selection.
DEP-managed state parks and state forests have been selected using the “Select by attribute” tool. By
creating an SQL to extract the desired features, CCEA generated a new layer to show only the desired
properties. The file has been subsequently transformed in to KML (.kmz), using the Toolbox provided in
to ArcGIS, thus creating overlapping files in Google Earth. These overlapping files in Google Earth
provide visible borders for the parks/forests as well as overlooking residences. Finally, the recognitionprocess facilitated counting the number of houses overlooking DEP-managed green spaces and
recording the information in an Excel File for at each park/state forests.
5.3 Assessing “Green Space Bonus” for Residences Overlooking DEP Parks and
Forests The premium price assessed for directly overlooking of DEP’s managed green spaces in the state has
been based on the use of different sources. The basic idea has been to extrapolate the additional price
people are willing to pay for houses directly overlooking state parks and/or state forests and state trails.
The files/sources used are listed in the table below. A brief description of the data preparation
methodology follows.
Using the ESRI-based geocoding file of the USA, previously clipped for the State of Connecticut31 CCEA
geocoded32 2007 residential sales. Subsequently, the file showing town boundaries has been used to
select and to extract data on towns which had sales of properties overlooking DEP parks and forests,
29http://www.ct.gov/dep/cwp/view.asp?a=2698&q=322898&depNav_GID=1707#Property
30http://www.cteco.uconn.edu/metadata/dep/document/DEP_PROPERTY_FGDC_Plus.htm
31The file was derived from the original ESRI database, although reconfigured in NAD 1983 StatePlane Connecticut
FIPS 0600 Feet, thus showing distances in feet. Therefore, the new feature has been reconfigured with same
coordinate system by ArcGIS.32
That is, ArcGIS has created a point feature for each of the properties listed, associating a geographical location
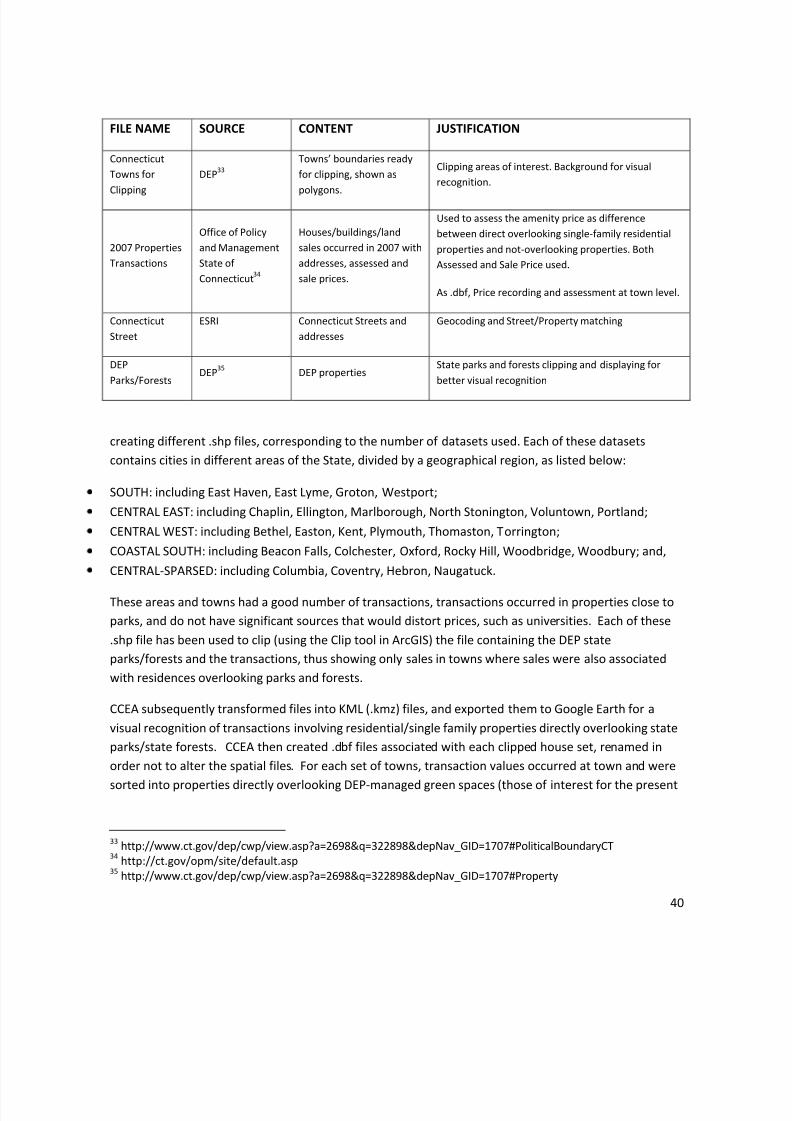
8/3/2019 State Park Economic Impact Study
http://slidepdf.com/reader/full/state-park-economic-impact-study 40/72
40
FILE NAME SOURCE CONTENT JUSTIFICATION
Connecticut
Towns for
Clipping
DEP33
Towns’ boundaries ready
for clipping, shown as
polygons.
Clipping areas of interest. Background for visual
recognition.
2007 Properties
Transactions
Office of Policy
and Management
State of
Connecticut34
Houses/buildings/land
sales occurred in 2007 with
addresses, assessed and
sale prices.
Used to assess the amenity price as difference
between direct overlooking single-family residential
properties and not-overlooking properties. Both
Assessed and Sale Price used.
As .dbf, Price recording and assessment at town level.
Connecticut
Street
ESRI Connecticut Streets and
addresses
Geocoding and Street/Property matching
DEP
Parks/Forests DEP35
DEP properties
State parks and forests clipping and displaying for
better visual recognition
creating different .shp files, corresponding to the number of datasets used. Each of these datasets
contains cities in different areas of the State, divided by a geographical region, as listed below:
SOUTH: including East Haven, East Lyme, Groton, Westport;
CENTRAL EAST: including Chaplin, Ellington, Marlborough, North Stonington, Voluntown, Portland;
CENTRAL WEST: including Bethel, Easton, Kent, Plymouth, Thomaston, Torrington;
COASTAL SOUTH: including Beacon Falls, Colchester, Oxford, Rocky Hill, Woodbridge, Woodbury; and,
CENTRAL-SPARSED: including Columbia, Coventry, Hebron, Naugatuck.
These areas and towns had a good number of transactions, transactions occurred in properties close to
parks, and do not have significant sources that would distort prices, such as universities. Each of these
.shp file has been used to clip (using the Clip tool in ArcGIS) the file containing the DEP state
parks/forests and the transactions, thus showing only sales in towns where sales were also associated
with residences overlooking parks and forests.
CCEA subsequently transformed files into KML (.kmz) files, and exported them to Google Earth for a
visual recognition of transactions involving residential/single family properties directly overlooking state
parks/state forests. CCEA then created .dbf files associated with each clipped house set, renamed inorder not to alter the spatial files. For each set of towns, transaction values occurred at town and were
sorted into properties directly overlooking DEP-managed green spaces (those of interest for the present
33http://www.ct.gov/dep/cwp/view.asp?a=2698&q=322898&depNav_GID=1707#PoliticalBoundaryCT
34http://ct.gov/opm/site/default.asp
35http://www.ct.gov/dep/cwp/view.asp?a=2698&q=322898&depNav_GID=1707#Property

8/3/2019 State Park Economic Impact Study
http://slidepdf.com/reader/full/state-park-economic-impact-study 41/72
41
study) or not overlooking them. Both the Assessed and the Sale Price have been used to make the
comparison and evaluate the amenity price paid for properties overlooking state parks/forests.
5.4 Amenity Estimates
This section derives reasonable market assessments and selling prices of market values of average
residences allocated into two groups – those overlooking DEP-managed venues and those notoverlooking them. For that reason apparent distressed sales and others influenced by non-market
forces, documented by OPM,36 were excluded from the analysis of either group of sales. In its database
on real estate OPM has tried to eliminate non-market factors by purging non-representative sales. For a
full list of OPM’s reasons for purging non-market entries see Appendix D. This process eliminated all
sales where selling values were less than assessed values or where non-market considerations were
known to influence prices. The valuations were limited to single residences in order to maintain
comparability between groups.
Table 5.4.1 contains the comparisons of assessed and selling prices not overlooking DEP-managed
venues with those which overlook them. While the overall averages indicate a significant green spacebonus not all regions are positive. In particular the two with the smallest samples are negative. This
outcome may arise from sampling problems or perceived negative characteristics outweighing the
positive characteristics from the vistas afforded by DEP-managed venues.
Table 5.4.1: Average Values of Single Residences Sold in 2007
Area Not Overlooking DEP
Parks and Forests
Overlooking of DEP Parks
and Forests
Assessed Selling
Price
Assessed Selling
Price
South (N=7) 308,470 467,290 448,943 798,000
South Net of Westport (N=6) 100,047 149,863 83,642 132,167
Central East (N=22) 180,098 268,095 203,842 318,160
Central West (N=25) 331,959 473,087 389,645 663,073
Coastal South (N=4) 206,408 328,127 142,525 227,750
Central Sparse (N=7) 166,095 268,111 141,767 227,863
Total (N=65) 252,442 372,086 291,242 487,206
Total Net of Westport (N=64) 232,027 340,840 254,531 419,928
Source OPM cleaned to exclude non-market and extraordinary market influences. The “N”s are
the numbers of 2007 sales of single residences overlooking DEP parks and forests.
These data, particularly those for South are heavily influenced by a high priced outlier in the high-end
market of Westport. For that reason the results are reported with and without that outlier. If anything
36Distressed sales can occur after fires or for quick recovery of assets by financial intermediaries following
foreclosures that do not reflect true market values. Other sales can be influenced by transactions within families,
auctions etc. Because CCEA utilizes the percentage differences between assessed and market values we have also
purged sales which OPM has classified as involving significant improvement relative to assessed values.

8/3/2019 State Park Economic Impact Study
http://slidepdf.com/reader/full/state-park-economic-impact-study 42/72
42
these estimates are downward biased. For residences not overlooking DEP parks and forests, assessed
values are based on average values of $232,027 and selling prices of $340,840 compared to state
average assessment of $334,556 and selling prices of $435,71837. In short, the assessment of the bonus
is based on a downward biased sample.
While the overall results show a significant green space bonus, that conclusion does not hold in theSouth when the high-end property is eliminated. In addition, assessed values are lower for residences
overlooking DEP parks and forests in Coastal South and the South net of the Westport outlier. In each of
these the bonus for overlooking the parks and forests remains positive as noted in the next Table.
Table 5.4.2 captures the differences in average property values derived from the above. Because actual
market values of properties normally exceed assessed values the percentage green space bonus is based
on the selling price of properties overlooking DEP green space less the average value of those not
overlooking DEP green space adjusted for the average differences in the assessed values of the
properties. That process captures all the same characteristics off housing, but for the vistas. Also,
because properties are assessed by uniform criteria at roughly the same time within a locale, excluding
green space as a characteristic this process takes other characteristics influencing property values are
considered in the assessed values, leaving the characteristic of overlooking DEP green space as a major
contributing factor to the remaining market differences.
Table 5.4.2: Average Values of Single Residences Sold in 2007
Area Differences (2007$) % Differences % Bonus
Assessed Selling Price Assessed Selling Price
South (N=7) 140,473 330,710 45.5 70.8 17.3
South Net of Westport (N=6) (16,405) (17,697) -16.4 -11.8 5.5Central East (N=22) 23,743 50,065 13.2 18.7 4.9
Central West (N=25) 57,686 189,986 17.4 40.2 19.4
Coastal South (N=4) (63,883) (100,377) -30.9 -30.6 0.5
Central Sparse (N=7) (24,328) (40,248) -14.6 -15.0 -0.4
Total (N=65) 38,800 115,120 15.4 30.9 13.5
Total Net of Westport (N=64) 22,504 79,088 9.7 23.2 12.3
The sample outside of the parks does include the normal share of property sales overlooking other
green spaces. They may also be deriving similar amenities by deriving similar benefits. To the extent
that happens, CCEA is understating the amenity values provided by DEP-managed resources.
By using the percentage bonus relative to the average selling price of residences not overlooking DEP-
managed parks and forests, CCEA has a attained an average bonus of $41,961 to $50,124, depending on
whether the high-end Westport property is included or not. Based on the 6,158 residences, identified as
overlooking of DEP parks, forests, and trails this bonus amenity value is $258.4 to $309.4 million valued
37Entire OPM single resident database for 2007 aside from exclusions for non-market considerations and
improved quality excluded from the assessed values.

8/3/2019 State Park Economic Impact Study
http://slidepdf.com/reader/full/state-park-economic-impact-study 43/72
43
in 2007 dollars. Adjusted to 2010 dollars based on the 3.2517% increase in housing permits, the bonus
amenity values would increase to $266.8 million to $319.3 million. Because they are outside of the
assessed value of the properties they accrue to the owners or, where previous sales have captured the
amenity values, the former owners of the overlooking properties.
5.5 Fiscal ImplicationsThe average assessed value of houses is higher than those not overlooking DEP-managed parks and
forests. This tendency to build larger homes with more appealing features already adds $22,504 to
$38,000 per residence overlooking DEP-managed venues to the property tax base of the state. Total
estimates of the above average assessed values of residences overlooking DEP-managed venues to the
states’ property tax base are the $143.1 to $246.7 million. At current average property rates of 2.2%,
this increase in assessed property values adds $3.1 to $5.4 million (2010$) in annual government
revenues. Attributable to DEP’s husbanding of and long-term commitment to parks and forests green
spaces, the above average assessment values annually enhance state and local government revenues
indirectly via the tax system.
Inflation aside, the expected long-term net present value of this revenue stream discounted at 5% over
20 years is $390.2 to $67.7 million in 2010 dollars. Any rebasing of property values to capture the
currently uncaptured amenity values would further enhance DEP’s contributions to government
revenues. Attributable to DEP’s husbanding of and long-term commitment to park and forests green
spaces, this amenity value annually enhances state and local revenues indirectly via the tax system.
5.6 Conclusions
Assessed against selling 2007 prices adjusted to 2010 dollars for single residences either overlooking
DEP parks and forests or not doing so, Connecticut residents reap amenity benefits of $258.1 million to
$309.0 million in 2010 dollars. Residents tend to build relatively expensive homes overlooking green
DEP venues that add another $141.1 million to $243.3 million to the assessed value of properties. The
government shares in these revenues through property taxes in the range of $3.1 million to $5.4 million.
The percentage increment estimates for these amenity values ranges between 12.3% to 13.5%, which is
similar to the hedonically based estimate for Long Island of 12.8%. Given the greater availability of
green space in Connecticut, initial expectations of lower percentage green space bonuses in Connecticut
may not be warranted due to the vastness of Connecticut forests. Yet, that very vastness provides
quality vistas complemented by the permanence of parks and forests and state trails under DEP
management.

8/3/2019 State Park Economic Impact Study
http://slidepdf.com/reader/full/state-park-economic-impact-study 44/72
44
6. Total Expenditure Impacts
6.1 IntroductionThe purpose of this chapter is to establish the economic impacts of DEP parks and forests on the state
economy. Doing so depends critically on one’s view of the appropriate counterfactual. Essentially
establishing the counterfactual depends on one’s answer to the question of, “What would be lost to
Connecticut if DEP parks and forests operations did not exist?”
6.2 Counterfactual
At the extreme, green spaces could be alienated due to out-break of a disease akin to the Spruce
Mountain Budworm that is ravaging fir in the West and moving inland thereby accelerating lumber
salvaging operations to minimize forest fires and/or blight. Similarly, oil spills at seas are capable of
adversely impacting marine recreational boating. Residents and nonresidents would camp, hike andpursue other outdoor recreational activities elsewhere. Further, recreational angling would be curtailed
by eliminating hatcheries and the state’s role in restocking the fishery. The angling excitement of
hooking and landing a brown trout could be eradicated and with it, Connecticut’s appeal to anglers
threatened. Educational activities dependent on the parks and forests current physical resources would
also be forced to relocate or be curtailed.
At a minimum, the perception of permanence related to DEP parks and forests would be eroded. Risks
related to humans misusing what is now green space, managed by DEP, would rise, and unmanaged
hunting and angling would lead to over exploitation and eventual eradication of some species.
To assess these impacts CCEA has utilized REMI a large dynamic econometric model of the state.Because DEP’s current activities are currently part of the economy, CCEA has modeled their cessation by
deleting their direct expenditures noted above from the business as usual base case. Readers may find
this scenario overly dire, but it sets a benchmark for understanding the importance of DEP continuing to
provide solid management of the states’ parks, forests and other venues.
The impacts differ when the amenity values are included or not so that two scenarios are presented.
The direr scenario assumes that there are catastrophic effects on forest and park land as described
above and includes the alienation of amenity benefits on property owners and participant in all of the
activities that have been shown to accrue to Connecticut participants. The second assumes that
benefits of overlooking forests and park land remain intact so that amenity benefits and governmentrevenues stemming from them remain.
To the extent that DEP type operations were pursued by other parties, such as conservation societies
and commercial fishery associations restocking the fisheries, these results would be somewhat
ameliorated. There is sufficient detail elsewhere in this report for readers to make judgments
concerning such possibilities.

8/3/2019 State Park Economic Impact Study
http://slidepdf.com/reader/full/state-park-economic-impact-study 45/72
45
6.3 Direct Expenditures Dependent on DEP Park and Forests Related Activities
Operation of the REMI model to simulate the economic impacts involves converting all the above direct
expenditures to 2008 dollar values, summarized in Table 6.3.1 using normally expected escalators or
deflators. The economic impacts have been assessed initially with reference to the amenity benefits
from consumer surpluses directly related to recreational activities attributable to DEP venues but not
the larger ones related to land values. It simulates a case in which the foliage in DEP-managed parks and
forests remains. The second scenario takes the land-based amenity benefits emanating from state parks
and forests into account, by assuming that without DEP’s husbanding they do not survive. Adjusted to
2008 dollars, total expenditures by visitors to DEP venues for the activities are specified in Table 6.3.1.
Once converted to 2008 dollars these expenditures exceed a billion dollars annually for each of 2009
and 2010 even without including any of the amenity values. The amenity values accruing to Connecticut
residents note in the Executive Summary and the previous chapter generate annual benefits of $300
million annually.
In addition to operating costs, DEP capital costs amount to about $1.75 million annually. They too are
foregone in both cases.
The results of both scenarios have to be treated with care. Without survey data CCEA has no ground on
which to allocate visitor total trip expenditures to DEP-managed venues or other Connecticut
attractions. What is modeled here are the total expenditures which would be true if the expenditures
were wholly attributable to DEP-managed venues. To the extent that visitors come for other reasons –
to see old friends and family, to tour New England beyond the realms of Connecticut and visit along the
way – the results exaggerate impacts of the DEP-managed venues per se. Based on estimates of other
multipliers using similar techniques allocating about a sixth of the impacts to DEP would appear to be
appropriate. Yet if comparisons are being made to studies that claim a magnetic tourism site attracts
more general spending, then the larger multipliers attained in the study are useful for comparisonpurposes. But the point is that without survey data to legitimately distribute trip expenditures in
Connecticut to activities tied to DEP’s actions from other activities that are not, drawing the fine line of
attribution is well nigh impossible.
The main source of recreational expenditures tied to DEP operations is clearly general tourism followed
by fishing, hunting, and boating utilizing DEP launch sites. Recreational boating is a major sporting
activity in Connecticut but it is impossible to allocate all these expenditures to DEP, albeit it clearly plays
a role in training in safe operations and licensing boaters and in facilitating recreational boat launches,
and restocking the fishery. Connecticut’s safety record in water-based recreational venues is very good.
Impacts on government revenues, again converted to 2008 dollars, are summarized in Table 6.3.1. The
state government benefits from operating revenues generated both directly and via the tax system from
DEP’s undertakings. Key operating activities clearly focus on angling and hunting licenses followed by
the parks and forests operations. The fee increases in 2010 have substantially increased revenues from
those operations and are likely to continue to do so over the coming years. While the figure for
licensing revenue is indicative of revenues to the government in forthcoming years, the 2010 annual
revenues used in the model net out the $1.2 million credit in operation until mid March of 2010.

8/3/2019 State Park Economic Impact Study
http://slidepdf.com/reader/full/state-park-economic-impact-study 46/72
46
Table 6.3.1 Major Visitor Direct Operating Expenditures Attributable to DEP Parks, Forests and Other
Venues (Millions 2008 $)
2009 2010
General Tourism Non-Accommodation 451.8 446.5Accommodation 95.1 97.8
Total General Tourism 546.9 544.3
Hunting 104.9 107.5
Fishing 278.3 282.5
Boating 57.6 54.0
Skiing 14.2 14.2
Harkness Memorial State Park Accommodated Activities 4.9 4.5
Educational 7.5 6.8
Total Activities 1,014.3 1,013.8
Amenity Benefits Derived from Tourism and Recreation 246.9 246.90
Amenity Benefits from Vitas 270.4 270.4Realized Government Revenues from Amenity Benefits 4.2 4.2
Total 1,535.8 1,535.3
The values in the text have been normalized to millions of 2008 dollars by applying activity level price
changes. The boating adjustment is particularly large due to prices escalations on fuel. The $1.75
million in DEP annual capital cost have to be added to the operating ones above.
The direr scenario differs from the more likely initial one in that the last two items in the above table are
included albeit they are excluded in the initial scenario so that the initial one envisages the green space
continuing whereas the dire one does not.
Additions to the value of residential capital add more than a quarter of a billion dollars to those values.
These numbers exclude incremental values on land overlooking DEP managed venues that is either
unused or dedicated to use by other than single dwellings. Due to the perceived permanence of state
green spaces, there is a direct contribution to these assessed values by DEP’s operations. These
enhanced assessments increase property taxes that flow annually to local and state revenues. At
current average property rates of 2.2%, this increase in assessed property values add another $3.1 to
$5.4 million (2010$) in annual government revenues. Both the amenity values of overlooking DEP
managed venues and the resulting tax revenues are included the Table the mid points of their two
estimates discussed in Chapter 5.

8/3/2019 State Park Economic Impact Study
http://slidepdf.com/reader/full/state-park-economic-impact-study 47/72
47
Table 6.3.2 Revenues Accruing Directly to Connecticut’s General Fund from DEP Managed Parks,
Forests and Other Venues Including Amenity Related Property Tax Revenue Contributions
(Millions 2008 $)
2009 2010
Operations
Fees at Parks and Forests 3.3 5.2
Fishing and Hunting Licenses 5.7 7.7 12.9
Boating Licensing et al 1.6 3.2
Educational 0.7 0.7
Harkness Memorial State Park 0.5 0.5
Total Operations 11.8 17.3 22.5
Realized Government Revenues from Partial Amenity Benefits 4.2 4.2
Total 16.0 21.5 26.7
From 2009 to 2010, annual contributions to the state revenues by DEP increased from $16.0 to $21.5
million. In the future, the credit program will no longer apply, further boosting revenues by $1.1 million.
In addition, DEP activities were also supported by Federal Grants worth $5.4 million dollars. The federal
Sport Fish Restoration (SFR at $3.1 million) and Wildlife Restoration (WR at $2.3 million) programs
contribute to the fish and wildlife funding stream. The federal funding source is a user pay-user benefit
program which collects excise tax revenue from manufacturers of hunting and fishing equipment (and
other related sportsmen sources) and is deposited into a dedicated account. The revenue is distributed
back to the states to fund fish and wildlife restoration projects through SFR and WR grant programs
administered by the U.S. Fish and Wildlife Service. These are not federal appropriated monies from
general taxpayers allocated through the typical budget process. It is a permanent indefinite
appropriation based on the collection of hunting and fishing equipment excise taxes, import duties,
motorboat fuels tax and other revenues collected during the previous fiscal year and allocated back to
the states through a formula based on land area, population and paid license holders. These are
revenues generated solely from users, the sportsmen buying the equipment.
6.4 Economic Impacts
6.4.1 Introduction
Since these activities are already including in the REMI business as usual bass case, their full economic
impacts are assessed by deleting them from the base forecast. To fully understand the dynamics of
these impacts, all DEP activities are modeled by permanently deleting them from the economy. That isthe 2012 loss is extended out to 2040.
Readers are forewarned that to the extent that visitors come for other reasons – to see old
friends and family, to tour New England beyond the realms beyond Connecticut and visit
along the way – the results exaggerate impacts of the DEP managed venues per se. Based on
estimates of other multipliers using similar techniques allocating about a sixth of the impacts
to DEP would appear to be appropriate. Yet if comparisons are being made to studies that

8/3/2019 State Park Economic Impact Study
http://slidepdf.com/reader/full/state-park-economic-impact-study 48/72
48
claim a magnetic tourism site attracts more general spending, then the larger multipliers
attained in the study are useful for those purposes. Without survey data to legitimately
distribute trip expenditures in Connecticut to activities tied to DEP’s actions from other
unrelated tourism activities, distinguishing that fine line of attribution is well nigh impossible.
The impacted industries used to describe activities undertaken with in the parks and forests do not line-up precisely with those classified in REMI. For these reasons the activities at the Harkness Memorial
State Park are treated as accommodations. As noted in the previous chapters only about 1% of park
visitor expenditures occur at the parks per se. That one percent of visitor expenditures is allocated to
government revenues in REMI thereby directly reducing government revenues. Other visitor activities
are classified as recreational activities and withdrawn from the economy. The incremental assessed
value of properties overlooking the parks is treated as a loss to the residential capital base and that
portion included in the assessed value of housing declining to further erode government revenues. It
too would disappear with the disappearance of the parks and forests. Reasonably, this process leaves
the losses in accommodation to be expensed by park visitors, hunters, anglers and boaters, wedding
parties, and other participating visitors to be allocated indirectly out of their classification in“recreational activities”. Less reasonably, recreation activities in REMI include expenditures on gambling
that may not be a large share of expenditures by anglers and hunters. Advantageously, “Recreational
activities” excludes attending spectator sports and by implication includes all active sports undertakings.
Similarly, other expenditures by hunters, anglers and boaters and skiers are all included in the impact
assessment.
Since losses foregone by the discontinued operation of the parks delineate economic advantages of DEP
continuing to operate them, the results are described positively as the economic impacts of DEP’s state
parks and forests operations.
DEP parks and forests operations have significant impacts on the economy, particularly employment,
incomes, migration, and the state’s fiscal operations.
6.4.2 Population; DEP and the Quality of Life Matters
Chart 6.4.2.1 illustrates that quality of life matters to Connecticut Citizens. Operations at DEP sites and
the resulting access to recreational locales and husbanding vistas of overlooking DEP managed venues
were preserved, over the long term retains about 26,700 people in Connecticut. Of these 10,400 are
dependent of DEP’s long-term husbanding of the vistas while the rest rely on the venues for sporting
activities including camping and/or employment.

8/3/2019 State Park Economic Impact Study
http://slidepdf.com/reader/full/state-park-economic-impact-study 49/72
49
Chart 6.4.2.1 Population and the Quality of Connecticut Life and DEP Managed Venues
(People)
6.4.3 Jobs
As the previous chart suggests DEP not only provides direct jobs but also assists in generating indirect
and induced ones though retaining Connecticut tourists and attracting out-of-state tourists. Both DEP
expenditures and total expenditures by those tourists who attend DEP managed venues generate
economic activity. Jobs needed to meet these demands appear in Chart 6.4.3.1. The dynamics behind
this chart depict the levels of job creation attributable to those expenditures. These impacts are larger
immediately than over time since without DEP managed venues the economy would slowly adjust as
people find alternative jobs and occupations, visitors pursue other activities within the state and other
economic and demographic adjustments occur.

8/3/2019 State Park Economic Impact Study
http://slidepdf.com/reader/full/state-park-economic-impact-study 50/72
50
Chart 6.4.3.1: DEP and Related Expenditure Impacts on Connecticut Jobs
REMI results indicate that Connecticut jobs dependent directly and indirectly on DEP parks and forest
operations and related tourist expenditures are 9.0 to 6.0 thousand. Most of the impact of this job
creation is in the private sector. Albeit REMI estimates direct, indirect and induced short-term losses in
the public sector are in the range of 900 to 1,000, including DEP jobs. These jobs are a mixture of full
and part-time annual employment inclusive of those who serve DEP directly as well as those in other
departments indirectly involved in meeting the needs of related tourists and sportspersons undertaking
DEP related activities. Given seasonal hires for park and forest activities, the public sector job numbers
are not unexpected. The dynamic elements of REMI, particularly DEP role in retaining the population all
suggest that DEP’s role is ongoing and positive.
As Chart 6.4.3.2 illustrates key sectors of the Connecticut economy are reliant on DEP’s catalytic role in
encouraging expenditures in Connecticut. Interestingly the dynamics are such that over time they do
not recover particularly well. The recovery that does occur does so at differential rates with very little
recovery in accommodations but slightly greater resilience in arts, entertainment and recreation.

8/3/2019 State Park Economic Impact Study
http://slidepdf.com/reader/full/state-park-economic-impact-study 51/72
51
Chart 6.4.3.2: DEP and Related Expenditure Impacts on Connecticut Jobs by Key Sectors: Vistas
Impacted
6.4.4 Current Personal Income
Dependence on DEP parks and forests operating jobs as well as the population stability associated with
DEP’s operations also implies a positive role in income generation. DEP’s operations and participation in
tourism activities enhanced by sporting activities generate significant personal income in current dollars
as shown in Chart 6.4.4.1. These values are in current dollars and rise over time on the strength of the
stronger economy generated by those expenditures over time.
Exclusive of the amenity benefits attached to land values DEP’s operations enhance personal incomes by
$343 million in 2012 rising to $1.8 billion by 2040. Inclusive of the amenity values attached to vistas
attributable to DEP, Connecticut personal income is higher by $367 million in 2012 rising to $2.7 billion
in 2040.

8/3/2019 State Park Economic Impact Study
http://slidepdf.com/reader/full/state-park-economic-impact-study 52/72
52
Chart 6.4.4.1: Personal Income Generated by DEP’s and Attracted Tourism Activities
(Millions of Current $)
6.4.5 Personal Disposable Income
Personal Disposable Income is important because it expands the freedom of choice available to
Connecticut consumers. Chart 6.4.5.1 illustrates that DEP operations and attracted tourism and
sportspersons’ expenditures stimulate that income stream. While following the same general pattern
as personal income, the incremental PDI values are smaller with DEP operations adding to $253 million
in 2012 and $1.5 billion by 2040 exclusive of the decline in vistas. Inclusive of the vista’s DEPs
preservations its impact on personal disposable income rises from $269 million to $2.3 billion across the
years.
Chart 6.4.5.1: Personal Income Generated by DEP’s and Attracted Tourism Activities
(Millions of Current $)
8/3/2019 State Park Economic Impact Study
http://slidepdf.com/reader/full/state-park-economic-impact-study 53/72
53
6.4.6 Fiscal Impacts
Fiscal impacts work through a series of mechanisms on both government revenues and expenditures.
DEP operations generate revenues for the state government and enhance revenues from the higher
assessed value of properties overlooking DEP parks and forests. Indirectly the state government also
receives funds through various taxes on tourism expenditures and indirect and induced transactions and
incomes related to the expenditures undertaken by visitors to DEP managed venues inclusive of taxes on
incomes from personnel at DEP and who are employed indirectly in the supply of goods and services to
DEP facilities. The scenario that excludes DEP’s husbanding of the states forests indicates that the net
present value of DEP’s revenues from 2012 to 2020 of $337 million against expenditures of $307 million
for a net gain of $30 million. These are not operating revenues and expenditures but the totality of
direct, indirect, and induced impacts fiscal capacity.
The other scenario that includes the husbanding of vistas gives contrary results. It indicates that the net
present value of DEP’s revenues from 2012 to 2020 of $628 million against expenditures of $420 million
for a net loss of $208 million. This later scenario is also picking up the lack of assessment on the amenity
benefits from overlooking DEP managed parks and forests. Assessing those values in the sameproportions as market values are normally assessed elsewhere would more than reverse this finding.
Adverse impacts on government expenditures ebb as fraction of the initially unemployed find
alternative employment and the population diminishes; thereby reducing unemployment and welfare
expenses.
6.5 ConclusionsLeaving aside the amenity values of overlooking DEP’s venues:
DEP managed venues initially generate the following direct and indirect economic impacts:o 8.8 thousand jobs currently reduced to 6.7 thousand in 2020;
o $343 million in personal income growing in current dollars to $595 million in 2020;
o $253 in personal disposable income, that generates choices for citizens, increasing to
$471 million by 2020; and,
Net present value in state revenues over expenditures of $30 million is in constant dollars.
7. ConclusionsIn 2010, resident and nonresident visitors to Connecticut’s 107 State Parks and 32 Forests spent 8.5
million days touring within the state. Of those days, at least 4.6 million days were spent partially atfor-fee parks and forests managed by DEP.
In 2010 visitors to these venues spent an estimated $544 million in general tourism activities in
Connecticut. In addition, 189,000 sportspersons, holding 293,600 licenses and permits issued by DEP,
expended additional funds to pursue their specific sporting activities:
o $264 million for fishing, of which 90% came from Connecticut residents;
8/3/2019 State Park Economic Impact Study
http://slidepdf.com/reader/full/state-park-economic-impact-study 54/72
54
o $100 million for hunting, of which $95.1 million came from Connecticut residents;
o $36.8 million for recreational boating, attributed to DEP-managed boat launches and
training activities, net of anglers’ boating expenditures;
o $26.2 million for skiing and attending educational and other venues;
o Participation in other sports located in the parks and forests or to attend them.
Visitor fees at the parks and forests, including late day visitors, were in the $3.0 to $3.3 million dollar
range from 2005 to 2009. Increasing rates in 2010 set the stage for an increase to $5.2 million in future
years. These same visitors are estimated to have spent $94 million in Connecticut. DEP charges
visitors: entrance, parking, and camping fees, cabin and pavilion rents, ice and firewood sales and
related sales taxes. These revenues all flow to Connecticut’s General Fund.
Recreational activities also generated licensing and permit fees as well as training and educational
revenues. 2010 revenues generated from DEP licensing and permitting of key activities included
angling ($3.8 million), hunting ($2.3 million), and combined hunting and angling licenses ($1.6 million).
Recreational boat training, testing, and licensing generated a further ($3.2 million.)38. Including
camping and all activity fees, DEP collected $18.3 million from fees paid by participants and attracted
$5.4 million in federal transfers from the federal Sport Fish Restoration (SFR) and Wildlife Restoration
(WR) programs. Before taking account of a one-time $1.1 million credit program to assist adjustment
to the higher fees, 2010 direct revenues and transfers covered all but $2.6 million of Connecticut state
expenses of $26.3 million including parks, forest and hatchery operations. Property taxes stemming
from vistas dependent on DEP managed venues added a $4.2 million to state revenues, more than
sufficient to cover DEP operating and capital expenditures. In addition, indirect revenues from other
taxable tourist and sporting expenditures further contributed to state revenues.
The well known downward slope of demand curves for each activity implies that all but the least
enthusiastic person undertaking each activity derives quality of life benefits over and above expenses
incurred, what economists refer to as “Consumer surplus”. CCEA has estimated consumer surpluses
accruing to Connecticut citizens by major activities:
o Camping (S124.1 million)
o Hunting ($17.8 million)
o Inland Angling ($67.4 million)
o Marine Angling ($36.9 million)
o Swimming/day use at four parks ($570,000).
In addition to the $246.9 million accruing to residents in consumer surplus, out-of-state visitorsundertaking these activities derived a further $25.1 million in consumer surplus, led by campers at
$18.4 million. Total estimated consumer surplus for campers at DEP venues is 26% of Connecticut
tourism expenditures made by them.39 In-state estimates of consumer surplus remain modest due to
38These revenues were partially offset on a one-time credit totaling about $1.14 million.
39Strauss, Charles H. and Lord, Bruce E. A Case Study The economic impacts of a heritage tourism system, Journal
of Retailing and Consumer Services 8 (2001) 199}204
8/3/2019 State Park Economic Impact Study
http://slidepdf.com/reader/full/state-park-economic-impact-study 55/72
55
the close proximity of venues to the population. CCEA did not extrapolate its consumer surplus
estimates for people using these parks for alternative purposes or accessing fee-free parks, such as
non-developed ones.
Consumer surpluses in addition to their expenditures suggest that, in recent years, visitors to DEP
managed venues derived more than $1.25 billion dollars in annual benefits. CCEA’s very conservativeapproach to estimating consumer surpluses underlines the significant of these estimates.
Another source of benefit is the value that owners of homes adjacent to the parks and forest derive.
Connecticut residents overlooking the parks from single family dwellings realized annual amenity
benefits most days of the year of a further $258 to $309 million. Positive attributes of these
residences, captured in the assessed value of their properties, generated $3.1 to $5.4 million annually
in government revenues, but did not account for the value of the vistas of overlooking DEP managed
parks and forests. The expected long-term net present value of this possible revenue stream to the
state discounted at 5% over 20 years is $390.2 to $679.7 million in 2010 dollars. The net present value
may also be viewed as placing a capital value on the assets that DEP maintains in its management of
Connecticut parks and forests. More fully assessing amenity values, from their currently unassessed
status on 12-13% of properties overlooking green spaces, would significantly increase property tax
revenues.
Because DEP operations and related government revenues already exist in the economy, the method
for assessing their economic impact is to withdraw those activities. That is, to assess the impacts of
their hypothetical immediate cessation in 2012, and then to project longer term economic
adjustments and reactions. The resulting differences represent economic impacts of DEP-managed
venues in Connecticut. With closure of all DEP-managed facilities and elimination of all public access
to DEP-managed forest and park lands, the resulting impacts would mean losses in employment and
incomes, as well as losses in tax revenues. The harshness of such losses in the near term is stark, but
the dynamic elements of the economy which REMI captures adjust to the loss of those resources; thus
the economy adjusts and ameliorates to a degree those economic impacts over time through by
emigration or some and movement into alternative jobs for others. Rather than depict these losses as
negatives, this report treats them as the positive impacts that DEP operations have on the Connecticut
economy. Leaving aside the amenity values of $270 million annually for overlooking DEP’s venues,
DEP activities generate the following direct and indirect economic impacts:
8.8 thousand jobs currently, reduced to 6.7 thousand in 2020;
$343 million in personal income growing in current dollars to $595 million in 2020;
$253 in personal disposable income, that generates choices for citizens, increasing to $471million by 2020; and,
Net present value in state revenues over expenditures of $30 million in constant dollars.
DEP managed venues create significant economic activity within Connecticut.

8/3/2019 State Park Economic Impact Study
http://slidepdf.com/reader/full/state-park-economic-impact-study 56/72
56
Appendix A: Data
A-1. Background
Three DEP data sets were the foundation for this research report:
1. Individual park users, rates and numbers of purchasers by activity – parking, camping or
firewood or ice purchases, 1999 - 2010;
2. Total visitors by park, 2005 – 2009, including the above, plus out-of-season and off-hour visitors;
3. A 2008 survey of 3,000 tourists.
The objectives when analyzing available data are to discover per capita and total expenditures for thosewho visit Connecticut’s parks. The data are sufficiently granular to be able to attain this information for
state residents and out-of-state visitors, for state parks and state forests. With expenses in park camping
facilities significantly lower than accommodation costs in paid lodgings, total per diem expenditures for
campground users are adjusted to take these savings into account.
In addition to the three primary data sets identified above, a further round of extrapolations was made
to acknowledge activities in fee-free parks and forests where no or attendance counts are kept, and for
parks and forests which are under development, which also lack attendance data. In addition, explicit
references are made to information from the Connecticut Statewide Comprehensive Outdoor
Recreation Plan 2005-2010 (SCORP)40.
A-2. Melding the Data Sets
Data set elements and their treatment are outlined in Table 1. The estimating procedures discussed in
column one use both park User data and information from the intercept survey. In the interests of
clarification, the references to the intercept survey are in italics. The resulting estimates and data
appear in the text of the paper.
40DEP, Connecticut Statewide Comprehensive Outdoor Recreation Pan 2005-2010, 2006.

8/3/2019 State Park Economic Impact Study
http://slidepdf.com/reader/full/state-park-economic-impact-study 57/72
57
Table A-1: Data Set Elements for Park Users Other than Anglers and Hunters
Park User Data by Parks
1999-2010
Park Visitor Data
2005-2009
Intercept Survey Data
2008
Number of Users and Expenditures Number of Attendees Visitor InformationDays of Parking: Resident & Non-Resident Total Gate Counts of Individuals Trip Length or zip codes
Days of Camping: Resident & Non-Resident Average Numbers in Party
Days of Sales of Ice & Firewood Expenditures by Type by Party
Rental days for Cabins and Pavilions
CoverageEach Included State Park (#=32) Each State Park (#=43) Sample of 3,000 Tourist Parties
of which 5% used campgrounds
Each Included State Forest (#=4) Each State Forest (#=12)
Other1
(#=4)
Enhanced DetailParking and Camping Differed by Park, Vehicle
Type – car, minibus, bus or Walk-Ins – over
Weekdays and Weekends by Residents or Non-
Residents. It was assumed the purchases of
seasonal passes were economically rational andvisited at least 12 times per year, the annual
frequency needed to justify having a season pass
rather than paying for parking on each visit.
These data exceeded the numbers of
people from the park user data for
each park included there due to the
inclusion of out-of-season and off-
hours attendees. Additional parksand state forests were also included.
This data allowed us to separate
accommodation and non-
accommodation expenditures.
There was separate information
for residents and non-residents.DEP has confirmed
that the information on,
”Average/Spending /Party/Trip”
is for average daily expenditures.
MeldingNumber of Residents Days = (Resident vehicles +
Camping Parties)*( Average occupants/Resident
vehicle)+ Walk-in campers+ Other resident
Additional visitors to the 36 parks
and forests = the number of visitors
to each park less those included in
Column 1; assumed to be the same
proportion of residents and non-
residents as in column 1.
Number of Non-Residents from parallel equation. Parallel to the above.
Expenditures by Residents = (Number of ResidentParties)*(Resident Expenditures by Party less
Average Accommodations Expenditures +
Accommodation Expenditures for Camping)
Because out-of-season and off-hoursresident attendees did not pay
camping charges, the per capita costs
from the data in column 1 less the
accommodation charges were
applied to those staying in the 36
parks or forests included in column 1.
Expenditures by Non-Residents from parallel
equation using non-resident data
Expenditures by Non-Residents from
parallel equation using non-resident
data.
The above were derived in aggregate and in per
capita terms and for both state parks and state
forests. Because Pachaug is a state forest, state
forests data include the three designated as state
parks plus Mt Misery/Pachaug with the latter beingdeleted from the state park data. This approach is
consistent with the Park Visitor data where Mt
Misery is excluded.
Resident visitors to those parks
excluded by the 36 included
heretofore in camping and parking
data, were treated similarly but with
normal accommodation dataincluded because these parks do not
generally provide such facilities.
Non-resident data were treated as
above.
Separate estimates were made by
state parks and state forests.
1. “Other” includes DEP operations of its Store & Conference Center, relatively minor items.

8/3/2019 State Park Economic Impact Study
http://slidepdf.com/reader/full/state-park-economic-impact-study 58/72
58
Appendix B: Campsites
Table B-1: Campsites
Park Number of Campsites
State Forests
American Legion 30
Pachaug 40
Total State Forests 70
State Parks
Black Rock 91
Devil’s Hopyard 21
Hammonasset 550
Hopeville 80
Housatonic Meadows 95
Kettletown 68
Lake Waramaug 78
Macedonia Brook 51
Mashamoquet Brook 60
Rocky Neck 160
Salt Rock 71
Total State Parks 1325
Grand Total 1395
Source: DEP website

8/3/2019 State Park Economic Impact Study
http://slidepdf.com/reader/full/state-park-economic-impact-study 59/72
59
Appendix C: Technical Considerations: Elasticities and Consumer
Surplus
This section will define consumer surplus and describe the appropriate method for applying it to our
data. We build the formula for defining the distance travelled by day trippers, an important componentof consumer surplus for Connecticut parks and forests, and then describe, through the use of a proxy,
how this relatively small user group benefits from this consumer surplus.
C.1 Consumers Surplus Definitions
Quantifying the benefits to an individual or a group of a highly-differentiated, somewhat subjective good
is a notoriously challenging task for economists. Parks, recreation areas, and other similar venues are,
to a considerable extent, such complex goods. While we do have some empirical survey data that
indicates visitors’ willingness to pay park fees, the full range of consumer benefits depends on a myriad
of variables.
Consumers’ surplus41 can be thought of simply as the benefits a visitor gets, in aggregate, from the use
of some good or resource, in this case, recreation areas, beyond the payment required to obtain that
benefit.42 That is why it is referred to as “Surplus”. As the economist Frank Cesario stated over thirty
years ago, “The Consumers’ surplus criterion is gaining widespread acceptance as a way of estimating
the primary economic benefits of outdoor recreation sites and facilities.” (Cesario, 1976) This approach
remains the most widely used and accepted methodology today.
Even in the presence of comprehensive data, obtaining a reliable measure of consumers’ surplus can be
challenging. In an “ideal” world, an economist could/would simply calculate the appropriate portion of
the area underneath a suitable demand function to obtain the desired value.43 Such an approach is not
only accurate, but, depending on the functional form of the demand- function’s equation, relatively easy
to calculate. However, working with real-world empirical data is not formulaic but quite challenging.
The foundation for a demand function lies with a consumer’s (or several consumers’) preferences.
However, as the economist and author Hal Varian correctly noted, “In real life, preferences are not
directly observable.” Therefore, we must – again in Professor Varian’s words – “discover people’s
preferences from observing their behaviors.”44
41 “Consumers’ surplus” should not to be confused with, or substituted for, “consumer’s surplus”; the former is a
measurement of benefit to one individual, while the latter represents the benefits to an entire group. See Mas-
Colell, Winston, & Green (1995) for additional information.42
“*Consumers’ surplus+ measures the net benefit from consuming n units of the discrete good: the utility u(n)
minus the reduction in the expenditure on consumption of the other good.” (Varian, page 353) 43
“Calculation of the consumers’ surplus associated with any recreation site involves measurement of a relevant
portion under the demand curve for the services of the site.” (Cesario (1976)) 44
OpCit, p.535.

8/3/2019 State Park Economic Impact Study
http://slidepdf.com/reader/full/state-park-economic-impact-study 60/72
60
Most academic literature focuses on the “revealed preference approach”, tracing its roots to the
seminal 1938 Economica paper by Paul Samuelson.45 Since then, numerous authors have evaluated,
augmented, and refined this approach. The primary assumption is “that people are choosing the best
things they can afford – that the choices they make are preferable to the choices that they could have
made.”46 Or, in slightly different language, the revealed-preference approach assumes each individual is
making rational, consistent choices – decisions that reflect their practical wants and desires.
The revealed-preference approach relies, therefore, on extracting a generalized set of aggregate
preference relationships from available data.47 There are two primary methods for collecting such
observations: direct and indirect. (Smith, Desvousges, & Fisher (1986)) More specifically, the imputed
demand curves for outdoor recreation are usually obtained via a “travel-cost technique”48, by using
survey data gathered from patrons49, or by some combination thereof. (Englin & Cameron (1996),
Adamowicz, Louviere, & Williams (1994))
When choosing from the three aggregate preference measurements (travel-cost, survey, and a
combination thereof) for parks, forests, or other venues, the general benefits and limitations are actively
debated by academic researchers – as well as the appropriate use-cases for each. (Smith, Desvousges, &
Fisher (1986)) However, given the specific task at hand and the data available, we have chosen the
travel-cost technique for this study. And in doing so, we have extracted a generalized, aggregated
demand function (or curve) for recreational services in the State of Connecticut.
C.2 Consumers Surplus Estimates
Travel cost estimates of the value derived from outdoor recreation assume a revealed preference in the
relationship between participants’ costs of traveling to a site and the number of trips they make.
Individuals who live farther from a destination generally spend more time and money to visit the
destination and typically make fewer trips than those in closer proximity. In simple terms: if people are
45See Samuelson (1948) for additional treatment of this topic.
46Varian (pages 120, 121)
47It should be noted that such an approach is challenging to implement, even under the best of circumstances. As
such, considerable research has been done that highlights the practical issues underlying the estimate of a general
demand function from empirical data. See Brown & Nawas (1973), Smith & Kopp (1980), and Common, Bull, &
Stoeckl (1999).48
The most widely utilized version of which – following the nomenclature employed by Cicchetti, Fisher, & Smith
(1973) – is the “Hotelling-Clawson-Knetsch” approach, commonly abbreviated as simply the “HCK method.” Or, as
Garrod & Willis (1991) state, “Consumer surplus for outdoor recreation has traditionally been estimated by a
Clawson-Knetsch travel-cost method.” A more accessible, user-friendly, contemporary summary can be found of
Professors’ Dennis King (University of Maryland) and Marisa Mazzotta’s (University of Rhode Island) website.
(http://www.ecosystemvaluation.org/travel_costs.htm)
49The use of survey input/data is one of the most frequently utilized types of contingent valuation methods (CVM),
particularly when analyzing outdoor recreation areas. See, for instance, Mitchell & Carson’s book. Additionally,
Professors’ King and Mazzotta’s web site also provides information on this topic.
(http://www.ecosystemvaluation.org/contingent_valuation.htm)
8/3/2019 State Park Economic Impact Study
http://slidepdf.com/reader/full/state-park-economic-impact-study 61/72
61
willing to spend $ X per trip to visit and to visit a destination y times, they must be confident they are
getting satisfaction worth at least y*$ X from doing so. The non-monetary value that visitors receive
above direct expenditures is known as consumer surplus.
Several states (see section C.5, Literature, below) have conducted intercept surveys to estimate the
travel time and number of trips for park users. Although survey data are not available for Connecticut,the state does collect addresses for all individuals who reserve camp spaces and purchase licenses and
permits for hunting, and marine and inland fishing. Nonresidents can also purchase many of these
licenses. In the case of marine fishing licenses, Connecticut, Rhode Island, Massachusetts and New
York offer reciprocity. With DEP’s database limited to Connecticut licensing, the estimate for
consumer surplus results in lower values, particularly for the state’s marine resources. Ideally research
would be conducted among all members operating under reciprocity agreements. Connecticut DEP
does not maintain addresses for individuals who engage in other activities than hunting and fishing.
This management choice results in an underestimate of the full consumer surplus generated by
Connecticut’s state parks and forests.
To calculate the consumer surplus value, we start from auto fuel and vehicle costs. Federal per mile
reimbursement is $0.5865 per mile. Other studies have estimated time costs associated with travel and
park participation and other out-of-pocket costs. (Weiland and Horowitz, 2007). The impact of out-of-
pocket costs are estimated in the previous analysis,
Estimating the aggregate of non-pecuniary cost inputs, such as (a) time spent travelling and (b)
enjoying park facilities, is problematic for two reasons. First, methodologies are unclear for valuing an
hour of leisure or travel time. An opportunity cost approach would value that time at market wages,
though recent discussions suggest leisure time should be valued at less than market rates. Further,
because we include non-residents travelling, in some cases from long distances, it is unclear what cost
value can be assigned to their travel time. For these reasons, only the cost of travel is included in this
analysis. In doing so CCEA likely understates derived consumer surpluses.
The distance traveled by each consumer holding either a DEP license or permit from residence to the
appropriate facility was evaluated by several functions in ArcGIS 10. DEP license data was organized
into “CATEGORY” fields, whether a permit was for fishing (Marine or inland), hunting, trapping
(counted with hunting), or the combo license, hunting and angling. Whenever a consumer purchased
more than one permit belonging to the same category, we kept only one record in each category, to
prevent double-counting for the same type of permit. Also, licenses issued to residents of Alaska and
Hawaii, and to non-U.S. citizens were removed for the purpose of this project. Connecticut residents
and non-residents were kept separate for several reasons.
DEP supports Geographic Information System (GIS) processing, providing down-loadable shapefiles of
all DEP properties in the state through its GIS clearing-house50. We selected those listed as State
Forests and State Parks and others discussed in this report. Using DEP web-site list of facilities, we
50http://www.ct.gov/dep/cwp/view.asp?a=2698&q=322898#Property

8/3/2019 State Park Economic Impact Study
http://slidepdf.com/reader/full/state-park-economic-impact-study 62/72
62
identified facilities that match our Category lists described above. Visitor addresses were geocoded,
and Parks were selected using the “SELECT BY ATTRIBUTE” option in ArcGIS’s Attribute Table.
CCEA’s first attempt to extract a distance report as “miles traveled along roads”, using the ArcGIS
function, required changing the GIS basis from a vector to a raster f ile. CCEA’s lesson was that a large
data file does not process in this ArcGIS function. Please contact CCEA if you wish to learn the specificsof this roadblock. Next, CCEA tested the “NEAR” search function in ArcGIS, which matches each input
feature (the consumer) to the “objective” (the DEP facilities of interest), providing output of the closest
linear distance. Because a straight line is the closest distance possible, this approach is slightly
conservative. Also, assuming the consumer attended the closest park adds another conservative
component. This analysis uses a travel cost of $0.5865 per mile for each round trip; i.e. twice the
estimated distance.
In an “ideal” world, an economist would next calculate the consumer surplus area underneath a suitable
demand function to obtain the desired value.51 Such an approach is not only accurate, but usually
relatively easy to calculate, depending on the mathematical equation for the applicable demand-curve.
However, as is virtually always true when working with real-world, empirical data, the research situation
may be more challenging than the academic statement of the solution.
The foundation for a demand function lies with a consumer’s (or several consumers’) preferences.
However, as the economist and author Hal Varian correctly notes, “In real life, preferences are not
directly observable.” Therefore, economists discover people’s preferences from observing their
behaviors.
The basic demand curve is estimated by variations on the following equation:
ln q C
Where q is the number of trips, C is the travel cost and is the weighted error term. Consumer surplus
is calculated by transforming
ln q q (i.e. taking the exp {taking the natural logarithm or the log linear function})
and integrating over C to estimate the area under the curve. The base function is an exponential
functional form.
To estimate the consumer surplus, general linearized models (GLM) were fitted to each category of
data. Models were tested as linear or quasi-linear, assuming underlying normal and Poissondistributions. In each instance, the quasi-linear normal model was either equivalent to the Poisson
regression or superior based on ANOVA analysis. However, the quasi-linear models were adjusted for
heteroskedasticity using iterative processes to develop weights. Because of the large data samples,
51 “Calculation of the consumers’ surplus associated with any recreation site involves measurement of a relevant
portion under the demand curve for the services of the site.” (Cesario (1976))
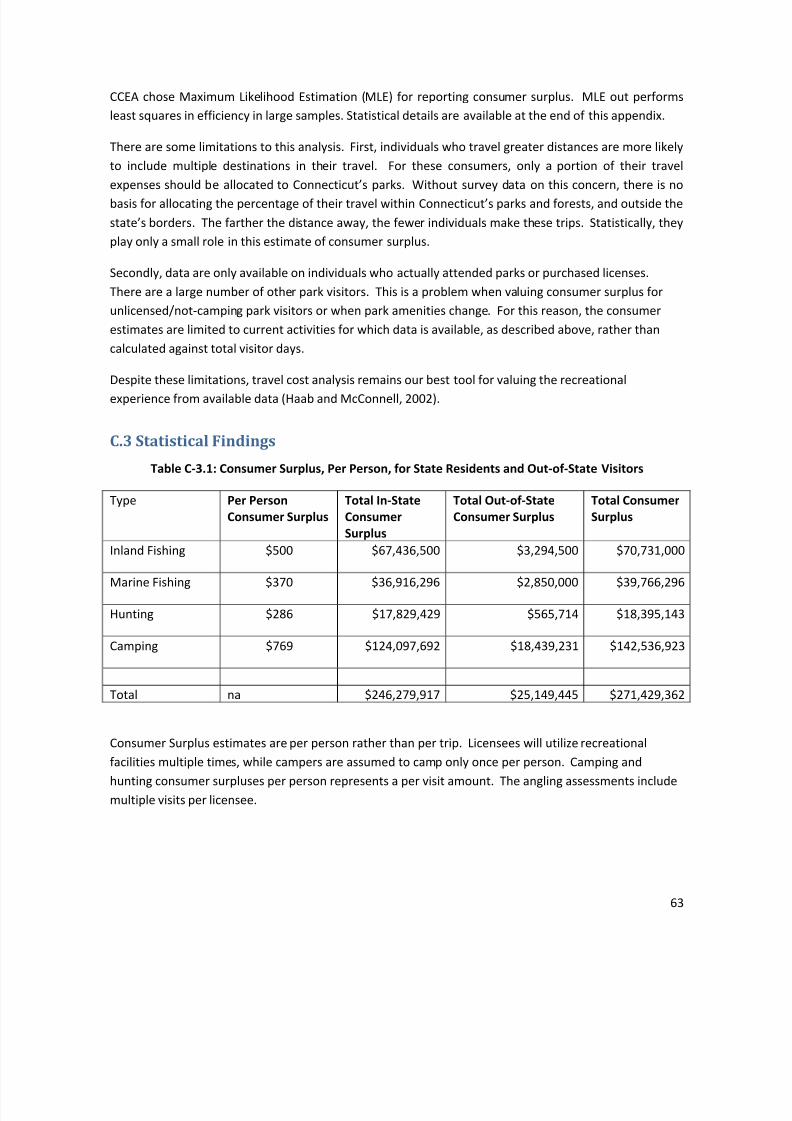
8/3/2019 State Park Economic Impact Study
http://slidepdf.com/reader/full/state-park-economic-impact-study 63/72
63
CCEA chose Maximum Likelihood Estimation (MLE) for reporting consumer surplus. MLE out performs
least squares in efficiency in large samples. Statistical details are available at the end of this appendix.
There are some limitations to this analysis. First, individuals who travel greater distances are more likely
to include multiple destinations in their travel. For these consumers, only a portion of their travel
expenses should be allocated to Connecticut’s parks. Without survey data on this concern, there is nobasis for allocating the percentage of their travel within Connecticut’s parks and forests, and outside the
state’s borders. The farther the distance away, the fewer individuals make these trips. Statistically, they
play only a small role in this estimate of consumer surplus.
Secondly, data are only available on individuals who actually attended parks or purchased licenses.
There are a large number of other park visitors. This is a problem when valuing consumer surplus for
unlicensed/not-camping park visitors or when park amenities change. For this reason, the consumer
estimates are limited to current activities for which data is available, as described above, rather than
calculated against total visitor days.
Despite these limitations, travel cost analysis remains our best tool for valuing the recreational
experience from available data (Haab and McConnell, 2002).
C.3 Statistical Findings
Table C-3.1: Consumer Surplus, Per Person, for State Residents and Out-of-State Visitors
Type Per Person
Consumer Surplus
Total In-State
Consumer
Surplus
Total Out-of-State
Consumer Surplus
Total Consumer
Surplus
Inland Fishing $500 $67,436,500 $3,294,500 $70,731,000
Marine Fishing $370 $36,916,296 $2,850,000 $39,766,296
Hunting $286 $17,829,429 $565,714 $18,395,143
Camping $769 $124,097,692 $18,439,231 $142,536,923
Total na $246,279,917 $25,149,445 $271,429,362
Consumer Surplus estimates are per person rather than per trip. Licensees will utilize recreationalfacilities multiple times, while campers are assumed to camp only once per person. Camping and
hunting consumer surpluses per person represents a per visit amount. The angling assessments include
multiple visits per licensee.

8/3/2019 State Park Economic Impact Study
http://slidepdf.com/reader/full/state-park-economic-impact-study 64/72
64
Table C-3.2: Consumer Surplus – Calculated Intercept and Slope for our Licensed and Camp Reserved
visitor groups
C.4 Estimating Elasticities and Travel Time for Late Day Trippers
Since 2003, it has been possible to pay late fees rather than full-day fees, particularly at beaches. Such
fees have been differentiated between residents and nonresidents and between weekday and weekend
visitors. The advantage of such fees for both resident and nonresident visitor groups is that they afford
visitors choices based on price ranges. Especially at beaches where prolonged exposure to the sun is aconcern, this choice is available over time periods that suggest a relatively similar experience. Lower
fees, the brevity of exposure to the sun, and enhanced warmth available to late day visitors may be
preferable to some visitors relative to the full-day experience. For others the length of time at the
beach may be more important. Consumer actions reveal visitor preferences among these choices.
In addition for resident day trippers, reverse engineering reveals estimates of the average distances
travelled by various classes of visitors. The costs for a late day resident party visiting the beach are equal
to their entrance fee and travel costs to get there and back. These visitors do not generally face costs
for meals or accommodation. They are simply driving to the beach from their homes and returning to
them. They may decide to undertake other activities along the way, but those travel costs can be
considered to be allocated to those other activities.
In short, day tripper’s expenditures can be expressed as
c.4.1) Pt = Ft+Tt
Where by definition:
Statistical Slope and Y-Intercept, by Visitor Type
Inland Fishing LicenseesEstimate P- value R-squared
Intercept 5.81 <0.0001 0.49
P -0.0020 <0.0001
Marine Fishing Licensees
Estimate P- value R-squared
Intercept 6.22 <0.0001 0.65
P -0.0027 <0.0001
Hunting Licensees
Estimate P- value R-squared
Intercept 6.75 <0.0001 0.57
P -0.0035 <0.0001Camping Reservations
Estimate P- value R-squared
Intercept 6.32 <0.0001 0.50
P -0.0013 <0.0001

8/3/2019 State Park Economic Impact Study
http://slidepdf.com/reader/full/state-park-economic-impact-study 65/72
65
Pt = Price paid by the visitor party per visit in time t;
Ft = Park fees paid per party at time t; and,
Tt = Round trip travel costs per party at time t express as miles travelled times the costs per mile of
operating the average vehicle. There are of course distributions around these costs dependent on the
size, vintage, and condition of the vehicle being used, but we ignore such complications and use average
costs per mile determined by mileage charges paid by the state to people travelling on its behalf
adjusted for changes in those costs based on national pricing series for vehicle operations.
It follows immediately that their annual expenditures will be:
c.4.2) Et=Pt*Vt
Where Vt is the number of party visits in year t.
Totally differentiating this equation and setting dEt, the change in Et equal to zero obtains point
estimates of the elasticities in year t and applied slightly differently among years. Using the average of
travel costs within a given year as the estimate of travel costs within the year means that dT t =0 within
any given year. Yet between years, dT will only equal zero if travel costs remain the same in both years.
These conditions are useful to our analysis in that elasticity estimates for any given year are given by the
rate of change in the number of visits divided by the rate of change in prices. For resident trippers
elasticities within a year are expressed as:
c.4.3) et = (Number of late day visitor parties)t/number of day visitors)t/(FDt-LFt)/FDt
Because all the variables on the right hand side of the equation are known, CCEA estimated elasticities
revealed by late day trippers for 2009 and 2010 as -0.98339 and -0.79571. Yet all other things remaining
equal, we would expect these to be roughly similar between the years. The response is that at all other
things, including transportation costs were not similar. Total differentiating the inter temporal version
of the equations and reverse engineering to force equality of elasticities on expenditures per trip in 2010
to equal those in 2009, yields the amount by which transportation costs would have had to change to
maintain the equality of the elasticities as in:
c.4.4) dT2010 = ((FD2010*(LDV2010/DV2010)/e2009)-(LF2010-FD2010)
Where LDV is late day visitor parties and DV is number of day visitors.
Because people are unapt to move to adjust to higher costs of driving short distances to the beach,
c.4.5 dT2009 to 2010 =differences in cost per mile * miles driven.
The difference in costs per mile is derived from a combination of government rates grant to employees
per mile drive in 2009 of $0.58552 with an escalator for personal travel in the Northeast that grew by 8.7
52This rate is particularly researched. Employee unions insist on their members not being under reimbursed and
Auditor Generals ensure that government coffers are not being plundered.

8/3/2019 State Park Economic Impact Study
http://slidepdf.com/reader/full/state-park-economic-impact-study 66/72
66
percent from 2009 to 2010 thereby causing an increase of $0.0509 per mile. This results in an estimated
weighted round trip distance 6.4 miles. Using this distance to derive transportation expenditures per
trip incurred in undertaking beach activities for residents and the estimate of 100 miles for nonresidents
yields the transportation costs for this group. The results appear in Table c.4.1
Table C.4.1: Transportation Costs Related to Day Visitor Days (2010$)
2003 2004 2005 2006 2007 2008 2009 2010
Resident Week Day 17,867 17,681 15,079 16,309 40,478 44,223 59,524 53,144
Resident Weekend 1,529 21,973 19,471 24,442 54,259 13,672 7,803 7,218
Nonresident WeekDay 97,480 66,131 90,739 105,682 131,562 87,152 112,203 233,978
NonresidentWeekend 102,694 106,700 119,481 110,324 28,805 4,815 4,446 8,914
Total Resident 19,395 39,655 34,550 40,751 94,737 57,895 67,327 60,361
Total Nonresident 200,173 172,831 210,220 216,007 160,368 91,967 116,649 242,892
Grand Total 219,569 212,485 244,770 256,758 255,105 149,862 183,976 303,254

8/3/2019 State Park Economic Impact Study
http://slidepdf.com/reader/full/state-park-economic-impact-study 67/72
67
C.5 Literature
Very little literature has been published on the consumer surplus of American parks. The table below
summarizes the available literature.
Reference, Author, Date What's Being Measured Method Outcome
“Washington State Parks
Centennial 2013 Survey,”
Responsive Management,
2006
Use, opinions on
management and funding,
ratings, Funding for State
Parks
Telephone Survey “For the most part, they
do not want less spending
on parks, nor do they
want some parks to close.
Instead, they prefer a
voluntary fee up to $10”
per visit. Note: Do not
favor paying for parking.
“Valuing Impacts of Forest
Quality Change:
Recreation and New York's
Allegany State Park,”
James F. Booker,
Benefit per day Benefit transfer
methodology to arrive at
baseline estimates
With 1.2 million visitors
annually, Allegany State
Park generates almost $20
million ('97 dollars) in
non-priced benefits
annually.
“The Economic Value of
New Jersey State Parks
and Forests”, William J.
Mates and Jorge L. Reyes,
Revised 2006 Version.
Analysis of the Economic
Benefits of New Jersey's
State Parks
Total Economic Value
(TEV): recreational
services; direct and
secondary economic
activity; ecosystem
services; property
enhancements;
consumption goods; and
non-use values
New Jersey Economically
Benefits between $953
million and $1.36 billion
annually. Support and
estimated 7,039 jobs.
“Estimating the
Recreational Consumer
Surplus at Maryland's
State-owned Forests”,
Robert C. Wieland & Dr.
John Horowitz, 2007.
Examine the recreational
values of Maryland's
State-owned forests.
Travel cost estimates
derived from outdoor
recreation that assume a
revealed preference.
Estimated the average
per-trip value for day
visitors is $96.
In addition, Weiland and Horowitz cited an unpublished manuscript by Kaval (2007). Kaval performed a
meta-analysis of U.S. studies (1,200 observations) and determined that an average day of recreation at a
park yielded surplus of $60.50 per person per day (2006 dollars). For state parks, the figure was $53 per
person per day.

8/3/2019 State Park Economic Impact Study
http://slidepdf.com/reader/full/state-park-economic-impact-study 68/72
68
Appendix D: Reasons for Excluding Some Residential Sales from Fair
Market Prices
Non-usable codes established by OPM to avoid bias in estimating market prices and their relationships
to assessed value have been established to purge sales characterized by:
01 FAMILY Sale between members of the same family.
02 LOVE AND AFFECTION Sale in which "Love and affection" are part of the sales price. This is stated
in the deed.
03 INTER CORPORATION Sales between a corporation and stockholder, subsidiary, affiliate or
another corporation whose stock is in the ownership etc.
04 CORRECTING DEED Transfers of convenience; for example sales for the sole purpose of
correcting defects in the title (a correcting deed), a transfer for the purpose of creating a survivorship,
etc.
05 DEED DATE The date the deed was signed or date of agreement is more than six (6) months prior
to the October 1st assessment date of the current sampling year. (That is, the deed date is prior to April
1st).
06 PORTION OF PROPERTY Sales of property conveying only a portion of the property assessed as a
unit. For example, a one-acre parcel sold out of a ten-acre tract where the assessment is for a ten-
acre tract- usually called a "split".
07 CHANGE IN PROPERTY Sales of property substantially improved or changed subsequent to the
assessment date (new construction, very poor condition, fire damage, additions, and property line
changes).
08 PART INTEREST Sales of an undivided or part interest in real property. For Co ops use this code.
09 Tax sale.
10 A WILL Conveyances made in accordance with an article of the decedent's will, a grantee that is a
devisee.
11 COURT ORDER Judicial sale that is a sale from a court order.
12 NON BUILDABLE LOT Sale of a non-buildable lot to an abutting owner.
13 BANKRUPCY Sale in bankruptcy proceeding, receivership or assignment for the benefit of
creditors, dissolutions, and liquidation sales.

8/3/2019 State Park Economic Impact Study
http://slidepdf.com/reader/full/state-park-economic-impact-study 69/72
69
14 FORECLOSURE Sale of a foreclosed property.
15 GOVERNMENT AGENCY Sale to or from a government agency (local, state or federal)
16 CHARITABLE GROUP Sale to or from a charitable, educational, benevolent or religious
organization.
17 TWO TOWNS Sale of a parcel of real property assessed or located in more than one town or
state.
18 IN LIEU OF FORECLOSURE Transfer to banks, insurance companies, savings and loan associations,
mortgage companies, or any other lien holder, when the transfer is made in lieu of a foreclosure.
19 EASEMENT Sales, such as to or from public utility companies, electric, telephone, pipeline
companies or individuals. (Right of way.)
20 CEMETERY Sale of cemetery lot.
21 PERSONAL PROPERTY EXCHANGE Sale of real property in exchange for any asset other than
cash, such as other real estate, stocks or bonds, or other personal property.
22 MONEY AND PERSONAL PROPERTY Sale of real property, which includes household furniture,
machinery, fixtures, equipment, inventories or goodwill, when the cash value of such items is
indeterminable. (Note: This category does not apply to appliances or 'built-in' units, which are normally
included in the sale, for example, stove, dishwasher, wall to wall carpeting etc.)
23 ZONING Sale of property, the value of which has been materially influenced by zoning changes
effected since the last assessment date.
24 PLOTTAGE Combining two or more sites under a single ownership when each is separately
considered.
25 OTHER REASONS Ratio is either way too high or way too low. Sale, which for some reason other
than those categories enumerated above, is deemed not to be a transaction between a willing buyer
(not compelled to buy) and/or a willing seller (not compelled to sell). Explain under REMARKS.
26 REHABILITATION DEFERRED (Section 12-65c to 12-65f C.G.S)
27 RESERVED FOR OPM USE ONLY
28 USE ASSESSMENT Code 600 Sale of a property which is under a use assessment (farm, forest,
open space: Section 12-107a-f).
29 RESERVED FOR OPM USE ONLY
30 AUCTION Sales of property at a public or private auction.

8/3/2019 State Park Economic Impact Study
http://slidepdf.com/reader/full/state-park-economic-impact-study 70/72
70
Appendix E: Bibliography
E-1: Texts
Adamowicz W., Louviere J. and Williams M. 1994, Combining Revealed and Stated Preference Methods for Valuing
Environmental Amenities. Journal of Environmental Economics and Management , Volume 26, Issue 3, Pages 271-
292
Boardman, A. E., Greenberg D. H., Vining A. R., Weimer, D. L. 2006. Cost-Benefit Analysis: Concepts and Practice,
3rd Edition. Upper Saddle River, New Jersey: Prentice Hall
Brown, W. G., Nawas, F. 1973, Impact of Aggregation on the Estimation of Outdoor Recreation Demand Functions.
American Journal of Agricultural Economics, Vol. 55, No. 2, pp. 246-249, Article Stable URL:
http://www.jstor.org/stable/1238448
Cesario, F. J. 1976, Value of Time in Recreation Benefit Studies. Land Economics, Vol. 52, No. 1, pp. 32-41, Article
Stable URL: http://www.jstor.org/stable/3144984
Cicchetti, C. J., Fisher, A. C., Smith, V. K. 1973, Economic Models and Planning Outdoor Recreation. Operations
Research, Vol. 21, No. 5, pp. 1104-1113, Article Stable URL: http://www.jstor.org/stable/168929
Common, M., Bull, T., Stoeckl, N. 1999. The Travel Cost Method: an Empirical Investigation of Randall’s Difficulty.
Australian Journal of Agricultural and Resource Economics, Volume 43, Issue 4, pages 457 –477
Englin, J., Cameron, T. A. 1996. Augmenting travel cost models with contingent behavior data. Environmental and
Resource Economics, Vol. 7, Nu. 2, pp. 133- 147
Garrod, G. D., Willis, K. G. 1991. An Individual Travel-Cost Method of Evaluating Forrest Recreation. Journal of
Agricultural Economics , Vol. 42, Issue 1, pp 33 –42
Hagstrom, N. T. Humphreys M. Hyatt W. A. and Gerrish W. B. 1998, A survey of Connecticut stream and rivers.
Federal Aid in Sport Fish Restoration, F-66-R Final Report, State of Connecticut Department of Environmental
Protection, Hartford, CT
Heintz, James, Pollin, Robert, and Gerrertt-Peltier, Hiedi, The NYS Park System: An Economic Asset to the Empire
State, Parks and Trails New York (2009)
Hicks, J. R. 1939, The Foundations of Welfare Economics. The Economic Journal , Vol. 49, No. 196, pp. 696-712,
Article Stable URL: http://www.jstor.org/stable/2225023
----------. 1986. A Revision of Demand Theory . Oxford University Press, USA
Hyatt, W. A. 1986, An angler survey and economic study of the Farmington River fishery resource. Federal Aid in
Sport Fish Restoration, F-59-R Final Report, State of Connecticut Department of Environmental Protection,
Hartford, CT
Mas-Colell, A. Whinston, M. D.; Green, J. R. 1995, Microeconomic Theory . New York: Oxford University Press, New
York
8/3/2019 State Park Economic Impact Study
http://slidepdf.com/reader/full/state-park-economic-impact-study 71/72
71
Mitchell, R. C., Carson, R. T. 1989. Using Surveys to Value Public Goods: The Contingent Valuation Method . RFF
Press; Ed. 1
Samuelson, P. A. A Note on the Pure Theory of Consumer's Behaviour. Economica, New Series, Vol. 5, No. 17 (Feb.,
1938), pp. 61-71, Article Stable URL: http://www.jstor.org/stable/2548836
----------. 1948. Consumption Theory in Terms of Revealed Preference. Economica, New Series, Vol. 5, No. 17 (Feb.,1938), pp. 61-71, Article Stable URL: http://www.jstor.org/stable/2548836
Smith, V. Kerry, and Kopp, Raymond J. 1980, The Spatial Limits of the Travel Cost Recreation Demand Model. Land
Economics, 56:60-74
Strauss, Charles H. and Lord, Bruce E. A. Case Study The economic impacts of a heritage tourism system, Journal of
Retailing and Consumer Services 8 (2001) 199}204
Sun, Ya-Yen, Wong, Kam-Fai, and Lai, Hsein-Chung, Statistical properties and survey design of tourism expenditures
using segmentation, Tourism Economics, 2010, 16(4), 807-832.
Willis, K. G.(2003) 'Pricing Public Parks', Journal of Environmental Planning and Management, 46: 1, 3— 17
U.S. Department of Commerce Economics and Statistics Administration U.S. CENSUS BUREAU, Quick Facts from the
2006 National Survey of Fishing, Hunting, and Wildlife-Associated Recreation 2007
Additional refs:
Booker, James F. “Valuing Impacts of Forest Quality Change: Recreation and New York's Allegany
State Park,” http://nrs.fs.fed.us/pubs/gtr/gtr_ne241/gtr_ne241_272.pdf
“Washington State Parks Cetennial 2013 Survey,” Responsive Management, (2006)
http://www.parks.wa.gov/Centennial2013/2006%20Survey.pdf
Mates, William J. & Jorge L. Reyes, “The Economic Value of New Jersey State Parks and Forests,”
(2006) http://nrs.fs.fed.us/pubs/gtr/gtr_ne241/gtr_ne241_272.pdf
Horowitz, Dr. John & Robert C. Wieland, “Estimating the Recreational Consumer Surplus at
Maryland's State-owned Forests” (2007),
http://www.mainstreeteconomics.com/documents/TravelCostfinal.pdf
Kaval, Pamela. 2007. “Recreation Benefits of U.S. Parks,” Unpublished manuscript,
University of Waikato, New Zealand.
Haab, TC and KE McConnell (2002) Valuing Environmental and Natural Resources: Econometrics of Non-MarketValuation USA: Edward-Elgar Publishing.
Rolfe, J and B Dyack (2010) Valuing Recreation in the Coorong, Australia with Travel Cost and Contingent Behavior
Models, The Economic Record (Dec).
U.S. Fish and Wildlife Service, 2006 National Survey of Fishing Hunting and Wildlife-Associated Recreation,
Connecticut

8/3/2019 State Park Economic Impact Study
http://slidepdf.com/reader/full/state-park-economic-impact-study 72/72
E-2: Databases
OPM on assessed property values and selling process
DEP on information managed by them (Unaudited by CCEA).
Internet Sources as footnoted.