state of utah department of natural …waterrights.utah.gov/docsys/v920/w920/w920009n.pdfstate of...
TRANSCRIPT

STATE OF UTAHDEPARTMENT OF NATURAL RESOURCES
Technical Publication No. 61
GROUND-WATER CONDITIONS IN THE NAVAJO SANDSTONEIN THE CENTRAL VIRGIN RIVER BASIN, UTAH
by
R. M. Cordova, HydrologistU.S. Geological Survey
Prepared bythe United States Geological Survey
in cooperation withthe Utah Department of Natural Resources
Division of Water Rights
1978


CONTENTS
English-to-metric conversion factors.Abstract.Introduction.
Purpose and scope.Previous studies and acknowledgmentsGeographic setting
Location, physiography, and drainage.ClimateCulture and economyNumbering system for hydrogeologic-data sites
GeologyAge, areal extent, and thicknessLithology.Structure.
HydrologyRechargeMovementDischarge.
Seepage into streams.SpringsPercolation into the Kayenta Formation.WellsEvapotranspiration.
Hydraulic properties.PorosityHydraulic conductivity, transmissivity, and storage
coefficient.Aquifer tests.
Purpose and procedure for testingDescription of tests.
Gunlock areaCity Creek-Mill Creek areas.Leeds areaHurricane Bench.
StorageChanges.Amount
Hydrologic effects of discharging wellsInterference between wellsReduction of streamflow.
Chemical quality and temperature.General relations.Relation to use.Chemical typesTemperature.
Potential developmentConclusionsReferences cited.Publications of the Utah Department of Natural Resources,
Division of Water Rights.
III
Page
VI1333334455578
1111192121222323242424
26282828282932323333363637373737394142434447
58 .
Plate
ILLUSTRATIONS
[Plates are in pocket]
1. Map showing the geographic and geologic setting of the Navajo Sandstone and the areal distribution of precipitationin the central Virgin River basin.
2. Map showing the location of selected data-collection sitesand area of outcrop, geologic structure, and generalizedthickness of the Navajo Sandstone in the central VirginRiver basin.
3. Map showing a generalized potentiometric surface and selected chemical-quality information, central Virgin Riverbasin.
Page
Figure 1. Diagram showing numbering system for hydrogeologic-da ta sites in Utah. • • • • •• 6
2. Grain-size distribution curves •• 10
3-7. Areal photographs showing jointing:
3. Gunlock area. . . . · 124. Upper Mill Creek area · . . . . 135. Sand Mountain area. · · 146. Area immediately north of St- George. . . . . 157. Big Sand area . . . · · . . . . . . 16
8. Caliper logs in wells showing open joints • 20
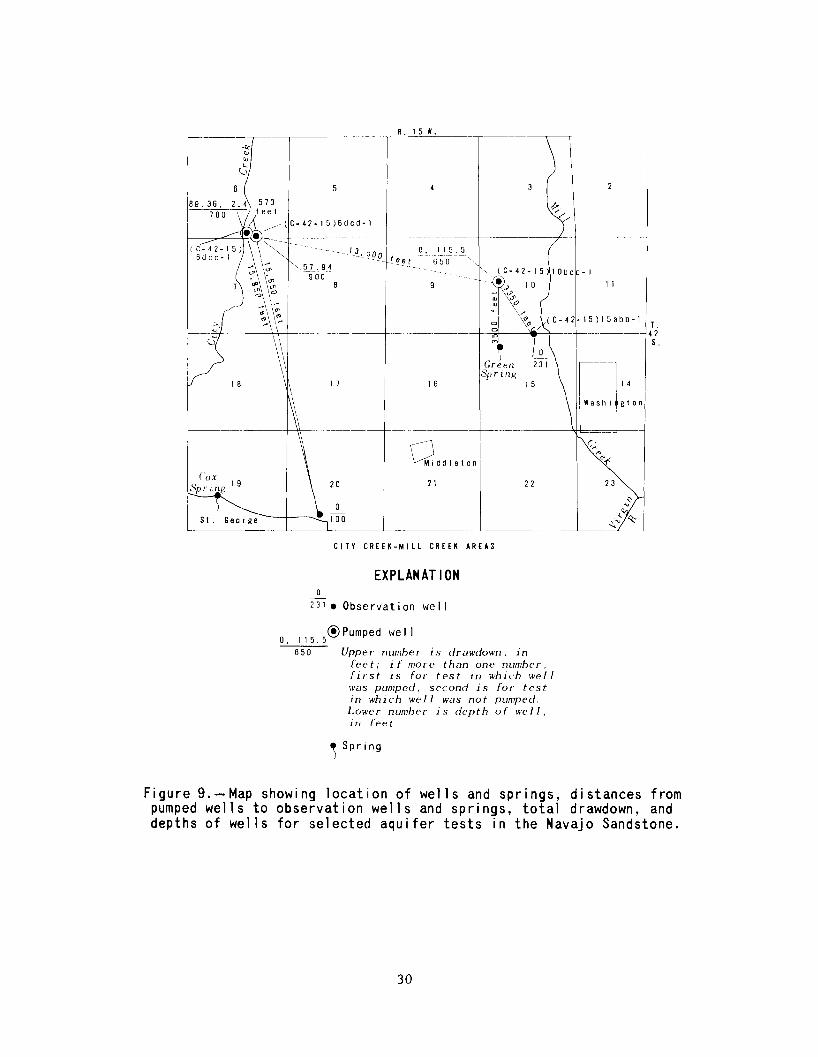
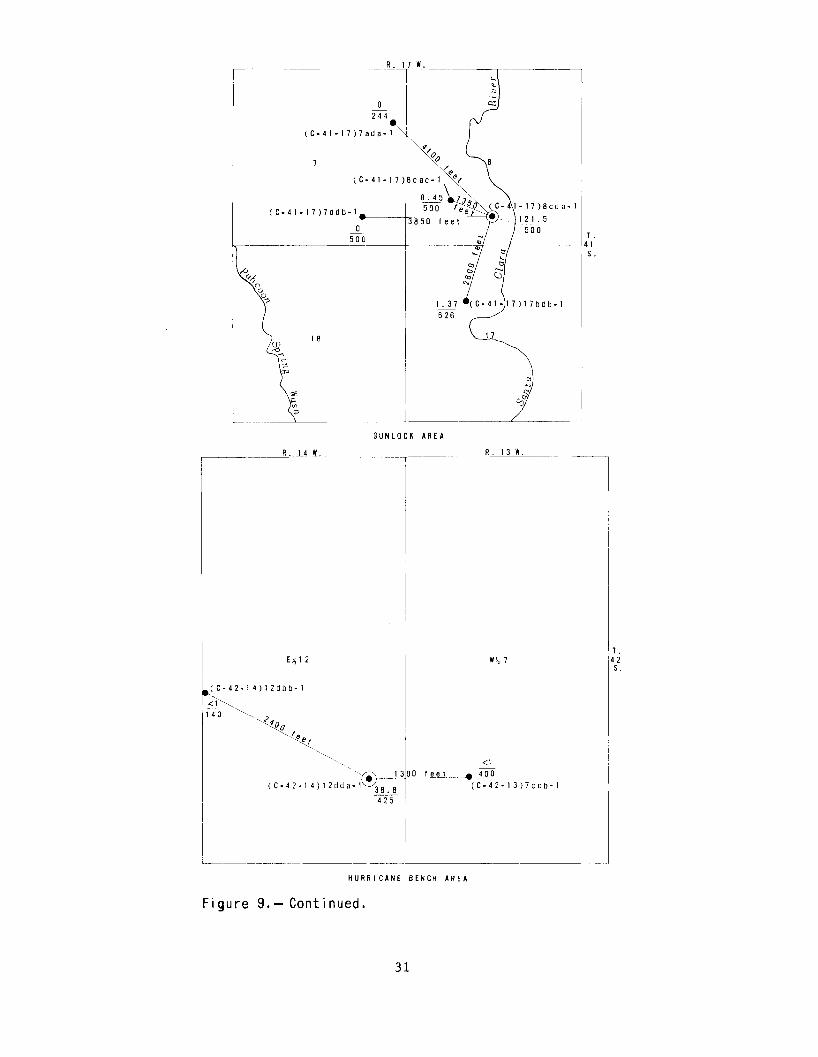
9. Map showing location of wells and springs, distancesfrom pumped wells to observation wells and springs,total drawdown, and depths of wells for selectedaquifer tests in the Navajo Sandstone • • • • • • • • 30
10-12. Graphs showing:
10. Relation of water levels in a well and dischargefrom two springs to the cumulative departurefrom the 1947-75 average annual precipitationat St. George . • . . . • . • . . . . . . • . . . 34
11. Water levels in selected observation wells ••
12. Relation of dissolved-solids concentration tospecific conductance of ground water fromthe Navajo Sandstone. • • • • • • • • • • •
IV
35
39
ILLUSTRATIONS - Continued
Page
Figure 13-15. Graphs showing:
13.
14.
Relation of sulfate concentration to specificconductance of ground water from the NavajoSandstone ..........••.....
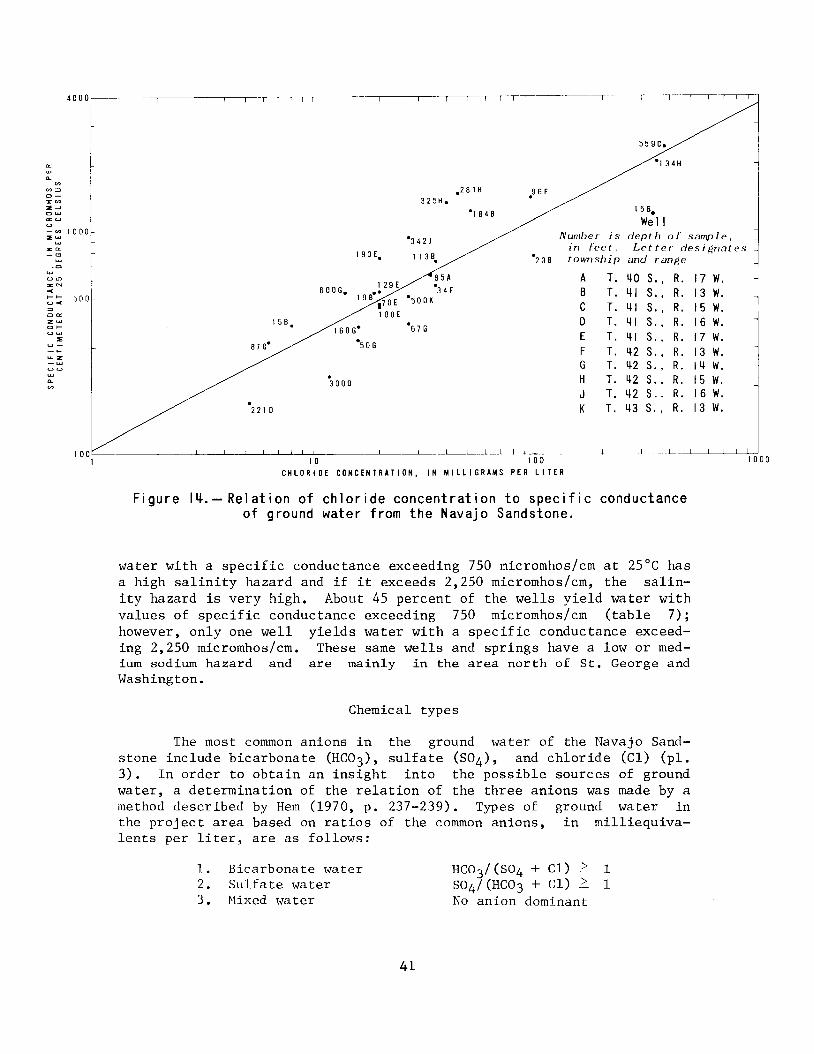
Relation of chloride concentration to specificconductance of ground water from the NavajoSandstone . . . . . . • . . . . . . • .
40
41
Table
15. Relation of temperature of ground water at topof saturated zone to depth to water below landsurface in the Navajo Sandstone .
TABLES
1. Statistical characteristics of grain-size analyses.
43
9
2. Records of selected springs • 22
3. Porosity of the Navajo Sandstone determined fromrock samples from selected outcrops • • • 25
4. Porosity of the Navajo Sandstone determined fromresistivity and neutron logs of wells • • 25
5. Ground-water storage in the Navajo Sandstone of thecentral Virgin River basin. • • • • • • • • • 36
6.
7.
Records of selected wells as of February 1975 •
Chemical analyses and temperature of water fromselected wells, springs, and streams. • •
48
50
8. Water levels in selected observation wells ••
v
54
ionic interacting values isMeq/L is numerically equal
ENGLISH-TO-METRIC CONVERSION FACTORS
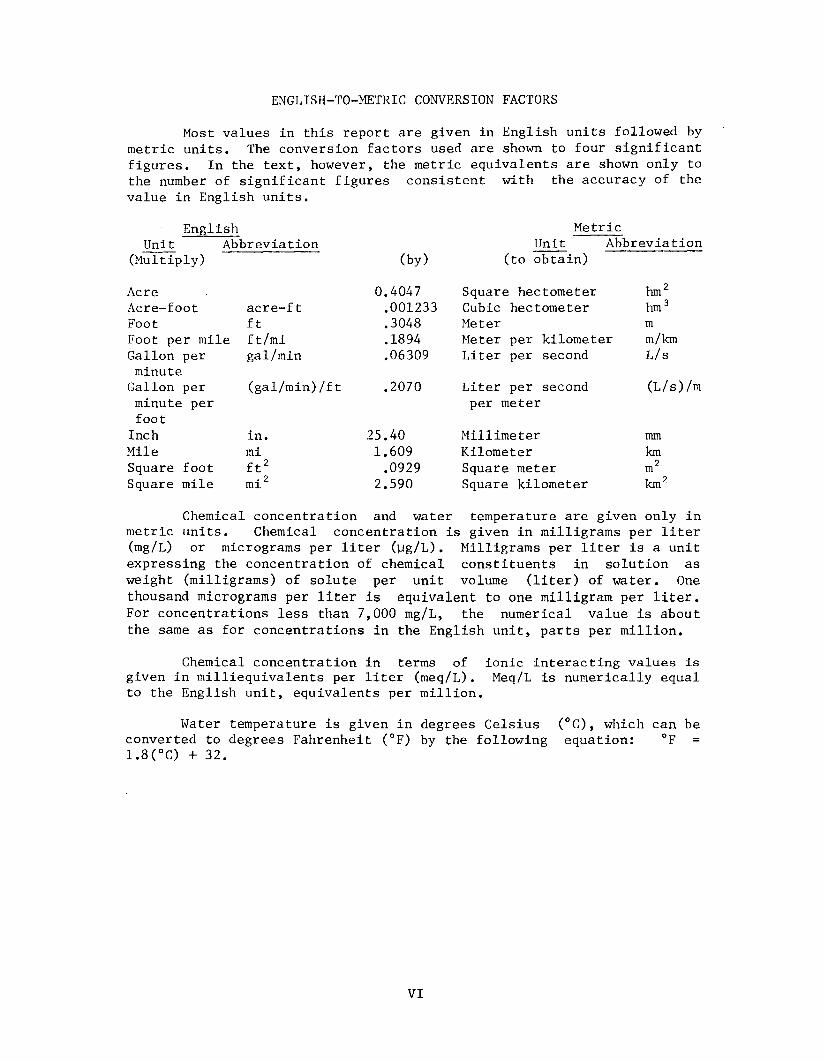
Most values in this report are given in English units followed bymetric units. The conversion factors used are shown to four significantfigures. In the text, however, the metric equivalents are shown only tothe number of significant figures consistent with the accuracy of thevalue in English units.
English MetricUnit Abbreviation Unit Abbreviation
(Multiply) (by) (to obtain)
Acre 0.4047 Square hectometer hm 2
Acre-foot acre-ft .001233 Cubic hectometer hm 3
Foot ft .3048 Meter mFoot per mile ft/mi .1894 Meter per kilometer m/kmGallon per gal/min .06309 Liter per second L/sminute
Gallon per (gal/min) /ft .2070 Liter per second (L/s) /mminute per per meterfoot
Inch in. 25.40 Millimeter nunMile mi 1.609 Kilometer kmSquare foot ft 2 .0929 Square meter m2
Square mile mi 2 2.590 Square kilometer km 2
Chemical concentration and water temperature are given only inmetric units. Chemical concentration is given in milligrams per liter(mg/L) or micrograms per liter (~g/L). Milligrams per liter is a unitexpressing the concentration of chemical constituents in solution asweight (milligrams) of solute per unit volume (liter) of water. Onethousand micrograms per liter is equivalent to one milligram per liter.For concentrations less than 7,000 mg/L, the numerical value is aboutthe same as for concentrations in the English unit, parts per million.
Chemical concentration in terms ofgiven in milliequivalents per liter (meq/L).to the English unit, equivalents per million.
Water temperature is given in degrees Celsiusconverted to degrees Fahrenheit (OF) by the following1.8 (OC) + 32.
VI
(OC), which can beequation: of
GROUND-WATER CONDITIONS IN THE NAVAJO SANDSTONEIN THE CENTRAL VIRGIN RIVER BASIN, UTAH
by
R. M. Cordova, HydrologistU.S. Geological Survey
ABSTRACT
The central Virgin River basin, Utah, includes about 1,000 squaremiles (2,600 square kilometers) in the drainage basin of the VirginRiver downstream from the Hurricane Cliffs. The Navajo Sandstone ofLate Triassic(?) and Jurassic age crops out in 234 square miles (606square kilometers) of the basin and underlies younger rocks in about 450square miles (1,200 square kilometers) of the basin.
Lithologically, the Navajo Sandstone is essentially a quartzosesandstone, about 2,000 feet (600 meters) in maximum thickness, comprising three distinct units denominated the lower, middle, and upper units.The Navajo is practically homogeneous in size and sorting of its grains.
Recharge to the Navajo Sandstone is estimated for 1974 to be aminimum of 17,000 acre-feet (21 cubic hectometers) and is by the (1) infiltration of precipitation directly on the outcrop, (2) infiltration ofstreamflow in the outcrop area, (3) infiltration of water from the overlying Carmel Formation, and (4) the inflow of ground water from outsidethe project area.
Movement of ground water is generally from the Pine Valley Mountains, Bull Valley Mountains, and the area east of the Hurricane Cliffstoward the Virgin River and its tributaries. The overall direction ofground-water movement is independent of the strike or plunge of thelarge structural features; joints, where open, have a strong influenceon the local direction of flow. Geologic fieldwork in the project areainferred that some faults are impermeable at depth. Faults in somecases are identifiable in the field by what has been termed for thisstudy, a trellis zone, which is a narrow, linear zone consisting of complexly intersecting fractures filled with siliceous cement.
Discharge of ground water in 1974 amounted to a minimum of 19,000acre-feet (23 cubic hectometers). Discharge is by (1) seepage intostreams, (2) springs, (3) percolation into the Kayenta Formation, (4)wells, and (5) evapotranspiration. Discharge from wells in 1974 was2,300 acre-feet (2.8 cubic hectometers). The discharge rate of wellsaverages about 540 gallons per minute (34 liters per second); the average specific capacity for a 24-hour period is 16 gallons per minute perfoot (3.3 liters per second per meter) of drawdown.
1
The average effective porosity in the saturated zone is estimatedto be 17 percent based on laboratory analysis of rock samples and totalporosity is 32 percent based on borehole techniques using resistivityand neutron logs. The hydraulic conductivity has an average value of2.1 feet per day (0.64 meter per day) based on laboratory analysis, butthe average value is 5 feet per day (1.5 meters per day) based on fieldtests.
Changes in storage in the Navajo Sandstone of the basin are controlled mainly by precipitation and well discharge. A significant longterm change in storage has not occurred in a large part of the area.However, a decrease in storage has occurred at St. George City's Gunlockwell field. The maximum amount of ground water in storage available towells is estimated to be 2.8 million acre-feet (3,450 cubic hectometers).
The hydrologic effects of wells discharging from the Navajo Sandstone in the basin include interference between wells and reduction ofstreamflow.
Chemical analysis of the water in storage indicates that the concentration of dissolved solids and of the principal ions ranges widely;for example, the dissolved solids range from 103 to 1,360 milligramsper liter. Water percolating in the lower unit and along fault zoneshas the largest amount of dissolved minerals. Bicarbonate water is themost common type; sulfate and mixed waters are fairly common. The sulfate ion dominates or generally is in significant amounts in ground water that is from the lower unit or is moving along or near a fault; thechloride ion is in significant amounts in ground water moving along ornear some faults.
The temperature of ground water ranges from 11.0° to 40.0° Celsius. One reason for the large range is the effect of altitude, lowertemperatures being at higher altitudes. Another reason is the normalincrease of temperature with an increase of depth to water. The averageincrease of temperature with depth in the saturated zone is 0.56° Celsius per 100 feet (30 meters).
The Navajo Sandstone in the central Virgin River basin has a favorable potential for additional development by large-discharge wells.In most localities in which wells have reached the saturated zone, discharge rates, specific capacities, and chemical quality have been satisfactory for such development. The main factors limiting the potentialfor development include storage, recharge, and effects of pumping; locally water quality and temperature are added limiting factors.
2
INTRODUCTION
Purpose and scope
The increased need for water in southern Utah for municipal andindustrial purposes has prompted water users to look to the ground-waterreservoir for additional supplies. Experience gained by water-wellusers during the exploration for water supplies indicated that the Navajo Sandstone was a source of ground water that had a greater promisefor large yields and good quality water than any other consolidated-rockformation. However, little basic hydrologic data and no overall hydrologic evaluation of the formation were available to aid the Utah StateEngineer in determining whether large-scale development would be feasible. Consequently, the State Engineer requested the U.S. GeologicalSurvey, as part of the Statewide cooperative agreement with the UtahDepartment of Natural Resources, to make a study of the hydrogeology ofthe Navajo Sandstone in the central Virgin River basin where wells inthe formation are more numerous than in other places.
This investigation of the Navajo Sandstone (pl. 1) was begun July1, 1973, and was completed June 30, 1976. Detailed information wasobtained on recharge, movement, discharge, storage, utilization, chemical quality, and temperature of the ground water. The interpretationof the hydrogeology of the Navajo is confined to the outcrop area asshown in figure 1 because of a lack of hydrologic data and sparse geologic data on the formation outside this area.
Previous studies and acknowledgments
Interpretive hydrogeologic studies in the central Virgin Riverbasin have not been made exclusively of the Navajo Sandstone. A studyof the ground-water conditions of the central Virgin River basin byCordova, Sandberg, and McConkie (1972) contains some data and interpretive information for the Navajo.
Studies of the basin geology have been made by several geologists, but none of these studies was confined to the Navajo Sandstone.Previous geologic studies used for this investigation include those byCook (1960), McCarthy (1958), Reber (1951), and Wiley (1963).
Thanks are extended to all the residents of the project area whofacilitated the progress of the investigation. Particular appreciationis extended to Messrs. Rudger McArthur and Glenn Gubler, city officialsof St. George, to Mr. Wayne Wilson of LaVerkin, and to Mr. Frank Sullivan of Washington.
Geographic setting
Location, physiography, and drainage
The central Virgin River basin includes about 1,000 mi 2 (2,600km 2
) in the drainage basin of the Virgin River downstream from HurricaneCliffs (pl. 1). The Navajo Sandstone crops out in about 23 percent ofthe basin.
3

Most of the basin is characterized by post-Paleozoic sedimentaryformations with generally low angles of dip, prominent escarpments, andyouthful drainage. West of St. George, however, the sedimentary formations are steeply upturned on the flanks of the Beaver Dam Mountains--astrongly faulted and folded range of Paleozoic and pre-Paleozoic rocks.Altitudes above mean sea level range from about 2,400 ft (730 m) wherethe Virgin River flows into Arizona to about 10,300 ft (3,100 m) in thePine Valley Mountains.
Drainage is by the Virgin River and its tributaries, which arepart of the Colorado system. The Virgin River is perennial, and itstributaries are perennial, intermittent, or ephemeral.
Climate
The climate of the project area is generally characterized by asmall amount of precipitation, mild winters, hot summers, and a highrate of evaporation. The areal distribution of precipitation is shownon plate 1.
The largest amounts of precipitation generally fall during December, January, February, and March, but significant amounts also fallduring the summer. In the winter, precipitation is commonly snow in themountains and rain at lower altitudes; but in the summer, precipitationis commonly in the form of torrential rainstorms and runoff is rapid.The winter precipitation therefore probably contributes the greatestamount of recharge to the ground-water reservoir.
Average monthly temperatures at low altitudes are usually abovefreezing in the winter and exceed 80°F (26.5°C) in July and August. Theannual amount of pan evaporation at St. George, based on studies by theU.S. Bureau of Reclamation (oral commun., 1968) is about 89 in. (2,260mm). The estimated evaporation from a free-water surface at St. Georgetherefore, using a pan coefficient of 0.70, is about 62 in. (1,600 mm).
Culture and economy
Mormon pioneers established the first settlement, in the NewHarmony area, in 1852; most of the present communities were settled by1905. St. George, the largest community in the project area, was settled in 1861 and is the county seat of Washington.
Agriculture forms the economic base, but a large part of the income is derived from tourism. Irrigation is necessary for the successof agriculture in the area, and about 17,000 acres (6,900 hm 2 ) of landis irrigated. The main irrigated crops are small grains, fruits, vegetables, and sugar beet seed. Ground water is a supplementary source ofirrigation supply during periods of low streamflow. Ground water is aprincipal source of municipal supply, and the city of St. George pumpsfour large-discharge wells in the Navajo Sandstone and is prospectingfor more well sites.
4
Numbering system for hydrogeologic-data sites
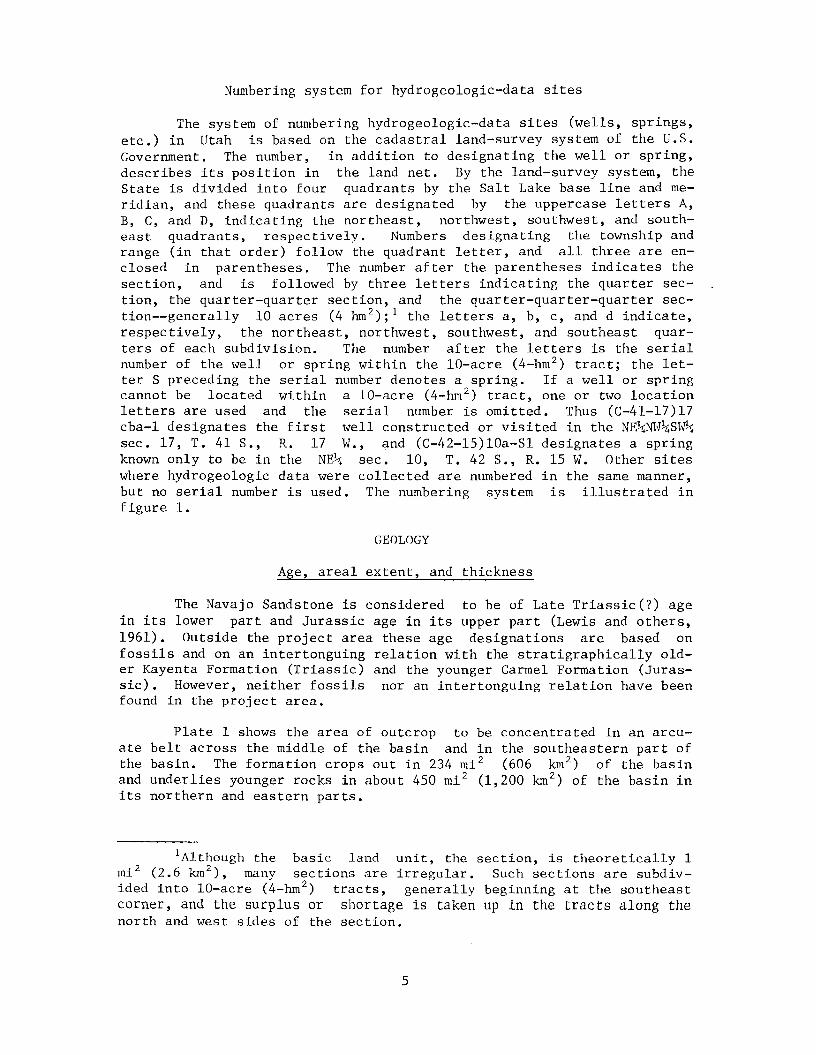
The system of numbering hydrogeologic-data sites (wells, springs,etc.) in Utah is based on the cadastral land-survey system of the U.S.Government. The number, in addition to designating the well or spring,describes its position in the land net. By the land-survey system, theState is divided into four quadrants by the Salt Lake base line and meridian, and these quadrants are designated by the uppercase letters A,B, C, and D, indicating the northeast, northwest, southwest, and southeast quadrants, respectively. Numbers designating the township andrange (in that order) follow the quadrant letter, and all three are enclosed in parentheses. The number after the parentheses indicates thesection, and is followed by three letters indicating the quarter section, the quarter-quarter section, and the quarter-quarter-quarter section--generally 10 acres (4 hmZ);l the letters a, b, c, and d indicate,respectively, the northeast, northwest, southwest, and southeast quarters of each subdivision. The number after the letters is the serialnumber of the well or spring within the la-acre (4-hm Z) tract; the letter S preceding the serial number denotes a spring. If a well or springcannot be located within a la-acre (4-hm Z) tract, one or two locationletters are used and the serial number is omitted. Thus (C-41-l7)17cba-1 designates the first well constructed or visited in the NE~v~SW~
sec. 17, T. 41 S., R. 17 W., and (C-42-l5)lOa-S1 designates a springknown only to be in the NE~ sec. 10, T. 42 S., R. 15 W. Other siteswhere hydrogeologic data were collected are numbered in the same manner,but no serial number is used. The numbering system is illustrated infigure 1.
GEOLOGY
Age, areal extent, and thickness
The Navajo Sandstone is considered to be of Late Triassic(?) agein its lower part and Jurassic age in its upper part (Lewis and others,1961). Outside the project area these age designations are based onfossils and on an intertonguing relation with the stratigraphically older Kayenta Formation (Triassic) and the younger Carmel Formation (Jurassic). However, neither fossils nor an intertonguing relation have beenfound in the project area.
Plate 1 shows the area of outcrop to be concentrated in an arcuate belt across the middle of the basin and in the southeastern part ofthe basin. The formation crops out in 234 mi z (606 km Z) of the basinand underlies younger rocks in about 450 mi z (1,200 km Z) of the basin inits northern and eastern parts.
lAlthough the basic land unit, the section, is theoretically 1mi 2 (2.6 km 2
), many sections are irregular. Such sections are subdivided into la-acre (4-hm z) tracts, generally beginning at the southeastcorner, and the surplus or shortage is taken up in the tracts along thenorth and west sides of the section.
5

Sections within a township Tracts within a section
d
a
d
Well
b a
1---+-.'-+------1 mil e --------1(1.6 kilometers)
(C-ql-17)17cba-1
R 17 W Sec. 17.
6 5 q I~ 2 I
7 8 9 I~ II 12
Well
~.18 ~ 17 _____ 16 15 13. I'----1
~~19 20 21 2q,t--..
30 29 28 2~ 26 1'\5"'"
31 32 33 31+ ~ 3~I 6 mi les '\. ~
(9.7 ki lometers)
~
TqS
III
SALT
B
LAKE
II
A L _BASE LINEI
o II
,II
_____ J
"Salt Lake City ,
II,-
C>-'"...:IE
c
II
rII ...
L-- , ~I IRON .i :;L COUNTY jJ ;::
W ---'-'---I--!17.---l _'WASHINGTONr-- T COUN T-----1-_-
1. ql S., R.
Figure 1.- Numbering system for hydrogeologic-data sites in Utah.
6
The thickness of the Navajo Sandstone in the outcrop area rangesfrom about 0 to about 2,000 ft (600 m) (pl. 2). The thickness was determined by projecting the formation's basal contact, where known, intothe subsurface and then subtracting the altitude of the basal contactfrom the altitude of the land surface vertically above the contact atmany points. These points were generally distributed in a quadrilateral network with 0.5- to 2-mi (0.8 to 3.2 km) spacings, which gave afairly even and geometric distribution. The generally low stratigraphicdips (5° or less) allowed the subtraction to be done without correctionfor dip in most localities and without significant error. This methodwas used because only a few deep wells and test holes are available ascontrol points for determining the altitude of the base of the formation. Therefore, this method has inherent error because there is practically no subsurface control and because a constant dip is assumed inthe subsurface; such changes undoubtedly occur where there is folding,faulting, or variations in formational thickness. Therefore, the resulting lines of equal thickness are generalized and do not indicateexact thicknesses for particular localities. This is especially truefor localities where the topography is deeply incised by stream channels; in such areas the error may be on the order of several hundredfeet.
Lithology
The Navajo Sandstone is essentially a quartzose sandstone with aminor amount of accessory minerals, generally bound by calcareous cementand locally by silica. Individual quartz grains are characterized by ahigh degree of rounding and a frosted surface. A thin-section study wasmade of the formation in the Gunlock area by Johnson (1972), and thefollowing information on mineral content is abstracted from his report:
Mineral
QuartzChert, clay, rock fragmentsCalciteFeldspar (orthoclase and
microc1ine)Heavy minerals (zircon,
tourmaline, iron oxides,garnet)
Range(percent)
72-881.6-16.9
0-14
0.9-9.6
0-5.5
The Navajo Sandstone comprises three distinct lithologic units,which are denominated in this report as the lower, middle, and upperunits.
The lower unit comprises reddish brown (10R4/6),1 mainly veryfine to fine-grained, firmly cemented sandstone, some moderate reddish
lColor system of the Rock-Color Chart Committee (Geological Society of America, 1970).
7

orange (10R6/6) fine- to medium-grained sandstone,(10R4/6) mudstone and siltstone. The unit has aabout 100 ft (30 m).
and reddish brownmaximum thickness of
Separating the typical Navajo Sandstone (generally light-coloredsandstones) from the typical red beds (siltstone, mudstone, and shale)of the underlying Kayenta Formation is a transition zone. This transition zone is about 100 ft (30 m) thick and consists of Kayenta-type bedsthat alternate with Navajo-type sandstones. In order to map the Navajo,it was necessary to pick an arbitrary rock boundary in the transitionzone. Fieldwork determined that a light-colored Navajo-type bed 6-18 ft(1.8-5.5 m) thick was traceable throughout the project area; consequently, it was chosen as a key bed for mapping the base of the Navajo.
The middle unit consists of light orange brown (10R6/6 to 10R4/6), mainly fine-grained, firmly to moderately cemented sandstone. Theunit has a maximum thickness of about 1,000 ft (300 m).
The upper unit consists of light gray (5R8/2 to 5YR8/l) and verypale orange (10RY8/2), very fine to medium-grained, moderately to loosely cemented sandstone. The unit has a maximum thickness of about 900 ft(270 m).
Grain-size analyses were made of rock samples from 12 selectedoutcrops and the results of these analyses are in table 1 and in figure2. The outcrops were selected along several traverses between the topand bottom of the formation; they are considered to represent the typical lithologies of the three subdivisions of the formation.
The median size ranges from 0.10 to 0.29 rom, indicating that thesand grains are very fine to medium, according to the Wentworth gradescale (Krumbein and Pettijohn, 1938, p. 80); the median size of mostsamples is in the range of fine sand (0.125 to 0.25 rom). lfore instructive of size, however, is figure 2 showing grain-size distributioncurves. Figure 2 graphically shows that sorting of particles is highlydeveloped and by far the largest percentage of particles is in the fineto medium sand range. From the statistical analysis, it is concludedthat the Navajo Sandstone is practically homogeneous in the size andsorting of its grains.
Structure
The Navajo Sandstone has primary and secondary structures. Bedding and crossbedding are the main primary structures. The secondarystructures include faults, joints, and folds. Bedding is only developedlocally in the lower unit. Crossbedding is in all units and because theformation has a significant area of outcrop and is a cliff-former, thecrossbedding is a conspicuous and distinguishing natural feature in theproject area. Crossbedding has the smallest dimensions in the lowerunit and the largest in the middle and upper units.
8

Table 1.--Statistica1 characteristics of grain-size analyses
Sample location: See explanation of numbering system for hydrogeo1ogic-data sites.
Unit: L, lower; M, middle; U, upper.
MedianSample size l Sorting Uniformity
location Unit (rom) coefficient2 Skewness 3 Kurtosis 4 coefficientS
(C-40-13)3bad L 0.28 1.5 0.85 0.31 2.5
(C-40-14)26dbc U .15 1.6 .85 .25 3.1
35aaa M .16 1.3 1.0 .24 2.2
35dad L .10 1.4 1.1 .24 1.8
(C-41-15)18ddd U .15 1.3 .93 .28 2.3
(C-41-16)10dbb U .17 1.3 1.0 .24 2.4
(C-41-17) 8cca M .18 1.4 1.0 .21 2.8
l7dbd L .23 1.5 1.0 .30 2.1
(C-42-l4)24acc M .19 1.3 1.0 .20 1.7
34acc M .29 1.5 .87 .31 2.6
(C-42-l5)6dcc L .16 1.3 .95 .27 2.3
20cdb L ----.J2 1.5 ~ .26 2.4
Average .18 1.4 .96 .26 2.4
lThe fiftieth percentile or the second quartile.
2 IQ 3 /Ch, in which Qland Q3 are the first and third quartiles, respectively.
3 QlQ3/(median)2, in which Ql and Q3 are the first and third quarti1es,respectively.
4Q,-Ql/2(P90- P lO)' in which Ql and Q3 are the first and third quartiles, respectively, and Pl0 and P90 are the tenth and ninetieth percentiles, respectively.
S The sixtieth percentile divided by the tenth percentile.
9

I--..j
Coarsesand
1L
Mediumsan d
Very fine FineSi It sand sand
Location of sampleI (C-~0-13 )3bad2 (C-~0-1~)26dbc3 35aaaij 36dad5 fC-~1-15.~18ddd6 C-~1-16 IOdbb7 C-~1-17 8cca8 17dbd9 (C-~2-1~)2~acc
10 3~acc
II (C-~2-15)6dcc12 20cdb
L. lower unitM. middle unitU uppe r un i t30
20
1+ rJ ~I_~~~------!0.01 0.0625 0.125 0.25 0.50 1.0
GRAIN-SIZE OISTRIBUTION, IN MILLIMETERS
1001-~~-- T''].:i"'I
J 'I '
,,~"I" 01o r
51I
40r
I-:z:
'"-...•>-.,a:
I-'...
0z-~
I-
Z...Ua:...CL
Figure 2.-Grain-size distribution curves.

Several faults (pl. 2) are conspicuous for their length and displacement and these include from east to west (1) the Hurricane fault, amajor structure of southwestern Utah, (2) the Leeds fault (named forthis report), (3) the Washington fault, (4) the St. George fault (namedfor this report), (5) the Snow Canyon fault (named for this report), (6)the Ivins fault (named for this report), and (7) the Gunlock fault.
Many short, small-displacement faults traverse the Navajo Sandstone. Many were mapped for this project but there are probably manyothers that are not obvious because of the difficulties of mapping posedby the almost complete lack of bedding planes. }1any of the small mappedfaults are grouped at the ends of the large folds such as those in theareas of St. George, Washington, and Leeds. Probably the concentrationof stresses at the bends of the folds during deformation resulted in theconcentration of the faults. Faulting, inferred to be underthrusting,west of the Gunlock fault has resulted in the Navajo having a width ofoutcrop perpendicular to the strike that is several times the expectedwidth of an unfaulted stratigraphic section.
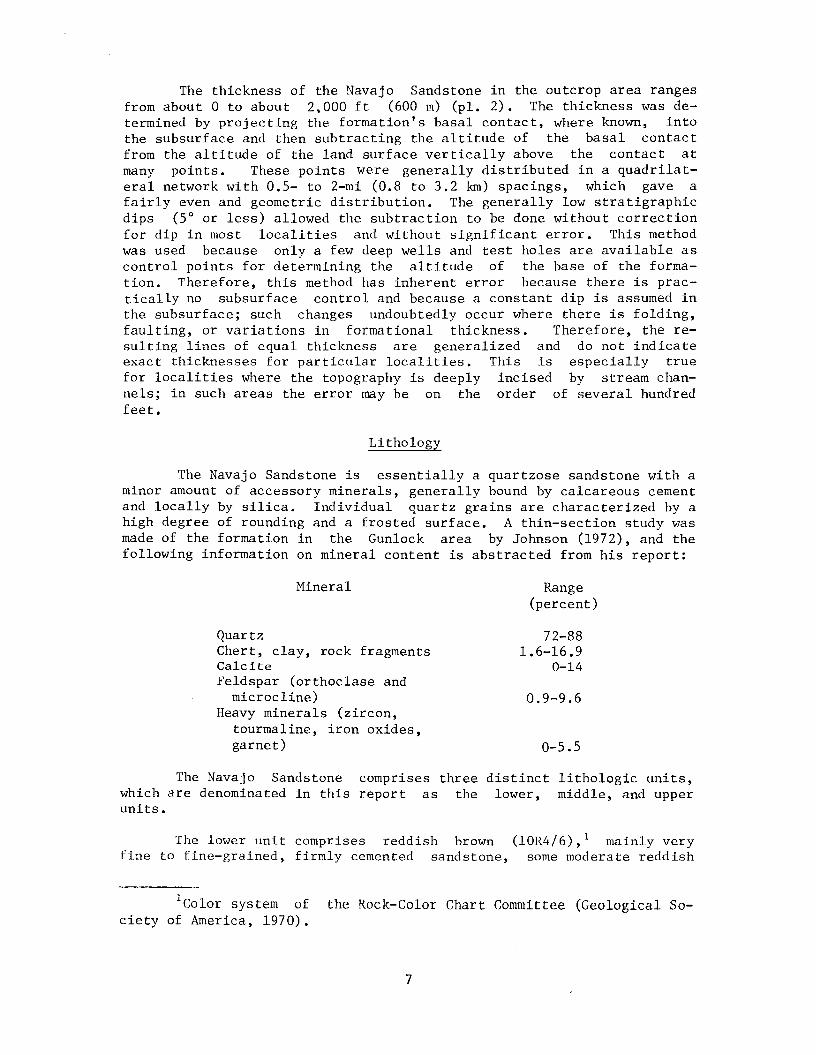
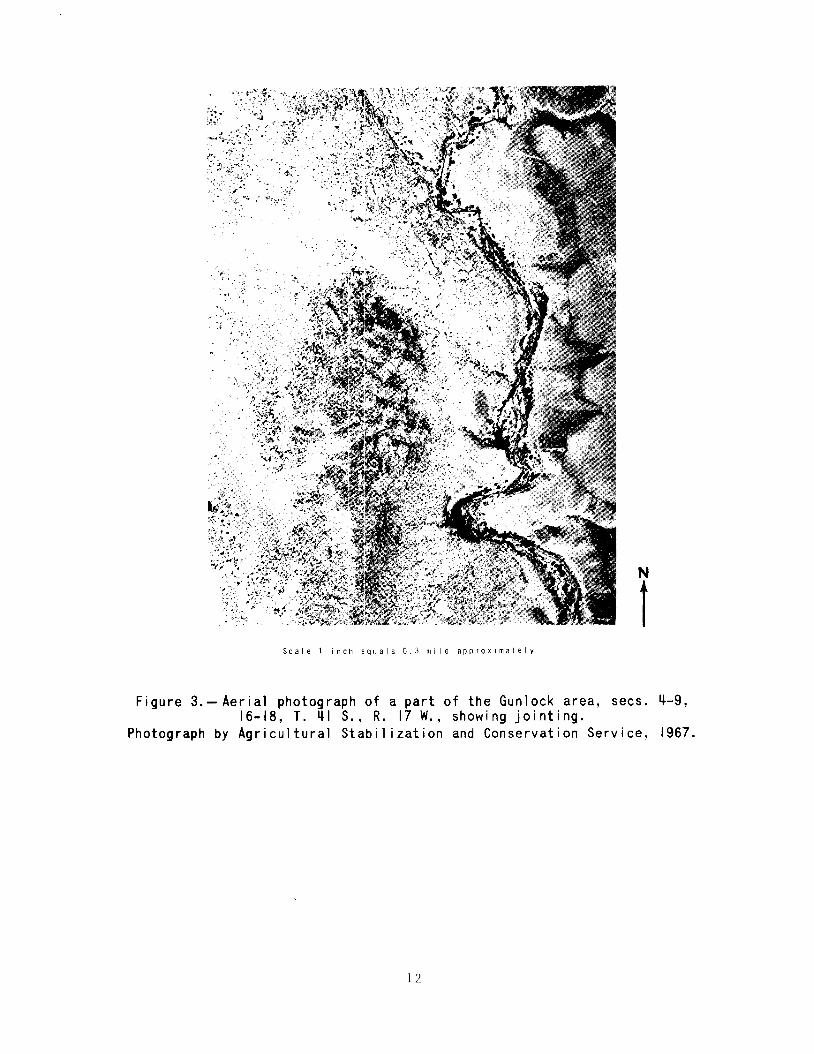
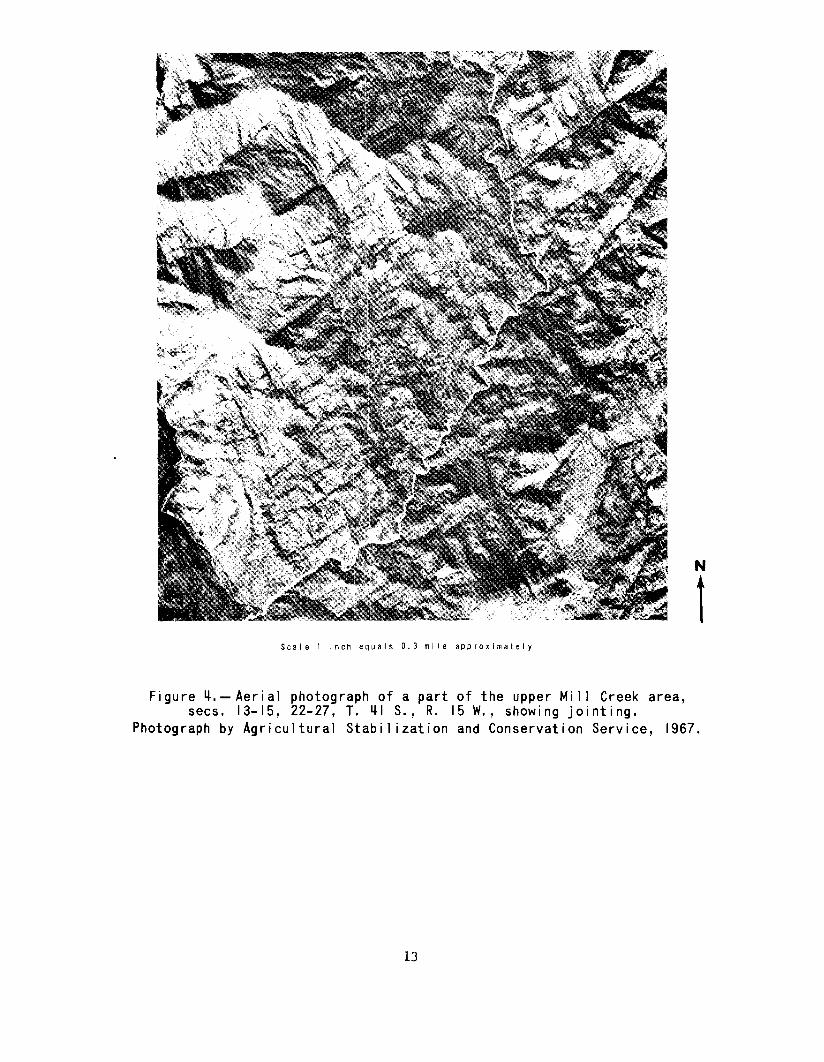
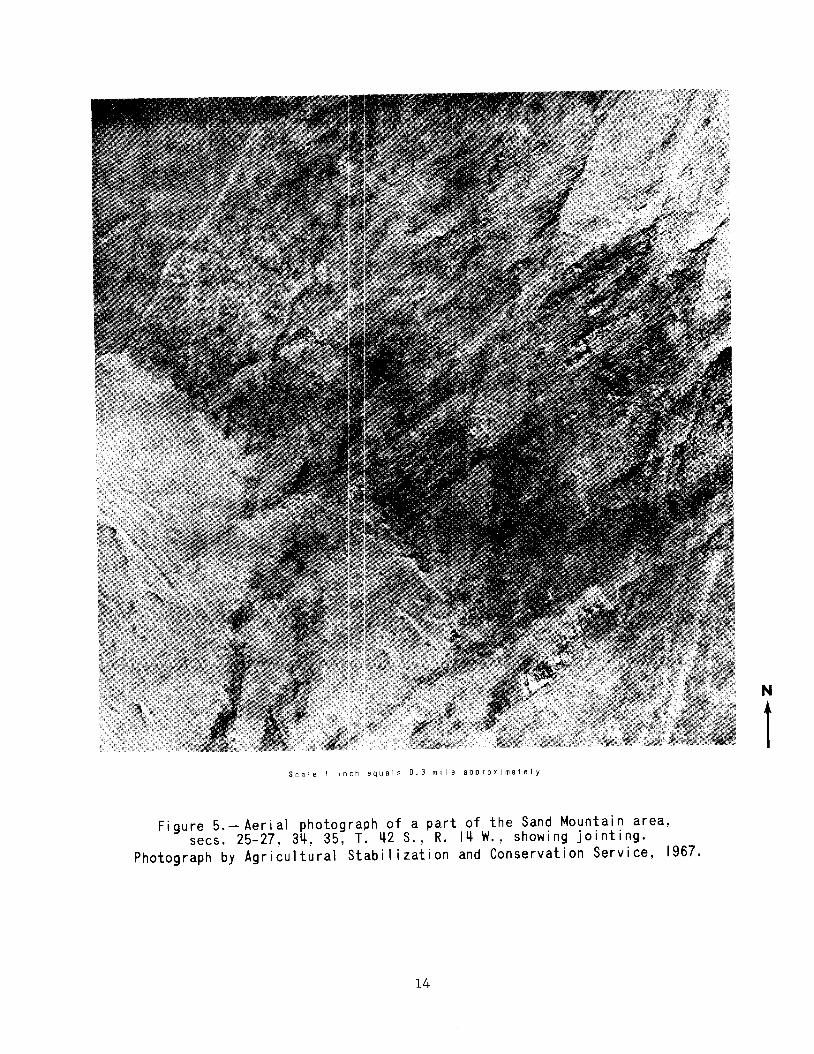
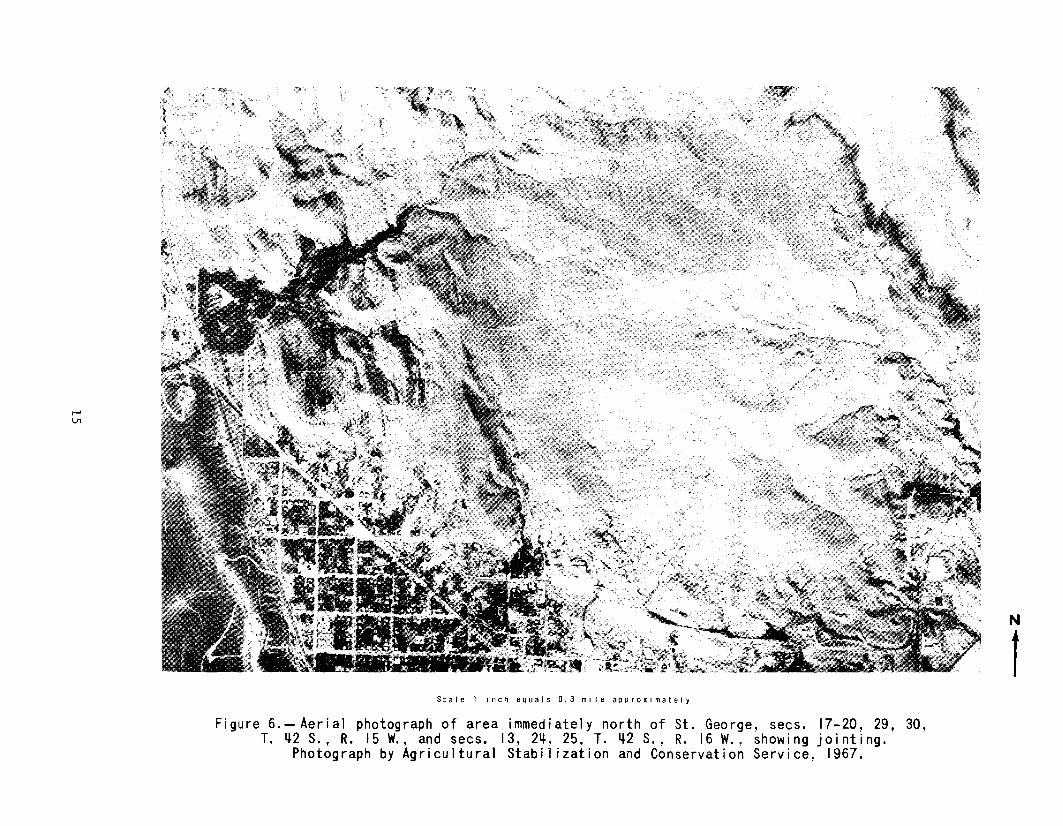
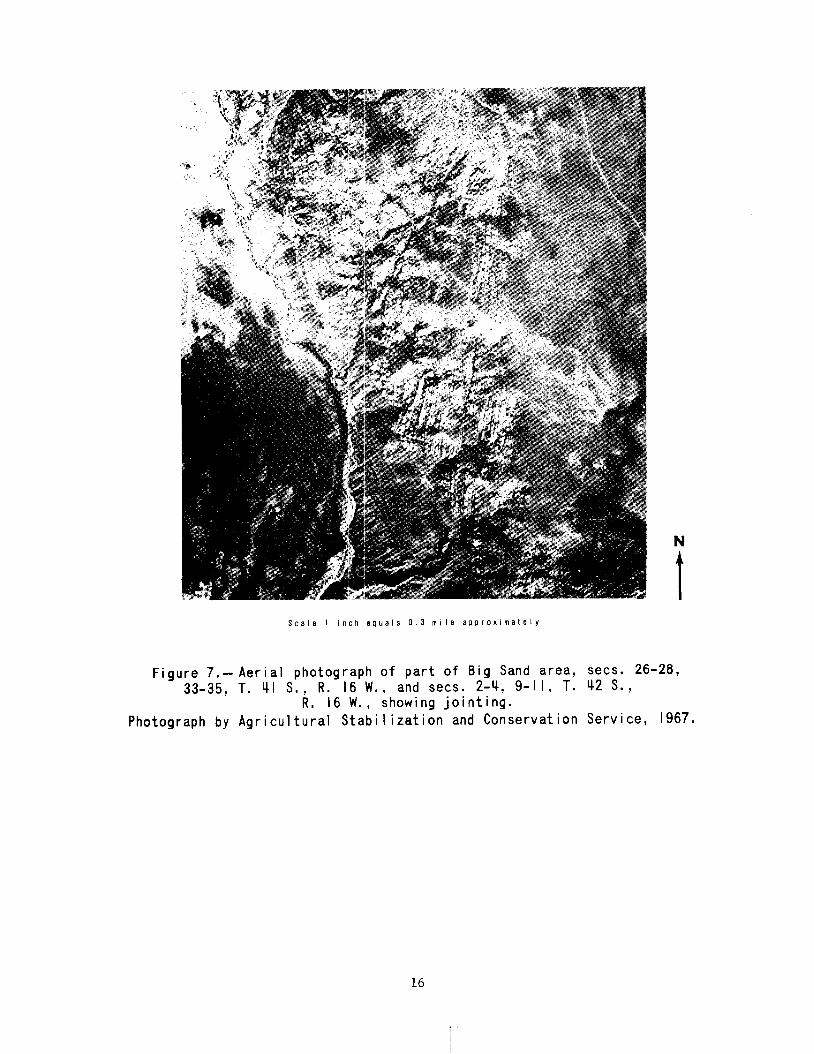
Jointing, mainly vertical to nearly vertical, is developedstrongly in all outcrops seen by the writer and is probably equally welldeveloped in areas that are covered by unconsolidated deposits and basaltic lava flows. The strong development is seen in aerial photographsof selected areas (figs. 3-7).
Folds are anticlinal or synclinal and large or small. The majorfolds that involve the Navajo Sandstone are from east to west (1) theHurricane Bench syncline, a shallow downwarp; (2) the Virgin anticline,a long, narrow fold of generally steeply dipping strata (the Navajo hasbeen eroded from most of this structure resulting in two large almostcompletely separated areas of outcrop to the northwest and southeast ofthe anticlinal axis); (3) the St. George syncline (named for this report), a broad, shallow fold extending from the Virgin anticline to theGunlock fault; and (4) the Gunlock syncline, a small fold west of theGunlock fault. Several small folds have been mapped in the eastern andwestern parts of the project area, and these are probably geneticallyrelated to the nearby faulting.
HYDROLOGY
Recharge
Recharge to the Navajo Sandstone is by (1) infiltration of precipitation directly on the outcrop of the formation, (2) infiltration ofstreamflow in the outcrop area, (3) infiltration of water from the overlying Carmel Formation, and (4) inflow of ground water from outside theproject area. Sufficient data are not available for computing the quantity of recharge from each item of recharge; however, the data provethat there is a significant quantity of recharge from each item.
Recharge occurs by the infiltration of precipitation directly onthe Navajo Sandstone outcrop area. However, most of the infiltrationoccurs where the sandstone is bare and jointed or where only thin sandydeposits cover the jointed rock.
11
N
1Scale 1 inch equals 0.3 mi Ie approxlmalel y
Figure 3.- Aerial photograph of a part of the Gunlock area, sees. ~-9,
16-18, T. ~I S., R. 17 W., showing jointing.Photograph by Agricultural Stabilization and Conservation Service, 1967.
12
N
tScale 1 inch equals 0.3 mile approximately
Figure ij.-Aerial photograph of a part of the upper Mill Creek area,sees. 13-15, 22-27, T. ijl S., R. 15 W., showing jointing.
Photograph by Agricultural Stabil ization and Conservation Service, 1967.
13
Scale 1 inch equals 0.3 mile approximately
Figure 5.-Aerial photograph of a part of the Sand Mountain area,sees. 25-27, 34-, 35, T. 4-2 S., R. 14- W., showing jointing.
Photograph by Agricultural Stabil ization and Conservation Service, 1967.
14
N
1
I-'1J1
Scale 1 inch equals 0.3 mile approxima1ely
Figure 6.- Aerial photograph of area immediately north of St. George, sees. 17-20, 29, 30,T. 4-2 S., R. 15 W., and sees. 13,24-,25, T. 4-2 S., R. 16 W., showing jointing.
Photograph by Agricultural Stabilization and Conservation Service, 1967.
N
f
N
1Scale 1 inch equals 0.3 mile approximateiy
Figure 7.- Aerial photograph of part of Big Sand area, sees. 26-28,33-35, T. ~I S., R. 16 W., and sees. 2-~, 9-11, T. ~2 S.,
R. 16 W., showing jointing.Photograph by Agricultural Stabilization and Conservation Service, 1967.
16

Joints are the main conduits for water moving from the surface tothe saturated zone. The widespread occurrence, population density, dimensions, and high permeability of the open joints combine to make astrong argument for this assertion. Some of the direct runoff from precipitation enters unfractured rock where there are pores between theindividual grains, but most of the runoff flows into the large voids ofthe open joints. During rainstorms, the writer has been in canyonsformed in highly jointed sandstone and seen runoff flowing into jointsand cascading downward inside them. Part of this runoff came out of thejoints at the base of the canyon walls and became streamflow and partremained in the sandstone and recharged the aquifer.
Aeolian sand deposits commonly overlie the Navajo Sandstone inthe project area. They differ considerably in thickness from place toplace, but an estimated maximum thickness is 25 ft (7.6 m). Generallythe top of the saturated zone in the Navajo is considerably more than 25ft (7.6 m) below the land surface so that, in most places, the top ofthe saturated zone is also below the base of the sand deposits. Thismeans that infiltrating water must generally pass through the sand deposit and through sandstone before reaching the saturated zone. Wherethe thickness of the overlying sand deposit and of the unsaturated sandstone are significant, the chance of infiltration to the saturated zoneis greatly reduced if not nullified.
Water infiltrates the sandstone from streams; this was proved byseepage measurements of two perennial streams and one ephemeral stream.Measurements of the perennial streams--Ash and Leeds Creeks--during periods of low flow in 1974 indicated minimum annual losses of 350 acre-ft(0.43 hm 3
) and 160 acre-ft (0.2 hm 3), respectively. During periods of
high flow, losses would be larger. The one ephemeral stream measured,whose channel is in fractured bare sandstone, was City Creek north ofSt. George. The measurements were made when water from a well was inthe channel. The test reach was 0.25 mi (0.4 km) long and the loss was15 percent of the flow entering the reach. Although ephemeral streamscarry water for relatively short periods each year, mainly from summerstorms, the volume of water lost from them to infiltration may be large.Many such streams cross the Navajo Sandstone where it is highly fractured (figs. 3-7) and has no surficial cover, so that losses could belarge.
Recharging water infiltrates the Navajo Sandstone from the overlying Carmel Formation. North of St. George the potentiometric surface(pl. 3) indicates that the movement of ground water in the Navajo isaway from the Pine Valley Mountains, a main recharge area. However, inthe Pine Valley Mountains the Navajo does not crop out but is overlainby a thick sequence of formations and directly by the Carmel (pl. 1).Therefore, if the formation does not crop out but contains ground water,recharge can occur only by water infiltrating through formations stratigraphically higher than the Navajo.
Ground water flows into the Navajo Sandstone of the project areafrom the area east of the Hurricane Cliffs. This is inferred from thedirection of the gradient of the potentiometric surface (pl. 3) and the
17

generally poor recharge conditions in the southeastern part of the project area. The potentiometric surface has an overall gradient away fromthe Hurricane Cliffs south of Hurricane City. Here the saturated Navajois mainly buried by younger rocks because of graben faulting. Rechargeprobably does not occur or is no more than negligible in the area justwest of the cliffs because the deep saturated zone is overlain by generally more than 300 ft (90 m) of unsaturated materials which are predominantly clay, silt, and very fine sand, that is, materials that tendto reduce significantly or even prohibit water movement.
Ground water flows from the Kayenta Formation into the NavajoSandstone in the southeastern part of the project area at the southernedge of the Hurricane Bench. This is evidenced by a lack of naturaldischarge from the nearby Navajo escarpment, by the water level in well(C-43-l3)2lcaa-l, which is in the Kayenta even though the well was spudded in the Navajo, and by water levels in wells on the Hurricane Bench,(downgradient from well (C-43-l3)2lcaa-l), which are in the Navajo. Thepotentiometric-surface gradient in this part of the area is mainly tothe northwest, suggesting that the ultimate source of the water is eastof the Hurricane Cliffs.
The complexity of the recharge system and the difficulty of determining the magnitude of each of the items of recharge necessitatedthe use of a hydrologic-budget equation for estimating the total recharge. The amount of recharge for 1974 was estimated by using the following ground-water budget equation:
R = Ds + Dsp + Dl + Dw + De - 65
where,
by wells,by evapotranspiration, andstorage (decrease in 1974).
Dw=De =
65 =
R = total recharge to the Navajo Sandstone in the project area,Ds = discharge by seepage into streams,Dsp = discharge by springs,Dl = discharge by percolation into the Kayenta Formation (un-
known) ,dischargedischargechange of
Values for discharge and storage are explained in other sectionsof this report. Storage in 1974 is assumed to have generally notchanged in the project area except for St. George City's Gunlock wellfield, where declining water-level trends in wells show discharge to exceed recharge. In the Gunlock well field, storage decreased an estimated 1,600 acre-ft (2 hm 3
). Substituting the values for each of theitems of discharge and change of storage in the ground-water budgetequation gives a minimum recharge value (rounded) of 17,000 acre-ft (21hm 3
) as follows:
R = 11,100 (14 hm 3) + 5,000 (6 hm 3
) + Dl (unknown)+ 2,300 (2.8 hm 3
) + 500 (0.6 hm 3) - 1,600 (2 hm 3
).
18
Movement
Movement of ground water is generally from the Pine Valley Mountains, the Bull Valley Mountains, and the area east of the HurricaneCliffs toward the Virgin River and its tributaries (pl. 3). Only thepart of the Navajo Sandstone from about Toquerville southward to theArizona line receives water that has originated outside the projectarea.
A comparison of the general direction of ground-water movement,as shown by potentiometric contour lines, with the attitudes of thelarge structural features indicates that this direction is independentof the strike or plunge of the structures. That is, the generallysmooth-trending contour lines in the vicinity of the structures suggeststhat the water moves across the structures with no appreciable effect onthe direction of movement toward the major surface-drainage lines. However, joints, where open, have a strong influence on the local directionof flow. This is because an open joint having a particular cross-sectional area has a greater permeability than the same cross section ofunjointed sandstone having only intergranular openings. The greaterpermeability of the jointed sandstone means that there is a greater easeof movement of water along joints than through intergranular openings.From figures 3-7 it can be seen that there are two or more joint setsthat cross one another in each area. From fieldwork it was seen thatsome of the individual joints are closed, some are open, and some aresectionalized into open and closed parts. Obviously, the path of a dropof ground water is necessarily a tortuous one as it moves in jointedrocks from recharge areas to the areas of discharge.
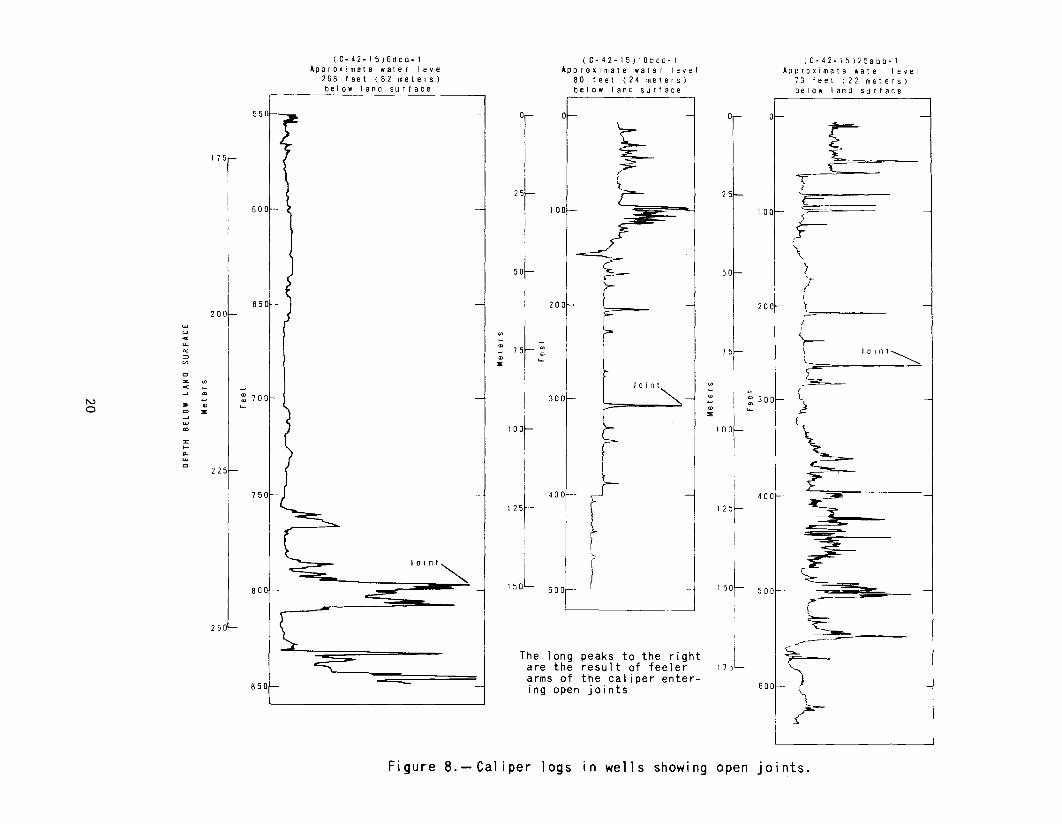
Open joints are conspicuous at the land surface and are seen toextend vertically in canyon walls for as much as 200 ft (60 m). However, it cannot be presumed from such observations that the joints areopen to considerable depths below the water table because weathering,erosion, and shallow tensional stresses are mainly responsible for thesize of the openings at and near the land surface. Probably most jointsthat are open at the surface gradually close with depth; however, a fewmajor joints are open to significant depths because of deep-seated tensional stresses in the earth's crust. Caliper logging in wells provedthat joints are open below the water table (fig. 8). However, mostwells do not penetrate more than 60 percent of the formational thickness, so it is not known if joints remain open for the full formationalthickness. Assuming that most joints become narrower with increaseddepth, their importance as conduits of water must decrease with increased depth. With increased depth, therefore, intergranular openingsincrease in importance as water conduits so that the movement of wateris increasingly controlled by these openings and less by open fractures.
Faults theoretically may be permeable and serve as conduits forthe movement of water or they may be impermeable and serve as barriersor deflectors. It is also conceivable that a particular fault may beimpermeable in one place along its strike and permeable in anotherplace. From geologic fieldwork in the project area, it is inferred thatsome faults are impermeable at depth.
19
(C· 42·15)6dcd·l (C-42-15)IObcd-1 (C- 42-15 )25abb·1Approximate water level Approximate water I eve I Approximate water level
268 feet (82 meters) 80 feet (24 meters) 73 fee t (22 meters)below land surface below land surface below land surface
550~ ~ Or 0 0 0
~ r17T
..J\ .~ +'".~~L
b ""f
I25 ~
¥= 1 00 =-=I FI
+ + \fI I
''I lI 200
1200 t_
20r
,,~~.---
~
~'-' '".. -~ .,"" - \ JOlnt~:::>
I
I .,I ,~ -
'" I :0;
co
I: "'"'''l
z '" '".. ~ - - - t.... .,: 700 300 . ~. '"N - - ., )a '"' .,~ ., ~co :0;
10+
:0;.... I l •~
100II>
J '=-:J::
I....
ia.~
1co I
I
( 1"'~i
7501- J -l
125r
400 . 400
1'-
J 0 i n t .... I
,50L 501.
r J 150~8001- -j !500=- r
250L.. I \ I ~~
The long peaks to the right,75L J~are the result of feeler
85 of-- -- -larms of the cal iper enter-ing open joints \
£--~
Figure a.-Caliper logs in wells showing open joints.

Faults in some cases are identifiable in the field by what hasbeen termed for this study, a trellis zone. A trellis zone is narrowand linear and consists of a network of complexly intersecting fracturesfilled with siliceous cement. These zones are dense, indurated, andmore resistant to weathering and erosion than the bordering undisturbedsandstone, resulting in the formation of low hills or ridges.
Trellis zones have been formed by the fracturing of the rock during movement along shear zones, and the filling of the fractures by siliceous cement possibly formed by the in situ mobilization of the silicain the shear zones. Fault zones comprised of dense indurated rock inthe saturated zone most probably form impermeable boundaries to the flowof ground water.
Faulting results in the formation of barriers, partial or complete, to the flow of ground water where a formation of low permeabilityhas been juxtaposed against a formation of high permeability. The Gunlock fault illustrates such a case; the Kayenta and older formations oflow permeability have been displaced along the fault to a position nextto the Navajo Sandstone of higher permeability. Most of the groundwater moving in the Navajo toward the fault would be deflected by thelow-permeability formations; some water is deflected to the land surface, which is indicated by the seepage inflow to the Santa Clara River.
Thermal water discharging from springs or encountered in wellsthat are located near or on faults is an indication of some degree ofpermeability of the fault zone. For example, the St. George fault isinferred to be locally permeable because water near the fault is warmerthan expected for the normal temperature gradient of the project area.(See section on temperature.)
Discharge
Discharge of ground water from the Navajo Sandstone is by (1)seepage into streams, (2) springs, (3) percolation into the underlyingKayenta Formation, (4) wells, and (5) evapotranspiration. An accountingof the discharge, in acre-feet, for 1974 is as follows:
Seepage into streamsSpringsPercolation into the Kayenta FormationWellsEvapotranspiration
Minimum total (rounded)
Seepage into streams
11,1005,000
Unknown2,300
500
19,000
Ground water seeps into the Santa Clara and Virgin Rivers. Seepage into the Santa Clara River in 1974 was 1,100 acre-ft (1.4 hm 3 ) inthe reach that crosses the Navajo Sandstone. Seepage into the VirginRiver in 1974 was 10,000 acre-ft (12 hrn 3
) in the reach that crosses theNavajo. These amounts were determined from seepage runs during periodsof low flow.
21
Springs
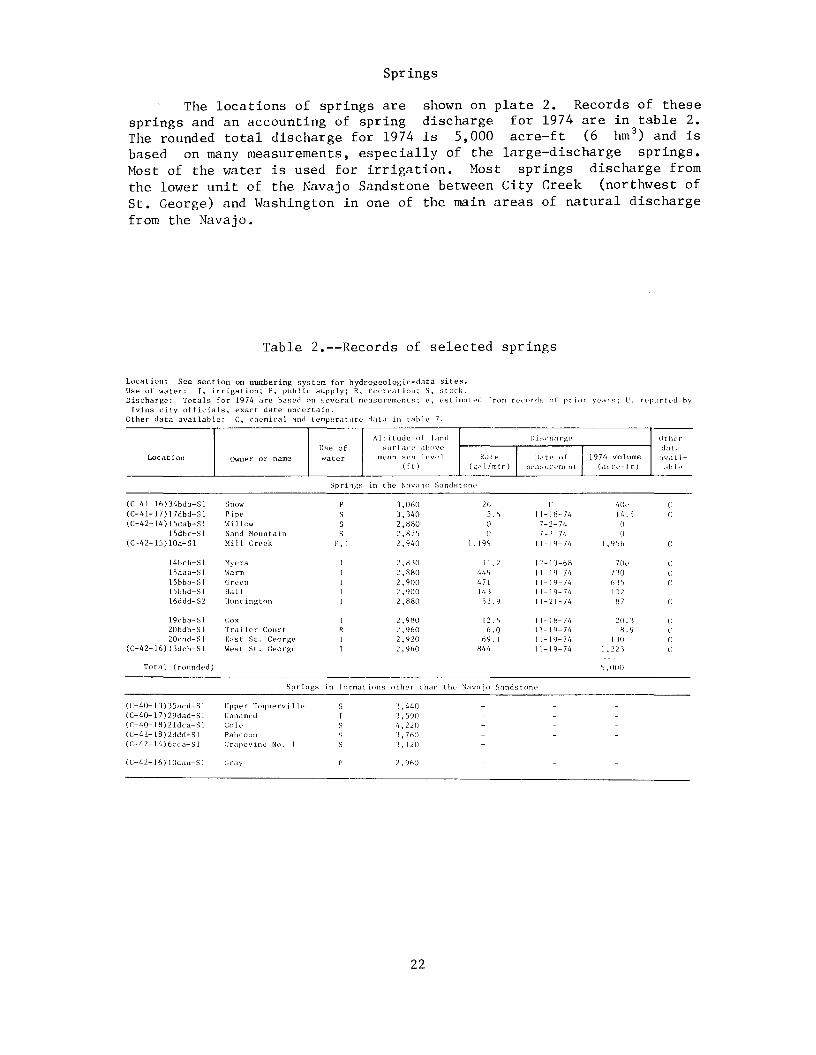
The locations of springs are shown on plate 2. Records of thesesprings and an accounting of spring discharge for 1974 are in table 2.The rounded total discharge for 1974 is 5,000 acre-ft (6 hm 3
) and isbased on many measurements, especially of the large-discharge springs.Most of the water is used for irrigation. Most springs discharge fromthe lower unit of the Navajo Sandstone between City Creek (northwest ofSt. George) and Washington in one of the main areas of natural dischargefrom the Navajo.
Table 2.--Records of selected springs
Location: See section on numbering system for hydrogeologic-data sites.Use of water: r. irrigation; p. public supply; R. recreation; S. stock.Discharge: Totals for 1974 are baspd on several m{'asurt'ffiL'nts; (', estimati'd from fL'cords of pril1r yl'ars; U, reported by
Ivins ~ity officials. exact date llncertaln.Other data available: C. chemical and temperattlH' (Llt,l in tab I ..., 7.
Location Owner or nameUse ofwater
Al t i tude of 1ilndsurfacl' above
mean sea 1{'V{' 1(f t)
Ratp I(gal/min)
Discharge
Datt' oj T1974 volumenW<lsureml'nt (acn'~ft)
Otlw[
dat:l
ava i 1-dh 1('
Spri~gs in thL' Navajo Sandstone
(C-41-16 )34bda-S 1 Snow P J,060 2h lJ 40c c(C-41-17) 17dbd-Sl Pipe S ] ,340 5.5 11-1 H-74 14" 'j C(C-42-14) 15dab-Sl Willow S 2, H80 0 7-2-7/, 0
15dbc-S I Sand Mountain S 2,H75 0 7-2-74 0(C-42-15) lOa-Sl Mill Crpek p. I 2,940 1,199 11-19-7/, 1,9',h C
14bcb-S I Myers 2, H]O 1 I "2 12-IJ-hH 70" C15aaa-S 1 Warm 2,880 449 11-19-74 no c15bba-S I Green 2,900 471 11-19-74 hJ) ("
15bbd-SI Hall 2,900 I L.'1 11-19-74 10216ddd-S2 Hunt ington 2, H80 ,)'1. 9 11-21-7!~ H7 C
19cba-SI Cox 2,9HO 12" 5 11-1 H-7/, 20.]20bdb-S I Trailer Court 2,9hO 6.0 11-19-7/, H.920cad-S I East St. George 2,920 69" I 11-19-74 1]0
(C-42-16) lJdcb-SI West St. George 2,960 H44 11-19-74 1,223
Total ( rounded) 5,000
________________sp:..r_i_n..::g_s_in_f_ormations other than till' N:lvi1jo SandstollP
(C-40-1 J) J 5acd-S I(C-40-17)29dad-Sl(C-40-18) 21dca- S I(C-41-18) 2ddd-S I(C-42-14) 6cca-S 1
(C-/,2-lh) 10daa-SI
Upper ToqtlPTvil]pUnnamedColi.'Pahcool1Crapl'v ine No. I
c;ray
"1,/,40J,5901•• 220],760"1,120
2.960
22

Percolation into the Kayenta Formation
Ground water percolates from the Navajo Sandstone into the underlying Kayenta Formation, but the amount of percolation could not be determined from the data available. That this percolation occurs is demonstrated by the fact that within part of the outcrop area of the Navajothe potentiometric surface is below the base of the Navajo. In otherwords, the Navajo is saturated beneath most of its outcrop area, but locally the potentiometric surface slopes downward beneath the base of theformation. Areas where the potentiometric surface is below the base ofthe Navajo are shown on plate 3. The location and approximate extent ofthese areas were determined partly by hydrogeologic fieldwork, partlyfrom wells, and partly by comparing the altitude of the base of the formation with the altitude of the potentiometric surface (pl. 3). Thewidths of these areas are only roughly approximated and they may be narrower or wider than indicated. The purpose of delineating such areas isto make prospective ground-water users and water-well drillers awarethat the thickness of saturated Navajo is not sufficient to completewells everywhere the formation crops out.
In the outcrop area between the Ivins and Washington faults, thepotentiometric-surface gradient indicates that the general flow ofground water is toward the escarpment that forms the southern limit ofthe outcrop area. Although the Navajo Sandstone is saturated withground water in this area, natural discharge from the formation is notindicated by springs, seeps, or phreatophytes along most of the escarpment above the base of the Navajo. Therefore, the Kayenta Formation ispermeable and ground water is flowing from the Navajo into the Kayentain this area of outcrop. Ground water is flowing from the Navajo intothe Kayenta also in the area from the Washington fault generally northeast to near Pintura, in the area west of the Ivins fault, in the Leedsarea, and in the area along the northwest flank of the Hurricane Bench.
In addition, the position of the potentiometric surface at a fewwells near the escarpment indicated that the saturated zone was not inthe Navajo Sandstone but in the Kayenta Formation. For example, well(C-42-l6)lccd-l taps the saturated zone about 100 ft (30 m) below thebasal contact of the Navajo.
Wells
The locations of selected wells are shown on plate 2. Records ofthese wells and an accounting of well discharge for 1974 are in table 5.The total discharge from all Navajo Sandstone wells for 1974 was 2,300acre-ft (2.8 hm 3
).
Most wells are used for public supply and irrigation. Most ofthe well water is pumped for the public supply of St. George City. Thedepth of the pumped production wells ranges from 54 to 900 ft (16 to 274m), and the average depth is 275 ft (84 m). However, the well depth ismainly dependent on the depth to the water table, which varies considerably in the project area. Of the developed areas, the depth is least
23

southwest of Hurricane and near Leeds and is greatest in the Gunlockwell field (secs. 7, 8, and 17, T. 41 S., R. 17 W.). The discharge rateranges from 20 to 2,000 gal/min (1.3 to 126 L/s) and averages about 540gal/min (34 L/s). Specific capacity determined for a 24-hour periodranges from 9 to 22 (gal/min)/ft [1.9 to 4.6 (L/s)/m] of drawdown andaverages about 16 (gal/min)/ft [3.3 (L/s)/m] of drawdown.
Evapotranspiration
Evapotranspiration of ground water by phreatophytes where thewater table is at or near the land surface occurs in three localities ofthe project area, and the average annual amount is estimated to be 500acre-ft (0.6 hm 3 ). Phreatophytes are concentrated in the flood plain ofthe Santa Clara River, along the stream channel below Green Springs, andalong the channel of Mill Creek downstream from the Mill Creek Springs.The phreatophytes grow in a mixed relationship, and the most common arecottonwood (Populus sp.), saltcedar (Tamarix gallica) , and the pasturegrasses, saltgrass (Distich lis stricta) and fescue (Festuca sp.). Thetotal area is 140 acres (57 hm 2 ), and the average annual rate is assumedto be 3.8 acre-ft (0.005 hm 3 ) per acre (0.4 hm 2 ).
Hydraulic properties
Porosity
Porosityl of the Navajo Sandstone was determined by laboratoryanalysis (table 3) and by borehole techniques using resistivity and neutron logs (table 4). The laboratory analysis was of rock samples fromselected outcrops above the water table. The resistivity and neutronlogs were made in wells of different depths that penetrate the saturatedzone. Methods for determining porosity from geophysical logs have adistinct advantage over the laboratory method in that they enable thedetermination of the hydraulic properties of the water-bearing rock under natural conditions.
Laboratory analysis of rock samples indicates that the averageeffective porosity of 17 percent is about 53 percent of the average total porosity of 32 percent.
lThe porosity of a rock or soil is its property of containing interstices or voids and may be expressed quantitatively as the ratio ofthe volume of its interstices to its total volume. It may be expressedas a decimal fraction or as a percentage. Effective porosity refers tothe amount of interconnected pore space available for fluid transmission. It is expressed as a percentage of the total volume occupied bythe interconnecting interstices.
24

Table 3.--Porosity of the Navajo Sandstone determinedfrom rock samples from selected outcrops
Effective EffectiveLocation of porosity Location of porosity
sample (percent) sample (percent)
(C-40-13)3bad 11.0 (C-41-17) 8cca 14.6(C-40-l2) 26dbc 13.4 17dbd 12.0
35aaa 25.1 (C-42-l4) 24acc 10.436 25.2 34acc 16.6
(C-41-15) l8ddd 19.7 (C-42-l5) 6dcc 17.6(C-4l-l6) 10dbd 19.5 20cdb 20.7
Average (rounded) 17
Table 4.--Porosity of the Navajo Sandstone determinedfrom resistivity and neutron logs of wells
Total porosity: Value is an average of both typesType of log used: N, neutron; R, resistivity.
Well
(C-4l-l3) 6aac-l3lacd-l
(C-4l-l6)16cdb-l(C-4l-l7) 7ada-l
(C-42-13) 7bba-118bcb-118bcb- 2
(C-42-14) 25abb-1
(C-42-15) 6dcc-16dcd-1lObcd-115abb-1
(C- 42-16) 1ccd-1
Average
Total porosity(percent)
34404630
29403720
34401821
25
32
25
of logs.
Type oflog used
N, RNN, RN
N, RN, RN, RN, R
N, RN, RN, RN, R
N, R
Aquifer tests
Purpose and procedure for testing
The hydraulic constants of an aquifer can be determined by several methods, one of the most important being the aquifer or pumpingtest method. This method utilizes a well which is pumped and one ormore wells that are used to observe the change of water levels that results from the pumping. The chief advantage of this method is in therelatively large volume of water-bearing material that can be tested.
Following is an outline of the testing procedures used. The aquifer tests were evaluated using the type curves and assumptions statedby Prickett (1965). For several days prior to the aquifer tests, waterlevels were measured in the pumped and observation wells, and the discharge was measured at selected springs to determine the trend of changes in ground-water storage in the areas to be tested. During the pumping period, the discharge was maintained at a nearly constant rate,while water levels were measured periodically using the wetted-tapemethod or by using automatic water-stage recorders. Water levels weremeasured from a stable point (called the measuring point) on the wellcasing or on a special tubing for water levels attached to the inside ofthe casing. Discharge was measured periodically using either a Parshallflume, in-line flow meter, Hoff meter, or Cox meter. The temperatureand conductivity of the water were also collected several times duringthe test. After the pump was turned off, water levels and spring discharges were measured for a period of time comparable in length to thepumping period.
Description of tests
Gunlock area.--The location of the wells used in the test andother pertinent information are shown in figure 9 and in table 6.
The pump of well (C-41-17)8cda-1 was turned on January 22, 1974,and turned off February 6, 1974, for a total pumping time of 15 days.The average rate of pumping was 1,960 gal/min (124 L/s), but the instantaneous rate dropped from 2,600 gal/min (164 L/s) 10 minutes after thetest was started to 1,875 gal/min (118 L/s) just prior to turning offthe pump. The drawdown was 121.5 ft (37.0 m) at the end of 15 days.The 24-hour specific capacity was 22 (gal/min)/ft [4.6 (L/s)/m] of drawdown.
Pumping from well (C-41-17)8cda-1 caused observed drawdowns inonly two of the four observation we11s--(C-41-17)8cac-1 and (C-41-17)17bdb-l. The maximum observed drawdown in well (C-41-17)8cac-1 was 8.45ft (2.58 m), and the drawdown in well (C-41-l7)17bdb-1 was 1.37 ft (0.42m). There was no observed drawdown in wells (C-41-17)7ada-1 and (C-4117) 7ddb-l.
The reason for the two observation wells not being affected isbecause pumping did not continue long enough for detectable effects toreach them. At these two wells, computed drawdowns were only 0.33 and
28
,------,---,-~~~~~-~-~R.__L~__~
~~---.-~-,-----_.~~~~
II
lOb c - 1
(C-42-15)15abb-1 T.
--;;;t--.-+- ~.~-_._~- 42S.
I I 5. 5
650
21 22
Gr~en 231Spring
1 6 15
Qddleton
':1" 500~~ feet
20
1 7
St. George
CoxSp r lI!g 19
I 8
o100 __1
"----------'-----'- ----~
CI TV CREEK·MI LL CREEK AREAS
EXPLANATIONo
231. Observation well
@ Pumped we 110, I I 5. 5
650 Upper numher is drawdown, infee t.. if more than one number,first is for test in which wellwas pumped, second is for testin which well was not pumped.Lower number is depth of well,in feet
\ Spring
Figure 9.-Map showing location of wells and springs, distances frompumped wells to observation wells and springs, total drawdown, anddepths of wells for selected aquifer tests in the Navajo Sandstone.
30
________K, 17 L _
o244•(C-41-17)7ada-l
"/00
/'
(C-41-17)8cac-l ~~/
\ "~~~~500 f e f-1:(C-41-17)7ddb-l --~~__~~~__{
3850 feeto
"- ~O \__-
1 . 37
626
T.41S.
1 B
R. 14 W.
GUNLOCK AREA
-------,--
II
17
R. 13 W.
L _
w~ 7
<1
.400(C-42·13)7ccb·l
1.2
S.
HURRICANE BENCH AREA
Figure 9.- Continued.
31

The absence of interference effects after 10 days of pumping indicates astorage coefficient that is probably on the order of 0.04 or in therange of values for other test sites in the project area.
In the third test, well (C-42-l5)6dcd-l was turned on January 29,1975, and pumped continuously until February 2, 1975, for a total timeof about 4 days. The average rate of pumping was about 640 gal/min (40L/s). The total drawdown was 57.94 ft (17.66 m). The 24-hour specificcapacity was 20 (gal/min)/ft [4.1 (L/s)/m] of drawdown. The specificcapacity for the first step was more than for the second step when itwas 18.8 (gal/min)/ft [3.9 (L/s)/m] of drawdown. During the secondstep, the average pumping rate was 1,100 gal/min (335 L/s) compared tothe average of 470 gal/min (143 L/s) for the first step. The increasein pumping rate by more than twice caused an increase in the frictionhead loss in the aquifer and well that resulted in the pumping waterlevel in the well being lowered considerably. The lower water levels inthe wells resulted in a diminished amount of openings through which water could enter by 5.5 percent. The specific capacity is diminished alike amount or 1.2 (gal/min)/ft [0.2 (L/s)/m], thus accounting for mostof the diminished specific capacity during the second step.
Pumping of well (C-42-l5)6dcd-1 caused drawdown in observationwell (C-42-l5)6dcc-l but at no other point of observation. The drawdownwas 2.4 ft (0.73 m).
Leeds area.--The location of the two wells used in the test andother pertinent information are shown on plate 2 and in table 6. Thepump of well (C-41-13)5bbc-l was turned on October 7, 1974, and pumpedcontinuously until October 11, 1974, for a total pumping time of practially 4 days. The average pumping rate was about 600 gal/min (38 L/s).The water level prior to pumping was 79.22 ft (24.15 m) below land surface. Water levels could not be measured accurately during pumping because of water leakage from the pump column; water levels during recovery could be measured accurately. The estimated drawdown is 40 ft (12m). The estimated 24-hour specific capacity is 14 (gal/min)/ft [2.9(L/s)/m] of drawdown.
Pumping from well (C-4l-l3)5bbc-l caused drawdown in the singleobservation well (C-4l-l3)6aac-1 about 1,650 ft (500 m) to the west.The drawdown was 1.63 ft (0.49 m). Interpretation of the test data indicated a transmissivity of 3,500 ft 2 /d (325 m2 /d) and a storage coefficient of 0.05. However, these values are not representative of the Navajo Sandstone alone but represent also an unknown saturated thickness ofthe underlying Kayenta Formation.
Hurricane Bench.--The location of the wells used in the test andother pertinent information are shown in figure 9 and in table 6. Thepump of well (C-42-l4)12dda-l was turned on October 23, 1974, and pumpedcontinuously until October 30, 1974, for a total pumping time of about 7days. The average pumping rate was about 400 gal/min (25 L/s). The total drawdown was 38.8 ft (11.8 m). The 24-hour specific capacity forthe test was 12 (gal/min)/ft [2.5 (L/s)/m] of drawdown.
32

Pumping of well (C-42-l4)12dda-l caused drawdowns in observationwells (C-42-l3)7ccb-l and (C-42-l4)12dbb-l of less than 1 ft (0.33 m).However, interpretation of the water-level data indicated that infiltration of the water discharged from the pumped well was reaching thesaturated zone and causing a significant decrease in the rate of drawdown in the wells. As a result, data from the observation wells couldnot be used satisfactorily in determining aquifer coefficients.
Storage
Changes
Changes in the amount of ground water in storage are a directfunction of the changing relation between recharge and discharge. Whenrecharge exceeds discharge, water levels in wells rise as the amount ofwater in storage increases and spring discharge increases. Conversely,when discharge exceeds recharge, water levels decline and spring discharge decreases. In the Navajo Sandstone of the project area, changesin storage are controlled mainly by precipitation and well discharge.
Figure 10 shows the relation of water levels in a well and discharges from two springs to changes in precipitation, and table 8 showsperiodic water-level measurements in 20 observation wells.
A significant long-term change in storage in the Navajo Sandstonenorth of the St. George-Washington area has not occurred during the period of record as inferred from spring discharge (fig. 10). This inference is valid because the springs are part of a main discharge area ofthe formation. From 1965 to 1974, when precipitation was above average7 out of 10 years, the maximum discharges were slightly larger at theend of this period than at the beginning, a result of the increased precipitation, which produced above-average recharge.
Water levels in most observation wells (figs. 10 and 11) show nosignificant changes in storage during the periods of record. In most ofthe localities represented by these wells, levels in 1974 were slightlyhigher at the end of the year than at the beginning, indicating that theabove-average precipitation increased the amount of water in storage andreplenished the water pumped. However, the water level in observationwell (C-41-l7)7ada-l in St. George City's Gunlock well field declinedalmost steadily from the beginning of record in 1966 (fig. 10). Thisgeneral decline is in opposition to the general rise of the cumulativedeparture curve or precipitation at St. George; in the 10-year period1966-75, seven of the years had above-average precipitation. Therefore,the water-level decline indicates a local decrease of water in storagedue to pumping from the Gunlock well field. The largest water-leveldecline began in 1970 when the pumping demand increased significantly asshown on the next page:
33

Calendar year
1968 (first year of pumping)196919701971197219731974
Acre-feet
163202
1,295734
1,521420
1,763
In addition to the observation w~ll, the four pumped wells in theGunlock well field have static water levels that are about 7 to 22 ft(2.1 to 6.7 m) lower in 1974 than when pumping began in 1968. The small
+50...a:::>....a:
'"..~..."... - -50
'" "... E
> - -1 00.... .-.. ::IE....::>::IE::>'-'
-200
: - 2.cuc:- - 4
-6
62 202
...u..
'" .... 21 0.... a:... ::> ",65> '"....... '" " "z - ~220a:" "....... ::IE........ '"....... 70 230'"
7 1 234
,,,''''/0'"/.,.....
(C·41-17)7ada·l
... ;;; 0 .05 - 2toa: 0- ".. 0-
% '" -u ~
'" " "- "'" " -E
.- 1.- .c.c ::>::> u
u
(C-42·15)15bba-Slo ,..::..--1 ·...l.-.--~....L_·~_~_'_-l- __~.L-_....L.....-Cl-l-L-.-..L.--"·.L··~~.J...---.l--J-_~ __ L-,_ J _.i ...1- t.n
~ t.n t.n m m ~ ~
en en en 0') 0) OJ en
Figure 10.- Relation of water levels in a welland discharge from two springs to cumulative
departure from the 19~7-75 average annualprecipitation at St. George.
34
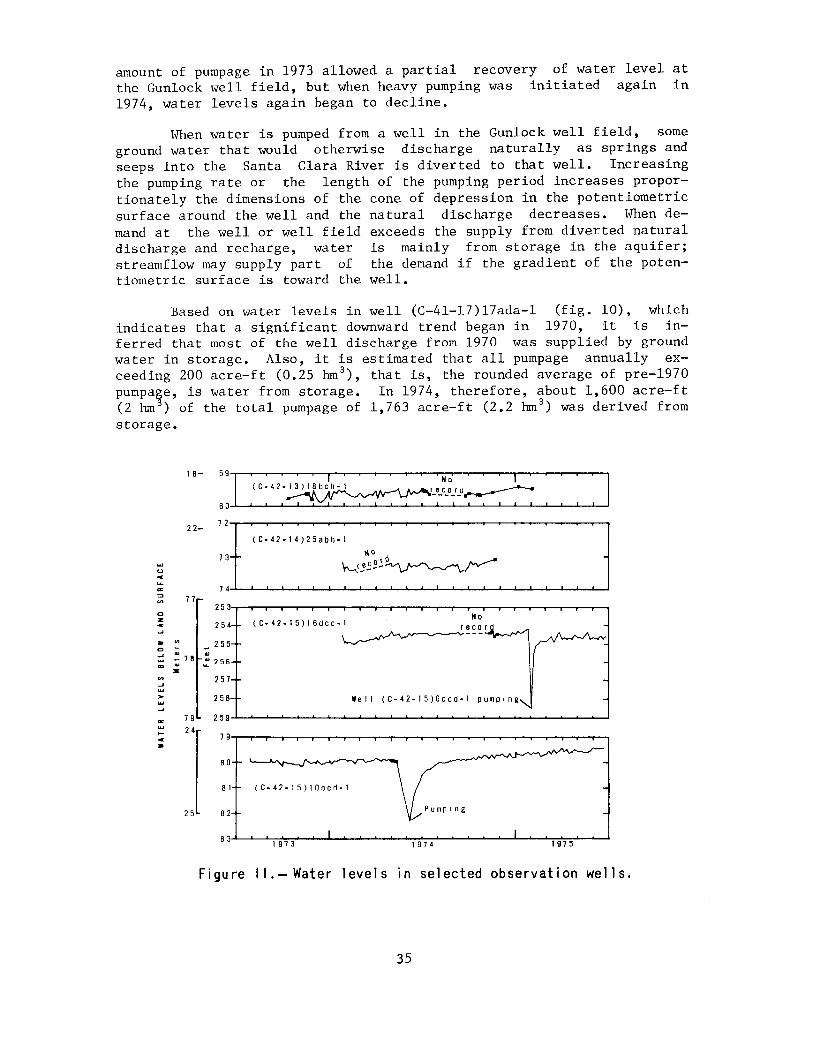
amount of pumpage in 1973 allowed a partial recovery of water level atthe Gunlock well field, but when heavy pumping was initiated again in1974, water levels again began to decline.
When water is pumped from a well in the Gunlock well field, someground water that would otherwise discharge naturally as springs andseeps into the Santa Clara River is diverted to that well. Increasingthe pumping rate or the length of the pumping period increases proportionately the dimensions of the cone of depression in the potentiometricsurface around the well and the natural discharge decreases. When demand at the well or well field exceeds the supply from diverted naturaldischarge and recharge, water is mainly from storage in the aquifer;streamflow may supply part of the demand if the gradient of the potentiometric surface is toward the well.
Based on water levels in well (C-41-l7)17ada-1 (fig. 10), whichindicates that a significant downward trend began in 1970, it is inferred that most of the well discharge from 1970 was supplied by groundwater in storage. Also, it is estimated that all pumpage annually exceeding 200 acre-ft (0.25 hm 3
), that is, the rounded average of pre-1970pumpage, is water from storage. In 1974, therefore, about 1,600 acre-ft(2 hm 3 ) of the total pumpage of 1,763 acre-ft (2.2 hm 3
) was derived fromstorage.
18-
22-
73
(C-42-14)25abb-l
~o
~!~2~~
cz......
77
254
_ 255
'":. 256
No(C.42.15)16dcc-l .rl
reco~ .A/~----- A
Well (C-42-15)6dcd·l pumping,
257
258
7 9 2 5 91-L--'-.........---'o.--'---O.--'-----"---"---''--''---'--''--"'-----'---............................--'--'-.........---'o.--'---O.---I
24
CI>.......>.......a:.........•
80
81 (C-42-15)10bcd-1
25 82
Figure 11.- Water levels In selected observation wells.
35
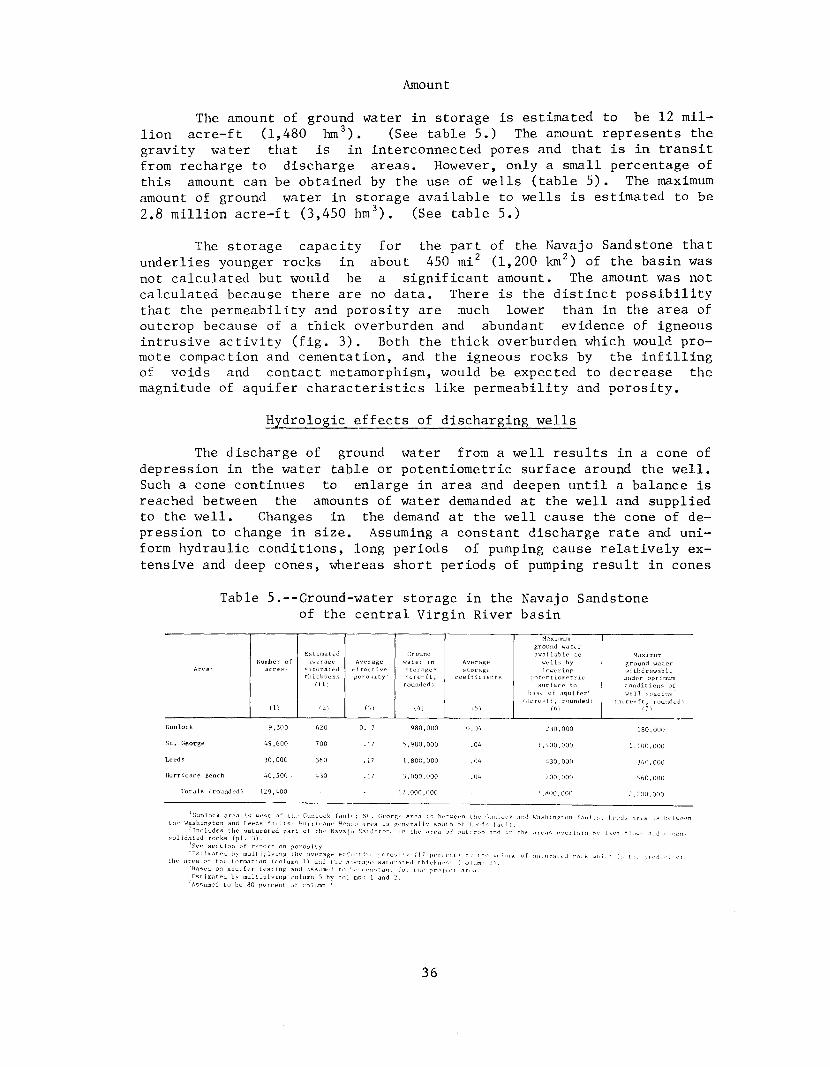
Amount
The amount of ground water in storage is estimated to be 12 million acre-ft (1,480 hm 3
). (See table 5.) The amount represents thegravity water that is in interconnected pores and that is in transitfrom recharge to discharge areas. However, only a small percentage ofthis amount can be obtained by the use of wells (table 5). The maximumamount of ground water in storage available to wells is estimated to be2.8 million acre-ft (3,450 hm 3
). (See table 5.)
The storage capacity for the part of the Navajo Sandstone thatunderlies younger rocks in about 450 mi 2 (1,200 km 2
) of the basin wasnot calculated but would be a significant amount. The amount was notcalculated because there are no data. There is the distinct possibilitythat the permeability and porosity are much lower than in the area ofoutcrop because of a thick overburden and abundant evidence of igneousintrusive activity (fig. 3). Both the thick overburden which would promote compaction and cementation, and the igneous rocks by the infillingof voids and contact metamorphism, would be expected to decrease themagnitude of aquifer characteristics like permeability and porosity.
Hydrologic effects of discharging wells
The discharge of ground water from a well results in a cone ofdepression in the water table or potentiometric surface around the well.Such a cone continues to enlarge in area and deepen until a balance isreached between the amounts of water demanded at the well and suppliedto the well. Changes in the demand at the well cause the cone of depression to change in size. Assuming a constant discharge rate and uniform hydraulic conditions, long periods of pumping cause relatively extensive and deep cones, whereas short periods of pumping result in cones
Table 5.--Ground-water storage in the Navajo Sandstoneof the central Virgin River basin
Maximumground watl'r
Estimated Cround avai lable to ~lilximum
Number of aVl;:'ra~l;:' Aver age wilter , n Averagt· '.kl1s hv ground waterAreal ,<atllratl2J c ff('clive stor,9ge ~ stot"<lge wi thdr<lwablL'
thickness poro~ity' ',9cre- it, coefficients under optimum(ft) rouod('<1 ) surface to conditions of
hi!s\ of dqui fer' w("11(.'lcro- t t, rounded)
(1) (2) (]i (4) ,5) (6'1
Gunlock 9,300 620 D.] 7 980,000 0,04 ":30,000 180,000
St, George {.9,600 700 .17 5,900,000 .04 1,400,000 1,100,000
Leeds 30,000 360 .n 1,800,000 .04 430,000 3M),DOO
Hurricane tlench 40,500 _ 430 .17 3, 000, 000 .D4 700,000 560,000
Totals ( rounded) 129,1+00 12,000,000 2,8000,000 ,200,000
iC;unlock ar('fl is w,,"st nf th(' Gunlock ffllll! Sl. Ct'orge Area is hett.'E't'n r.he 1~llnlol'k .1nd WashingtoTl falilts; I,{'eds ,1rl'CJ is !Jctwl't'nthp WiIshington and Let>ds faults; Hurricane fll:"t'a i~ Iv S(luLh of I-<,<-,ds fault.
'Includes the f>aturated part of ttl!' Navajo Sandston." thl' <lrf><l of outcrop '1nd in tht, ,1fl'as OVt'rl~Iin rv L'Vd f)ln,,'s anu 1111l:Ull-
rocks (pl. 'j).
section of
OV multiplylnK CJver<.lgtc pff,'cti'Jt, porosi!\, (17 ) b', thl' vr,]LJffiV ('I' sil!ul'atc,J r(Kk whil'!1 [s thl' P[Or!LIl'l ,1\
tIl(' <Irea of tIll-' formation 1) and the 11'It'ra!;t' sdtllratpJ (,',)Illmn :.'1-'Hased on aquifl:'f testing <'IOJ as:'lUffit>J to IH' ""n';tant fOI thl' prnj",'t 'Ir,"!.'Estimated by multiplying column 5 bv coillmns 1 and 2,'Assumed to b(> 80 p('rcent o[ column b.
36
of relatively small extent and depth. The hydrologic effects of wellsdischarging from the Navajo Sandstone in the central Virgin River basininclude interference between wells and reduction of streamflow.
Interference between wells
Interference occurs between wells when the cone of depression ofone discharging well overlaps the cone of another. Such overlaps increase the drawdowns and thus reduce the rates of discharge in the affected wells. The magnitude of these effects is dependent upon the hydraulic properties of the aquifers, the rates of discharge, the distancebetween wells, and the length of the period of discharge.
Aquifer tests showed that interference will occur in significantamounts in several localities. The wells in which drawdown was inducedby a pumping well and the amounts of drawdown are shown in figure 9.
Interference to varying degrees can be assumed for any present orpotential well site in the Navajo Sandstone, especially where the groundwater is under confined conditions or where wells are closely spaced.The confined condition in the formation is locally known or inferredfrom the quick response of water levels in observation wells to nearbypumping wells, from the sympathetic response of water levels to barometric changes, and from the presence of open fractures in the saturatedzone where the fractures confine water as if it were in pipes. The analytical results of data from pumping tests show that the water is partly confined locally. The effects of confinement diminish rapidly withpumping time and distance from the pumped well.
Reduction of streamflow
Discharge from a well can affect streamflow where there is hydraulic connection between a stream and the aquifer from which a discharging well is withdrawing water. Where an aquifer is hydraulicallyconnected to a stream channel, wells discharging water from the aquifermay divert streamflow or water that would otherwise discharge into thestream channel as springs or seeps.
Hydraulic connection between streams and the aquifer system ofthe Navajo Sandstone is known for the Virgin and Santa Clara Rivers.Seepage runs made in these perennial streams indicated contributions ofground-water flow to the streamflow. Therefore, wells discharging fromthe Navajo would divert ground water that under natural conditions contributes to the flow of these streams.
Chemical quality and temperature
General relations
Important factors affecting the chemical quality of ground waterare the availability of soluble substances in the aquifers through whichthe water moves and the length of time the water is in contact with
37

these soluble substances. The Navajo Sandstone is mineralogically arelatively pure lithologic unit composed mostly of silica and other lowsolubility substances. The water that flows through such a lithologicmedium would expectedly dissolve relatively small amounts of mineralseven if the water was in contact with them for a long time. Chemicalanalysis of the water in storage (table 7) indicates that the concentration of dissolved solids and of the principal ions, in milligrams perliter, ranges widely as shown below.
Dissolved solidsBicarbonateSulfateChlorideSilicaCalciumMagnesiumSodium
Range
103-1,36081-309
8.1-6105.0-3803.5-3617-1406.4-58
0.3-290
Average
684198222106
19762298
The wide range in concentration of these constituents is mainly aresult of waters passing through different chemical environments withinthe saturated zone although the transit time from recharge to dischargeareas is also operative. Water percolating in the middle and upperunits of the Navajo Sandstone generally has a relatively small amount ofdissolved solids, for example, in the Gunlock, Snow Canyon, HurricaneBench, and Leeds areas. However, water that percolates in the lowerunit and along or near some faults has the largest amount of dissolvedminerals; this is seen in and north of the St. George-Washington area(pl. 3) where most springs discharge from the lower unit and faults arenumerous.
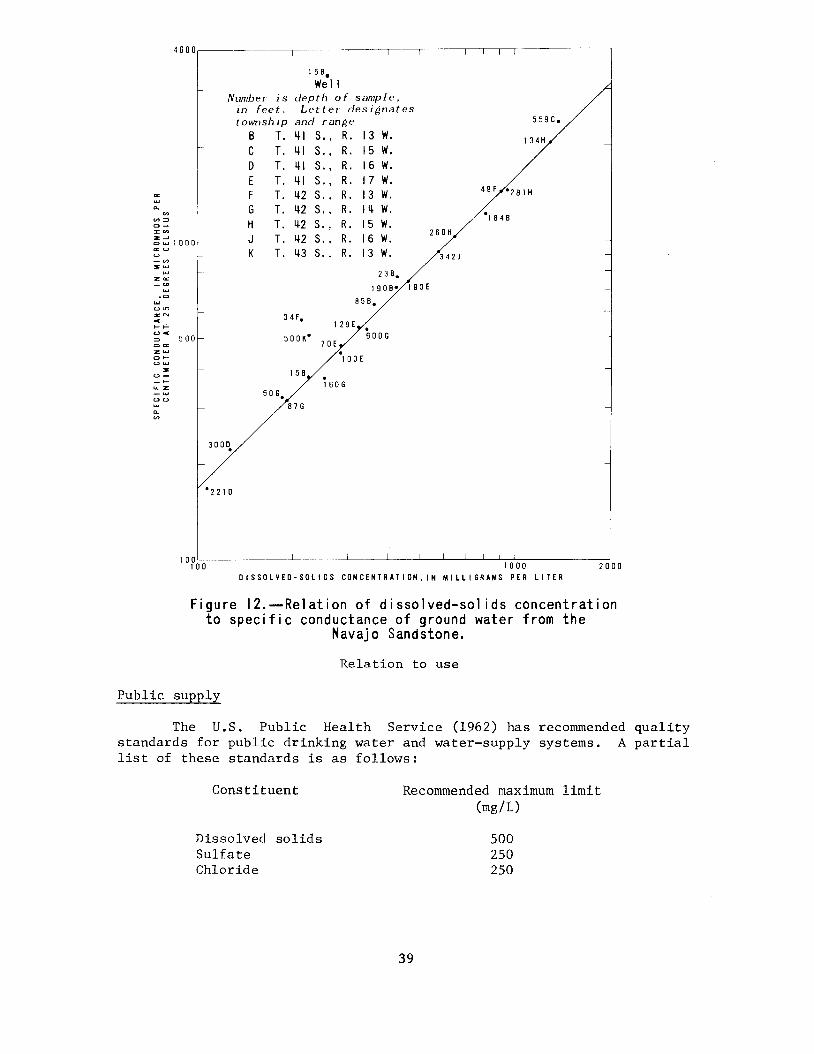
The concentration of dissolved substances in water is related tothe specific conductance, which is a measure of the ability of the waterto conduct an electrical current. The relations of the concentrationsof dissolved solids and the ions of sulfate and chloride to specificconductance are shown in figures 12, 13, and 14, respectively; thesefigures can be used to estimate the concentrations if the specific conductance is known.
The plots of data in figures 12, 13, and 14 indicate that thereis no direct relation between the depth below land surface of the saturated zone and either the concentration of dissolved solids or the concentrations of sulfate and chloride ions. The differences in chemicalcharacter of the ground water are therefore probably a function of geographic location because the Navajo Sandstone would be expected to havedifferences of composition from place to place.
38
238019080 190E
858 0
1 58.
WellNumber is depth of sample,
in feet. Let ter designatestownship and range
B T.~IS.,R.13W.
C T. ~I S., R. 15 W.D T. ~I S., R. 16 W.E T. ~I S., R. 17 W.FT. ~2 S., R. 13 W.G T. ~2 S., R. I~ W.H T. ~2 S., R. I 5 W.J T. ~2 S., R. 16 W.K T. ~3 S., R. I 3 W.
4000
<n<n:::>0-",<n::E"'"0~1000""uu_<n::E~
~
z: ""-'"~
.0
~
UU">%N<C........U<C:::> 5000""%~
0 ....U~
::Eu- ....u..%-~
uu~
0-<n
3000o
• 2210
I 29 E
500Ko
70E
01 00 E
158o1 60 G
87G
o600G
260H
342 J
-~l
559 Co
134H
49F 0281H
01 848
100'---100 1000
DISSOLVED-SOLIOS CONCENTRATION.IN MILLIGRAMS PER LITER2000
Figure 12.--Relation of dissolved-sol ids concentrationto specific conductance of ground water from the
Navajo Sandstone.
Relation to use
Public supply
The U.S. Public Health Service (1962) has recommended qualitystandards for public drinking water and water-supply systems. A partiallist of these standards is as follows:
Constituent
Dissolved solidsSulfateChloride
Recommended maximum limit(mg/L)
500250250
39

3 0 0 0 r-------r--,-----,----,---,---,-----,,---,-.
500
·2210
49F 281H·325 H
1848·
.559 C
.' 34H
i 90 E
·600 G
238.
.'60 G
858·34F
500K. 218. 179E••
70 E·
50G ·87G
.3000
1 58.
13 W.15 W.16 W.17 W.13 W.I~ W.15 W.
16 W.13 W.
158.
WellNumber is depth of sample.
in feet. Letter desifinatestownship and ranfie
B T. ~I S., R.C T. ~I S., R.o T. ~I S., R.E T. ~I S., R.F T. ~2 S., R.G T. ~2 S., R.H T. ~2 S., R.J T. ~2 S., R.K T.~3S.,R.
'"......V>
V>:::>0-:I: V>......~~ 1 000u-V>.......:0:'"-til...
• 0...u "':O:NoC>- >UoC:::>0'":0:'"0>U ...
•u_- >"':0:- ...UU......V>
10 0L-~~_ _L___'___.L.-_L--'---'-----'--'-...-l.....-.- ---L.- I I I -----l.--'.'---"--: .L.-_---'-__--L_.L-J'------"-'-----'-'_IL..JI1 10 100 1000
SULFATE CONCENTRATION. IN MILLIGRAMS PER LITER
Figure 13.- Relation of sulfate concentration to specific conductanceof ground water from the Navajo Sandstone.
The analyses in table 7 indicate that about 92 percent of thewells and springs yield water containing chloride in concentrations lessthan 250 mg/L and most of these less than 50 mg/L. The one spring andtwo wells yielding water containing chloride in concentrations exceedingthe recommended maximum limit are in the area between the St. George andWashington faults.
About 55 percent of the wells and springs yield water with dissolved-solids concentrations that are less than 500 mg/L (table 7).About 60 percent of the wells and springs yield water with sulfate concentrations that are less than 250 mg/L (table 7). Most of the wellsand springs that yield water that does not meet the recommended maximumlimits are in the area north of St. George and Washington.
Irrigation
Two important determinants of the usefulness of water for irriare the sodium-adsorption ratio (SAR) and the specific conduc
The SAR is a measure of the sodium hazard and the specific conis a measure of the salinity hazard. The higher these hazardsunsuitable the water is for irrigation. According to a c1assisystem by the U.S. Salinity Laboratory Staff (1954, p. 79-81),
gationtanee.ductancethe morefication
40
400 0~--.--- ,--.----,-----, 1 1 1 1 1 ---,-----,---,----,--'1-----'1--'-1,--,~-------',--,---"--,-,
600 Go
'""':::>ox'"::E...JowI>:UU
- '" 1 0 00::EW
WZI>:
-'"W.",
WuonZN
'"::; 500:::>"'I>:zw0 ....uw
::Eu_- ....~z
-wuuw"-
'"
S7 GO
.221 0
325H o
°1 S 4 S
°342 J
190 Eo 1 13 Bo
S5A129E 034F
10So070E °500KI1 00 E
160 GO °67 G
°50 G
°3000
559 Co
0\ 34 H
096 F
I 5 B.
WellNumber IS depth of sample.
In Feet _ Letter desi~nates
°23 B township and ran~e
A T. 40 S. , R. 17 W.B T. 41 S. , R. 13 W.C T. 41 S. , R. 15 W.D T. 41 S. , R. 16 W.E T. 41 S.• R. 17 W.F T. 42 S. , R. 13 W.G T. 42 S. , R. 14 W.H T. 42 S. , R. 15 W.J T. 42 S. , R. 16 W.K T. 43 S.• R. 13 W.
I 0 01'- L.---_~ _-'----'----'-I--'-I--LI-IL\:-'-:IO,--------L---'---"---'---LI---LI--,--I--11-1.Lao~-----'------'-----L--'---'----'---'---':-::'l 0 00
CHLORIOE CONCENTRATION, IN MILLIGRAMS PER LITER
Figure I~.- Relation of chloride concentration to specific conductanceof ground water from the Navajo Sandstone.
water with a specific conductance exceeding 750 micromhos/cm at 25°C hasa high salinity hazard and if it exceeds 2,250 micromhos/cm, the salinity hazard is very high. About 45 percent of the wells yield water withvalues of specific conductance exceeding 750 micromhos/cm (table 7);however, only one well yields water with a specific conductance exceeding 2,250 micromhos/cm. These same wells and springs have a low or medium sodium hazard and are mainly in the area north of St. George andWashington.
Chemical types
The most common anions in the ground \vater of the Navajo Sandstone include bicarbonate (HC03), sulfate (S04), and chloride (CI) (pl.3). In order to obtain an insight into the possible sources of groundwater, a determination of the relation of the three anions was made by amethod described by Hem (1970, p. 237-239). Types of ground water inthe project area based on ratios of the common anions, in milliequivalents per liter, are as follows:
1. Bicarbonate water2. Sulfate water3. Mixed water
41
HC03/(S04 + Cl) ~ 1S04/(HC03 + Cl) ~ 1No anion dominant

Bicarbonate water is the most common type in the Navajo Sandstone. Sulfate and mixed waters are fairly common, but sulfate is somewhat more common than the mixed type. In some localities, chloride isin significant amounts but is not dominant among the anions of any wateranalyzed.
Several conclusions can be drawn about the source of water fromthe relation of the areal distribution of anions (pl. 3) to geology.The sulfate ion dominates, or is in significant amounts, generally inground water that is in the lower unit of the Navajo Sandstone or in thesubsurface along or near a fault. However, the dominance of sulfate insome of the water west of Hurricane is most readily explainable by presuming a source for sulfate in the basaltic intrusive rocks that probably underlie the area in and around Volcano Mountain and that are genetically related to the volcanic rocks at the surface; hydrothermallyemplaced sulfur-bearing minerals are fairly common in igneous rocks.The chloride ion is in significant amounts in ground water moving alongor near faults north and northeast of St. George and near Leeds; part ofthis water is thermal.
Temperature
The temperature of ground water from the Navajo Sandstone rangesfrom 11.0° to 40.0 0 e. Commonly the range is from 17.0° to 26.0 0 e. Therange for wells is 11.0° to 40.0 0 e, but that for springs is 17.5° to24.0 0 e.
One reason for the large range in temperature is the effect ofaltitude; lower temperatures are at higher altitudes (Cordova, Sandberg,and McConkie, 1972, p. 38). Another reason is the natural increase oftemperature with an increase of depth (temperature gradient). That is,the deeper a well is drilled, the warmer the water encountered.
From a practical standpoint, there are two temperature gradientsin the project area; one is between the land surface and the saturatedzone, and the other is in the saturated zone. The first gradient (fig.15) is about 2.0 0 e per 100 ft (30 m) of depth below land surface, assuming a linear gradient based on the mean annual air temperature and thewater temperature at the water table. This gradient is usable for estimating ground-water temperature at the top of the saturated zone atpotential well sites if the depth to water is known.
Gradients in the saturated zone based on temperature logs inthree deep water wells and on a bottom-hole temperature in one deep oiltest are as follows:
Gradient(Oe per100 ft)
(e-39-l3)33ccd-l(e-4l-l6)16cdb-l(C-42-l4) 25abb-l(C-42-l5)6dcd-l
42
0.72.39.36.78
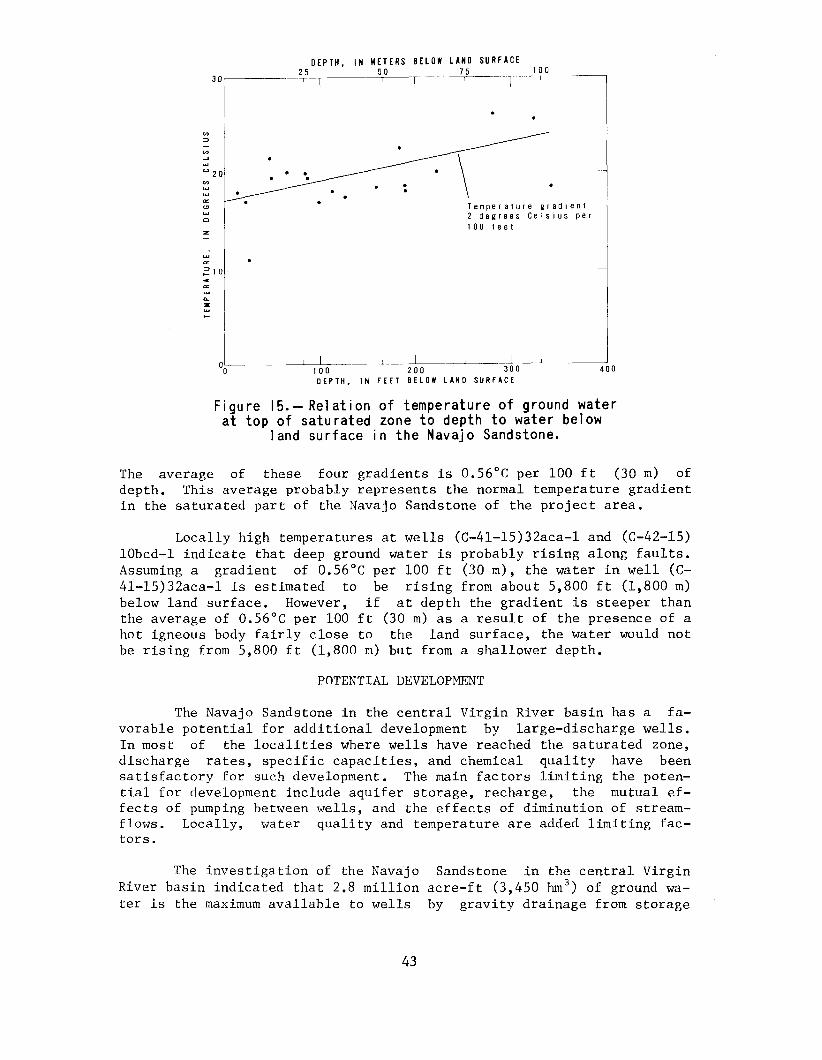
30
'":::>
'"...J~
'-' 20
'"~~
""'"~C
DEPTH, IN METERS BELOW LAND SURFACE25 50 75 100
I -! -r ----,
Temperature gradient2 degrees Celsius per100 fee t
~
""~ 1 0
""""~0..:IE~
"J'----~I:___. ----'--~I----'--o 100 200 300
OEPTH. IN FEET BELOW LANO SURFACE400
Figure 15.- Relation of temperature of ground waterat top of saturated zone to depth to water below
1and su rface in the Navaj 0 Sandstone.
The average of these four gradients is 0.56°C per 100 ft (30 m) ofdepth. This average probably represents the normal temperature gradientin the saturated part of the Navajo Sandstone of the project area.
Locally high temperatures at wells (C-4l-l5)32aca-l and (C-42-15)10bcd-l indicate that deep ground water is probably rising along faults.Assuming a gradient of 0.56°C per 100 ft (30 m), the water in well (C4l-l5)32aca-l is estimated to be rising from about 5,800 ft (1,800 m)below land surface. However, if at depth the gradient is steeper thanthe average of 0.56°C per 100 ft (30 m) as a result of the presence of ahot igneous body fairly close to the land surface, the water would notbe rising from 5,800 ft (1,800 m) but from a shallower depth.
POTENTIAL DEVELOPMENT
The Navajo Sandstone in the central Virgin River basin has a favorable potential for additional development by large-discharge wells.In most of the localities where wells have reached the saturated zone,discharge rates, specific capacities, and chemical quality have beensatisfactory for such development. The main factors limiting the potential for development include aquifer storage, recharge, the mutual effects of pumping between wells, and the effects of diminution of streamflows. Locally, water quality and temperature are added limiting factors.
The investigation of the Navajo Sandstone in the central VirginRiver basin indicated that 2.8 million acre-ft (3,450 hm 3
) of ground water is the maximum available to wells by gravity drainage from storage
43
in the outcropping part of the formation. In developing this resource,perhaps as much as 80 percent of this amount or 2.2 million acre-ft(2,710 hm 3 ) may be utilized. Another alternative, depending on the water-management policy, might be to utilize only the part replaceable byrecharge. If 80 percent of the amount is used, then the resource willbe depleted (mined) without consideration of the limits of replacementby recharge or of effects on natural discharge like springflow. If itis planned to use the resource with no long-term depletion, the magnitude of water that could be pumped must be less than or equivalent tothe replaceable amount, that is, recharge. The minimum amount of recharge in 1974 was about 17,000 acre-ft (21 hm 3
), and only a small percentage of this amount was discharged by wells.
Discharging wells in the project area have two effects on theground-water reservoir: (1) ground water is diverted from points ofnatural discharge such as springs, and (2) the potentiometric surface islowered. Increasing the amount of well discharge will add to these effects. The effects will be most noticeable where wells are close topoints of natural discharge or to other wells, and where water is confined in contrast to where it is unconfined. However, a relatively impermeable barrier between two wells or between a well and a point ofnatural discharge would lessen or negate the effects of dischargingwells on other sources of discharge.
Increasing the amount of well discharge also increases the possibility of diverting poor quality water from the lower unit of the NavajoSandstone and from faulted areas where warm or highly mineralized wateris circulating. Such a change in quality is likely in areas that arenear or between the St. George and Washington faults.
CONCLUSIONS
The Navajo Sandstone is essentially a quartzose sandstone about2,000 ft (600 m) in maXimUTII thickness. The formation is practicallyhomogeneous in the size and sorting of its grains.
Recharge is estimated for 1974 to be a minimum of 17,000 acre-ft(21 hm 3
). Movement of ground water is generally from the Pine ValleyMountains, Bull Valley Mountains, and the area east of the HurricaneCliffs toward the Virgin River and its tributaries. Discharge in 1974was a minimum of 19,000 acre-it (23 hm 3
); about 1,600 acre-ft (2 hm 3) of
this amount was from storage in the Gunlock well field. The dischargerate of individual wells averages about 540 gallmin (34 Lis); thespecific capacity averages about 16 (gal/min)/ft [3.3 (L/s)/m].
The average effective porosity in the saturated zone is an estimated 17 percent. The average specific yield was computed from aquifertests to be 4 percent. Based on laboratory analysis, the hydraulic conductivity of outcrop samples has an average value of 2.1 ftld (0.64mid); results of aquifer tests yield an average hydraulic conductivityof 5 ftld (1.5 mid).
44
A significant long-term change in storage has not occurred in alarge part of the area. A decrease in storage has occurred in St.George City's Gunlock well field. The maximum amount of ground water instorage available to wells is estimated to be 2.8 million acre-ft (3,450hm 3
), of which perhaps as much as 2.2 million acre-ft (2,710 hm 3) may be
recoverable by wells. The hydrologic effects of discharging wells include interference between wells and reduction of springf10w and streamflow.
The concentration of dissolved solids and of the principal ionsranges widely; for example, the dissolved solids range from 103 to 1,360mg/L. Water in the lower unit and in fault zones has the largestamounts of dissolved minerals.
The temperature of ground water ranges from 11.0° to 40.0°C. Theaverage increase of temperature with depth in the saturated zone is0.56°C per 100 ft (30 m).
The Navajo Sandstone in the central Virgin River basin has a favorable potential for additional development by large-discharge wells.In most localities where wells have reached the saturated zone, discharge rates, specific capacities, and chemical quality have been satisfactory for such development. The main limiting factors of potentialdevelopment include storage, recharge, and effects of pumping; locallywater quality and temperature are added limiting factors.
45

REFERENCES CITED
Cook, E. F., 1960, Geologic atlas of Utah, Washington County: Utah Geol.and Hineralog. Survey Bull. 70.
Cordova, R. H., Sandberg, G. W., andconditions in the central VirginResources Tech. Pub. 40.
HcConkie, Wilson, 1972, Ground-waterRiver basin, Utah: Utah Dept. Nat.
Geological Society of America, 1970, Rock-color chart.
Hem, J. D., 1970, Study and interpretation of the chemical characteristics ofnatural water [2d ed.l: U.S. Geol. Survey Water-Supply Paper 1473.
Johnson, A. H., 1972, The paleomagnetism of the Jurassic rocks from southernUtah: Case Western Reserve Univ. Ph. D. dissert.
Krumbein, W. C., and Pettijohn, F. J., 1938, Hanual of sedimentary petrography: New York, Appleton-Century-Crofts, Inc., 549 p.
Lewis, G. F., Irwin, J. H., and Wilson, R. F., 1961, Age ofGroup (Triassic and Jurassic) on the r,olorado Plateau:ica Bull., v. 72, no. 9, p. 1437-1440.
the Glen CanyonGeo1. Soc. Amer-
McCarthy, W. R., 1958, Geology of the Motoqua-Gun1ock area, Washington County, Utah: Washington Univ. M.S. thesis.
Prickett, T. A., 1965,table conditions:
Type-curve solutions to aquifer tests under waterGround Water, v. 3, no. 3, p. 5-14.
andYoung
Reber, S. J., 1951, Stratigraphy and structure of the south-centralnorthern Beaver Dam Mountains, Washington County, Utah: BrighamUniv. H.S. thesis.
Stiff, H. A., Jr., 1951, The interpretation of chemical water analysis bymeans of patterns: Jour. Petroleum Technology, v. 3, no. 10, p. 15-17.
Stokes, W. L., ed., 1964, Geologic map of Utah: Utah Univ.
Wiley, H. A., 1963, StratigraphyWash area, southwest Utah:
and structure of the Jackson Mountain-TobinTexas Univ. M.A. thesis.
U.S. Public Health Service, 1962, Drinking water standards: U.S. PublicHealth Service Pub. 956.
U.S. Salinity Laboratory Staff, 1954, Diagnosis and improvement of saline andalkali soils: U.S. Dept. Agriculture Handb. 60.
47

Table b.·-Records of selected wells as of February 1975
Location: See section on numbering system for hydrogeologic-data sites.Use of water or well: H, domestic; I. irrigation; p. public supply; S, stock; T, test; U. unused.Total depth: Reported by driller unless indicated by m. measured by U.S. Geological Survey personnel (date of measurement in parentheses).Diameter of borehole: Maximum diameter only for wells having more than one diameter.Finish of well: F, perforations and gravel packed; 0, open end; p. perforations; X. open hole.Altitude of potentiometric surface: Date of measurement other than October 1974 is shown in parentheses; numbers rounded to nearest foot; r, reported.Depth to top of Navajo Sandstone: Letters indicate type of cover - A, alluvial terrace or alluvial fill; C. consolidated sedimentary rocks younger than the Navajo Sandstone;
F. alluvial fan; G, gravel or boulders; L, lava rock; S, dune sand, some clay or silt layers locally; V, valley fill.Discharge: Measured by U.S. Geological Survey personnel unless indicated r, reported by driller or owner at time of construction; e, estimated; F, flowing.Specific capacity: D, values determined for 24-hour period; other values determined for periods other than 24 ,hours.Remarks and other data available: C, chemical analysis in table 7; L, geophysical log in files of U.S. GCologlcal Survey; W, periodic water-level measurements in table 8.
Remarks and otherdata available
.o~
Discharge
o.~
,~
.o
.C."oName or ownerLocation
Wells drilled into the Navajo SandstOne
(C- 39-13) Hccd·l(C-40·14) 35aab-l
(C-40-16) 34cad-l(C-41-13)4bab-l
4bbc-l
Sun Oil Co.Leeds Creek we 11
L. StaheliW. ScheuberH. Ludwig
19511973
197419661970
5,496405
280lISlOO
17\16
810
8 lOO
5,2404,360
4,5653,6803,670
3,666
o16G
145oo
leIe
Destroyed.Water table not reached; destroyed.Do.
C, w.C.
5aaa-l E. Wootl~n
5adb-l L. Howard
5adb-2 A. Howard
5bbc-l Goddard and Savage
6aac-l do
1960
1969
1974
1972
1972
60 14
54 14
97
Jlo
260 11
11
17
83
40
31
3,675 3,649
3,650 3,632(Jan. 1975)
3,650 3,629(Jan. 1975)
3,660 3,588
3,700 3,616
35 106 10e10-30-74
3S 85r
25GS
26E 550 91. 710-lD-74
27F 50r
c, W.
14D C, W.
C, L, W.
23bca-l Ash Creek well
31acd-l F. Judd(C-4l-l4)15ada-l U.S. Bureau of Land
Management(C-41-l5)30abc-l F, Holland and
M. Gubler32aca-l Terracor
(C-41-16)3dbc-l State of Utah
1969
19731963
1956
1974
1969
1,835 14
25965
215 16
600 14
900
140
25947
550
3,040 3,055r( 1969)
3,080 2,8993,220 3,190r
3,840
3,530 3,052(Nov. 1974)
4,400
l,700F'C 96F (I)2-5-75
l61AL 200r 0o 20r 4e
ISC
Drilled into alluvium, DakotaSandstone, Carmel Formation,and Navajo Sandstone. C.
C, L, W.
Water table not reached; destroyed.
C, 1.
Water table not reached; destroyed.
9cba-l Snow Canyon 2
16cdb-l Snow Canyon 1
(C-41-17)7ada-l Gunlock 4a
7ddb-l Gunlock 2
8cac-l Gunlock 1
8cda-l Gunlock 4b
17bdb-l Gunlock 3
(C-42-lJ)6bac-l W. Wilson
1974
1974
1966
1965
1965
1970
1965
1962
425 16
685
244m 16( 1969)
500 16
500 16
500 14
626 16
180
346
446
283
626
3,550 3,263(Sept. 1974)
3,440 3,254
3,600 3,382
3,580 3,384
3,480 3,379(Jan. 1974)
3,460 3,393(Jan. 1974)
3,460 3,377(Jan. 1974)
3,035 2,905
17S 822 92.07 ~ 1-74
35 630 565.610-28-74
OS 2,000 973.21-22-74
1,620 132.49-26-74
22A
C, L.
90 C, L, w.
Originally drilled to 375 ft.L, w.
C, W.
C, W.
220 c, W,
14 C, W.
6bac-l7bba-l7bba-l7bba-37cbb-l
7ccb-l
do
dododo
Hydro-Tech Co.
W. Wilson
19741958196219651964
1974
417185127705129
400
12
8161616
10018
50IS
3,0352,9602,9602,9602,950
2,950
2,9082,9132,9122,9092,918
(Nov. 1968)2,901
(.July 19"14)
22A
8511SL15S145
14s
725r400r
1,800r368
10 10-74
oooo
108.0
w.C, L, W.C,
C.
w.
18bcb-l18bcb-2
(C-42-l4)ladd-l12flda-l
12dda-l
15cda-l
15dab-l
25abb-l2Sadc-2
W. Johndo
W. Wilsondo
Dixie Springs Farm
W. Wilson
E. Willard
R. Graff
Tt'rr8cor )G. Woodbury
19581959
19691974
1964
1974
1971
1974
19701959
258194
300300
140
425
272
:wo
720165
814
1412
16
12
14
14
810
18II
145101
40
12
2,9802,980
2,9602,916
2,925
2,940
2,875
2,910
3,OlD3,030
2,9202,921
(Junt' 1974)2,8582,8922,9252,891
2,904
2,800(Jan. H71)
2,821(July 1974)
2,9372,931
(Aug. 1970)
45ISS
161AL365
65
415
35v
o4s
850r
42010-23-74
1568-4-70
40010-23-74
50r
200r
375
o2,6
IS .8
20l'
L, W.L.
C.
C.
12D C, W.
C, L, W.
26bbb-l3/+cad-l
(l>4L-15)6dcc·1
6dcd-l
lObcd-l
lSabb-l
['t'rracor 2T('rracor 1
Ci ty r:yt,t'k No. t
City Crt'ek No.
Washington City
F. Sullivan
19701970
1971
1972
[970
700
900
650
231m( 1973)
'4
16
511
3()
5(1
20
30
3,0)53,515
3,296
J,308
3,020
2,900
2,9473.080r
(July 1970)3,042
3,040(Sept. 1974)
2,940
2,866
45lOs
205
55
250T
1,3207-28-71
4701-29-75
1,0005-18-74
250r
166
44
L, W.C.
210 c. L, W.
200 C, L,
lOD C, L, W.
L.
48

Table 6.--Records of selected wells as of February 1975--Continued
Location Name or owner
.o...
w
o.cw
"o.0~
o
"w
!
u
" ~" '" ww ~ >
~::i ~ :
o ~
iH~ ,,~
." .~
Discharge
w w.."'~
Remarks and otherdata available
Wells drilled into the Navajo Sandstone--Continued
(C-42 ~ 15) 20cdb-l St. George City(C-42-16)lccd-l Twist Hollow
(C-43~13)5bdd~1 Spillsbury Land andLivestock Co.
21eaa-l W. Spendlove
19551974
1956
1962
100 12365 12
530
185
264
46
50
2,920 2,9063,240 2,988
3,420
3,300 3,140r(Sept. 1962)
o45
465
55A
584r
3e
25
L.Water table in KHycnta Forma
tion. C L.C.
Water table is in underlyingKayenta Format ion.
Wells drilled into formations other than the Navajo Sandstone
(C-40-13)27bdb-2 Anderson Ranch(C-4l-14)28dab-1 U.S. Bureau of Land
Management(C-41-16)28bca-1 D. Snow(C-42-13)l7dcd-l W. Wilson
22bbb-l do
19581966
19631970
1973
300151m
(1974)300 6230m 12
( 1974)500 12
19
28
3,840 ],5953,280 3,192
3,200 3,072J.300 J,075
(July 1974)3,]60 3,063
(Sept. 1974)
21r Aquifer is valley fill.Aquifer is Kayenta Formation.
Do.Aquifer if; valley fill.
Do.
(C-42-l4)lbac-l L. Jones
15baa-l M. Fawcett
(C-42-14)lldcc-l Washington City21bad-1 C Helm
1973
1960
19721965
400 16
140 14
600200
2,880 2,840(Aug. 1974)
P 2,800 2.686(July 1974)
100 2,930 2,80038 2,860 2,840
5305-10-7',
60r20r
Aquifer is Moenave Formation.
Aquifer is valley fill.
Aquifer is Kayenta Formation.Aquifer is Kayenta Formati on. L.
23aad-2 W. Thompson
(C-42-16)5bbb-l W. Hafen 1963
1969
110 16
140 14
36
30
3,060
2,860
3,032
2,827
55r Aquifer is Chinle Forrr,ation.
Aquifer is Kayenta Formation.
IWell flows continuously and the total 1974 discharge (150 acre-ft) i.s based on the assumption that the measured discharge is a constant rale. The contributionfrom the Navajo Sandstone is probably small and is assumed to be 10 percent of the total or 15 acre-ft.
49
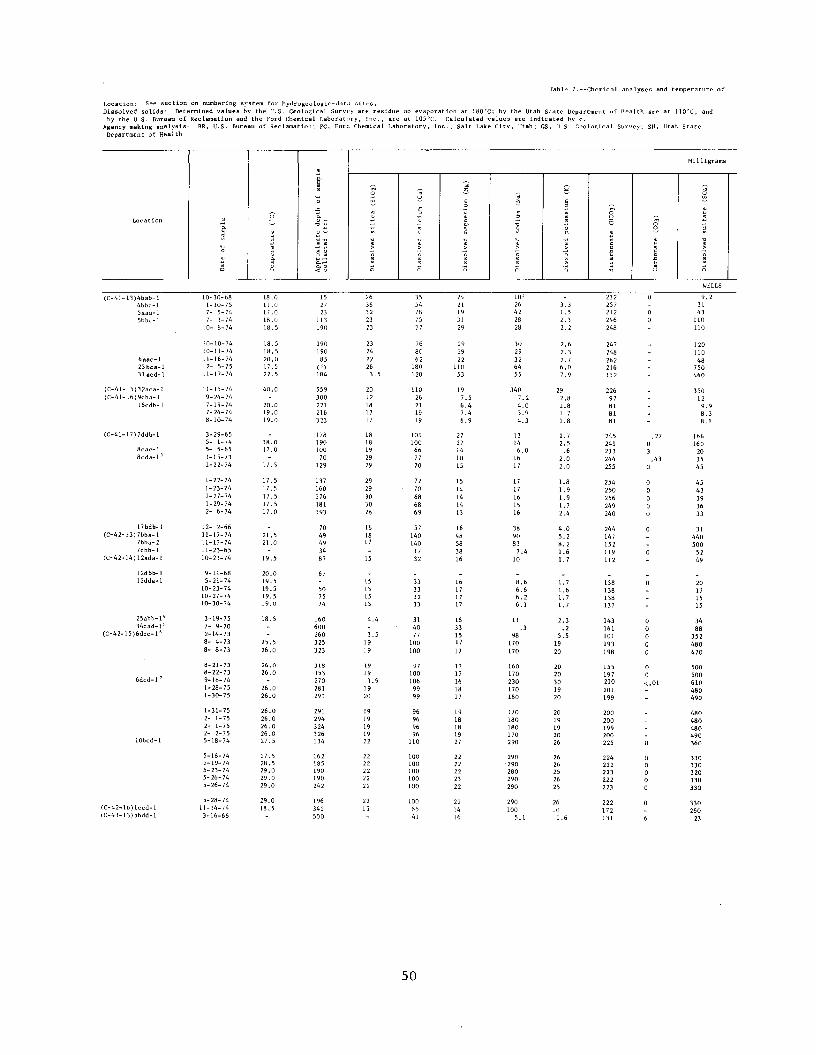
Table 7.--Chemical analyses and temperature of
Location: See section on numbering system for hydrogeologic-dat,l sites.Dissolved solids: Determined values by the U.S. Geological Survt·y are residue on evaporation at IBOcC; by the Utah State Department of Health are at 110~C; and
by the U.S. Bureau of Reclamation and the Ford Chemical Laboratory, Inc., are at 105°C. Calculated values are indicated by c.Agency making analysis: SR, U.S. Bureau of Reclamation; FC, Ford Chemical Laboratory, Inc., Salt Lake City, Utah; GS, !J.S. Geolo~ical Survey; SH, Utah State
Department of Heal th
Milligrams
Location
(C-41-13)4bab-l4bbc-l5aaa-15bbc-l
6aac-123bca-l31 acd-l
(C-41- 15) 3 2aca-1(C-41-16)9cba-1
16cdb-l
8cac-lBcda-l)
17bdb-l(C-42-13) 7bba-l
7bba-27cbb-l
(C-42~14) 12ada-l
12dbb-l12dda-l
25abb-l ~
34cad-1 5
(C-42-15)6dcc-1 6
6dcd-1 7
10bcd-l
(C-42-16)lccd-l(C-43-13)5bdd-l
10-30-68l-lO-757- 5-747- 3-74
10- 8-74
10-10-74to-ll- 7411-16-74
2- 5-7511-17-74
11-15-749-24-747-19-747-24-748-10-74
3-29-655- 1-745- 5-651-15-731-22-74
1-22-741-23-741-27-741-29-742~ 6-74
12- 2-6611-17-7411~17-74
11-23-6510-23-74
9-11-685-21-74
10-23-7410-27-7410-30-74
3-19-757- 9-702-14-738- 4-73B- B-))
8-21-738-22-739-18-741-28-751-30-75
1-31-752~ 1-752- 1-752- 2-755-18-74
5-18-745-19-745-23-745-26-745-26-74
5-28-7411-14-743-16-66
18.011.017.018.018.5
18.518.520.017 .522.5
40.0
20.019.019.0
18.017.0
17 .5
17.517.517 . .517.517.0
21.521.0
19.5
20.019.519.519.519.0
18.5
25.526.0
26.026.0
26.026.0
26.026.026.026.027.5
27.528.529.029.029.0
29.018.5
152723
113190
19019085
(')1B4
559300221216323
178190100
70129
1371601761B1193
70494934B7
67
507574
160600260325323
3183532702B1291
291294324326134
162185190190242
196342500
~.]"
2636322323
232422263.5
201218II17
1818192929
292930302B
161817
15
1515L515
4.4
3.51919
19L93.9
19'!O
1919191922
2222222222
2215
.~
·u~·,o·"
35547875)7
768062
180120
lIO26211919
109100667770
72706B6B69
57140140
1732
33333233
314077
100100
97100106
9999
96969696
lIO
100100100100100
1006541
50
~.i"
2421193129
292922
11053
197.56.47.46.9
2727141015
15L4141413
164B5B3B16
16171717
1B331517
17
1717161B17
191BIS1927
2222222322
221416
.z
10'264228
28
3029326455
3407.24.03.94.3
13146.0
1617
1717161516
3B9083
7.410
8.66.66.26.1
II.3
98170170
160170230170IBO
170lBOIBO170290
2902902BO290290
290100
5.1
.~.o~
~.,o
"
3.31.52.32.2
2.62.32.76.07.9
292.8I.B1.71.8
2.72.5
.62.02.0
I.B1.91.91.72.4
4.05.2B.21.61.7
1.71.61.71.7
2.3.2
5.51920
2020301920
2019192026
2626252625
26101.6
8c
23225721224624B
247248262216112
22697818181
245241233244255
254250256249240
244147152119112
13B138138137
14316110119319B
155197210201199
200200199200225
224222223222223
222172131
.27o3
.43o
oo<.01
··~~·i"WELLS
9.23143
110110
12011048
750460
350129.98.3B.I
166160
203545
4543393633
31440500
5249
20171515
34B8
3524BO470
500500610480490
4BO480480490360
330330320330330
330260
21

water from selected wells, springs, and streams
per liter Micrograms per liter
g " 0
0 ~C u .u 6z z · j · ~ " >,. · . ~
~ · "'" o • 0
" 0 "" " t " ~ " · ." .~ .
0
.~00
000" N " 0
" " E'~3 " 0 · " ""' " u "' E 0
~.'"'" '" w '" '" '" '" " '" '" '"
~1. E· 0 w 0 w w ww
"',
i,
k >,> , '" > , , ,':~ " . " 0 0 ]0 o " 0 0 0 0 ] .
".~ '" " ~~ 'R 00a 0 a 0 0 ~0 0+ 0 0 0 '" z
8,1 0,8 227 188 0 20 372 0,3 8,0 GS19 1.7 0.12 0.2 325 220 11 100 531 .8 7,7 GS98 ,96 ,03 ,2 423( 270 99 90 10 0 768 1,1 7.8 os36 .39 .03 ,3 429t; 320 110 110 60 20 723 ,7 7.7 GS37 .32 .06 ,1 430c 310 110 100 30 0 711 ,7 7.5 GS
39 . )I~ ,06 .1 !+I~3c 310 110 110 20 0 717 .7 7,5 GS39 .37 ,06 ,2 (138c 320 \20 100 30 10 716 .7 7,6 GS34 2,0 ,03 ,3 361c 250 31 1,0 635 .9 8,1 GS74 4,6 .03 .6 1,340 900 730 580 2,000 .9 7,4 GS51 ,03 ,03 ,2 H06e 520 430 190 1,220 l,\ 7,2 GS
380 ,11 .03 1,3 1,360 350 170 170 2,380 7.9 7,3 GS\2 ,13 .00 ,2 129c 96 16 850 220 ,3 7.8 OS5.2 ,30 .09 ,2 I08e 78 12 0 167 ,2 8,2 os5,1 .10 ,09 ,1 I03c 78 11 150 166 ,2 7,8 GS5,0 .28 .18 ,1 104c 76 9 170 166 ,2 7,9 GS
23 4,7 ,3 511 382 181 190 190 660 ,3 7,3 SH20 .95 .06 ,2 465c 360 160 100 300 20 745 ,3 7.5 GS20 .5 ,3 283 221 25 200 50 455 ,2 8.4 SH18 .0 .2 ,19 308 232 65 ,0 ,00 470 .5 7.5 SH20 .05 ,03 .20 324 240 27 60 10 250 538 .5 7.8 os
19 ,03 .03 .0 325 240 33 50 290 340 529 ,5 8,1 GS19 ,as ,06 ,2 318 230 27 50 60 240 524 ,5 8.1 GS19 ,03 ,09 .2 JIS 230 17 50 20 210 511 ,5 7,8 os18 ,00 ,03 .2 306 230 23 50 30 190 502 ,4 7.7 os18 ,03 ,03 ,2 298 230 29 70 50 120 493 ,5 7,6 GS
20 ,2 ,4 286 207 7 30 470 1,1 7,5 SH96 1,3 ,03 ,3 916 550 430 210 1,420 1,7 7,5 GS93 ,69 ,03 ,4 978 590 460 90 1,450 1,5 7.7 GS36 3,7 1.3 215 200 102 50 570 .2 7.6 BR6.3 1.7 .03 ,5 193 150 54 50 318 .4 7,8 os
27 383 GS18 2,8 ,03 ,2 193 150 35 40 321 ,3 7,9 GS16 2,6 .03 .2 186 150 39 5 323 .2 7,7 GS14 2,6 ,03 ,2 181 150 37 0 309 .2 7,9 GS14 2,6 .03 .2 181 150 40 0 309 .2 7.9 os16 2,6 ,18 .02 256 152 <10 100 <10 371 ,4 7,7 FL14 ,65 .88 .45 341 248 20 220 10 532 ,01 7.8 FL10 ,95 ,60 1,5 659 257 0 180 0 1,029 2.7 7,3 FL40 ,20 ,03 2,2 944 320 160 760 150 10 1,340 4.1 7,0 GS40 ,13 ,03 2,5 938 320 160 720 80 10 1,360 4.1 7,3 GS
41 .17 .03 2,4 934 310 190 670 50 10 1,370 3,9 7,0 GS41 .21 .03 2.4 968 320 160 720 80 10 1,360 4,1 7.1 GS42 ,95 .33 1,8 1,240 329 10 180 50 1,798 5.5 7,2 FL45 .20 .03 2.3 953 320 160 630 1,475 4.1 6.9 GS41 ,05 6.4 2.4 975 320 150 620 1,750 4.4 7.0 GS
48 .20 ,03 2.4 955 320 150 670 1,500 4,2 7,0 GS48 ,19 ,06 2,4 963 310 150 660 1,500 4,4 7,0 GS45 ,18 ,03 2,4 959 310 150 630 1,550 4,4 7,0 GS45 ,24 ,03 2,4 962 320 150 670 1,550 4,2 7,0 GS350 .33 ,03 1.1 1,300 390 200 530 2,050 6.4 7,4 GS
140 .10 ,09 1,1 1,240 340 160 510 20 2,030 6,8 7.3 GS350 .18 .03 1.1 1,250 340 160 530 0 2,040 6.8 7,3 GS340 .18 .12 1.1 1,220 340 160 540 10 2,020 6.6 7.2 GS350 ,11 ,09 1,1 1,250 340 160 550 0 2,030 6.8 7,2 GS340 ,08 ,03 1.1 1,240 340 160 510 20 2,040 6.8 7,2 os350 ,11 ,03 1,1 1,250 340 160 520 2,050 6,8 7,1 GS27 ,71 ,09 ,6 580 220 79 20 935 2,9 7.2 GS27 ,3 229 167 50 360 502 ,2 8.3 8R
51
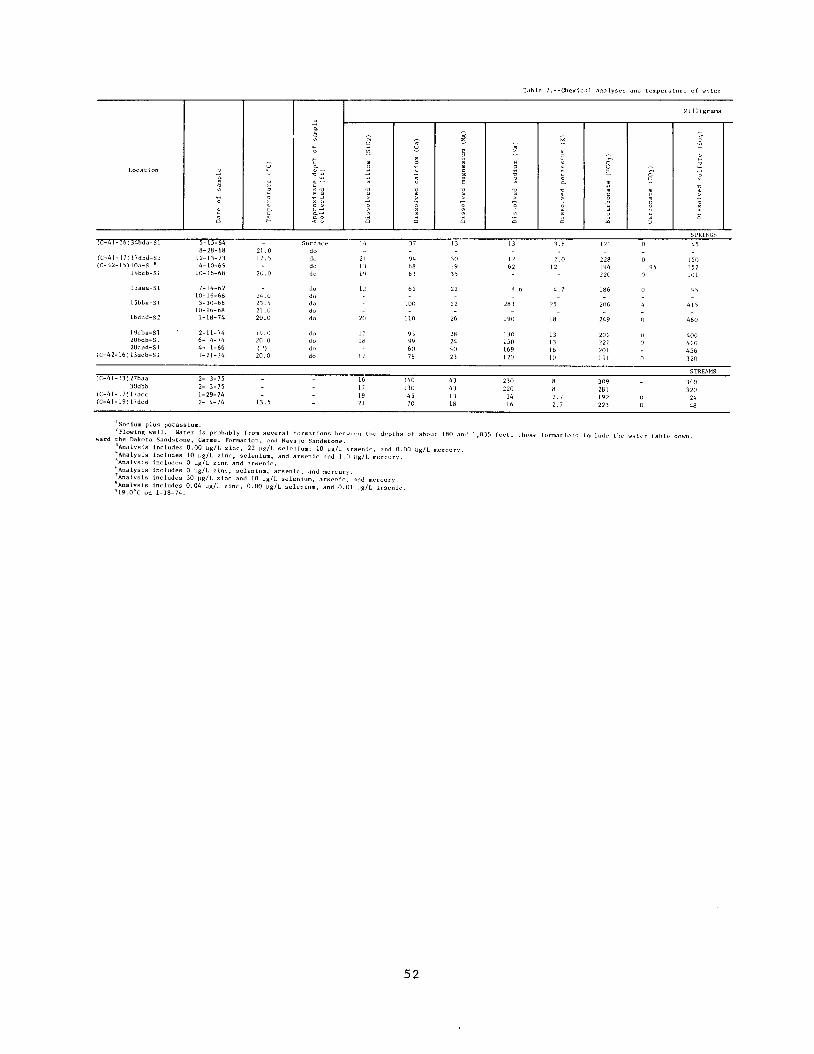
Locat lon
(c-41-16) j4bda- S I
{C-4L-17)t7dbd-Sl(C-42-15) lOa-51 B
14bcb-St
15aaa-SI
LSbb<l-SJ
16ddd-S2
19cba-Sl20bdb-SlZOcad-S1
(C-42-16) 13dcb-Sl
(C-41-13)27baa30dbb
(C-41-17) 17acc(C-41-19)17dcd
5-15-648-28-68
12-13-734-10-69
10-16-68
7-14-6210-16-683-30-66
10-16-681-18-74
2-11-746- 4-744- 1-661-21-74
2- 3-752- 3-751-29-742- 4-74
!':;~
u ~.~~ u
· .~
" .~B· U"·~~ <; u
Surfacl;'21.0 do17.5 do
do20.0 do
do24.0 do23.5 do21.0 do20.0 do
ilJ.1J do20.0 do(') do20.0 do
13.5
0 · gu e. e l;;
· E~ ~ ~· ., .': ,a a 0
0 c c
]/, 17 13
21 94 30II 68 191'1 63 35
L~ 62 22
100 22
211 lID 26
L' 9) 28IH 99 24
60 40II 78 23
16 140 4317 130 4319 45 1321 70 18
rable 7.--Chemica1 analyses and temperature of water
Mi lligrams
.,'"' c.
7-
.~ ·E c ·~ ~
~.0 ,
0 u~
~~ ~ . · ·. .
~ · ,, >0 0
a a 0~
" 0·c c '" u
SPIUNGS
13 3.8 121 45
12 2.0 228 0 15062 12 194 .95 152
220 0 101
8.b 4.7 186 95
28) 25 206 !~ 1 :>
190 18 249 460
])0 13 202 400ISO 13 221 420169 16 201 456120 III 191 320
STREAMS
230 18 309 340220 18 281 320
14 2. 192 2416 2 22) 48
ISodium plus potassium.
"Flowing well. Water is probably from several formations hetwlo'l'n thl' df'pt.hs of about 180 and 1,83'; flo-'et; thl's£' formations include lllP w;ltt'r tahlp dClWT1~ward the Dakota Sandstone, Carmel Formation, and Navajo Sandstone.
lAna lysis includes 0.00 llg/L zinc, 22 IJg/1. selenium; 10 ~Jg/L arsenic, and 0.00 IJg/L mercury.~Analysis includes 10 ug/L zinc, sl'lenium, and arsenh' ilnd 1.0 IJ~/L mercury.~Analysjs includes a ug/L zinc and arsenic..hAnalysis includes a Ug/L zinc, selenium, arsenic, ilnd mercury.7Analysis includes 30 ug/L zinc and 10 IJg/L selenium, arsenic, and ml'rcury.8Analysis includes 0.04 ~Jg/L zinc, 0.00 ug/L selenium, and 0.01 pg/L arsenic.919.0°(: on 1-18-74.
52

from selected wells. springs, and s t reams- - Con t inued
per liter Micrograms per liter
" ! 0
u r:; 0 6'" u
~z z ." .· · · O~ " >,. .. · · .] '" · · ~~
~ ~ '" j ~.- w w
~ " ~ ~.~ · j0" N " 0
.~.g •00
~ ~ .S'"._ z
".g, . · 8~"~ u · •
~~ ~ . ~ ~ ~ ~
]~ ~ ~
]1. .0 · · . . . · · "j ~ :g,
~
~> . ~
, ,k0 0 0
~0 0 0
~if· ~.~ t:
~ ·0 .- .- :.e- 'B. ~0+ 0 0 0 '" 0 0 "15 1.4 0.6 226 146 47 160 20 345 0.4 7.8 SH13 360 GS2J 1.8 · LB .l, 453 360 170 llO 30 20 726 .3 8.1 GS
13B .1 .Y .6 63B 248 350 .00 .00 1,115 1.7 B.O SH29 _9.l, 435 30n 120 100 673 .4 8.0 GS
to ,3.2 .3 32B 24:1 91 60 60 516 .2 7.9 SH8.0 487 GS
2B5 1.6 1,240 340 163 BOO 2,010 6.7 BR295 2,010 GS96 .18 .00 1.5 1,050 380 180 550 30 1,550 4.2 B.O GS
39 .40 .03 .8 B2J 350 IBO 450 40 50 1,220 3.0 7.1 GS44 .10 .06 1.0 879 350 160 480 60 0 1,310 3.5 7.4 GS48 1.9 8B9 314 149 450 1,320 4.1 8.2 BR30 .74 .00 .6 697 290 130 470 40 1,060 3.1 8.1 GS
320 0.54 0.03 0.5 1,260 530 270 470 2,060 4.4 7.7 GS310 .54 .03 .4 1,200 500 270 440 2,000 4.3 7.6 GS
15 .00 .03 .2 228 170 8 70 30 0 385 .5 8.3 GS22 .03 .03 .3 308 250 66 80 20 60 519 .4 7.8 GS
53

Table 8.--Water levels in selected observation wells
Water levels are in feet below land-surface datum.An asterisk (*) immediately after a measurement indicates that the measure
ment was made by driller; all other measurements were made by the U.S.Geological Survey.
(C-41-13) 4bab-1 (C-41-13)16cdb-1 - ContinuedJuly 5, 1974 15.73 Feb. 4, 1975 184.88Oct. 30 14.27Jan. 10, 1975 14.24 (C-41-17) 7ada-1
Feb. 25, 1966 203 *(C-41-13) 5aaa-1 Oct. 22, 1969 206.23July 5, 1974 23.30 July 18, 1973 212.14Oct. 30 26.06 July 24 212.32Jan. 10, 1975 23.22 Aug. 9 211.64
Sept. 7 211. 98(C-41-13) 5bbc-1 Oct. 4 212.75Oct. 15, 1974 77 .88 Nov. 16 211.60Oct. 16 76.77 Nov. 30 211. 31Oct. 18 75.67 Jan. 15, 1974 210.64Oct. 22 74.06 Jan. 17 210.48Oct. 31 72.06 Jan. 21 210.60Nov. 16 69.50 Feb. 8 210.81Jan. 7, 1975 66.32 May 1 214.37
May 15 215.50(C-41-13) 6aac-1 June 1 215.86Oct. 15, 1974 84.27 July 1 217.30Oct. 18 83.95 July 26 219.28Oct. 31 83.48 Oct. 28 218.19Nov. 16 82.85 Nov. 18 217.76Jan. 7, 1975 81. 73 Jan. 5, 1975 216.53
Feb. 4 216.02(C-41-13)31acd-1Nov. 17, 1973 181. 51 (C-41-17) 7ddb-1Dec. 3 181. 53 Mar. 17, 1965 178 *July 3, 1974 181. 63 Jan. 17, 1974 187.90Sept. 27 181. 48 Jan. 19 187.85Oct. 29 181.40 Jan. 21 187.85Nov. 17 181. 37 Jan. 22 188.11Jan. 8, 1975 181.00 Jan. 23 187.96
Jan. 24 187.85(C-41-16)16cdb-1 Jan. 25 187.74June 3, 1974 183.31 Jan. 26 187.47July 1 184.17 Jan. 27 187.87Sept. 24 187.12 Jan. 28 187.76Oct. 15 186.31 Jan. 29 187.76Oct. 31 185.97 Jan. 30 187.63Nov. 14 185.57 Jan. 31 187.71Nov. 15 185.60 Feb. 1 187.45Jan. 5, 1975 185.23 Feb. 2 187.81·Jan. 9 184.99 Feb. 3 187.84
54
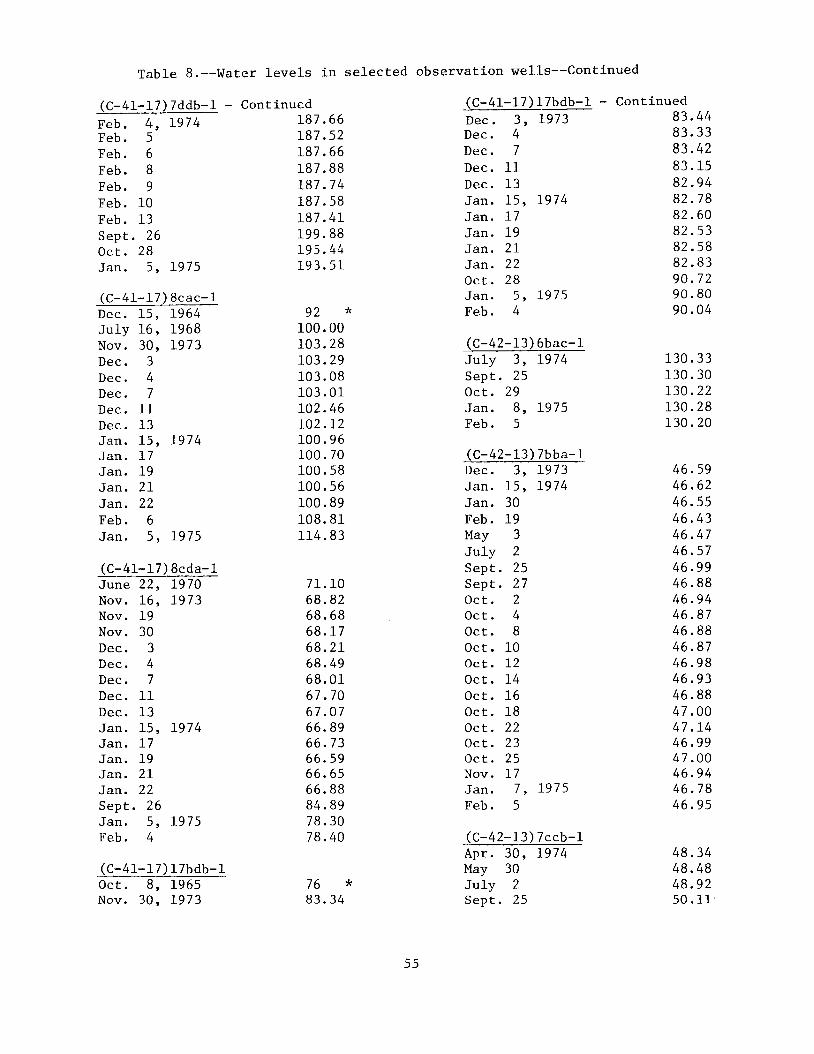
Table 8.--Water levels in selected observation we11s--Continued
(C-41-17)7ddb-1 - Continued (C-41-17)17bdb-l - Continued
Feb. 4, 1974 187.66 Dec. 3, 1973 83.44
Feb. 5 187.52 Dec. 4 83.33
Feb. 6 187.66 Dec. 7 83.42
Feb. 8 187.88 Dec. 11 83.15
Feb. 9 187.74 Dec. 13 82.94Feb. 10 187.58 Jan. 15, 1974 82.78
Feb. 13 187.41 Jan. 17 82.60
Sept. 26 199.88 Jan. 19 82.53Oct. 28 195.44 Jan. 21 82.58Jan. 5, 1975 193.51 Jan. 22 82.83
Oct. 28 90.72(C-41-17) 8cac-l Jan. 5, 1975 90.80Dec. 15, 1964 92 * Feb. 4 90.04July 16, 1968 100.00Nov. 30, 1973 103.28 (C-42-13) 6bac-1Dec. 3 103.29 July 3, 1974 130.33Dec. 4 103.08 Sept. 25 130.30Dec. 7 103.01 Oct. 29 130.22Dec. 11 102.46 Jan. 8, 1975 130.28Dec. 13 102.12 Feb. 5 130.20Jan. 15, 1974 100.96Jan. 17 100.70 (C-42-13) 7bba-lJan. 19 100.58 Dec. 3, 1973 46.59Jan. 21 100.56 Jan. ] 5, 1974 46.62Jan. 22 100.89 Jan. 30 46.55Feb. 6 108.81 Feb. 19 46.43Jan. 5, 1975 114.83 May 3 46.47
July 2 46.57(C-41-17) 8cda-1 Sept. 25 46.99June 22, 1970 71.10 Sept. 27 46.88Nov. 16, 1973 68.82 Oct. 2 46.94Nov. 19 68.68 Oct. 4 46.87Nov. 30 68.17 Oct. 8 46.88Dec. 3 68.21 Oct. 10 46.87Dec. 4 68.49 Oct. 12 46.98Dec. 7 68.01 Oct. 14 46.93Dec. 11 67.70 Oct. 16 46.88Dec. 13 67.07 Oct. 18 47.00Jan. 15, 1974 66.89 Oct. 22 47.14Jan. 17 66.73 Oct. 23 46.99Jan. 19 66.59 Oct. 25 47.00Jan. 21 66.65 Nov. 17 46.94Jan. 22 66.88 Jan. 7, 1975 46.78Sept. 26 84.89 Feb. 5 46.95Jan. 5, 1975 78.30Feb. 4 78.40 (C-42-13) 7ccb-1
Apr. 30, 1974 48.34(C-41-17) 17bdb-1 May 30 48.48Oct. 8, 1965 76 * July 2 48.92Nov. 30, 1973 83.34 Sept. 25 50.11
55

Table 8.--Water levels in selected observation wells--Continued
(C-42-l3)7ccb-l - Continued (C-42-14)12dda-l - ContinuedOct. la, 1974 50.07 Jan. 30, 1974 34.61Oct. 12 50.11 Feb. 19 34.56Oct. 14 50.15 Apr. 30 35.04Oct. 16 50.11 May 10 34.99Oct. 18 50.20 May 21 35.16Oct. 22 50.15 May 30 35.05Oct. 23 50.?6 June 28 35.30Jan. 7 , 1975 49.54 July 2 35.20Feb. 5 49 . L~ 7 Sept. 25 35.74
Sept. 27 35.53(C-42-13)18bcb-l Oct. 2 35.61Aug. 2, 1973 59.67 Oct. 4 35.53Oct. 12 59.77 Oct. 8 35.57Nov. 13 59.54 Oct. 10 35.65Nov. 17 59.63 Oct. 12 35.76Nov. 20 59.62 Oct. 14 35.70Nov. 28 59.81 Oct. 16 35.70Dec. 1 59.53 Oct. 18 35.75Dec. 2 59.73 Oct. 22 35.72Dec. 3 59.68 Oct. 23 35.80Dec. 6 59.81 Jan. 7, 1975 35.51Dec. 7 59.76 Feb. 5 34.45Dec. 10 59.64Dec. 14 59.69 (C-42-14) 25abb-1Jan. 15, 1974 59.68 Jan. 16, 1974 73.56Jan. 16 59.64 Jan. 26 73.40Jan. 30 59.56 Jan. 30 73.45Feb. 19 59.46 Feb. 19 73.35Apr. 30 59.56 Apr. 30 73.42May 10 59.50 June 1 73.03May 28 59.52 June 28 73.50May 29 59.46 July 2 73.43May 30 59.53 Sept. 25 73.53May 31 59.59 Oct. 24 73.45June 1 59.52 Nov. 22 73.40June 7 59.33 Jan. 7, 1975 74.84June 26 59.62June 28 59.60 (C-42-14)26bbb-1July 2 59.53 Jan. 16, 1974 87.57Sept. 25 59.69 May 3 87.45Oct. 2 59.61 June 1 87.49Oct. 18 59.66 July 2 87.47Oct. 22 59.65 Sept. 25 87.67Oct. 23 59.68 Oct. 30 87.60Nov. 17 59.59 clan. 8, 1975 87.18,Jan. 7, 1975 59.41Jan. 8 59.35 J~-42-15)10bcd-1
Feb. 3 59.4B July 24, 1973 79.77July 25 79.55
(C-42-14)12dda-l July 26 79.66Jan. 15, 1974 34.80 July 27 79.82
56
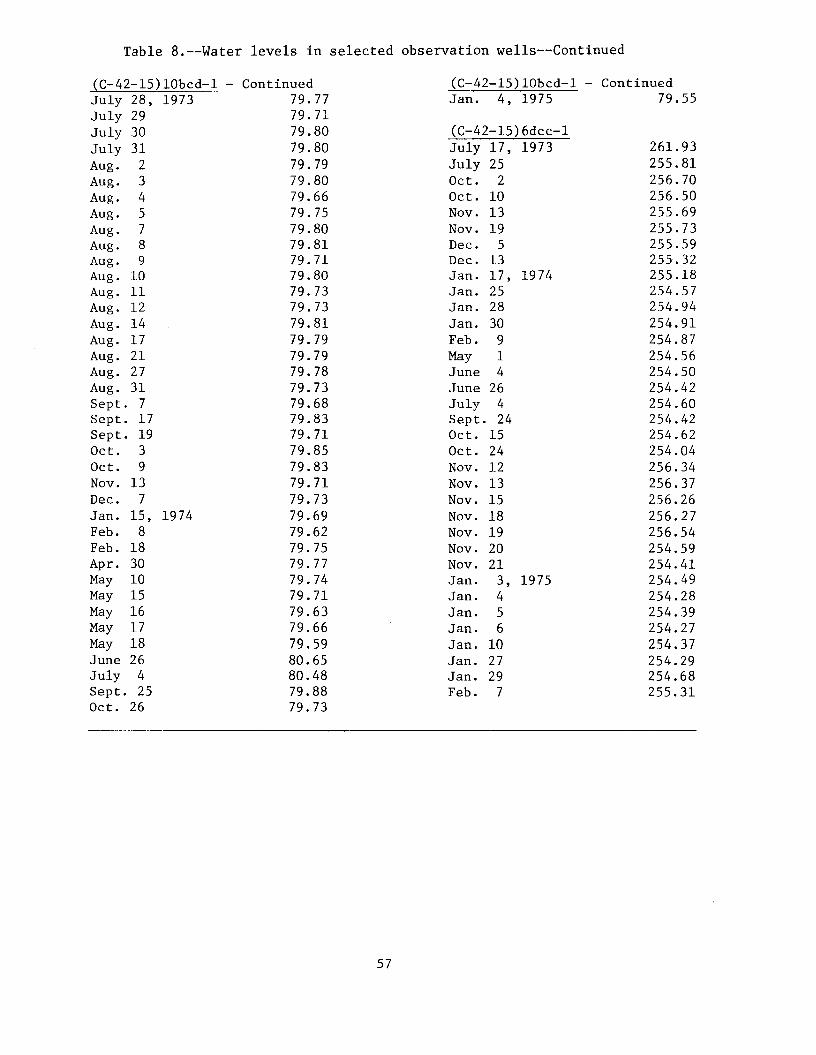
Table 8.--Water levels in selected observation we11s--Continued
(C-42-15)10bcd-l - ContinuedJan. 4, 1975 79.55
(C-42-15)10bcd-1 July 28, 1973July 29July 30July 31Aug. 2Aug. 3Aug. 4Aug. 5Aug. 7Aug. 8Aug. 9Aug. 10Aug. 11Aug. 12Aug. 14Aug. 17Aug. 21Aug. 27Aug. 31Sept. 7Sept. 17Sept. 19Oct. 3Oct. 9Nov. 13Dec. 7Jan. 15, 1974Feb. 8Feb. 18Apr. 30May 10May 15May 16May 17May 18June 26July 4Sept. 25Oct. 26
Continued79.7779.7179.8079.8079.7979.8079.6679.7579.8079.8179.7179.8079.7379.7379.8179.7979.7979.7879.7379.6879.8379.7179.8579.8379.7179.7379.6979.6279.7579.7779.7479.7179.6379.6679.5980.6580.4879.8879.73
57
(C-42-15)6dcc-1July 17, 1973July 25Oct. 2Oct. 10Nov. 13Nov. 19Dec. 5Dec. 13Jan. 17, 1974Jan. 25Jan. 28Jan. 30Feb. 9May 1June 4June 26July 4Sept. 24Oct. 15Oct. 24Nov. 12Nov. 13Nov. 15Nov. 18Nov. 19Nov. 20Nov. 21Jan. 3, 1975Jan. 4Jan. 5Jan. 6Jan. 10Jan. 27Jan. 29Feb. 7
261. 93255.81256.70256.50255.69255.73255.59255.32255.18254.57254.94254.91254.87254.56254.50254.42254.60254.42254.62254.04256.34256.37256.26256.27256.54254.59254.41254.49254.28254.39254.27254.37254.29254.68255.31
PUBLICATIONS OF THE UTAH DEPARTMENT OF NATURAL RESOURCES,DIVISION OF WATER RIGHTS
(*)-Out of Print
TECHNICAL PUBLICATIONS
*No. 1. Underground leakage from artesian wells in the Flowell area,near Fillmore, Utah, by Penn Livingston and G. B. Maxey,U.S. Geological Survey, 1944.
No.2. The Ogden Valley artesian reservoir, Weber County, Utah, byH. E. Thomas, U.S. Geological Survey, 1945.
*No. 3. Ground water inE. Dennis, G. B.Survey, 1946.
Pavant Valley, Millard County, Utah, by P.Maxey and H. E. Thomas, U.S. Geological
*No. 4. Ground water in Tooele Valley, Tooele County, Utah, by H. E.Thomas, U.S. Geological Survey, in Utah State Eng. 25thBienn. Rept., p. 91-238, pls. 1-6, 1946.
*No. 5. Ground water in the East Shore area, Utah: Part I, Bountiful District, Davis County, Utah, by H. E. Thomas and W. B.Nelson, U.S. Geological Survey, in Utah State Eng. 26thBienn. Rept., p. 53-206, pIs. 1-2, 1948.
*No. 6. Ground water in the Escalante Valley, Beaver, Iron, andWashington Counties, Utah, by P. F. Fix, W. B. Nelson, B. E.Lofgren, and R. G. Butler, U.S. Geological Survey, in UtahState Eng. 27th Bienn. Rept., p. 107-210, pis. 1-10, 1950.
No. 7. Status of development of selected ground-water basins inUtah, by H. E. Thomas, W. B. Nelson, B. E. Lofgren, and R.G. Butler, U.S. Geological Survey, 1952.
*No. 8. Consumptive use of water and irrigation requirements ofcrops in Utah, by C. O. Roskelly and W. D. Criddle, 1952.
No.8. (Revised) Consumptive use and water requirements for Utah,by W. D. Criddle, Karl Harris, and L. S. Willardson, 1962.
No.9. Progress report on selected ground water basins in Utah, byH. A. Waite, W. B. Nelson, and others, U.S. Geological Survey, 1954.
*No. 10. A compilation of chemical quality data for ground andsurface waters in Utah, by J. G. Connor, C. G. Mitchell, andothers, U.S. Geological Survey, 1958.
*No. 11. Ground water in northern Utah Valley, Utah: A progress report for the period 1948-63, by R. M. Cordova and SeymourSubitzky, U.S. Geological Survey, 1965.
58
*No. 12. Reevaluation of the ground-water resources of Tooele Valley,Utah, by J. S. Gates, U.S. Geological Survey, 1965.
*No. 13. Ground-water resources of selected basins in southwesternUtah, by G. W. Sandberg, U.S. Geological Survey, 1966.
*No. 14. Water-resources appraisal of the Snake Valley area, Utah andNevada, by J. W. Hood and F. E. Rush, U.S. Geological Survey, 1966.
*No. 15. Water from bedrock in the Colorado Plateau of Utah, by R. D.Fe1tis, U.S. Geological Survey, 1966.
*No. 16. Ground-water conditions in Cedar Valley, Utah County, Utah,by R. D. Feltis, U.S. Geological Survey, 1967.
*No. 17. Ground-water resources of northern Juab Valley, Utah, by L.J. Bjorklund, U.S. Geological Survey, 1968.
No. 18. Hydrologic reconnaissance of Skull Valley,Utah, by J. W. Hood and K. M. Waddell, U.S.vey, 1968.
Tooele County,Geological Sur-
No. 19. An appraisal of the quality of surface water in the SevierLake basin, Utah, by D. C. Hahl and J. C. Mundorff, U.S.Geological Survey, 1968.
No. 20. Extensions of streamflow records in Utah, by J. K. Reid, L.E. Carroon, and G. E. Pyper, U.S. Geological Survey, 1969.
No. 21. Summary of maximum discharges in Utah streams, by G. L.Whitaker, U.S. Geological Survey, 1969.
No. 22. Reconnaissance of the ground-water resources of theFremont River valley, Wayne County, Utah, by L. J.lund, U.S. Geological Survey, 1969.
upperBjork-
No. 23. Hydrologic reconnaissance of Rush Valley, Tooele County,Utah, by J. W. Hood, Don Price, and K. M. Waddell, U.S. Geological Survey, 1969.
No. 24. Hydrologic reconnaissance of Deep Creek valley, Tooele andJuab Counties, Utah, and E1ko and White Pine Counties, Nevada, by J. W. Hood and K. M. Waddell, U.S. Geological Survey, 1969.
No. 25. Hydrologic reconnaissance of Curlew Valley, Utah and Idaho,by E. L. Bo1ke and Don Price, U.S. Geological Survey, 1969.
No. 26. Hydrologic reconnaissance of the Sink Valley area, Tooeleand Box Elder Counties, Utah, by Don Price and E. L. Balke,U.S. Geological Survey, 1969.
59
No. 27. Water resources of thecentral Utah, by C. H.1970.
Heber-Kamas-Park City area, northBaker, Jr., U.S. Geological Survey,
No. 28. Ground-water conditions in southern Utah Valley andValley, Utah, by R. M. Cordova, U.S. Geological1970.
GoshenSurvey,
No. 29. Hydrologic reconnaissance of Grouse Creek valley, Box ElderCounty, Utah, by J. W. Hood and Don Price, U.S. GeologicalSurvey, 1970.
No. 30. Hydrologic reconnaissance of the Park Valley area, Box ElderCounty, Utah, by J. W. Hood, U.S. Geological Survey, 1971.
No. 31. Water resources of Salt Lake County, Utah, by A. G. Hely, R.W. Mower, and C. A. Harr, U.S. Geological Survey, 1971.
No. 32. Geology and water resources of the SpanishGrand and San Juan Counties, Utah, by C. T.Geological Survey, 1971.
Valley area,Sumsion, U.S.
No. 33. Hydrologic reconnaissance of Hansel Valley and northern Rozel Flat, Box Elder County, Utah, by J. W. Hood, U.S. Geological Survey, 1971.
No. 34. Summary of waterG. Hely, R. W.vey, 1971.
resources of Salt Lake County, Utah, by A.Mower, and C. A. Harr, U.S. Geological Sur-
No. 35. Ground-water conditions in the East Shore area, Box Elder,Davis, and Weber Counties, Utah, 1960-69, by E. L. BoIke andK. M. Waddell, U.S. Geological Survey, 1972.
No. 36. Ground-water resources of Cache Valley, Utah and Idaho, byL. J. Bjorklund and L. J. McGreevy, U.S. Geological Survey,1971.
No. 37. Hydrologic reconnaissance of the Blue Creek Valley area, BoxElder County, Utah, by E. L. BoIke and Don Price, U.S. Geological Survey, 1972.
No. 38. Hydrologic reconnaissance of the Promontory Mountains area,Box Elder County, Utah, by J. W. Hood, U.S. Geological Survey, 1972.
No. 39. Reconnaissance of chemical quality of surface water and fluvial sediment in the Price River Basin, Utah, by J. C. Mundorff, U.S. Geological Survey, 1972.
No. 40. Ground-water conditions in the central Virgin River basin,Utah, by R. M. Cordova, G. W. Sandberg, and Wilson McConkie,U.S. Geological Survey, 1972.
60

No. 41. Hydrologic reconnaissance ofby J. C. Stephens and J. W.1973.
Pilot Valley, Utah and Nevada,Hood, U.S. Geological Survey,
No. 42. Hydrologic reconnaissance of the northern Great Salt LakeDesert and summary hydrologic reconnaissance of northwesternUtah, by J. C. Stephens, U.S. Geological Survey, 1973.
No. 43. Water resources of the Milford area, Utah, with emphasis onground water, by R. W. Mower and R. M. Cordova, U.S. Geological Survey, 1974.
No. 44. Ground-water resources of the lower Bear River drainage basin, Box Elder County, Utah, by L. J. Bjorklund and L. J.McGreevy, U.S. Geological Survey, 1974.
No. 45. Water resources of the Curlew Valley drainage basin, Utahand Idaho, by C. H. Baker, Jr., U.S. Geological Survey,1974.
No. 46. Water-quality reconnaissance of surface inflow to Utah Lake,by J. C. Mundorff, U.S. Geological Survey, 1974.
No. 47. Hydrologic reconnaissance of the Wah Wah Valley drainage basin, Millard and Beaver Counties, Utah, by J. C. Stephens,U.S. Geological Survey, 1974.
No. 48. Estimating mean streamflow in the Duchesne River Basin,Utah, by R. W. Cruff, U.S. Geological Survey, 1974.
No. 49. Hydrologic reconnaissance of the southern Uinta Rasin, Utahand Colorado, by Don Price and L. L. Miller, U.S. GeologicalSurvey, 1975.
No. 50. Seepage study of the Rocky Point Canal and the Grey Mountain-Pleasant Valley Canal systems, Duchesne County, Utah, by R.W. Cruff and J. W. Hood, U.S. Geological Survey, 1976.
No. 51. Hydrologic reconnaissance of the Pine Valley drainage basin,Millard, Beaver, and Iron Counties, Utah, by J. C. Stephens,U.S. Geological Survey, 1976.
No. 52. Seepage study of canals in Beaver Valley, Reaver County,Utah, by R. W. Cruff and R. W. Mower, U.S. Geological Survey, 1976.
No. 53. Characteristics of aquifers in the northern Uinta Basin area, Utah and Colorado, by J. W. Hood, U.S. Geological Survey, 1976.
No. 54. Hydrologic evaluation of Ashley Valley, northern Uinta Basinarea, Utah, by J. W. Hood, U.S. Geological Survey, 1977.
61
No. 55. Reconnaissance of water quality in the Duchesne River basinand some adjacent drainage areas, Utah, by J. c. Mundorff,U.S. Geological Survey, 1977.
No. 56. Hydrologic reconnaissance of theJuab and Millard Counties, Utah,Geological Survey, 1977.
Tule Valley drainage basin,by J. C. Stephens, U.S.
No. 57. Hydrologic evaluation of the upper Duchesne River valley,northern Uinta Basin area, Utah, by J. W. Hood, U.S. Geological Survey, 1977.
No. 58. Seepage study of the Sevier Valley-Piute Canal, Sevier County, Utah, by R. W. Cruff, U.S. Geological Survey, 1977.
No. 59. Hydrologic reconnaissance of the Dugway Valley-GovernmentCreek area, west-central Utah, by J. C. Stephens and C. T.Sumsion, U.S. Geological Survey, 1978.
No. 60. Ground-water resources of the Parowan-Cedar City drainagebasin, Iron County, Utah, by L. J. Bjorklund, C. T. Sumsion,and G. W. Sandberg, U.S. Geological Survey, 1978.
WATER CIRCULARS
No.1. Ground water in the Jordan Valley, Salt Lake County, Utah,by Ted Arnow, U.S. Geological Survey, 1965.
No.2. Ground water in Tooele Valley, Utah, by J. S. Gates and O.A. Keller, U.S. Geological Survey, 1970.
BASIC-DATA REPORTS
*No. 1. Records and water-level measurements of selected wells andchemical analyses of ground water, East Shore area, Davis,Weber, and Box Elder Counties, Utah, by R. E. Smith, U.S.Geological Survey, 1961.
No.2. Records of selected wells and springs, selected drillers'logs of wells, and chemical analyses of ground and surfacewaters, northern Utah Valley, Utah County, Utah, by SeymourSubitzky, U.S. Geological Survey, 1962.
No.3. Ground-water data, central Sevier Valley, parts of Sanpete,Sevier, and Piute Counties, Utah, by C. H. Carpenter and R.A. Young, U.S. Geological Survey, 1963.
*No.
*No.
4. Selected hydrologic data, Jordan Valley, Salt Lake County,Utah, by 1, W. Marine and Don Price, U.S. Geological Survey,1963.
5. Selected hydrologic data, Pavant Valley, Millard County,Utah, by R. W. Mower, U.S. Geological Survey, 1963.
62
*No. 6. Ground-water data, partsMillard Counties, Utah, bySurvey, 1963.
of Washington, Iron, Beaver, andG. W. Sandberg, U.S. Geological
No.7. Selected hydrologic data, Tooele Valley, Tooele County,Utah, by J. S. Gates, U.S. Geological Survey, 1963.
No.8. Selected hydrologic data, upper Sevier River basin, Utah, byC. H. Carpenter, G. B. Robinson, Jr., and L. J. Bjorklund,U.S. Geological Survey, 1964.
*No. 9. Ground-water data, Sevier Desert, Utah, by R. W. Mower andR. D. Fe1tis, U.S. Geological Survey, 1964.
No. 10. Quality of surface water in the Sevier Lake basin, Utah, byD. C. Hah1 and R. E. Cabell, U.S. Geological Survey, 1965.
*No. 11. Hydrologic and climatologic data, collected through 1964,Salt Lake County, Utah, by W. V. Iorns, R. W. Mower, and C.A. Horr, U.S. Geological Survey, 1966.
No. 12. Hydrologic and climatologic data, 1965, Salt Lake County,Utah, by W. V. Iorns, R. W. Mower, and C. A. Horr, U.S. Geological Survey, 1966.
No. 13. Hydrologic and climatologic data, 1966, Salt Lake County,Utah, by A. G. He1y, R. W. Mower, and C. A. Horr, U.S. Geological Survey, 1967.
No. 14. Selected hydrologic data, San Pitch River drainage basin,Utah, by G. B. Robinson, Jr., U.S. Geological Survey, 1968.
No. 15. Hydrologic and climatologic data, 1967, Salt Lake County,Utah, by A. G. He1y, R. W. Mower, and C. A. Horr, U.S. Geological Survey, 1968.
No. 16. Selected hydrologic data, southern Utah and Goshen Valleys,Utah, by R. M. Cordova, U.s. Geological Survey, 1969.
No. 17. Hydrologic and climatologic data, 1968, Salt Lake County,Utah, by A. G. He1y, R. W. Mower, and C. A. Horr, U.S. Geological Survey, 1969.
No. 18. Quality of surface water in the Bear River basin, Utah, Wyoming, and Idaho, by K. M. Waddell, U.S. Geological Survey,1970.
No. 19. Daily water-temperature records for Utah streams, 1944-68,by G. L. Whitaker, U.S. Geological Survey, 1970.
No. 20. Water-quality data for the Flaming Gorge area, Utah and Wyoming, by R. J. Madison, U.S. Geological Survey, 1970.
63
No. 21. Selected hydrologic data, Cache Valley, Utah and Idaho, byL. J. McGreevy and L. J. Bjorklund, U.S. Geological Survey,1970.
No. 22. Periodic water- and air-temperature records for Utahstreams, 1966-70, by G. L. Whitaker, U.S. Geological Survey,1971.
No. 23. Selected hydrologic data, lower Bear River drainage basin,Box Elder County, Utah, by L. J. Bjorklund and L. J.McGreevy, U.S. Geological Survey, 1973.
No. 24. Water-quality data for the Flaming Gorge Reservoir area,Utah and Wyoming, 1969-72, by E. L. BoIke and K. M. Waddell,U.S. Geological Survey, 1972.
No. 25. Streamflow characteristics in northeastern Utah and adjacentareas, by F. K. Fields, U.S. Geological Survey, 1975.
No. 26. Selected hydrologic data, Uinta Basin area, Utah and Colorado, by J. W. Hood, J. C. Mundorff, and Don Price, U.S.Geological Survey, 1976.
No. 27. Chemical and physical data for the Flaming Gorge Reservoirarea, Utah and Wyoming, by E. L. BoIke, U.S. Geological Survey, 1976.
INFORMATION BULLETINS
*No. 1. Plan of work for the Sevier River Basin (Sec. 6, P. L. 566),U.S. Department of Agriculture, 1960.
*No. 2. Water production from oil wells in Utah, by Jerry Tuttle,Utah State Engineer's Office, 1960.
*No. 3. Ground-water areas and well logs, central Sevier Valley,Utah, by R. A. Young, U.S. Geological Survey, 1960.
*No. 4. Ground-water investigations in Utah in 1960 and reports published by the U.S. Geological Surveyor the Utah State Engineer prior to 1960, by H. D. Goode, U.S. Geological Survey,1960.
*No. 5. Developing ground water in the central Sevier Valley, Utah,by R. A. Young and C. H. Carpenter, U.S. Geological Survey,1961.
*No. 6. Work outline and report outline for Sevier River basin survey, (Sec. 6, P. L. 566), U.S. Department of Agriculture,1961.
*No. 7. Relation of the deep and shallow artesian aquifers nearLynndyl, Utah, by R. W. Mower, U.S. Geological Survey, 1961.
64
*No. 8. Projected 1975 municipal water-use requirements, Davis Coun-ty, Utah, by Utah State Engineer's Office, 1962.
No. 9. Projected 1975 municipal water-use requirements, Weber Coun-ty, Utah, by Utah State Engineer's Office, 1962.
*No. 10. Effects on the shallow artesian aquifer of withdrawing waterfrom the deep artesian aquifer near Sugarville, MillardCounty, Utah, by R. W. Mower, U.S. Geological Survey, 1963.
*No. 11. Amendments to plan of work and work outline for the SevierRiver basin (Sec. 6, P. L. 566), U.S. Department of Agriculture, 1964.
*No. 12. Test drilling in the upper Sevier River drainage basin, Garfield and Piute Counties, Utah, by R. D. Feltis and G. B.Robinson, Jr., U.S. Geological Survey, 1963.
*No. 13. Water requirements of lower Jordan River, Utah, by Karl Harris, Irrigation Engineer, Agricultural Research Service,Phoenix, Arizona, prepared under informal cooperation approved by Mr. W. W. Donnan, Chief, Southwest Branch (Riverside, California) Soil and Water Conservation Research Division, Agricultural Research Service, U.S.D.A., and by W. D.Criddle, State Engineer, State of Utah, Salt Lake City,Utah, 1964.
*No. 14. Consumptive use of water by native vegetation and irrigatedcrops in the Virgin River area of Utah, by W. D. Criddle, J.M. Bagley, R. K. Higginson, and D. W. Hendricks, through cooperation of Utah Agricultural Experiment Station, Agricultural Research Service, Soil and Water Conservation Branch,Western Soil and Water Management Section, Utah Water andPower Board, and Utah State Engineer, Salt Lake City, Utah,1964.
*No. 15. Ground-water conditions and related water-administrationproblems in Cedar City Valley, Iron County, Utah, February,1966, by J. A. Barnett and F. T. Mayo, Utah State Engineer'sOffice.
*No. 16. Summarythrough1966.
of water well drilling activities in Utah, 19601965, compiled by Utah State Engineer's Office,
*No. 17. Bibliography ofports for Utah,Survey, 1966.
U.S. Geological Survey water-resources recompiled by O. A. Keller, U.S. Geological
*No. 18. The effect of pumping large-discharge wells on the groundwater reservoir in southern Utah Valley, Utah County, Utah,by R. M. Cordova and R. W. Mower, U.S. Geological Survey,1967.
65

No. 19. Ground-water hydrology of southern Cache Valley, Utah, by L.P. Beer, 1967.
*No. 20. Fluvial sediment in Utah, 1905-65, A data compilation by J.C. Mundorff, U.S. Geological Survey, 1968.
*No. 21. Hydrogeology of the eastern portion of the south slopes ofthe Uinta Mountains, Utah, by L. G. Moore and D. A. Barker,U.S. Bureau of Reclamation, and J. D. Maxwell and R. L.Bridges, Soil Conservation Service, 1971.
*No. 22. Bibliography of U.S. Geological Survey water-resources reports for Utah, compiled by B. A. LaPray, U.S. GeologicalSurvey, 1972.
No. 23. Bibliography ofports for Utah,Survey, 1975.
U.S. Geological Survey water-resources recompiled by B. A. LaPray, U.S. Geological
66

