state of the uk climate 2016 - met office · state of the uk climate 2016, met office, exeter, uk....
TRANSCRIPT
State of the UK Climate2016
1 Met Office National Climate Information Centre2 National Oceanography Centre
Mike Kendon 1, Dr Mark McCarthy 1, Dr Svetlana Jevrejeva 2, Tim Legg 1

Cover: A thunderstorm over Hebden Bridge, West Yorkshire during the evening of 13 September 2016. A rain gauge at nearby Lothersdale recorded 34.2mm in 1 hour to 1900 GMT, of which nearly 30mm fell in 30 minutes, while the Met Office ATDnet lightning location system recorded more than 10,000 strokes across England and Wales on this date. Earlier in the day 34.4 °C was recorded at Gravesend, Kent, making this the UK’s hottest day of the year. Image courtesy Paul Simpson, fotohebden www.fotohebden.com

Contents
page
Introduction 4
Executive Summary 5
Temperature 6 Days of air and ground frost 14 Degree Days 16 Coastal Waters 22
Precipitation 23 Days of rain and rainfall intensity 30 Heavy Rainfall 32 Snow 34
Sunshine 35
Wind 39
Sea Level 42
Extremes for year 2016 44Significant Weather Events of 2016 45 Eastern Scotland wet spell 45 September hot spell 47Correction to 2015 report 49Annex 1: Datasets 50 Monthly grids 50 Long term average grids 52 Daily grids and degree days 53 Central England Temperature 53 Sea surface temperature data 53 England and Wales Precipitation series 54 Raingauge and snow depth data 54 Sunshine data 54 Sea level data 54
Annex 2: Time-series, trends and uncertainty 55 Time-series and trends shown in this report 55 Uncertainty estimates 55 Coefficient of determination 56
Annex 3: Useful resources 57
Acknowledgements 57
References 58
3

This report provides a summary of the UK weather and climate through the calendar year 2016, alongside the historical context for a number of essential climate variables. This is the third in a series of annual ‘State of the UK climate’ publications and an update to the 2015 report (Kendon et al, 2016). It provides an accessible, authoritative and up-to-date assessment of UK climate trends, variations and extremes based on the latest available climate quality observational datasets.
The majority of this report is based on observations of temperature, precipitation, sunshine and wind speed from the UK land weather station network as managed by the Met Office and a number of key partners and co-operating volunteers. The observations are carefully managed such that they conform to current best practice observational standards as defined by the World Meteorological Organization (WMO). The observations also pass through a range of quality assurance procedures at the Met Office before application for climate monitoring. In addition, time series of near-coast sea-surface temperature and sea-level rise are also presented.
A supplementary phenology report investigates dates of budburst of 11 tree species during 2016 and their relationship with climate variables.
FeedbackWe would welcome suggestions or recommendations for future publications of this report. Please send any feedback to the Met Office at [email protected]
Introduction
This report should be cited as:
Kendon, M., McCarthy, M., Jevrejeva, S. and Legg, T. (2017): State of the UK Climate 2016, Met Office, Exeter, UK.
This work was supported by the Joint UK BEIS/Defra Met Office Hadley Centre Climate Programme (GA01101).
4

Land temperature
l 2016 was the 13th warmest year for the UK in a series from 1910, and 22nd warmest for Central England in a series from 1659.
l Eight of the ten warmest years for the UK have occurred since 2002 and all the top ten warmest years have occurred since 1990.
l The most recent decade (2007-2016) has been on average 0.3 °C warmer than the 1981-2010 average and 0.8 °C warmer than 1961-1990.
Air and ground frost
l The numbers of air and ground frosts in 2016 were below average for the year overall but not exceptionally so.
l The most recent decade (2007-2016) has had 7% fewer days of air frost and 9% fewer days of ground frost compared to the 1981-2010 average, and 16% / 13% compared to 1961-1990.
Energy demand and Growing conditions
l Heating degree days in 2016 were slightly below average but not exceptionally so. Growing degree days were slightly above average.
l The most recent decade (2007-2016) has had 3% fewer heating degree days per year on average compared to 1981-2010 and 9% fewer compared to 1961-1990.
l The most recent decade (2007-2016) has had 4% more growing degree days per year on average compared to 1981-2010 and 14% more compared to 1961-1990.
Near-coast sea-surface temperature
l 2016 was the seventh warmest year for UK near-coastal sea-surface temperature (SST) in a series from 1870.
l The most recent decade (2007-2016) has been on average 0.3 °C warmer than the 1981-2010 average and 0.6 °C warmer than 1961-1990.
l Nine of the ten warmest years for near-coast SST for the UK have occurred since 1989.
Precipitation
l 2016 rainfall was slightly below average for the UK overall with 95% of the 1981-2010 average precipitation.
l Winter 2016 (December 2015 to February 2016) was the second wettest winter for the UK in a series
from 1910, with winter 2014 wettest. In contrast October and December 2016 were notably dry.
l Seven of the ten wettest years for the UK have occurred since 1998.
l In the past few decades there has been an increase in annual average rainfall over the UK, particularly over Scotland for which the most recent decade (2007–2016) has been on average 11% wetter than 1961–1990 and 4% wetter than 1981-2010.
Snow
l Although there were some snowfalls during 2016 this was not a particularly snowy year for the UK overall.
l 2016 is the first year in a series from 1959 with no observed snow depths of 20 cm or more.
l With the notable exceptions of 2010 and 2013, widespread and substantial deep snow events have been relatively rare in recent decades.
Sunshine
l 2016 was sunnier than the 1981-2010 average for the UK overall with 104% of average sunshine hours.
l The most recent decade (2007–2016) has had for the UK on average 6% more hours of bright sunshine than the 1961–1990 averages and 4% more than the 1981-2010 average. These trends are particularly evident in winter and spring with 11% / 15% more sunshine than the 1961-1990 average.
Wind
l Eight major Atlantic storms affected the UK in year 2016; the number and severity of the storms were not unusual compared to recent decades.
l There are no compelling trends in storminess as determined by maximum gust speeds from the UK wind network over the last four decades.
Sea level rise
l Mean sea level around the UK rose by approximately 1.4mm/yr in the 20th century, when corrected for land movement.
l The 99th percentile water level (exceeded 1 percent of the time) at Newlyn, Cornwall for year 2016 was second-highest in a 100 year record, with year 2014 highest.
Executive Summary
5

Temperature The UK mean temperature (Tmean) for 2016 was 9.3 °C, which is 0.5 °C above the 1981-2010 long term average. Overall, this was a warm but unexceptional year, ranked 13th warmest in the UK series from 1910. 2016 was ranked 22nd warmest in the Central England temperature (CET) series from 1659. The annual mean temperature was around 0.5 °C above normal across almost all of the UK (Figure 1, Table 1).
The UK annual mean maximum temperature (Tmax) for 2016 was 13.0 °C, which is 0.5 °C above average. The Tmax anomaly pattern was in general very similar to Tmean, with little variation across the country but slightly higher anomalies in some areas such as the East Anglian coasts and parts of western Scotland. The UK annual mean minimum temperature (Tmin) for 2016 was 5.7 °C, which is 0.4 °C above average. Tmin anomalies were around 0.5 °C above normal across most areas but nearer normal around some coastal fringes, particularly in the north (Figure 1, Table 1).
The UK seasonal Tmean for winter was 5.5 °C, which is 1.8 °C above the 1981-2010 average and this was third warmest winter in the UK series from 1911. Temperature anomalies in the south exceeded 2.5 °C widely and it was the warmest winter for both England and Wales in series from 1911 (Figure 2). The winter was also ranked 2nd in the CET series from 1659 with only that of 1869 warmer. This was almost entirely due to the exceptionally mild December 2015 (see State of the UK Climate 2015 and Burt and Kendon, 2016); January was mild and February was mild in the south but overall fairly near-normal (Figure 3, Table 1).
Spring temperatures were very close to the 1981-2010 normal throughout the UK, with a cool April offset by a warm May (although the Aprils of 2012 and 2013 were cooler). The summer was warmer than average, but not exceptional and this was mainly influenced by high minimum rather than maximum temperatures under often cloudy conditions. The June monthly Tmin for England was the equal-warmest in the series from 1910 and for Wales it was easily the warmest by a margin of 0.5 °C. During July, maximum temperatures were often suppressed (apart from a brief spell after mid-month; on the 19th 30 °C was reached widely as far north as Carlisle). The second half of August saw further warmth with 30 °C exceeded again across the south-east.
Autumn temperatures were close to the 1981-2010 normal, this time with a notably warm September offset by a cold November. September 2016 was equal-second warmest in the UK series from 1910, with only 2006 warmer, and during a significant late-summer heat-wave the highest temperature of the year, 34.4 °C was recorded at Gravesend, Kent on 13th (see significant weather events p47). November brought cold, bright weather with clear skies leading to low minimum temperatures. For the UK this was the coldest November since 2010. In contrast, December was a mild month, particularly across Scotland where anomalies exceeded 2.5 °C making it comparably mild here to December 2015 – though December 2015 was much milder elsewhere in the UK.
Figure 1: 2016 annual average temperature anomalies (°C) relative to 1981-2010 average for mean, maximum and minimum temperature. Bulls-eye features present in the Tmin map are likely to be due to localised frost hollow effects at individual weather stations which the gridding process is unable to fully represent.
6

Figure 2: 2016 seasonal average temperature anomalies (°C relative to 1981-2010 average). Winter refers to the period December 2015 to February 2016. Note that winter 2017 (December 2016 to February 2017) will appear in State of the UK Climate 2017.
Figure 3: 2016 monthly average temperature anomalies (°C) relative to 1981-2010 average.
7

Figure 4 shows time series of annual Tmean anomalies for the UK and countries from 1910 to 2016 inclusive and Figure 5 the seasonal UK Tmean anomaly series. There is an increase in temperature from the 1970s to the 2000s with the most recent decade (2007–2016) being on average 0.8 °C warmer than the 1961–1990 average and 0.3 °C above 1981–2010. All of the top ten warmest years in the UK Tmean series have occurred since 1990 and the eight warmest years have all occurred since 2002. Year 2016 is ranked 13th (Figure 4). However, while year 2016 is near normal compared to the most recent decade it would be an unusually warm year compared to
the first eight decades of the series; from 1910 to 1990 only two other years (1949 and 1990) were warmer. Nevertheless, despite the warming trend, year 2010 (ranked 12th coldest in the UK series) demonstrates that it is still possible for a recent year to be cold.
All four seasons have seen 2007-2016 warmer than 1961-1990, with the largest change for spring at 1.1 °C (Figure 5). Warming has been slightly greater for Tmax than Tmin (Figure 6) resulting in a small increase in the average daily temperature range but to levels similar to those observed in the first half of the 20th Century.
8
Table 1: Monthly, seasonal and annual mean temperature and anomaly values (°C) relative to 1981-2010 average for the UK, countries and CET for year 2016. Colour coding relates to the relative ranking in the full series which spans 1910 - 2016 for all series except CET which is 1659 to 2016
UK England Wales Scotland N Ireland CET
Actual Anom Actual Anom Actual Anom Actual Anom Actual Anom Actual Anom
Jan 4.6 0.9 5.3 1.1 5.4 1.3 3.1 0.5 5.0 0.8 5.4 1.0
Feb 3.9 0.2 4.7 0.6 4.5 0.5 2.2 -0.5 4.0 -0.3 4.9 0.5
Mar 5.3 -0.2 5.6 -0.6 5.3 -0.5 4.6 0.5 6.0 0.2 5.8 -0.8
Apr 6.5 -0.9 7.3 -0.8 6.9 -0.7 5.1 -1.0 6.3 -1.3 7.5 -1.0
May 11.3 1.0 12.1 0.9 11.8 1.2 9.8 1.0 11.2 1.0 12.5 0.8
Jun 13.9 0.9 14.8 0.7 14.5 1.3 12.3 1.0 14.2 1.4 15.2 0.7
Jul 15.3 0.2 16.7 0.4 15.2 0.0 13.1 -0.2 14.6 0.0 16.9 0.2
Aug 15.5 0.6 16.9 0.8 15.6 0.6 13.3 0.3 15.0 0.7 17.0 0.6
Sep 14.6 2.0 15.9 2.2 14.6 1.7 12.7 1.8 13.6 1.2 16.0 2.0
Oct 9.8 0.3 10.6 0.2 10.1 0.2 8.4 0.5 10.0 0.6 10.9 0.2
Nov 4.9 -1.3 5.7 -1.1 5.5 -1.2 3.4 -1.6 5.1 -1.3 5.6 -1.5
Dec 5.9 2.0 6.0 1.6 6.3 1.8 5.6 2.8 6.4 2.0 6.0 1.4
Win 5.5 1.8 6.5 2.3 6.4 2.2 3.6 0.9 5.4 1.0 6.7 2.2
Spr 7.7 0.0 8.4 -0.2 8.0 0.0 6.5 0.2 7.9 0.0 8.6 -0.3
Sum 14.9 0.6 16.1 0.6 15.1 0.7 12.9 0.4 14.6 0.7 16.4 0.5
Aut 9.8 0.3 10.7 0.4 10.1 0.2 8.2 0.2 9.6 0.2 10.8 0.2
Ann 9.3 0.5 10.2 0.5 9.7 0.5 7.8 0.4 9.3 0.4 10.3 0.3
Key
Warmest on Record
Top ten warm
Warm: Ranked in
upper third of all years
Mid: Ranked in
middle third of all years
Cool: Ranked in
lower third of all years
Top ten cold
Coldest on record

The uncertainty in these statistics is principally a function of the number and distribution of stations in the observing network which varies through time. For monthly, seasonal and annual averages this uncertainty is less than 0.1 °C and consequently much smaller than the year-to-
year variability. For simplicity of presentation all the temperature data are presented in the tables to the nearest 0.1 °C. More information relating to the uncertainties and how they are estimated is provided in Annex 2.
6.00
8.00
10.00
Tem
pera
ture
ano
mal
y (°
C)
UK England Wales Scotland Northern Ireland
0.00
2.00
4.00
1910 1920 1930 1940 1950 1960 1970 1980 1990 2000 2010
Tem
Year
1°C
1°C
Area 1961-1990 average 1981-2010 average 2007-2016 average 2016
UK 8.3 8.8 9.1 9.3
England 9.1 9.7 10.0 10.2
Wales 8.6 9.1 9.4 9.7
Scotland 7.0 7.4 7.7 7.8
Northern Ireland 8.4 8.9 9.1 9.3
Figure 4: Annual Tmean for the UK and countries, 1910 to 2016, expressed as anomalies relative to the 1981-2010 average. The hatched black line is the 1981-2010 long-term average. The lower hatched green line is the 1961-1990 long-term average. Light grey grid-lines represent anomalies of +/- 1 degC. The table provides average values (°C). Smoothed trend lines used here and throughout the report are described in Annex 2.
9

8.00
12.00
16.00
Tem
pera
ture
ano
mal
y (°
C)
Winter Spring Summer Autumn
0.00
4.00
Tem
Year
1°C
1°C
1910 1920 1930 1940 1950 1960 1970 1980 1990 2000 2010
Season 1961-1990 average 1981-2010 average 2007-2016 average 2016
Winter 3.3 3.7 4.0 5.5
Spring 7.1 7.7 8.1 7.7
Summer 13.8 14.4 14.4 14.9
Autumn 9.1 9.4 9.9 9.8
Figure 5: Seasonal Tmean for the UK, 1910 to 2016 (note winter from 1911 to 2016; year is that in which January and February fall. Winter 2017 – which includes December 2016 - will appear in next year’s publication). Light grey grid-lines represent anomalies of +/- 1 degC. The table provides average values (°C).
10

6.00
8.00
10.00
Tem
pera
ture
ano
mal
y (°
C)
Tmax Tmean Tmin Tmax-Tmin
2.00
4.00
Tem
Year
1910 1920 1930 1940 1950 1960 1970 1980 1990 2000 2010
1°C
1°C
Variable 1961-1990 average 1981-2010 average 2007-2016 average 2016
Tmax 11.8 12.4 12.8 13.0
Tmean 8.3 8.8 9.1 9.3
Tmin 4.8 5.3 5.5 5.7
Tmax minus Tmin 7.0 7.2 7.3 7.3
Figure 6: Annual Tmax, Tmean and Tmin for the UK, and Tmax minus Tmin, 1910 to 2016, expressed as anomalies relative to the 1981-2010 average. Light grey grid-lines represent anomalies of +/- 1 degC. The table provides average values (°C).
11

Figure 7 shows annual Tmean for England from 1910 to 2016 and CET series from 1659. The series are highly correlated (R2 value 0.98, see Annex 2) and have a root mean square difference of 0.1 °C which is comparable to the estimated series uncertainty as described in
Annex 2. The CET series could effectively be considered a proxy for an England series from 1659. The CET series provides evidence that the early 21st century has been warmer than the previous three centuries, and that all seasons are also warmer (Figure 8).
-2.0-1.5-1.0-0.50.00.51.01.5
CET England CET trend England trend
-3.5-3.0-2.5
1650
1670
1690
1710
1730
1750
1770
1790
1810
1830
1850
1870
1890
1910
1930
1950
1970
1990
2010
Tem
pera
ture
ano
mal
y (°
C)
Variable 1961-1990 average 1981-2010 average 2007-2016 average 2016
CET 9.5 10.0 10.1 10.3
England 9.1 9.7 10.0 10.2
Figure 7: Annual Tmean for CET series, 1659 to 2016, and England temperature series, 1910 to 2016, expressed as anomalies relative to the 1981-2010 average. The table provides average values (°C).
12

-1.0
-0.5
0.0
0.5
1.0Winter Spring Summer Autumn
-2.0
-1.5
1650
1670
1690
1710
1730
1750
1770
1790
1810
1830
1850
1870
1890
1910
1930
1950
1970
1990
2010
Tem
pera
ture
ano
mal
y (°
C)
Figure 8: Seasonal CET series, 1659 to 2016, expressed as anomalies relative to 1981-2010 average. The figure shows a smoothed trend for each series using a weighted kernel filter described in Annex 2.
13

The number of days of air frost for the UK for 2016 was 50 days, which is 5 days below the 1981-2010 average (Figure 9). This was largely due to fewer frosts than normal in January and December, especially across Scotland, whereas there were more air frosts than usual across the north and west in February, April and November.
The number of days of ground frost for 2016 was 101 days, 9 days below the 1981-2010 average. Upland areas of Wales, northern England and Scotland recorded between 20 and 30 fewer days of ground frost for the year overall compared to normal (Figure 9). As with air
frost the greatest contribution to this deficit was during December, when northern areas recorded typically around 10 fewer days of ground frost compared to normal.
While the annual numbers of days of air and ground frost for the UK overall for 2016 was close to the average for the most recent decade, both series show a reduction through the 1980s and 1990s and this decade, 2007–2016 has recorded 16% fewer annual days of air frost and 13% fewer ground frosts per year than the average for 1961-1990 (Figure 10).
Figure 9: Days of air frost and days of ground frost anomaly for year 2016 relative to 1981-2010. See Annex 1 for definitions. Bulls-eye features in these and the Tmin maps are likely to be due to localised factors such as frost hollow effects at individual weather stations which the gridding process is unable to fully represent, particularly for ground frost.
Days of air and ground frost
14

80
100
120
140
160Days of Air Frost
Days of Ground Frost
20
40
60
1960 1970 1980 1990 2000 2010
Day
s of
Air
/ G
roun
d Fr
ost
Variable 1961-1990 average 1981-2010 average 2007-2016 average 2016
Days of Air Frost 61 55 51 50
Days of Ground Frost 116 111 101 101
Figure 10: Annual number of days of air frost and ground frost for the UK, 1961 to 2016. The hatched black lines are the 1981-2010 annual averages. The table provides average values (days).
15

A degree day is an integration of temperature over time and is commonly used to relate temperature to particular impacts. It is typically estimated as the sum of degrees above or below a defined threshold each day over a fixed period of time. The standard degree days monitored by the Met Office are heating, cooling and growing degree days which relate to the requirement for heating or cooling of buildings to maintain comfortable temperatures, or the conditions suitable for plant growth respectively. The definitions and thresholds used are described in Annex 1.
Heating degree days (HDD) for 2016 were around 95% of average across most of England, Wales and Northern
Ireland but closer to average across Scotland (Figure 11). Averaged across the UK HDD for 2016 were 96% of the 1981-2010 average and ranked 14th lowest in the series from 1960 (with year 2015 ranked 13th lowest). The lowest ten HDD years for the UK have all occurred since 1990, with the lowest seven since 2002. Overall HDD for 2016 were close to average for the most recent decade (Figure 12). For the UK, the most recent decade has had an annual average HDD 9% lower than 1961–1990 and 3% lower than 1981–2010. Nevertheless, year 2010 demonstrates that it is still possible for a recent year to have well above average HDD values.
Figure 11: Heating degree days for 2016 (left) actual and (right) % of 1981-2010 average.
Degree days
16

1800.00
2400.00
3000.00
Hea
ting
Deg
ree
Day
s
UK England Wales Scotland Northern Ireland
0.00
600.00
1200.00
H
Year
100
HD
D10
0 H
DD
1960 1970 1980 1990 2000 2010
Area 1961-1990 average 1981-2010 average 2007-2016 average 2016
UK 2731 2566 2487 2457
England 2514 2333 2240 2218
Wales 2609 2446 2374 2321
Scotland 3140 3000 2937 2905
Northern Ireland 2646 2491 2434 2384
Figure 12: Heating degree days for the UK and countries, 1960 to 2016, expressed as anomalies relative to the 1981-2010 average. The hatched black line is the 1981-2010 long-term average. The hatched green line is the 1961-1990 long-term average. Light grey grid-lines represent anomalies of +/- 100 HDD. The table provides average values (HDD). Please also refer to page 49 correction to State of the Climate 2015 report.
17

Figure 13: As Figure 11 for cooling degree days for 2016 but the anomaly is presented as a difference from, rather than percentage of, average. This is because CDD are close to zero over Highland Scotland.
In general, the highest cooling degree day (CDD) values are around Greater London due in part to the urban heat-island effect. CDD for 2016 for the UK (14) and England (23) were each close to the 1981-2010 average (13 and 21). However, there was significant variation across England, with CDD values across East Anglia and the south-east typically 10 to 15 CDD higher than the 1981-2010 average of around 30 to 40 CDD across these regions. This was because the hottest spells of weather in 2016, during mid-July, late-August and early-September tended to be focussed across these areas. In contrast, CDD were slightly below normal across parts of the south-west (Figure 13).
The years with high CDD in the time-series across England and Wales (notably 1976, 1995, 2003 and 2006) are those
when major heat-waves occurred. The cooler climate of Scotland and Northern Ireland means that CDD are much lower, each with long-term averages of less than 5 CDD. Although there has been a general increase in CDD across England (Figure 14) significant peaks are dependent on when major heat-waves happen to occur. The most recent decade 2007-2016 does not include any major heat-waves in the UK (the last occurrence being July 2006) and so CDD are lower than the 1981-2010 averages, particularly across England and Wales. The latest year with well above-average CDD was 2013, associated with a warm dry spell during July. This contrasts with a run of notably low CDD from 2007 to 2012 associated with a run of generally poor summers compared to previous decades.
18

Area 1961-1990 average 1981-2010 average 2007-2016 average 2016
UK 9 13 10 14
England 14 21 17 23
Wales 8 10 6 9
Scotland 3 3 2 2
Northern Ireland 3 4 3 4
Figure 14: Cooling degree days for the UK and countries, 1960 to 2016, expressed as anomalies relative to the 1981-2010 average. The hatched black line is the 1981-2010 long-term average. The hatched green line is the 1961-1990 long-term average. Light grey grid-lines represent anomalies of +/- 10 CDD. The table provides average values (CDD).
19
Coo
ling
Deg
ree
Day
s
UK England Wales Scotland Northern Ireland
0.00
40.00
80.00
C
Year
10 C
DD
10 C
DD
1960 1970 1980 1990 2000 2010

Figure 15: Growing degree days for 2016 (left) actual and (right) % of 1981-2010 average
Growing degree days (GDD) for 2016 were between 5 and 10% above average across most of the UK, although nearer average across parts of central and south-west England and eastern Scotland (Figure 15). UK GDD overall were 106% of the 1981-2010 average but very close to average for the most recent decade across all regions.
The most recent decade has had an annual GDD 14% higher than 1961-1990 and 4% higher than 1981-2010, and the similar (downward) trend in HDD and (upward) trend in GDD from 1960 to date each reflect the underlying warming of the UK’s climate (Figure 16).
20

Area 1961-1990 average 1981-2010 average 2007-2016 average 2016
UK 1403 1541 1596 1626
England 1611 1778 1846 1872
Wales 1457 1594 1638 1689
Scotland 1054 1145 1181 1210
Northern Ireland 1353 1478 1537 1575
Figure 16: Growing degree days for the UK and countries, 1960 to 2016, expressed as anomalies relative to the 1981-2010 average. The hatched black line is the 1981-2010 long-term average. The hatched green line is the 1961-1990 long-term average. Light grey grid-lines represent anomalies of +/- 100 GDD. The table provides average values (GDD).
21
1200.00
1600.00
2000.00
Gro
win
g D
egre
e D
ays
UK England Wales Scotland Northern Ireland
0.00
400.00
800.00G
Year
100
GD
D10
0 G
DD
1960 1970 1980 1990 2000 2010

The annual mean sea-surface temperature (SST) for 2016 for near-coast waters around the UK was 11.9 °C, 0.4 °C above the 1981-2010 long term average and ranked seventh in the series from 1870 (Figure 17).
Near-coast SST data is highly correlated with the land observations, the most recent decade, 2007–2016, is 0.6 °C higher than the 1961–1990 average and 0.3
°C above 1981–2010. As with the UK annual mean air temperature over land, the 2016 annual mean near-coast SST was near normal in comparison to the most recent decade, but would be considered a warm year compared to most of the series. From 1870 to 2000 only 1989 was warmer than 2016, and nine of the ten warmest years in the series have occurred since 1989.
-0.5
0.0
0.5
1.0
1.5
Anom
aly
(°C
)
UK land UK SST
-1.5
-1.0
1870
1880
1890
1900
1910
1920
1930
1940
1950
1960
1970
1980
1990
2000
2010
Year
Area 1961-1990 average 1981-2010 average 2007-2016 average 2016
UK land 8.3 8.8 9.1 9.3
UK near-coast SST 11.1 11.5 11.7 11.9
Figure 17: UK annual mean temperature over land 1910 to 2016 and UK annual mean sea surface temperature across near-coastal waters around the UK 1870 to 2016, expressed as anomaly relative to the 1981-2010 long term average. The table provides average values (°C).
Coastal waters
22

Precipitation
The UK rainfall total for 2016 was 1100mm, 95% of the 1981-2010 average, considerably drier than the previous two years and comparable overall to 2013. No individual region deviated by more than 10% from average, although some areas locally recorded less than 85%. The rainfall pattern was variable with the driest areas relative to average across southern England and Wales, Northern Ireland and Highland Scotland, and the wettest areas mainly across the north Midlands, parts of north-west and north-east England and eastern Scotland (Figure 18).
The wettest and driest observed locations for the year generally reflected the long-term climatology, with several rain-gauges in the Lake District, Snowdonia and West Highlands recording over 3000mm for the year, whereas parts of Kent, Essex and Cambridgeshire recorded around 450mm, typically around 80% of average at these stations.
Figures 19 and 20 and Table 2 show seasonal and monthly rainfall across the UK for 2016. Inevitably, as is always the case, the annual map conceals the detail behind significant monthly and seasonal variations which occurred in rainfall patterns over the course of the year.
Following the exceptionally wet December of 2015, January 2016 was also a wet month with over 200% of average rainfall across parts of north-east England, eastern Scotland and the south coast and it was the equal-fourth wettest January in the UK series from 1910. For eastern Scotland these two months were the wettest and second-wettest calendar months in an eastern Scotland series from 1910, leading to significant flooding problems (see significant weather events p45). February rainfall totals were nearer normal but nevertheless this still resulted in the second wettest winter in the UK series, behind 2014. For Wales and Scotland, winter 2014 and 2016 were equal-wettest (for Scotland by a margin of 15% from the third-wettest winter), and for Northern Ireland winter 2016 was wettest in the series. Rainfall totals for the winter ranged from around 110mm for some locations in East Anglia to more than 2000mm across upland areas of the Lake District. The wettest areas across a northern swathe of the UK received over 200% of average rainfall. Some of these areas were similarly wet in winter 2014 but in general the main focus of the rain of that winter was southern England.
As also happened in 2014, in comparison and with a few notable exceptions, the rest of the year was much quieter. Rainfall patterns in March, May and spring overall showed a mainly north (dry) to south (wet) contrast. June was often wet and unsettled, with heavy downpours bringing localised flooding at times to England and eastern Scotland, whereas July and August saw plenty of dry weather in the south and south-east; in July less than 5mm fell locally
in some areas. Overall summer rainfall totals were above average for most areas apart from southern England.
The autumn was relatively dry throughout the UK, but especially across northern and western areas. October was a particularly dry month with high pressure often blocking rain-bearing frontal systems; with 37% of average rainfall this was the equal-fifth driest October for the UK in a series from 1910. December was another dry month, particularly across the south with less than 20% across parts of the south-east. Several counties in southern England experienced a run of dry months from July to December with less than 55% of 1981-2010 average rainfall for these six months for Essex, Kent and Sussex.
The exceptionally wet weather of the early winter resulted in significant flooding problems and localised landslides in January, particularly across parts of eastern Scotland and Northern Ireland. However, after this any issues due to flooding tended to be less significant and more localised. Heavy showers and thunderstorms caused flash-flooding particularly during June with widespread impacts late in the month across the south-east, with damage also reported from lightning at times. Further localised flooding occurred during July and August, with flash-flooding from
Figure 18: Rainfall anomalies (%) for year 2016
23

Figure 19: Rainfall anomalies (%) for seasons of 2016. Winter refers to the period December 2015 to February 2016. Note that winter 2017 (December 2016 to February 2017) will appear in State of the UK Climate 2017.
Figure 20: Rainfall anomalies (%) for months of 2016.
24

intense downpours following the September heat-wave on 13th in the Manchester area and on 15th across the south-east and parts of the north-east. The first named storm of the 2016/17 season was storm Angus in late November. This storm and the next low pressure system which rapidly followed each brought heavy rain to parts of the south-west with overall 3-day totals approaching a month’s rain
causing more extensive flooding. The south-west main-line railway was temporarily closed, recalling the more severe floods which occurred here during winter 2014. Overall, however, the number and severity of flood events during 2016 was unexceptional compared to other recent years: 2015, 2013-2014, 2012, 2009, 2007 and 2005.
25
Table 2: Monthly, seasonal and annual rainfall actual (mm) and anomaly values (%) relative to 1981 – 2010 for the UK, countries and EWP for year 2016. Colour coding relates to the relative ranking in the full series which spans 1910 - 2016 for all series except EWP which is 1766 – 2016.
UK England Wales Scotland N Ireland EWP
Actual Anom Actual Anom Actual Anom Actual Anom Actual Anom Actual Anom
Jan 180 148 125 150 243 155 254 143 176 151 150 161
Feb 111 125 72 120 147 133 164 126 111 132 80 120
Mar 83 88 77 121 104 89 90 64 72 76 95 133
Apr 78 107 63 107 88 98 99 109 78 105 73 113
May 61 88 51 87 85 99 73 86 58 81 62 97
Jun 96 130 95 153 130 152 89 101 89 117 114 172
Jul 79 101 40 63 87 93 139 140 98 121 44 65
Aug 85 96 64 92 104 97 119 102 68 70 68 89
Sep 97 101 63 90 135 116 144 106 97 106 72 93
Oct 47 37 37 40 45 27 66 38 45 38 46 44
Nov 105 86 99 112 118 73 114 69 82 73 117 116
Dec 78 65 35 41 83 50 147 90 78 68 41 42
Win 509 154 331 144 726 167 746 158 507 161 375 145
Spr 222 93 191 105 277 95 262 83 209 86 230 115
Sum 260 108 198 102 321 112 347 114 255 100 225 108
Aut 249 72 199 80 299 67 324 68 224 69 235 83
Ann 1100 95 821 96 1370 94 1499 95 1053 93 961 101
Key
Wettest on record
Top ten wettest
Wet: Ranked in the
upper third of all years
Mid: Ranked in
middle third of all years
Dry: Ranked in
lower third of all years
Top ten driest
Driest on Record

The precipitation data show a slight increasing trend from the 1970s onwards (Figure 21) that is most pronounced for Scotland for which the most recent decade (2007–2016) has been on average 11% wetter than 1961–1990 and 4% wetter than 1981-2010. The
wettest years for the UK overall are 2000 and 2012 (both 116% of average) and the driest 1933 (72%). 2016 was ranked near the middle of the UK series from 1910. Six of the seven wettest years in the UK series have occurred since 2000, most recently 2012, 2014 and 2015.
120.0
160.0
200.0
Rain
fall
anom
aly
(%)
UK England Wales Scotland Northern Ireland
0.0
40.0
80.0
R
Year
10%
10%
1910 1920 1930 1940 1950 1960 1970 1980 1990 2000 2010
Area 1961-1990 average 1981-2010 average 2007-2016 average 2016
UK 1101 1154 1193 1100
England 828 855 885 821
Wales 1400 1460 1460 1370
Scotland 1472 1571 1633 1499
Northern Ireland 1099 1136 1195 1053
Figure 21: Annual rainfall, 1910 to 2016, expressed as a percentage of 1981-2010 average. The hatched black line is the 1981-2010 long-term average. The lower hatched green line is the 1961-1990 long-term average. Light grey grid-lines represent anomalies of +/- 10%. The table provides average values (mm).
26

Figure 22 shows seasonal rainfall series for the UK from 1910 to 2016 (for winter 1911 to 2016). The two recent
winters of 2013-2014 and 2015-2016 stand out, each with over 150% of the 1981-2010 average UK rainfall overall.
200.0
300.0
400.0
Rain
fall
anom
aly
(%)
Winter Spring Summer Autumn
0.0
100.0
R
Year
20%
20%
1910 1920 1930 1940 1950 1960 1970 1980 1990 2000 2010
Season 1961-1990 average 1981-2010 average 2007-2016 average 2016
Winter 308 330 372 509
Spring 231 238 223 222
Summer 236 241 287 260
Autumn 327 345 321 249
Figure 22: Seasonal rainfall for the UK, 1910 to 2016 (note winter from 1911 to 2016; year is that in which January and February fall. Winter 2017 – which includes December 2016 - will appear in State of the UK Climate 2017). Light grey grid-lines represent anomalies of +/- 20%. The table provides average values (mm).
27

800
900
1000
1100
1200
1300
1400
Rain
fall
(mm
)
EWP England and Wales EWP trend England and Wales trend
500
600
700
1760
1780
1800
1820
1840
1860
1880
1900
1920
1940
1960
1980
2000
2020
Area 1961-1990 average 1981-2010 average 2007-2016 average 2016
EWP 915 948 990 961
England and Wales 907 938 964 896
Figure 23: Annual rainfall for EWP series, 1766 to 2016, and England and Wales areal series, 1910 to 2016 (mm). The table provides average values (mm).
The annual rainfall total for 2016 in the long running England and Wales precipitation (EWP) series was 961mm (Figure 23), which is 101% of average with drier than average conditions across much of southern England while much of northern England was slightly wetter, making this an unremarkable year in the EWP series. Figure 23 shows there are some notable decadal fluctuations in the series such as a wet period through the 1870s, and the ‘Long Drought’ from 1890 to 1910 (Marsh et al, 2007) highlighting the value of rainfall series before the 20th
Century for understanding the full historical context of UK rainfall. The most recent decade is a relatively wet decade in this series being 4% wetter than 1981-2010 and 8% wetter than 1961-1990. The England and Wales areal rainfall series based on 5km resolution gridded data is closely correlated to EWP, with an R2 value of 0.97 and root mean square difference of 2.0%. Minor differences between the series are inevitable due to the more limited sampling of stations used for the EWP series and the gridding method used for the England and Wales areal series.
28
210
230
250
270
290
310
Seas
onal
rain
fall
(mm
)
150
170
190
1760
1780
1800
1820
1840
1860
1880
1900
1920
1940
1960
1980
2000
2020
Sea
Winter Spring Summer Autumn
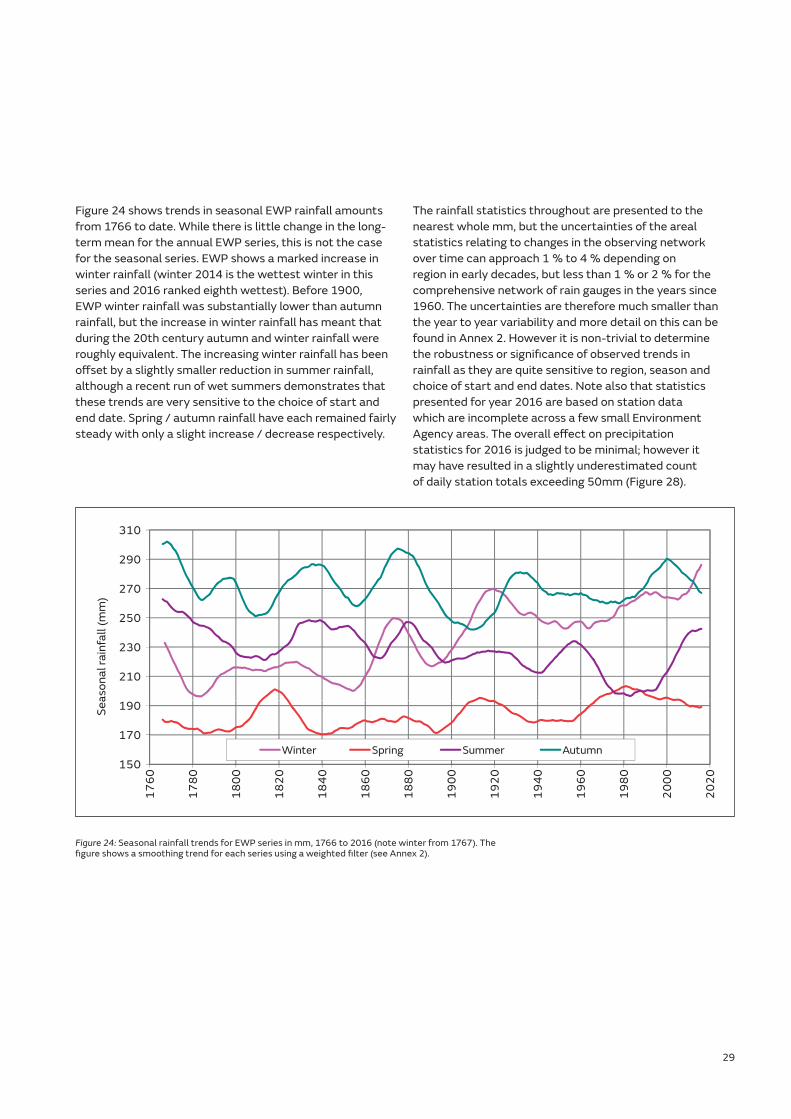
Figure 24: Seasonal rainfall trends for EWP series in mm, 1766 to 2016 (note winter from 1767). The figure shows a smoothing trend for each series using a weighted filter (see Annex 2).
Figure 24 shows trends in seasonal EWP rainfall amounts from 1766 to date. While there is little change in the long-term mean for the annual EWP series, this is not the case for the seasonal series. EWP shows a marked increase in winter rainfall (winter 2014 is the wettest winter in this series and 2016 ranked eighth wettest). Before 1900, EWP winter rainfall was substantially lower than autumn rainfall, but the increase in winter rainfall has meant that during the 20th century autumn and winter rainfall were roughly equivalent. The increasing winter rainfall has been offset by a slightly smaller reduction in summer rainfall, although a recent run of wet summers demonstrates that these trends are very sensitive to the choice of start and end date. Spring / autumn rainfall have each remained fairly steady with only a slight increase / decrease respectively.
The rainfall statistics throughout are presented to the nearest whole mm, but the uncertainties of the areal statistics relating to changes in the observing network over time can approach 1 % to 4 % depending on region in early decades, but less than 1 % or 2 % for the comprehensive network of rain gauges in the years since 1960. The uncertainties are therefore much smaller than the year to year variability and more detail on this can be found in Annex 2. However it is non-trivial to determine the robustness or significance of observed trends in rainfall as they are quite sensitive to region, season and choice of start and end dates. Note also that statistics presented for year 2016 are based on station data which are incomplete across a few small Environment Agency areas. The overall effect on precipitation statistics for 2016 is judged to be minimal; however it may have resulted in a slightly underestimated count of daily station totals exceeding 50mm (Figure 28).
29

Days of rain and rainfall intensity
Figure 25: Days of rain >= 1mm (Dr1) and 10mm (Dr10) for 2016, difference from 1981-2010 average.
The number of days of rain greater than or equal to 1 mm (Dr1) showed considerable variation during 2016. The number of days of rain was mainly below average across southern England and parts of Northern Ireland and Scotland, but above average across Wales, much of central and eastern England and eastern Scotland (Figure 25). In general, the monthly variation was comparable to the rainfall anomaly pattern (Figure 19) with more days of
rain than average in January, April and June but fewer in October and December – with other months mostly having smaller anomalies. The number of days of rain greater than or equal to 10mm (Dr10) was near-normal across much of the UK but below across some western and northern areas, with the exception of Snowdonia and the Lake District (Figure 25). There were notably more Dr10 than normal in January but fewer in October and December.
30

6.4
6.6
6.8
7.0
7.2
7.4
7.6
Rainfall Intensity Trend
5.8
6.0
6.2
Year
Rain
fall
Inte
nsity
(mm
/day
)
1960 1970 1980 1990 2000 2010
1961-1990 average 1981-2010 average 2007-2016 average 2016
UK rainfall intensity 6.6 6.8 6.7 6.5
Figure 26: Annual average rainfall intensity for the UK on days of rain >= 1mm, 1961 to 2016. The table provides average values (mm/day).
Figure 26 shows an estimate of the areal-average rainfall intensity (see Annex 1 for definition) across the UK for each year, based on Dr1, from 1961 to 2016 inclusive. Although the figure neither provides a seasonal break-down, nor distinguishes between upland and lowland areas, it is indicative of trends in rainfall intensity across the UK on wet days. Overall, 2016 was an unremarkable
year and slightly below average for this metric. Although there is a slight upward increase of 0.2 mm (or 3 %), this is a short time-series dominated by year to year variability. The two years with highest rainfall intensity in the series (2000 and 2012) also correspond to the wettest years for the UK in the series from 1910.
31

Alternative metrics for heavy rain are presented here. The ranking of individual years is quite sensitive to the choice of definition used and the series are relatively short given the variability of rainfall. However there are some consistent features across the different metrics -most notably, more heavy rain events have been recorded in the most recent decade than in earlier decades in the series.
The 95th and 99th percentiles of UK daily areal-average rainfall based on the 50-year period 1961 to 2010 inclusive are 9.5mm and 13.9mm respectively. Figure 27 plots the number of days each year in the series when this percentile was exceeded (by definition we would expect on average 18 days and 3 to 4 days respectively). As with rainfall intensity, this does not include a seasonal break-down, nor does it distinguish between orographically enhanced frontal rain and convective rain, but rainfall would need to be fairly widespread across the UK to exceed these percentiles, so this metric gives some indication of trends in widespread heavy rain events. 2016 was an unremarkable year with the number of days below the 1981-2010 average for both percentiles. Both series show some increase in the average number of heavy rain days, but with large annual variability.
Figure 28 provides a count of the number of times each year any rain gauge in the observing network below 500m elevation has recorded a daily rainfall total greater than or equal to 50mm. We refer to this type of metric
as a count of station-days. This metric cannot therefore distinguish between a small number of widespread events recorded at many stations, or more frequent but localised events. This series has therefore been adjusted to take into account the changing size of the UK rain-gauge network which reached over 5100 gauges in the 1970s and has reduced to fewer than 3000 in the 2010s. The dense network of several thousand rain gauges across the UK means that widespread heavy rain events will tend to be well captured, although highly localised convective events may still be missed. However, note that the adjustment does not take into account the fact that the relative proportion of rain-gauges within different parts of the UK also changes with time. Therefore we cannot rule out the possibility that the present day network while having fewer stations overall may provide better sampling of regions that experience higher frequency of heavy rain days such as western Scotland.
The station-count in this series for 2016 was close to the 1981-2010 average. However, six of the top seven years have occurred since 2000. The other year is 1968, during which there were three major heavy rain events in March, July and September, covering large areas (Bleasdale, 1969). This series shows an upward trend from around 1100 station-days in the 1960s to over 1400 station-days since 2000, although, again, this is a short series with high variability.
Heavy rainfall
32

10
15
20
25
30
35
Day
s
95th percentile 99th percentile
0
5
0
1960
1970
1980
1990
2000
2010
2020
Year
Percentile 1961-1990 average 1981-2010 average 2007-2016 average 2016
99th 3 4 4 2
95th 17 20 22 19
Figure 27: The number of days per year with UK areal-average daily rainfall exceeding 95th percentile (9.5mm) and 99th percentile (13.9mm) based on the 50-year period 1961-2010. The table provides average values (days).
1000
1500
2000
2500
Normalized count Trend
0
500
1960
1970
1980
1990
2000
2010
2020
Year
Nor
mal
ized
sta
tion
coun
t
1961-1990 average 1981-2010 average 2007-2016 average 2016
Number of station-days 1068 1275 1481 1268
Figure 28: Annual count of the number of UK station-days which have recorded daily rainfall totals greater than or equal to 50mm from 1961 to 2016, adjusted for station network size and excluding stations above 500 metres above sea level. The table provides average values (station-days). Note that the number of station-days for the 1961-1990 and 1981-2010 averages has changed slightly from last year’s report (1083, 1291). This is mainly because the adjustment for station network size has altered as a result of inclusion of year 2016. However, historical observations held within the climatological database change over time as more digitized data are added or as a result of quality control; data for the full series have been re-extracted from this live database.
33

Snow
3000
4500
6000
7500
9000
1000
1500
2000
2500
3000
20cm 10cm
00
500
1955
1960
1965
1970
1975
1980
1985
1990
1995
2000
2005
2010
2015
Year
Num
ber o
f sta
tion
days
>=
20cm
Num
ber o
f sta
tion
days
>=
10cm
1500
Figure 29: Count of number of station-days per year in the UK with recorded snow depths exceeding 10cm and 20cm, excluding stations above 500 metres above sea level. This series has not been adjusted for network size. The 2016 values are 37 (10cm) and 0 (20cm).
2016 was not a snowy year overall; although there were several snow events these were mostly fairly typical for the time of year when they fell. Snowfalls in mid- and late- January generally affected northern areas but lying snow was briefly recorded as far south as the Home Counties and parts of the south-west. Depths exceeding 5cm were mainly confined to inland and upland parts of northern England and Scotland. There was further snow for Scotland at the end of January, and in early March snow associated with storm Jake brought some transport disruption across Northern Ireland and parts of Northern England. A cold northerly airflow in late April also resulted in some further snow in the north, affecting upland parts of northern England with some unseasonably late lying snow reported across the Hebrides (Mull, Coll and Tiree). There was some disruption from
snow across northern England in early November and upland parts of Scotland on 21 to 22 December.
The last widespread falls of snow across lowland areas of the UK were in January and March 2013. 2010 was the snowiest year by far for the UK in the last two decades, and was comparable to several snowy years in the 1970s and 1980s. Figure 29 shows the count of station-days (not adjusted for network size) where snow depth sensors recorded greater than or equal to 10 cm or 20 cm of lying snow. Year 2016 had the lowest count of station-days for both metrics. This is the first year in the series (from 1959) with no observations of snow depths of 20cm or more. Such low values are broadly comparable with half the years of the last decade: 2007, 2008, 2011, 2014 and 2015. There are also several comparable years earlier in the series such as 1974, 1975, 1988 and 1989.
34

Sunshine
2016 was a sunnier than average year for the UK overall (104% of 1981-2010 average). The highest sunshine anomalies were across north-east England, western Scotland and Shetland, where Lerwick (121%) recorded its second sunniest year in a series from 1929. In contrast, parts of the south coast and western fringes were duller (Figure 30). Note however the possibility that imperfect exposure at individual stations and the relatively sparse density of stations may have had some influence on the detail in the sunshine anomaly pattern. UK sunshine totals for the year ranged from 1118 hours at Eskdalemuir (95% of average) to 1935 hours at Hastings, East Sussex (103%) – the latter being the sunniest UK station for the second consecutive year.
Winter 2016 was dull across much of the UK, as a result of a dull December and January – particularly across western areas with the succession of low pressure systems bringing overcast conditions. In contrast, February was much sunnier, especially across the Western and Northern Isles. The 77 hours of sunshine recorded at Poolewe, Wester
Ross during February was more than three times that of the previous December and January combined (22 hours). Spring was a sunny season, with above average sunshine for all three months, though none exceptionally so.
The summer was relatively dull overall, especially in the west but brighter near North Sea coasts. Unsettled conditions brought below average sunshine across southern areas in June (for England the fourth dullest June in a series from 1929) and northern areas in July – although August was a sunnier month. The autumn was sunny, particularly across western Scotland during October and November. In November Scotland and Northern Ireland recorded 140 / 141% of 1981-2010 average sunshine hours respectively and it was the sunniest November for Scotland in a series from 1929 - although unfortunately this was followed immediately by another very dull December – the second consecutive dull December for Scotland with these two Decembers having less than 70% of the 1981-2010 average sunshine hours (Figure 31 and 32).
Figure 30: Sunshine anomalies (%) for year 2016 relative to 1981-2010
35

Figure 31: Sunshine anomalies (%) for seasons of 2016. Winter 2016 refers to the period December 2015 to February 2016.
Figure 32: Sunshine anomalies (%) for months of 2016
36

90.0
120.0
150.0
unsh
ine
anom
aly
(%)
UK England Wales Scotland Northern Ireland
0.0
30.0
60.0
1925 1935 1945 1955 1965 1975 1985 1995 2005 2015
Su
Year
10%
10%
Area 1961-1990 average 1981-2010 average 2007-2016 average 2016
UK 1338 1373 1424 1425
England 1436 1493 1553 1554
Wales 1376 1401 1456 1464
Scotland 1182 1187 1221 1229
Northern Ireland 1239 1256 1302 1254
Figure 33: Annual sunshine duration (hours) for UK and countries, 1929 to 2016, expressed as a percentage of 1981-2010 average. The hatched black line is the 1981-2010 long-term average. The lower hatched green line is the 1961-1990 long-term average. Light grey grid-lines represent anomalies of +/- 10%. The table provides average values (hours).
Figures 33 and 34 show annual sunshine anomalies for the UK and countries, and seasonal sunshine anomalies for the UK, from 1929 to 2016 inclusive. The smoothed trend shows a slight increase in sunshine from a low during the 1960s to 1980s to a sunnier period from 2000 onwards. The most recent decade (2007–2016) has had for the UK on average 6% more hours of bright sunshine than the 1961–1990 averages and 4% more than the 1981-2010 average. This trend is apparent across all countries but is most prominent during the winter and spring, where the most recent decade is 11% and 15% higher than 1961-1990 respectively.
The sunshine network is relatively sparse, with the 2016 network comprising typically just over 100 stations (Figure A1.1). This means that some parts of the UK such as Highland Scotland and central Wales have few observations. Sunshine stations may be affected by exposure issues, particularly in the winter months when the sun is at a low elevation and topographic shading may be important. The sunshine statistics throughout are presented to the nearest whole hour, but the uncertainties of the areal statistics relating to changes in the observing network over time can approach 2%. More details can be found in Annex 2.
37

100.0
150.0
200.0
Winter Spring Summer Autumn
0.0
50.0
1925 1935 1945 1955 1965 1975 1985 1995 2005 2015
Year
10%
10%
Suns
hine
ano
mal
y (%
)
Season 1961-1990 average 1981-2010 average 2007-2016 average 2016
Winter 148 158 165 151
Spring 422 436 484 488
Summer 501 505 495 475
Autumn 267 274 281 300
Figure 34: Seasonal sunshine duration for the UK, 1929 to 2016 (note winter from 1930 to 2016; year is that in which January and February fall). Light grey grid-lines represent anomalies of +/- 10%. The table provides average values (hours).
38

Wind
The windiest days of 2016 are listed in Table 3. Storms are named as part of an initiative between the Met Office and Met Eireann. The naming of storms was aimed at improving the communication of approaching severe weather through the media and government agencies by using a single authoritative system. This scheme was introduced in autumn 2015 with storms named if they had the potential to cause medium or high impacts from wind on the UK and/or Ireland. For the 2016-2017 season the naming system was adjusted to take into account other weather types, so storms could be named on the basis of impacts from wind but also include impacts of rain and snow. The change in convention means that the number of named storms from year-to-year should not be used as a climate index in its own right.
The named storms of Gertrude, Henry and Imogen in late January and early February followed the previous storms of Desmond, Eva and Frank in December 2015 which brought record-breaking rainfall and associated extensive and severe flooding during December 2015 (McCarthy et al, 2016). Gertrude and Henry each brought damaging winds to the north of the UK on 29 January and 1 to 2 February, with the far north and west experiencing the strongest gusts of 60 to 70 Kt. Storm Gertrude brought particularly strong winds across Shetland, with the Met Office issuing a Red Warning and 91 Kt (105 mph) recorded at Lerwick. The track of storm Imogen was much further south with the strongest winds of 60 to 70Kt around exposed coastlines of the south and west of the UK. Huge swell waves battered the coastline of south-west England and south Wales, reminiscent of the storms of winter 2013-2014. On 2 March, storm Jake swept south-eastward across the UK bringing strong north-westerly winds. Exposed coastlines in the west
and south saw the strongest gusts of 50 to 60 Kt or more, with 70 Kt (81 mph) at Aberdaron (Lleyn Peninsula). Storm Katie, the last named storm of the 2015-2016 season, tracked rapidly across south-west England from Cornwall to Norfolk overnight 27 to 28 March, with the highest gusts of over 60 Kt along the south coast; Needles Old Battery (Isle of Wight) recorded 92 Kt (106 mph).
The first named storm of the 2016-2017 season, Angus, brought some damaging winds to the south coast on 20 November but the main impacts from this and the next low pressure system were flooding problems associated with 3-day rainfall totals from these two systems of over 100mm in some parts of East Devon, Somerset and south Wales. After this the autumn was fairly quiet until the arrival of storms Barbara and Conor in the run-up to, and over, the Christmas period. Barbara and Conor were both fairy typical deep Atlantic low pressure systems tracking to the north of the UK bringing the strongest winds of 60 to 70 Kt across the Western and Northern Isles. Overall there were eight named storms in 2016, five from January to March and a further three in November and December (Table 4).
While these storms of 2016 brought significant impacts and disruption to the UK, individually they would not be considered exceptional for the UK at this time of year. The latitude of the UK close to the Atlantic storm track means that it would be unusual for a year to pass without such storms being experienced, although the number and intensity will vary on a year-by-year basis. A number of severe windy spells or individual storms have occurred in the last few years, notably the storms from December 2013 to February 2014 and from December 2011 to January 2012.
39

Date England (104) Wales (15) Scotland (35) N Ireland (11) Total Named storm
07-Jan-2016 9 1 3 13
26-Jan-2016 12 8 12 4 36
29-Jan-2016 19 10 34 9 72 Gertrude
30-Jan-2016 1 1 15 1 18
01-Feb-2016 26 6 32 7 71 Henry
02-Feb-2016 7 2 23 2 34 Henry
06-Feb-2016 15 2 2 19
07-Feb-2016 20 7 5 32 Imogen
08-Feb-2016 27 9 36 Imogen
16-Feb-2016 1 12 13
02-Mar-2016 14 8 1 23 Jake
09-Mar-2016 11 3 14
26-Mar-2016 9 3 5 1 18
27-Mar-2016 6 2 13 21 Katie
28-Mar-2016 35 35 Katie
07-Aug-2016 1 1 8 10
17-Nov-2016 8 5 13
23-Dec-2016 8 7 21 3 39 Barbara
24-Dec-2016 2 2 15 19 Barbara
25-Dec-2016 2 3 17 1 23 Conor
26-Dec-2016 3 1 22 1 27 Conor
40
Table 3: The windiest days of year 2016. The table lists dates where 10 or more stations across the UK recorded a maximum wind gust greater than or equal to 50 Knots on that day*. The table also gives a count of affected stations by country. The number of wind observing sites in 2016 for each country (based on data availability) is also given in brackets.
* Last year’s report listed dates with 20 or more stations.

40
60
80
100
120
Num
ber o
f day
s
40 Kt
50 Kt
60 Kt
0
20
1965
1970
1975
1980
1985
1990
1995
2000
2005
2010
2015
Year
Figure 35: Count of the number of individual days each year during which a max gust speed >= 40, 50 and 60 Kt has been recorded by at least 20 or more UK stations, from 1969 to 2016. Stations above 500 metres above sea level are excluded.
Name Date of impact on UK and/or Ireland
Gertrude 29 January
Henry 1 to 2 February
Imogen 7 to 8 February
Jake 2 March
Katie 27 to 28 March
Angus 20 November
Barbara 23 to 24 December
Conor 25 to 26 December
41
Table 4: UK Named storms of 2016. Storm Angus was named on the basis of impacts from rain, rather than wind. The last storms of the 2016-2017 season, Doris and Ewan, each arrived in late February 2017 (Ewan mainly affecting Ireland).
As a measure of storminess figure 35 counts the number of dates each year on which at least 20 stations recorded gusts exceeding 40 / 50 / 60 Kt. Most winter storms have widespread effects, so this metric will be relatively insensitive to minor variations in the wind network size which exceeds 150 sites, and will reasonably capture fairly widespread strong wind events. There are no compelling trends in max gust speeds recorded by the UK wind network in the last 4 decades, particularly bearing in mind the year-to-year and decadal variations and relatively short length of this time series.
2016 was a fairly typical year compared to the most recent decade and does not stand out in terms of the 40, 50 or
60 Kt metrics. It was not as windy as 2015, and there were many windier years, particularly in the 1980s and 1990s. This earlier period also included among the most severe storms experienced in the UK in the observational records including the ‘Burns’ Day Storm’ of 25 January 1990, the ‘Boxing Day Storm’ of 26 December 1998 and the ‘Great Storm’ of 16 October 1987. None of the individual storms of 2016 compared with these for severity. Changes in instrument type, station network size, station exposure, and choice of metric used mean that interpreting trends in storminess from UK wind speed data is not straightforward and results should be treated with caution.

Sea Level
A UK sea level index (Figure 36) for the period since 1901 provides a best estimate trend of 1.4 ± 0.2 mm/yr for sea level rise, corrected for land movement (Woodworth et al, 2009). This is close to the estimate of 1.7± 0.2 mm/yr estimated for the global sea level rise suggested by the Fifth Assessment Report of Intergovernmental Panel on Climate Change (Church et al, 2013). However, UK
sea level change is not a simple linear increase, but also includes variations on annual and decadal timescales. Also, a number of large scale atmospheric and ocean processes contribute to non-uniform sea level rise around the coast of the UK. Unfortunately the uncertainties in the UK sea level index for several recent years, particularly 2011 and 2015, are large as a result of missing data.
-25
25
75
125
175
225
-175
-125
-75
1900
1910
1920
1930
1940
1950
1960
1970
1980
1990
2000
2010
2020
Year
Aver
age
UK
MSL
(mm
)
Figure 36: UK sea level index for the period since 1901 computed from sea level data from five stations (Aberdeen, North Shields, Sheerness, Newlyn and Liverpool) from Woodworth et al, 2009. The linear trend-line has a gradient of 1.4 mm/year. Error bars indicate uncertainty (one standard deviation) in values for individual years.
42

200
400
600
800
100099 percentile water level
Maximum water level
-200
0
1910
1920
1930
1940
1950
1960
1970
1980
1990
2000
2010
2020
Year
Sea
leve
l abo
ve a
vera
ge 9
9 pe
rcen
tile
(mm
)
Figure 37: Extreme sea levels at Newlyn, Cornwall (1916-2016), in mm. The blue and red time-series are annual 99 percentiles and maximum water levels respectively. Levels are relative to the long-term average for the 99 percentile. The linear trend-lines for the 99th percentile and maximum water levels have gradients of 2.0 mm/year and 2.2mm/year respectively.
Figure 37 presents a 100-year record of sea level at Newlyn, Cornwall showing time-series of the annual 99th percentile water level and annual maximum water levels, relative to the long term mean for the 99th percentile. The 99th percentile is the level which is exceeded 1 percent of the time, or for about 88 hours in any given year. Any periods of high tides and storm surges in the year are likely to be in the 88 hours above the 99th percentile. The annual maximum water level shows greater annual variability than the 99th percentile series. Consequently the 99th percentile time-series is sometimes preferred because it provides a description of change in high and low water characteristics without the greater year-to-year variability inherent in the true extremes.
The 99th percentile water level at Newlyn for year 2016 was the second-highest in this series, with year 2014 highest. In contrast, the highest maximum water level during year 2016 was unremarkable compared to recent decades but nevertheless this would be considered notably high compared to the first six decades of the series. The long term trend in 99 percentile level is 2.0mm/year for the period 1916-2016, compared to the trend of 1.8 mm/year in median sea level at Newlyn (this being slightly greater than the UK overall). The trend for the highest maximum water level is 2.2mm/year, but with greater variability in the records.
43

Extremes for year 2016
Table 5 shows the UK weather extremes for year 2016. The highest temperature of the year, 34.4 °C at Gravesend, Kent on 13 September occurred unusually late in the year, especially given the relatively high maxima already recorded during July and August: on 19 July, 33.5 °C was recorded at Brize Norton,Oxfordshire and 33.9 °C at Jersey Airport followed by 34.1 °C at Faversham, Kent on 24 August. The last time the UK’s highest temperature occurred in September was in 1954, but this was much less notable given the temperature failed to reach even 28 °C in June, July or August 1954.
The highest daily minimum temperature, 22.3 °C at Heathrow, Greater London on 20 July was unusually high; the last time a daily minimum temperature exceeded 22 °C in the UK was a decade earlier in July 2006 – during the heatwave of that year. The UK’s record daily minimum temperature is 23.9 °C at Brighton, East Sussex on 3 August 1990. 20 July 2016 saw minimum temperatures widely remaining over 20 °C across central England. At
Oxford, a daily minimum temperature of 21.2 °C was recorded, the highest daily minimum temperature at this station in digitized records of over 150 years.
The highest gust speed at a low level station, 92 Kt (106 mph) at Needles Old Battery (Isle of Wight) during Storm Katie was one of the highest gusts recorded at this station and compares with 95 Kt (109 mph) on 14 February 2014 (the last of the winter 2013-2014 storms). The record for this station is 100 Kt (115 mph) on 4 January 1998. However, Needles Old Battery, located at 86 masl on the prominent west-facing headland of the Isle of Wight is in a particularly exposed location; maximum wind gusts elsewhere along the south coast during storm Katie were more typically 60 to 70 Kt. If this station is discounted then the highest low-level station gust elsewhere in the UK was 91 Kt (105mph) at Lerwick, Shetland during storm Gertrude on 29 January.
The various other UK weather extremes in Table 5 were otherwise fairly typical for the UK.
Extreme Observation Date Station
Highest daily maximum temperature (09-09 GMT)
34.4 °C 13 Sep Gravesend, Kent 3 masl
Lowest daily minimum temperature (09-09 GMT)
-14.1 °C 14 Feb Braemar, Aberdeenshire 327 masl
Lowest daily maximum temperature (09-09 GMT)
-4.1 °C 5 Dec Cromdale, Moray 193 masl
Highest daily minimum temperature (09-09 GMT)
22.3 °C 20 Jul Heathrow, Greater London 25 masl
Lowest grass minimum temperature (09-09 GMT)
-15.1 °C 21 Nov Braemar, Aberdeenshire 327 masl
Highest daily rainfall (09-09 GMT) 125.2 mm 16 Feb Seathwaite, Cumbria 129 masl
Greatest snow depth (09 GMT) 19cm 10 Jan Leadhills, South Lanarkshire, 393 masl
Highest daily sunshine 16.7 hr 5 Jun Lerwick, Shetland 82 masl
Highest gust speed 92 Kt 106 mph 28 Mar Needles Old Battery, Isle of Wight 80 masl
Highest gust speed (mountain) 129 Kt 148 mph
1 Feb 25 Dec
Cairngorm Summit, Inverness-shire 1237 masl
44
Table 5: Annual extremes for the UK for year 2016, excluding stations above 500metres above mean sea level (masl). Stations above 500 masl are considered as mountain stations and therefore not representative of low-level areas.

Significant weather events of 2016
Flooding eastern Scotland JanuaryJanuary was a particularly wet month across eastern Scotland with more than 200% of average rainfall widely (Figure 19). This rain fell onto already saturated ground following the exceptionally wet weather in December 2015, and as a consequence extended the flooding problems here into early 2016; December 2015 and January 2016 were the wettest and second-wettest calendar months in an eastern Scotland series from 1910. Figure 38 shows winter
rainfall totals from 1911 to 2016 for the climate district of Eastern Scotland. (The location of this climate district, extending from Aberdeenshire to the English Border, is shown in Figure 1). This part of the UK also experienced a very wet winter two years earlier. The winter rainfalls total of 635mm (191% of 1981-2010 average) in winter 2016 and 587mm (177%) in winter 2014 each exceeded the next wettest winter (1915) by more than 100mm.
300
400
500
600
100
200
1911
1916
1921
1926
1931
1936
1941
1946
1951
1956
1961
1966
1971
1976
1981
1986
1991
1996
2001
2006
2011
2016
Rain
fall
(mm
)
Year (that which contains January and February)
Figure 38: Time series of winter rainfall totals for the district of Eastern Scotland from winter 1911 (December 1910 to February 1911) to winter 2016 (December 2015 to January 2016) based on monthly gridded data. The pink line is the 1981-2010 average, and the hatched black line a smoothed trend line.
Figure 39: Analysis chart for 12 GMT 3 January 2016
45

The first week of January was particularly wet across eastern Scotland, with low pressure centred to the south of the UK and weather systems bringing heavy rain with significant orographic enhancement across the high ground in a south-easterly flow, effectively reversing the more typical west-east rain-shadow effect. The analysis chart for 3 January 2016 is a good example of this effect (Figure 39) with the occluded front draped across northern Scotland bringing persistent heavy rainfall. This resulted in totals for the first week of January of 150 to 200mm across much of the high ground of eastern Scotland and several rain-gauges approaching 300mm (Figure 40a). Both in this area and parts of the Cheviot Hills in Northumberland these rainfall totals represented two to nearly three times
the January long-term average for the first seven days of January 2016 alone (Figure 40b). Note the striking contrast in totals across the Cairngorm Mountains with 296% of the January average falling at Aboyne, Aberdeenshire, compared to 15% at Aviemore, Inverness-shire.
Widespread flooding occurred across eastern Scotland, with heavy erosion to the banks of the River Dee. There were transport problems with road and rail closures; Blair Atholl, Perthshire, was cut off for a time. This was the latest in a series of recent flood events which have affected eastern Scotland, other examples including Alyth, Perthshire in July 2015 and ex-hurricane Bertha affecting the Cairngorms area in August 2014.
Figure 40: Daily rainfall totals (mm) across Eastern Scotland for 1 to 7 January 2016 (a) in mm and (b) as a % of 1981-2010 average. Stations which do not have sufficient record-lengths for a 1981-2010 station average value to be calculated have not been plotted in figure b.
46

September hot spell The UK experienced a spell of hot weather in early September 2016 associated with a southerly flow of warm, humid air from France and Spain, often described as a ‘Spanish Plume’. The highest temperatures during this spell were generally confined to central and eastern England with 30 °C reached across the Midlands, East Anglia and south-east England. On 13 September, temperatures exceeded 30 °C fairly widely in these areas (Figure 41), with 34.4 °C at Gravesend, Kent being not only the UK’s highest temperature of 2016 but also the highest September temperature since 1911 (when 34.5 °C was recorded at Raunds, Northamptonshire on the 8th). It is not particularly unusual for temperatures to reach 30 °C in September in the UK, with this last happening in 2013. However, it is much more unusual for temperatures to exceed 32 °C with this last happening in the Septembers of 1949, 1929, 1926, 1919, 1911 and 1906 – the 60+ year gap from 1949 to 2016 meaning that such a hot spell was arguably overdue.
This September hot spell set new September maximum temperature records at a number of long-running weather stations across central and eastern England (Table 6). The most significant September hot spell in observational records was 1 to 2 September 1906,
when temperatures exceeded 32 °C as far apart as Cheltenham (Gloucestershire), Macclesfield (Cheshire), Cromer (Norfolk), Oxford and Gordon Castle (Moray) with 35.6 °C at Bawtry, South Yorkshire on the 2nd being the UK record; the 1906 hot spell also set the Scotland record of 32.2 °C at Gordon Castle and the Northern Ireland record of 27.8 °C at Armagh.
Daily minimum temperatures were also very high and exceeded 18 °C widely across England on both 7 and 14 September, several long-running stations also set their highest daily minimum temperature records (Table 7). (Note that the duration of the observing period is important for such records and 21-09GMT night-time minimum temperatures are not equivalent to 09-09 GMT minimum values if the temperature is lower during the preceding day). On 14 September, Manston, Kent recorded a daily minimum of 20.7 °C; not far short of the UK record of 21.7 °C on 5 September 1949 and also the first time a September daily minimum temperature exceeded 20 °C since that date. For the UK overall, this was the equal-second warmest September in a series from 1910, with 1949, and only September 2016 warmer.
Figure 41: Daily maximum temperatures on 13 September 2016
47

Station Date Max Temp Previous Value Previous Date Record length / comment
Durham 13 27.3 30.0 01-Sep-1906 Highest for 110 years
Rothamsted, Hertfordshire 13 31.0 29.4 05-Sep-1949 102
Woburn, Bedfordshire 13 30.7 29.4 05-Sep-1949 101
Cambridge Botanic Garden 13 32.4 31.1 05-Sep-1949 98
East Malling, Kent 13 31.3 31.1 04-Sep-1929 89
Wisley, Surrey 13 30.3 31.1 04-Sep-1929 Highest for 87 years
Sutton Bonington, Nottinghamshire 13 29.6 29.4 19-Sep-1926 85
Writtle, Essex 13 32.1 30.6 05-Sep-1949 83
Goudhurst, Kent 13 30.2 30.0 05-Sep-1949 77
Station Date Min Temp Previous Value Previous Date Record length / comment
Durham 7 17.2 17.2 05-Sep-1949 Equal-highest in 135 year record
Sheffield 7 18.0 18.2 08-Sep-1898 Highest for 118 years
Armagh 6 18.0 18.3 06-Sep-1898 Highest for 118 years
Bradford, West Yorkshire 7 17.7 16.8 06-Sep-2006 107
Valley, Anglesey 7 16.9 16.7 10-Sep-1981 85
Hastings, East Sussex 14 20.0 18.9 05-Sep-1949 83
Morecambe, Lancashire 13 18.7 17.9 29-Sep-2011 82
Cromer, Norfolk 7 19.5 18.9 12-Sep-1969 78
Cranwell, Lincolnshire 7 16.9 17.2 03-Sep-1939 Highest for 77 years
Douglas, Isle of Man 15 16.0 16.1 05-Sep-1941 Highest for 75 years
Many in eastern England enjoyed unseasonably hot weather on the UK's beaches. However spells of this type frequently end in a thundery break-down associated with a release of energy from the hot, humid air, and this spell was no exception. Overnight 13 to 14 September flash flooding affected parts of west Cornwall and severe thunderstorms also affected the south Pennines (see cover image). In the early morning of 16 September there were further torrential downpours across southern England causing
travel disruption to roads and railways, multiple lightning strikes and localised flash-flooding, with 55.8mm recorded in one hour to 0400 GMT at West Ilsley (Berkshire) and several other rain gauges in Oxfordshire, Dorset and Essex also recorded over 30mm in 1 hour. While these thunderstorms caused significant local impacts, the UK has experienced much more severe thunderstorms in the recent past in terms of extent and severity, perhaps most notably the widespread and severe thunderstorms of 28 June 2012.
48
Table 6: Long-running stations which set a new September daily maximum temperature record, or recorded their highest such September value for 75+ years.
Table 7: Long-running stations which set a new September daily minimum temperature record, or recorded their highest such September value for 75+ years.

Correction to 2015 report
p32 Sentence describing trends in heavy rainfall:
“2015 is unremarkable in the 99th percentile series, but there were 26 days exceeding the 95th percentile (12 of which were in November and December) making this among the top eight years in this series; six of these top eight years having occurred since 2002...”
These statistics were based on provisional daily rainfall grids for November and December 2015. The updated sentence, based on final daily rainfall grids for these months, should read:
“2015 is unremarkable in the 99th percentile series but there were 25 days exceeding the 95th percentile (11 of which were in November and December) making this among the top 11 years in this series; five of the top seven years having occurred since 2002...”
p37 Sentence describing trends in seasonal sunshine:
“This trend is apparent across all countries but is most prominent during the winter and spring, where the most recent decade is 14% and 12% higher than 1961-1990 respectively.”
should read:
“This trend is apparent across all countries but is most prominent during the winter and spring, where the most recent decade is 12% and 14% higher than 1961-1990 respectively.”
P17 Heating Degree Days
A minor data error has resulted in a correction to the HDD values for 2015, these values have been adjusted down but by less than 1%. A very slight corresponding adjustment has been made to the 2006-2015 averages.
Area 1961-1990 average 1981-2010 average 2006-2015 average 2015
UK 2731 2566 2476 (2477) 2430 (2445)
England 2514 2333 2229 (2231) 2124 (2140)
Wales 2609 2446 2366 (2368) 2304 (2320)
Scotland 3140 3000 2924 (2926) 2961 (2976)
Northern Ireland 2646 2491 2424 (2426) 2487 (2503)
49
Table 8: Corrections to heating degree days (HDD) for 2015. Previous incorrect published values in brackets.

Annex 1: Datasets
Monthly gridsThe principal sources of data in this report are monthly gridded datasets at 5 km resolution covering the UK (Perry and Hollis, 2005b). The grids are based on the GB national grid, extended to cover Northern Ireland
and the Isle of Man, but excluding the Channel Islands. Table A1.1 shows the gridded data used for this report, including the year from which variables are available.
Climate Variable Definition First year available Gridding time-scale
Max air temperature Average of daily max air temperatures °C 1910 Monthly
Min air temperature Average of daily min air temperatures °C 1910 Monthly
Mean air temperature Average of mean daily max and mean daily min air temperatures °C
1910 Monthly
Days of air frost Count of days when the air min temperature is below 0 °C
1961 Monthly
Days of ground frost Count of days when the grass min air temperature is below 0 °C
1961 Monthly
Heating degree days Day by day sum of number of degrees by which the mean temperature is less than 15.5 °C
1961 Annual
Cooling degree days Day by day sum of number of degrees by which the mean temperature is more than 22 °C
1961 Annual
Growing degree days Day by day sum of number of degrees by which the mean temperature is more than 5.5 °C
1961 Annual
Precipitation Total monthly precipitation amount (mm) 1910 Monthly
Days of rain >= 1mm Number of days with >= 1mm precipitation 1961 Monthly
Days of rain >= 10mm Number of days with >= 10mm precipitation 1961 Monthly
Rainfall intensity^ Total precipitation on days with >= 1mm divided by the count of days with >= 1mm during the year
1961 Annual
Sunshine Total hours of bright sunshine during the month based on the Campbell-Stokes recorder
1929 Monthly
^Annual rainfall intensity grids have been derived from 5km daily precipitation grids which are generated separately to monthly precipitation.
Climate Variable Before 1961 1961 onwards
Air temperature (max, min, mean)
320 550
Days of ground frost n/a 420
Precipitation 650 4400
Days of rain >= 1mm, >= 10mm
n/a 4000
Sunshine 270 300
The Met Office Integrated Data Archive System Land and Marine Surface Stations (MIDAS) Database is the source of UK station data for this gridded dataset. The network size for each variable changes each month and the gridding process is designed to remove the impact of these changes on climate monitoring statistics. Table A1.2 summarizes the approximate number of stations which have been used for each of the variables for gridding. Figure A1.1 shows the 2016 UK station network for the variables presented in this report.
50
Table A1.1: List of variables presented in this report, gridded over the UK at 5km resolution
Table A1.2: Typical number of stations used to create the gridded datasets

A key aim of the gridding process is to remove the effects of the constantly varying pool of stations. This could be overcome by only using stations with a complete record, but the sparseness of such stations would introduce much greater uncertainty due to the spatial interpolation required. Instead, all stations believed to have a good record in any month are used, and every effort made to compensate for missing stations during the gridding process reducing uncertainty by maximising the number of observations used. A description of the gridding process is also given in Jenkins et al, (2008) and Prior and Perry (2014).
Figure A1.1: State of the UK observing network in 2016. The number of observations may vary on a daily basis due to data availability. The number of stations has reduced since the 1970s, partly because of station closures and partly because of delayed data yet to be received. The number of snow depth observations is typically much lower than that shown on the map – typically approximately 120 - because currently observers often do not record zero snow depths. This map shows all 184 stations which have returned at least one snow depth observation at 0900GMT during year 2016.
51

Long term average gridsAreal-averages for the WMO standard 30-year climatological reference periods 1961-1990 and 1981-2010 presented in this report have been calculated from long-term average monthly gridded datasets at 1km resolution covering the UK (Perry and Hollis, 2005a). The process for producing these grids is outlined as follows: For the majority of variables, long-term averages for each station are calculated from monthly station data. Gaps in the monthly station data are filled with estimates obtained via regression relationships with a number of well-correlated neighbours, and long-term averages are then calculated for each site. Gridded datasets of long-term averages are created by regression against latitude, longitude, elevation, terrain shape, proximity to coast and urban extent, followed by inverse-distance weighted interpolation of residuals from the regressions. The estimation of missing values allows a dense network of stations to be used, and this along with the range of independent variables used in the regression, allows detailed and accurate long-term average datasets to be produced. These are then used to constrain the gridded analyses for individual years, seasons, months and days via the geographical interpolation of deviations from, or ratios of, the long-term average.
However, this method does not work well for a number of variables, including days of air frost and ground frost, and an
alternative approach is used. Firstly, a 1 km resolution grid of values for each month is calculated from the available station data. Secondly, the gridded long-term average datasets are then obtained by averaging the monthly grids.
Because the long-term averages are calculated from 1km grids separately to the monthly 5km grids, the long-term averages are not exactly consistent with the monthly analyses. There are a number of reasons for this: for most variables the order of the calculation varies i.e. ‘average-then-grid’ versus ‘grid-then-average’; the station network will be very much denser for the long-term average grids than the monthly grids; the grid resolution is 1km rather than 5km.
Table A1.3 compares 1981-2010 long-term average annual mean temperature and rainfall as derived from 1km long-term average, and 5km monthly grids. For temperature, the difference of 0.04 °C for the UK overall is less than 10% of the difference between 1961-1990 and 1981-2010 1km long-term averages. For rainfall, the difference of 2.5% is around half the difference between the 1961-1990 and 1981-2010 1km long-term averages. For both temperature and rainfall, the difference is greatest in Scotland, which contains the largest area of mountain topography in the UK and where the 1km resolution long-term average grid is likely to provide a greater level of detail.
Area Temperature 5km Temperature 1km Difference (degC) Rainfall 5km Rainfall 1km Difference (%)
UK 8.88 8.84 0.04 1126 1154 2.5
England 9.68 9.65 0.03 842 855 1.5
Wales 9.18 9.14 0.03 1414 1460 3.2
Scotland 7.47 7.40 0.07 1517 1571 3.6
Northern Ireland 8.92 8.91 0.01 1136 1136 0.0
52
Table A1.3: Comparison of 1981-2010 long-term average annual mean temperature and rainfall as derived from 1km long-term average grids

Daily Grids and Degree DaysDaily Tmax, Tmin and Tmean grids of the UK at 5km resolution from 1960 have been generated using a similar method to that for the monthly grids (Perry et al, 2009). However, with daily data there is often a weaker link between the data and the geographical factors which shape the average over a longer time-scale.
Degree day datasets were generated from the daily temperature grids using formulae for calculating degree days above a threshold given in Table A1.4. The daily mean temperature Tmean is calculated from the daily maximum temperature Tmax and the daily minimum temperature Tmin as (Tmax + Tmin)/2. The degree day value is estimated differently depending on which of Tmin, Tmean or Tmax are below (for HDD) or above (for CDD and GDD) the defined degree day threshold.
Temperature Day value (above threshold)
Tmax ≤ Tthreshold 0
Tmin ≥ Tthreshold Tmean − Tthreshold
Tmean ≥ Tthreshold & Tmin < Tthreshold 0.5 (Tmax − Tthreshold) − 0.25 (Tthreshold − Tmin)
Tmean < Tthreshold & Tmax > Tthreshold 0.25 (Tmax − Tthreshold)
Central England TemperatureThe Central England Temperature (CET) monthly series, beginning in 1659, is the longest continuous temperature record in the world (Manley, 1974). It comprises the mean of three observing stations covering a roughly triangular area of England from Bristol to London to Lancashire; the current stations used for this series are Pershore College (Worcestershire), Rothamsted (Hertfordshire) and Stonyhurst (Lancashire) although the stations used
in this series have changed in the past. A CET daily series is also available from 1772 (Parker et al, 1992).
Following each station change the data are adjusted to ensure consistency with the historical series, and since 1960 the data have been adjusted to allow for any effects of warming due to the expansion of local built up areas. Work by Parker and Horton, 2005 and Parker, 2010 have investigated uncertainties in the CET series.
Sea Surface Temperature dataThe Met Office Hadley Centre's sea ice and sea surface temperature (SST) data set, HadISST1 is a global dataset of monthly sea-surface temperature and sea ice concentration on a 1 degree latitude-longitude grid from 1870 to date (Rayner et al, 2003). The dataset is derived from a combination of fixed and drifting buoys,
ship bucket and engine room intake thermometers and hull sensors; and satellite data. The UK near-coast sea-surface temperature series in this report comprises the average of all 1 degree latitude-longitude grid points adjacent to the coast of Great Britain (approximately 50 grid points).
53
Table A1.4: Formulae used for calculating cooling or growing degree days above thresholds of 22 ˚C and 5.5 ˚C, equivalent formulae used for heating degree days below a threshold of 15 oC.

England and Wales Precipitation seriesThe England and Wales precipitation series (EWP) has monthly data back to 1766, and is the longest instrumental series of this kind in the world. The daily EWP series begins in 1931. The series incorporates a selection of long-running rainfall stations to provide a homogeneity-adjusted series of areal averaged precipitation. EWP totals are based on daily weighted totals from a network of stations within each of five England and Wales regions.
The extent to which seasonal trends apparent in the EWP series are influenced by homogeneity issues (for example: the number of stations used historically to compile the EWP series, how well the network has historically captured orographically enhanced rainfall across high ground; how well the network has historically captured precipitation which has fallen as snow) remains an area of investigation. Various papers detail the development of the EWP series (Wigley, 1984, Alexander and Jones, 2001, Simpson and Jones, 2012).
Raingauge and snow depth dataDaily rainfall data presented in this report are from 0900-0900 GMT totals from either daily or tipping-bucket rain-gauges registered with the Met Office. The rain-gauge network has diminished from over 4000 rain-gauges across the UK in the 1960s to approximately 3000 in the 2010s. The gauges are owned and maintained by several organizations: the Met Office, the Environment Agency, Natural Resources Wales, SEPA and Northern Ireland Water. The spatial distribution of the network has changed with time but nevertheless the high
network density ensures that all but the most localized convective events are captured at a daily time-scale.
Snow depth data are recorded at 0900 GMT. These are either spot observations from automatic snow depth sensors or manual observations of representative level depth in a location free from drifting or scour by wind; ideally the average of three measurements would be recorded. The network comprised over 400 stations from 1960 to 2000 but (based on data availability) typically around 120 stations from 2013 to 2016.
Sunshine dataThe UK’s sunshine network in 2016 comprises two instrument types. In 2016, around half the network comprised Campbell-Stokes (CS) sunshine recorders which are read manually; the other half comprising Kipp & Zonen CSD-1 (KZ) automatic sunshine recorders. An upward
adjustment of KZ totals is made to give a monthly ‘CS equivalent sunshine’. This ensures that the full sunshine network (automatic and manual) is used while maintaining consistency between the two instrument types. Legg, 2014a and references therein provide further details.
Sea level dataSea level changes around the British Isles are monitored by the UK national network of tide gauges. For more than 100 years tide gauges provide measurements of sea level change relative to the Earth's crust. However, tide gauges are attached to the land, which can move vertically thus creating an apparent sea level change. A UK sea level index for the period since 1901 computed from sea level data from five stations (Aberdeen, North Shields, Sheerness, Newlyn and Liverpool) provides the best estimate for UK sea level rise, corrected for land movement (Woodworth
et al, 2009, Bradley et al, 2011). The 2016 Annual Report for the UK National Tide Gauge Network is available at https://www.bodc.ac.uk/data/online_delivery/ntslf/reports/documents/2016annualreport.pdf
Newlyn, Cornwall has a century of hourly (or, since 1993, 15 minute) sea level data from float and pressure tide gauges that have been maintained better than most around the UK. It also has a more open ocean location than stations around North or Irish Sea coasts (Araujo and Pugh, 2008).
54
Annex 2: Time-series, trends and uncertainty
Time-series and trends shown in this reportThe time-series in this report are plotted on either actual or anomaly scales. The plots with anomaly scales often show several different areas, seasons or variables which are offset for clarity and ease of comparison; the offsets do not reflect absolute differences between the time-series.
The time-series shown throughout are plotted showing the annual series and a smooth trend. This means that both annual variability and longer term trends (removing this short-term variability) can be viewed simultaneously. Importantly, we note that for some series there may be few individual years that fall close to this long-term trend; and many or even most years may fall well above or well below. Most time-series plots also include the 1981-2010 and 1961-1990 long-term averages.
The smooth trend-lines are constructed using a weighted kernel filter of triangular shape, with 14 terms either side of each target point. The kernel defines how much weighting the terms either side of a point in the series have in estimating the smoothed average at that point, in this case the triangular shape using 14 data points either side means that data points further away have less influence. The effect is to smooth out the year-to-year variations and estimate any longer term variations in the data. At the ends of the time series, only the 14 points to one side of the target point are used, increasing to the full 29 year bandwidth by the 15th point from each end.
Similar smoothing filters were used for the earlier trend reports (Jenkins et al 2008, Prior and Perry 2014).
A table of summary statistics is provided below each time-series plot. This shows 1961-1990 averages, 1981-2010 averages, 2007-2016 averages (for the latest decade) and year 2016. While 2007-2016 is a non-standard reference period it provides a 10-year ‘snapshot’ of the most recent decade of observational data, since in a non-stationary climate 1981-2010 averages may already be partially out of date. Differences between the 2007-2016 averaging period and the baseline reference average can reflect both long term trend in the data or shorter term decadal variations. These data are presented to show what has happened in recent years not necessarily what is expected to happen in a changing climate.
Importantly we note that the 1961-1990 and 1981-2010 averages presented are based on 1km resolution gridded data and these are not exactly consistent with the average of the yearly data through the same period (see previous discussion on long term averages), although in practice any differences are small. Annex 1 Table A1.3 provides further details. We use the 1km resolution 1961-1990 and 1981-2010 averages because these datasets contain the greatest level of detail and most comprehensive set of stations, and thus represent our best estimate of these climatologies.
Uncertainty estimatesRecent studies have considered uncertainties in the gridded data and areal-averages (Legg 2011, Legg 2014b). These have principally focussed on uncertainty associated with the density of the observing station network which is the dominant source of uncertainty, but they have been adjusted upward to acknowledge other sources of error, for example observational errors such as random errors in instrument readings, calibration errors or structural uncertainty (the latter implying that alternative methods of analysis may produce slightly different results). Legg, 2014b published uncertainty ranges for areal-averages of monthly mean temperature, rainfall and sunshine; these increase in the past as the network density reduces.
Table A2.1 lists 1σ uncertainty ranges for annual mean temperature, rainfall and sunshine for different periods in the gridded dataset. Indicative date periods are presented here, but more comprehensive tables can be found in Legg et al. (2014b). We have applied a conservative reduction factor of √2 to convert monthly uncertainty ranges to annual. Uncertainty associated with individual months of the year cannot be considered independent but it is reasonable to assume that winter half-year biases are likely to be different in nature from summer half-year biases (Parker, 2010). Uncertainties in the CET and EWP series have also been investigated elsewhere (Parker and Horton, 2005, Parker 2010, Simpson and Jones, 2012).
55

Temperature (°C)
Year range UK England Wales Scotland Northern Ireland
1910-1919 0.04 0.04 0.06 0.06 0.08
1961-1965 0.03 0.03 0.04 0.03 0.04
2006-2012 0.03 0.03 0.04 0.04 0.04
Rainfall (%)
Year range UK England Wales Scotland Northern Ireland
1910-1919 1.2 1.2 3.0 2.8 3.7
1961-1965 0.3 0.3 0.6 0.5 0.8
2006-2012 0.4 0.4 0.9 0.7 1.6
Sunshine (%)
Year range UK England Wales Scotland Northern Ireland
1929-1935 0.7 0.8 1.0 1.0 1.6
1959-1964 0.6 0.8 0.9 0.8 1.4
0.7 0.9 1.1 1.1 1.8
The summary rainfall statistics for the UK and countries presented in this report are based on an estimate of the total volume of rainfall across the country, rather than an areal-average of the rainfall anomaly field. This means that the climatologically wetter parts of the UK have a greater influence on the overall UK summary statistic than the lowest areas, rather than all equal-sized areas having equal influence. This introduces uncertainty because the rank of each year relative to the others may vary depending on which of these two metrics is chosen. A recent study has investigated the different choice of metrics on monthly rainfall data in the UK series (Kendon and Hollis, 2014).
A further source of uncertainty in the rainfall data is introduced by measurement of precipitation which has fallen as snow. At manually read rain gauges the observer will measure precipitation equivalent of fresh snow fallen at 0900 GMT, whereas at automatic rain gauges any snow collected will be recorded when it subsequently melts; quality control of these data may then re-apportion this precipitation to previous days. However, inevitably snow measurement can be problematic, for example if wind eddies may carry snow over or blow it into or out of the gauge, in many situations estimation of precipitation from snow may be underestimated.
Coefficient of determinationThe coefficient of determination, R2, is the square of the correlation coefficient, r, between an independent and a dependent variable based on linear least-squares regression. The R2 value is a statistical measure of how closely the dependent variable can be predicted from the independent variable. An R2 value of 1 would indicate a perfect correlation, in which the dependent variable can be
predicted without error from the independent variable. An R2 value of 0 would mean the dependent variable cannot be predicted from the independent variable. An R2 value of 0.5 would mean that 50 percent of the variance in the dependent variable is predictable from the independent variable. For example, in this report R2 values which exceed 0.9 would indicate time-series are very highly correlated.
56
Table A2.1: 1σ Uncertainty ranges for annual Tmean, rainfall and sunshine.

Annex 3: Useful resources
Acknowledgements
Met Office:
UK climate information http://www.metoffice.gov.uk/climate
Annual State of the UK climate publications from 2014 http://www.metoffice.gov.uk/climate/uk/about/state-of-climate
The CET dataset is maintained by the Met Office Hadley Centre and can be downloaded at http://www.metoffice.gov.uk/hadobs/hadcet/
The EWP dataset is maintained by the Met Office Hadley Centre and can be downloaded at http://www.metoffice.gov.uk/hadobs/hadukp/
The HadISST1 dataset is maintained by the Met Office Hadley Centre and can be downloaded at http://www.metoffice.gov.uk/hadobs/hadisst/
The 5km monthly, annual, and daily temperature datasets used in this report may be downloaded at http://www.metoffice.gov.uk/climatechange/science/monitoring/ukcp09/ Data from the most recent years may be available on request by contacting the Met Office National Climate Information Centre [email protected]
Further information about the daily gridded precipitation data may be obtained by contacting the Met Office Customer Centre http://www.metoffice.gov.uk/about-us/contact
Met Office UK Storm Centre Name our Storms project http://www.metoffice.gov.uk/uk-storm-centre
External links:
The Met Office is not responsible for the content of external internet sites
Access to a copy of the Met Office Midas database is available to researchers on registration at http://catalogue.ceda.ac.uk/uuid/220a65615218d5c9cc9e4785a3234bd0
Bulletin of the American Meteorological Society (BAMS) state of the Climate Report https://www.ncdc.noaa.gov/bams
Annual Bulletin on the Climate in region VI Europe and Middle East http://www.dwd.de/ravi (website in German)
Centre for Ecology and Hydrology, National Hydrological Monitoring Programme, Monthly Hydrological Summaries for the UK http://nrfa.ceh.ac.uk/monthly-hydrological-summary-uk
Environment Agency Water Situation Reports for England https://www.gov.uk/government/collections/water-situation-reports-for-england
National Tidal and Sea Level Facility UK National Tide Gauge Network (owned and operated by the Environment Agency) http://www.ntslf.org/data/uk-network-real-time
Natural Resources Wales Water Situation Reports for Wales https://naturalresources.wales/guidance-and-advice/environmental-topics/water-management-and-quality/resources/water-situation-report/?lang=en
Scottish Avalanche Information Service annual reports of the winter season http://www.sais.gov.uk/sais-annual-reports/
Thanks to John Kennedy (Met Office) for providing UK near-coast SST data.
57
References
Alexander, L.V. and Jones, P.D. 2001. Updated precipitation series for the U.K. and discussion of recent extremes, Atmospheric Science Letters doi:10.1006/asle.2001.0025
Araujo, I.B. and Pugh, D.T, 2008. Sea levels at Newlyn 1915-2005: analysis of trends for future flooding risks, Journal of Coastal Research, 44, 203-212 doi:10.2112/06-0785.1
Bleasdale A. 1969. The year 1968: an outstanding one for multiple events with exceptionally heavy and widespread rainfall, British Rainfall, 1968
Bradley, S., Milne, G., Shennan, I., Edwards, R.J., 2011. An improved glacial isostatic adjustment model for the British Isles, Journal of Quaternary Science, 26, (5), p541 – 552, doi:10.1111/j.1365-246X.2008.04033.x
Burt S and Kendon M. 2016. December 2015 – an exceptionally mild month in the United Kingdom. Weather, 71: 314–320. doi:10.1002/wea.2800
McCarthy M, Spillane S, Walsh S. and Kendon M. 2016. The meteorology of the exceptional winter of 2015/2016 across the UK and Ireland. Weather, 71: 305–313. doi:10.1002/wea.2823
Church, J.A., P.U. Clark, A. Cazenave, J.M. Gregory, S. Jevrejeva, A. Levermann, M.A. Merrifield, G.A. Milne, R.S. Nerem, P.D. Nunn, A.J. Payne, W.T. Pfeffer, D. Stammer and A.S. Unnikrishnan, 2013: Sea Level Change. In: Climate Change 2013. The Physical Science Basis. Contribution of Working Group I to the Fifth Assessment Report of the Intergovernmental Panel on Climate Change [Stocker, T.F., D. Qin, G.-K. Plattner, M. Tignor, S.K. Allen, J. Boschung, A. Nauels, Y. Xia, V. Bex and P.M. Midgley (eds.)]. Cambridge University Press, Cambridge, United Kingdom and New York, NY, USA
Jenkins GJ, Perry MC, Prior MJ. 2008. The Climate of the United Kingdom and Recent Trends. Met Office: Exeter, UK
Kendon, M. and Hollis, D. 2014, How are UK rainfall-anomaly statistics calculated and does it matter? Weather, 69: 37–39. doi: 10.1002/wea.2249
Kendon, M., McCarthy, M., and S. Jevrejeva 2016: State of the UK Climate 2015, Met Office, Exeter, UK
Legg TP. 2011. Determining the accuracy of gridded climate data and how this varies with observing-network density. Adv. Sci. Res. 6: 195–198, doi: 10.5194/asr-6-195-2011.
Legg T P. 2014a. Comparison of daily sunshine duration recorded by Campbell-Stokes and Kipp and Zonen sensors. Weather 69: 264-267 doi:10.1002/wea.2288
Legg T P. 2014b. Uncertainties in gridded area-average monthly temperature, precipitation and sunshine for the United Kingdom. Int. J. Climatol. doi:10.1002/joc.4062
Manley G. 1974. Central England temperatures: monthly means 1659 to 1973. Q. J. Roy. Meteorol. Soc. 100: 389–405, doi:10.1002/qj.49710042511
Marsh T, Cole G, Wilby R. 2007. Major droughts in England and Wales, 1800-2006. Weather 62: 87-93. doi:10.1002/wea.67
McCarthy M, Spillane S, Walsh S. and Kendon M. 2016. The meteorology of the exceptional winter of 2015/2016 across the UK and Ireland. Weather, 71: 305–313. doi:10.1002/wea.2823
58

Parker DE, Legg TP, Folland CK. 1992. A new daily central England temperature series, 1772–1991. Int. J. Climatol. 12: 317–342, doi:10.1002/joc.3370120402
Parker, D.E. and Horton, E.B. 2005. Uncertainties in the Central England Temperature series since 1878 and some changes to the maximum and minimum series. International J.Climatology, Vol 25, pp 1173-1188 doi:10.1002/joc.1190
Parker, D. E. 2010. Uncertainties in early Central England temperatures. Int. J. Climatol., 30: 1105–1113. doi:10.1002/joc.1967
Perry, M. and Hollis, D. 2005a. The development of a new set of long-term climate averages for the UK. Int. J. Climatol., 25: 1023–1039. doi:10.1002/joc.1160
Perry, M. and Hollis, D. 2005b. The generation of monthly gridded datasets for a range of climatic variables over the UK. Int. J. Climatol., 25: 1041-1054. doi:10.1002/joc.1161
Perry MC, Hollis DM, Elms MI. 2009. The generation of daily gridded data sets of temperature and rainfall for the UK, NCIC Climate Memorandum No. 24 . Met Office: Exeter, UK.
Prior J. and Perry MC. 2014. Analyses of trends in air temperature in the United Kingdom using gridded data series from 1910 to 2011. Int. J. Climatol. doi:10.1002/joc.3944
Rayner, N. A.; Parker, D. E.; Horton, E. B.; Folland, C. K.; Alexander, L. V.; Rowell, D. P.; Kent, E. C.; Kaplan, A. 2003. Global analyses of sea surface temperature, sea ice, and night marine air temperature since the late nineteenth century J. Geophys. Res.Vol. 108, No. D14, 4407 10.1029/2002JD002670
Simpson IR, Jones PD. 2012. Updated precipitation series for the UK derived from Met Office gridded data. Int. J. Climatol. 32: 2271–2282, doi:10.1002/joc.3397.
Wigley, T. M. L., Lough, J. M. and Jones, P. D. 1984. Spatial patterns of precipitation in England and Wales and a revised, homogeneous England and Wales precipitation series. J. Climatol., 4: 1–25. doi:10.1002/joc.3370040102
Woodworth, P.L., F.N. Teferle, R.M. Bingley, I. Shennan and S.D.P. Williams, 2009. Trends in UK Mean Sea Level Revisited, Geophys. J. Int. 176, 19–30, doi:10.1111/j.1365-246X.2008.03942.x.
59

Produced by the Met Office. Met Office and the Met Office logo are registered trademarks. © Crown copyright 2017 00254
To find out more,
+44 1392 885680
www.metoffice.gov.uk