state of the coral triangle: malaysia - asian development bank · state of the coral triangle:...
TRANSCRIPT
State of the Coral Triangle: Malaysia
Malaysia has made a firm commitment to sustainable management and conservation of its coastal and marine resources, helping formulate and implement the Sulu–Sulawesi Marine Ecoregion Initiative and the Coral Triangle Initiative. Rapid economic growth, uncontrolled tourism development, unregulated fishing, and unsustainable use of marine resources have depleted the country’s fish stocks, lost nearly 36% of its mangrove forests, and increased the number of endangered species. Despite impressive national economic gains, Malaysia’s fishers remain poor. This report assesses Malaysia’s coastal ecosystems and summarizes the country’s plans in (i) rehabilitating marine protected areas, (ii) protecting threatened and endangered species, (iii) adapting to the negative impacts of climate change, and (iv) responding to the need for financially sustainable, community-based initiatives.
About the Asian Development Bank
ADB’s vision is an Asia and Pacific region free of poverty. Its mission is to help its developing member countries reduce poverty and improve the quality of life of their people. Despite the region’s many successes, it remains home to approximately two-thirds of the world’s poor: 1.6 billion people who live on less than $2 a day, with 733 million struggling on less than $1.25 a day. ADB is committed to reducing poverty through inclusive economic growth, environmentally sustainable growth, and regional integration.
Based in Manila, ADB is owned by 67 members, including 48 from the region. Its main instruments for helping its developing member countries are policy dialogue, loans, equity investments, guarantees, grants, and technical assistance.
Asian Development Bank6 ADB Avenue, Mandaluyong City1550 Metro Manila, Philippineswww.adb.org
Printed on recycled paper
STATE OF THE CORAL TRIANGLE:Malaysia
Printed in the Philippines
STATE OF THE CORAL TRIANGLE:Malaysia
© 2014 Asian Development Bank
All rights reserved. Published in 2014.Printed in the Philippines.
ISBN 978-92-9254-516-1 (Print), 978-92-9254-517-8 (PDF)Publication Stock No. RPT146476-3
Cataloging-in-Publication Data
Asian Development Bank. State of the Coral Triangle: Malaysia.Mandaluyong City, Philippines: Asian Development Bank, 2014.
1. Coral Triangle. 2. Marine environment. 3. Marine fisheries. 4. Malaysia.I. Asian Development Bank.
The views expressed in this publication are those of the authors and do not necessarily reflect theviews and policies of the Asian Development Bank (ADB) or its Board of Governors or the governments they represent.
ADB does not guarantee the accuracy of the data included in this publication and accepts no responsibility for any consequence of their use.
By making any designation of or reference to a particular territory or geographic area, or by using the term “country” in this document, ADB does not intend to make any judgments as to the legal or other status of any territory or area.
ADB encourages printing or copying information exclusively for personal and noncommercial usewith proper acknowledgment of ADB. Users are restricted from reselling, redistributing, or creating derivative works for commercial purposes without the express, written consent of ADB.
Note:In this publication, “$” refers to US dollars, unless otherwise stated.
Photo creditFront cover (from left to right): James Berdach and “Checkered snapper” by “dachalan” Licensed under a Creative Commons Attribution-NonCommercial-ShareAlike 2.0 Generic (CC BY-NC-SA 2.0) Accessed 30 April 2014. https://flic.kr/p/5gDvrzBack cover: “700_0010” by “pygmyseahorse” Licensed under a Creative Commons Attribution- NonCommercial-NoDerivs 2.0 Generic (CC BY-NC-ND 2.0) Accessed 30 April 2014. https://flic.kr/p/5KvC7Q
6 ADB Avenue, Mandaluyong City1550 Metro Manila, PhilippinesTel +63 2 632 4444Fax +63 2 636 2444www.adb.org
For orders, please contact:Public Information CenterFax +63 2 636 [email protected]
Printed on recycled paper
© 2014 Asian Development Bank
All rights reserved. Published in 2014. Printed in the Philippines.
ISBN 978-92-9254-528-4 (Print), 978-92-9254-529-1 (PDF)Publication Stock No. RPT146478-3
Cataloging-in-Publication Data
Asian Development Bank. Regional state of the Coral Triangle—Coral Triangle marine resources: Their status, economies, and management.Mandaluyong City, Philippines: Asian Development Bank, 2014.
1. Marine resources. 2. Marine environment. 3. Coral Triangle. 4. Indonesia. 5. Malaysia. 6. Papua New Guinea. 7. Philippines. 8. Solomon Islands. 9. Timor-Leste. I. Asian Development Bank.
The views expressed in this publication are those of the authors and do not necessarily reflect the views and policies of the Asian Development Bank (ADB) or its Board of Governors or the governments they represent.
ADB does not guarantee the accuracy of the data included in this publication and accepts no responsibility for any consequence of their use.
By making any designation of or reference to a particular territory or geographic area, or by using the term “country” in this document, ADB does not intend to make any judgments as to the legal or other status of any territory or area.
ADB encourages printing or copying information exclusively for personal and noncommercial use with proper acknowledgment of ADB. Users are restricted from reselling, redistributing, or creating derivative works for commercial purposes without the express, written consent of ADB.
Note:In this publication, “$” refers to US dollars, unless otherwise stated.
Photo creditFront cover: ADB photo libraryBack cover: Oscar Dennis Espenilla
6 ADB Avenue, Mandaluyong City1550 Metro Manila, PhilippinesTel +63 2 632 4444Fax +63 2 636 2444www.adb.org
For orders, please contact: Public Information CenterFax +63 2 636 [email protected]
Printed on recycled paper
iii
Tables and Figures iv
Foreword vi
Acknowledgments viii
Executive Summary ix
Abbreviations xv
Introduction 1Sulu–Sulawesi Marine Ecoregion Initiative 2Sustainable Fisheries: Sulu–Celebes Sea Sustainable Fisheries Management Project 2
Biophysical Characteristics 4Physical Geography and Oceanography 4Biodiversity of Coastal and Marine Ecosystems 9Economic Value of Ecosystems and Beneficial Uses of Indicator Species 30
Governance 34Legislation 34Policies 38Institutional Arrangements 41International Commitments and Participation 41
Socioeconomic Characteristics 49Demography 49Resource Use Patterns and Issues 50Gender Issues 70Payment for Ecosystem Services Schemes 71
Threats and Vulnerabilities 72Current Issues in Marine Resource Management 72Current Developments in Marine Resource Management 80Emerging Issues in Marine Resource Management 81
National Plan of Action Initiatives and Future Plans 89National Coordination Committee 89Technical Working Groups 89National Plan of Action 91Other Programs and Projects Related to the National Plan of Action 94
References 98
Contents
iv
Tables1 Sea Areas of Malaysia 42 Marine Parks in Peninsular Malaysia and Labuan 113 Major Coral Reef Areas Adjacent to the South China Sea 144 Threats to Corals and Coral Reefs in Malaysia 205 Extent of Mangrove Forests in Peninsular Malaysia,
2006 and 2010 216 Classes and Areas of Permanent Reserved Forests in Sabah, 2010 227 Seagrass Species and Distribution in Malaysia 268 Anthropogenic Threats to Selected Seagrass Beds in Malaysia 289 Economic Value of Mangroves in the Western Coast of Peninsular Malaysia 3210 Federal Legislations in Malaysia Relevant to Coastal and Marine Resources 3611 Sabah State Legislations Relevant to Coastal and Marine Resources 3712 Summary of Other State Legislations Relevant to Coastal and Marine Resources 3813 Federal Policies in Malaysia on Biodiversity and Resources Management 3914 Sabah State Policies in Malaysia on Biodiversity and Resources Management 4015 Government Agencies Related to Marine Biodiversity Conservation
and Management 4216 Relevant International Conventions and Treaties Signed by Malaysia 4417 Number of Fishers in Malaysia, By Region/State, 2003–2007 5318 Marine Fish Landings and Values, By Region/State, 2010 5619 Volume and Value of Fish Catch in Sabah, 2003–2007 5920 Volume and Wholesale Value of Marine Landings in Sabah, 2003–2007 5921 Volume and Value of Aquaculture Production in Malaysia, 2010 6122 Aquaculture Production, Volume and Value, 2010 6523 Climate Change Adaptation Measures Proposed for Malaysia’s Coastal
and Marine Habitats 8624 Status of Action Plans Relating to the Coral Triangle Initiative
as of April 2012 94
Figures1 Malaysia’s Fishing Zones 352 Number of Fishers Working on Licensed Fishing Vessels in Malaysia,
2006–2010 513 Number of Fishing Vessels Licensed in Malaysia, 2006–2010 55
Tables and Figures
Causes of Underinvestment and Persistent Energy Inefficiency v Tables and Figures v
4 Estimated Volume and Value of Inshore and Deep-Sea Fisheries Landings, 2006–2010 57
5 Marine Fish Landings in Sabah, 1999–2008 576 Marine Landings in Sabah in 2007, by Type 587 Value of Aquaculture Production in Malaysia, 2006–2010 628 Estimated Production and Value of Ornamental Fish, 2000–2010 639 Estimated Volume and Value of Freshwater Fish Output from Aquaculture,
2000–2010 6410 Estimated Volume and Value of Aquaculture Production from Brackishwater
Aquaculture, 2000–2010 6611 Organizational Chart of Malaysia’s National Coordination Committee
for the Coral Triangle Initiative 90
vi
Foreword
The Coral Triangle Initiative on Coral Reefs, Fisheries, and Food Security (referred to in this report as Coral Triangle Initiative [CTI]) was launched in 2007 as a multilateral partnership of the governments of Indonesia, Malaysia, Papua New Guinea, the Philippines, Solomon
Islands, and Timor-Leste. The CTI recognizes the need to safeguard the coastal and marine resources of the seas that surround these countries, which together constitute a uniquely diverse and economically important region often referred to as the Coral Triangle. In 2009, these six countries—now often referred to as the CT6—adopted a 10-year, five-point regional plan of action for improving management of the region’s coastal and marine resources. The ultimate objectives of this plan are to ensure food security and sustainable livelihoods for all residents of the Coral Triangle, and to protect the region’s unique ecosystems and the marine species that inhabit them in perpetuity.
The Asian Development Bank (ADB) has a long-term commitment to sustainable development of coastal and marine resources, and decades of experience in coastal and marine resource management in Southeast Asia and the Pacific. As an implementing agency of the Global Environment Facility, ADB manages a broad array of technical and financial support programs both within the Coral Triangle and beyond. It is thus rewarding that ADB is a key development partner of the CT6 countries, both collectively and individually. ADB has undertaken a number of loan, grant, and technical assistance initiatives that directly support and complement the CTI, as well as the national and regional action plans that are central to it. These initiatives help strengthen regional policy dialogue, facilitate CTI-wide exchange of data and information, build institutional capacity, and encourage policy and program development based on global best practice.
Other ongoing ADB-sponsored projects that support the CTI include Regional Cooperation on Knowledge Management, Policy, and Institutional Support to the CTI and Strengthening Sound Environmental Management in the Brunei Darussalam–Indonesia–Malaysia–Philippines East ASEAN Growth Area. Further, ADB supports the CTI’s technical and financial working groups, and has set up a business development unit to liaise with and support the CT6 countries, its development partners, and the CTI regional secretariat. This unit coordinates inputs to knowledge and project management, facilitates project assessment and feasibility studies, and provides assistance to CTI monitoring and evaluation systems.
ADB’s support to the CTI includes the publication of several CTI knowledge products. These include a State of the Coral Triangle (SCT) report for each member country, as well as a regional SCT report that promotes regional and international understanding of current ecological, political, and socioeconomic issues in the Coral Triangle. These SCT reports describe the current
Causes of Underinvestment and Persistent Energy Inefficiency vii Foreword vii
condition of coastal ecosystems—particularly their exploited resources—in each of the CT6, as well as the entire Coral Triangle region. They likewise document these countries’ current biophysical and socioeconomic characteristics, the environmental vulnerabilities of their coastal and marine ecosystems, and the aspects of governance currently in place for addressing these vulnerabilities.
As these SCT reports are the first to be published, they provide a baseline against which future progress in improving management of the Coral Triangle’s marine resources can be measured. They likewise memorialize the commitment of these six countries to the CTI through elaboration of goals and the creation of a national plan of action for each country to achieve sustainable use of marine resources within the Coral Triangle.
Through publication of these national and regional SCT reports—and the Economics of Fisheries and Aquaculture in the Coral Triangle—we hope to promote a more complete regional and international understanding of current ecological, political, and socioeconomic issues in the Coral Triangle. Similarly, we hope that future updates of these SCT reports will enable the CT6 countries to monitor their progress, evaluate projects, refine their action plans as necessary over time, and thus create a sustainable development trajectory for both the communities and the marine ecosystems that inhabit the Coral Triangle.
James A. NugentDirector GeneralSoutheast Asia DepartmentAsian Development Bank
viii
Acknowledgments
The State of the Coral Triangle: Malaysia was prepared by Jasmin Mohd Saad of the Ocean Research for the National Oceanography Directorate of the Ministry of Science, Technology, and Innovation. An earlier draft of the report was reviewed by Kevin Hiew
and Gopinath Nagaraj of Fanli Marine and Consultancy, Sdn. Bhd.
The Ministry of Science, Technology, and Innovation would like to thank the numerous government agencies, learning and research institutions and organizations, and individual experts who generously shared resources, data, information, and knowledge, which together made this report possible.
Many individual experts from these agencies, learning and research institutions, and organizations provided constructive comments on earlier drafts of the report, and made recommendations that greatly improved its content. These include Datin Shahima Abd. Hamidand Fitra Aizura Zulkifli of the Marine Park Department, Ministry of Natural Resources and Environment; Norasma Dacho of the Department of Fisheries, Sabah; Ahmad Rizal Khalit of the Economic Planning Unit; Dato Che Hassan Jusoh of the Malaysian Maritime Enforcement Agency; Cheryl Rita Kaur of the Centre for Coastal and Marine Environment, Maritime Institute Malaysia; Saleem Mustafa, Ejria Saleh, and Connie Fay Komilus of the Borneo Marine Research Institute, Universiti Malaysia Sabah; Madya Datin, Mary George, and Affendi Yang Amri of the Institute of Ocean and Earth Sciences, Universiti Malaya; Awang Noor Abd. Ghani of the Faculty of Forestry, Universiti Putra Malaysia; Harinderrai Singh of the Faculty of Applied Sciences, Universiti Teknologi MARA; Ken Kassem and P. Gangaram of the Worldwide Fund for Nature–Malaysia; Chan Eng Heng of the Turtle Conservation Society of Malaysia; and Julian Hyde of ReefCheck Malaysia.
On behalf of the Malaysian National Coordination Committee for the Coral Triangle Initiative, the National Oceanography Directorate of the Ministry of Science, Technology, and Innovation—which serves as the Malaysian CTI Secretariat—extends its gratitude to the Asian Development Bank for providing technical and financial support throughout the preparation of this report.
ix
Executive Summary
As a maritime country, Malaysia has a long-standing commitment to promote conservation and sustainable management of its marine resources. Prior to formally becoming a member of the Coral Triangle Initiative (CTI), Malaysia had already begun promoting
sustainable use of marine resources in the Coral Triangle under the Sulu–Sulawesi Marine Ecoregion (SSME) Initiative.
The origin of the SSME was a memorandum of understanding agreed to by the three countries that border the Sulu–Sulawesi Sea: Indonesia, Malaysia, and the Philippines. This memorandum of understanding formalized an agreement to adopt an ecoregion approach to conserving marine resources in the Sulu–Sulawesi Marine Ecoregion as contained in the Ecoregion Conservation Plan, which was ratified by the three countries in 2006.
A tri-national committee was set up and a comprehensive action plan was developed, consistent with Goal 2 of the CTI, which aimed to fully apply the ecosystem approach to management of fisheries and other marine resources. This comprehensive action plan fulfills the commitment of these governments to meet the targets of not only the SSME Initiative, but also the Millennium Development Goal of improving fisheries stocks and the socioeconomic condition of coastal communities by 2015.
The Sustainable Fisheries: Sulu–Celebes Sea Sustainable Fisheries Project is the first regional project to be implemented under the SSME Initiative. The project, which is funded by the Global Environment Facility through its implementing agency, the United Nations Development Programme (UNDP), is a 5-year project spanning 2009–2014.
Biophysical Characteristics
Malaysia is composed of two geographically separate areas: Peninsular Malaysia and East Malaysia. Located on the northern coast of Borneo Island, East Malaysia includes the states of Sabah and Sarawak, which together border eight sea areas. The coastline of Peninsular Malaysia is estimated to be 2,031 kilometers (km), while that of Sabah is 1,743 km, and Sarawak, 1,035 km. Malaysia’s sea area comprises approximately 102,000 square kilometers (km²), including its exclusive economic zone, and many inshore and offshore islands. As it is located near the equator, Malaysia is generally warm throughout the year, with temperatures ranging from 21˚C to 32˚C. Annual rainfall averages 2,500 millimeters, and humidity is high, averaging 80%.
Same Energy, More Powerx Executive Summaryx
More than 60% of the country is rain forest. As a result, Malaysia has at least 8,000 species of flowering plants, and a wide variety of bird populations, particularly in East Malaysia. About 200 marine protected areas recorded in the country include bird sanctuaries, fisheries protected areas, mangrove reserves, marine parks, state parks, wildlife sanctuaries, and reserves set up under the Convention on Wetlands. More than half of the country’s marine protected areas are mangrove reserves.
Malaysia’s coral reefs cover an estimated 3,600 km², most of which are found in Sabah and Sarawak, and on the eastern coast of Peninsular Malaysia. Coral diversity is highest in Eastern Malaysia, which is home to about 550 species. However, the country’s coral reefs face a number of environmental threats. Agricultural development in Peninsular Malaysia contributes to sedimentation and nutrient runoff rates higher than would otherwise be the case. In East Malaysia, destructive fishing practices such as cyanide fishing are prevalent, particularly in Sabah. In Sarawak, the major threat coral reefs face is river sedimentation. Overall, the major factors driving suboptimal coral reef conservation are gaps in institutional capacity relating to management and enforcement, as well as resource-use conflicts.
Sabah is home to most of Malaysia’s mangrove forests, which cover an estimated 575,000 hectares (ha), 85% of which are recorded to be forest reserves, state and national parks, wildlife sanctuaries, and wetlands of international importance as defined by the Convention on Wetlands. However, Malaysia has lost approximately 36% of its mangrove forest area and 22% of its mangrove forest reserves to overexploitation and unsustainable use.
Extensive peat swamps and melaleuca forests formerly grew along Peninsular Malaysia’s west coast. However, these lands have largely been converted to other uses such as agriculture and human settlement. Of Malaysia’s original forest cover of this type, only an estimated 1.5 million ha remains. Of this, 70% or more is located in Sarawak, less than 20% in Peninsular Malaysia, and the remainder in Sabah.
Eighteen species of seagrass have been recorded in Malaysia. Most of these are found in sheltered areas in shallow intertidal ecosystems, semi-enclosed lagoons, and subtidal zones associated with coral reef and mangrove ecosystems, with some on offshore islands with fringing reefs. The major environmental threats confronting these seagrass beds include improper aquaculture practices, irresponsible tourism activities, oil pollution, outright removal of mangrove forests, and sedimentation. Legislation for protecting seagrass beds is fragmented, causing numerous potential jurisdictional conflicts between relevant federal and state agencies and departments.
On a positive note, a consensus is emerging within government that financial and economic valuation of the services provided by the country’s ecosystems is both possible and desirable. In particular, there appears to be scope for formulating payment for ecosystem services (PES) schemes that would incentivize the stewards of Malaysia’s ecosystems to preserve the stream of services they provide in perpetuity, given that payments under such schemes are appropriately channeled.
In this regard, Malaysia is currently assessing the potential for PES schemes overall, and will ultimately consider identifying pilot schemes of this type that could be used to test the operational effectiveness of such schemes in the country. The Economic Planning Unit under the Prime Minister’s Office is taking the lead in this regard, in conjunction with researchers from Universiti Putra Malaysia and support from UNDP.
Causes of Underinvestment and Persistent Energy Inefficiency xi Executive Summary xi
Governance
The balance between state and federal government jurisdiction is a sensitive issue in Malaysia, particularly with regard to use of the country’s coastal and marine resources. While the federal government’s jurisdiction over the marine estate extends 200 nautical miles out to sea, state governments have authority over land-related matters up to 3 nautical miles seaward from the low-water mark.
Several federal laws address management and conservation of marine and coastal resources: the Fisheries Act 1985, the Environment Quality Act 1974, the National Forestry Act 1984, the Wildlife Protection Act 2010, the National Parks Act 1980, the Malaysian Maritime Enforcement Agency Act 2004, the Customs Act 1967, the Exclusive Economic Zone Act 1984, the Merchant Shipping Ordinance 1952, and the Merchant Shilling (Oil Pollution) Act 1994.
In Sabah, relevant state laws include the Environment Protection Enactment 2002, the Forest Enactment 1968, the Forest (Constitution of Forest Reserves and Amendment) Enactment 1984, the Parks Enactment 1984, the Sabah Biodiversity Enactment 2000, and the Wildlife Conservation Enactment 1997.
Federal policies that address biodiversity and resource management include the National Biodiversity Policy 1998, the National Forestry Policy, the National Environment Policy, the National Agro-Food Policy, the National Physical Plan, the National Ecotourism Plan, and the National Policy on Climate Change.
For Sabah, relevant policies include the Sabah Forestry Policy 2005, the Sabah Agricultural Policy (1999–2010), and the Sabah Environmental Education Policy.
In some cases, the institutional environment governing marine biodiversity management and conservation includes jurisdictional overlaps, while in others, jurisdictional powers are completely lacking. At least five federal departments and three ministries are responsible for biodiversity management and conservation. Thus, the arrangements for managing and protecting biodiversity are complicated in Malaysia, and require a delicate approach. The core of this problem is absence of a single body that drives biodiversity conservation and management.
Malaysia is party to numerous international conventions, and is a member of several regional fisheries bodies. One of the most important of these is the 1982 United Nations Convention on the Law of the Sea, which Malaysia ratified in 1996. Other important conventions to which Malaysia is a signatory include the Convention on the International Trade in Endangered Species of Wild Fauna and Flora, 1975; the Convention on Biological Diversity, 1992; the United Nations Framework Convention on Climate Change, 1992; the Convention on Wetlands concluded in Ramsar, Iran in 1971; the Convention on the Conservation of Migratory Species of Wild Animals, 1979; the Basel Convention, 1989; the Convention on Marine Pollution,1973; the International Convention on Civil Liability for Bunker Oil Pollution Damage, 2001; the International Convention on the Control of Harmful Anti-Fouling Systems on Ships, 2001; and the International Convention for the Control and Management of Ships’ Ballast Water and Sediments.
Same Energy, More Powerxii Executive Summaryxii
Malaysia’s membership in regional fisheries bodies includes the Asia-Pacific Fishery Commission, the Indian Ocean Tuna Commission, and the Southeast Asian Fisheries Development Center. Malaysia is also a member of several intergovernmental and regional cooperation initiatives such as the Putrajaya Declaration of Regional Cooperation for the Sustainable Development of the Seas of East Asia, which Malaysia joined in 2003; the Sulu–Sulawesi Marine Ecoregion, which it joined in 2004; and the Intergovernmental Oceanographic Commission, which it joined in 1964.
Socioeconomic Characteristics
Malaysia’s population is estimated at 28.3 million. Of this, 74.1% lives in Peninsular Malaysia. Three major ethnic groups are represented in the country: Malays, Chinese, and Indians. The Malays make up the majority (53.5%), with an additional 11.8% comprising bumiputras, or peoples indigenous to Peninsular Malaysia. Nearly all of the country’s population resides within 100 km of the coast.
In 2010, marine (i.e., inshore and deep-sea) capture fisheries accounted for 70.93% (valued at RM6.7 billion) of total national fisheries output. Malaysia’s offshore fishery remains relatively small by international standards. As a result, the government is promoting the expansion of output from the country’s deep-sea fisheries. Local fishers comprise 72% of the total fishing population, with foreign fishers from Indonesia, Thailand, and Viet Nam comprising the remainder. Recent trends suggest that the number of foreign fishers is increasing more rapidly than the number of local fishers. Despite numerous government policies and programs, the fishing community remains one of Malaysia’s poorest. The majority of fishers (53.4%) live in Sabah.
In 2010, marine landings totaled 1.4 million tons. Of this, pelagic fish accounted for 37.3%; demersal fish 20.4%; and mollusks, crustaceans, and others 42.3%. Fish landings in Sabah mainly derive from the state’s coastal fishery.
Current trends indicate a long-term decline in total marine fish landings. This in turn suggests a seriously reduced fisheries resource base—an outcome that seems likely in light of the major shifts in the species profile reported in recent years. For example, in western Peninsular Malaysia, the catch profile has shifted to invertebrates such as jellyfish and squid. Similarly, demersal stocks have declined by 80%–96% since the 1970s. Current management regimes for sustaining present stock levels have mainly focused on controlling fishing effort through licensing and access limitations. Unfortunately, such an approach overlooks the complexity of the marine environment. Overlapping jurisdictions and insufficient coordination among relevant agencies and departments further reinforce this relatively simplistic approach to sustaining present stock levels.
Data relating to coastal and marine-related areas are not readily available, as the level of disaggregation of national statistics mitigates against this. However, tourism in Malaysia’s coastal areas has enjoyed more or less continuous growth in recent decades. Unfortunately, the magnitude of the income multiplier effect of marine-park tourism on local communities has been disappointing. This is possibly due to the dichotomous nature of this tourism subsector.
Causes of Underinvestment and Persistent Energy Inefficiency xiii Executive Summary xiii
Mining and quarrying accounted for 13% of Malaysia’s gross domestic product in 2009. In that year, the government updated the National Mineral Policy to ensure that development of the country’s mineral resources would be environmentally sound, responsible, and sustainable.
Mining and quarrying upstream activities include exploration, development, and production of crude oil and natural gas, both on the continental shelf and in deep water. In both cases, marine pollution is a major concern. Downstream activities include transport by tankers, pipelines, and other means, causing environmental concerns such as emissions and pollution relating to the transport, storage, and use of gas and petroleum.
In 2010, sea freight accounted for 95% of Malaysia’s total cargo volume. The country’s two major ports are Port Klang and the Port of Tanjung Pelepas, both of which are located in Peninsular Malaysia.
The potential contribution of traditional knowledge and practice to economic development is often overlooked, such as the potential contribution of expert divers and traditional boat builders in Terengganu on Peninsular Malaysia’s east coast; and the navigational, diving, and boat-building expertise of Sabah’s Bajau Laut people, who are renowned sea nomads.
Gender inequality continues to be an issue in Malaysia, particularly in the working environment. Constraints to full gender equality include overlapping home and work responsibilities, the choice of school courses pursued, and inadequate access to credit and market information, particularly in rural areas. Encouragingly, policies and programs for addressing these constraints target expansion of education and training opportunities for women, removal of discriminatory legislation, and improvement in the legal status of women overall.
Threats and Vulnerabilities
The government acknowledges the substantial decline of coastal fisheries output over previous decades and, currently, the excess capacity in the coastal fishing subsector. In this regard, many observers of Malaysia’s marine resources are advocating ecosystem-based management of fisheries (EBMF), which is strongly supported by ongoing programs such as the SSME Initiative. The Coral Triangle Initiative (CTI) likewise supports implementation of the EBMF, which is viewed to be a means of ensuring long-term food supply and sustainable development of the marine resource. However, without an adequate institutional and legal foundation, the EBMF is likely to be ineffective.
Threatened species in Malaysia—the marine turtles; marine mammals such as dolphins and dugongs, sea cucumbers; and the humphead wrasse—face habitat destruction, poor marine water quality due to pollution of all types, and institutional arrangements inadequate for ensuring their survival. Species-specific threats facing marine turtles and mammals include fisheries bycatch; and for marine turtles, direct poaching and harvesting of their eggs.
Other marine resource management issues include environmental risks introduced by aquaculture, increased incidence of harmful algal blooms, introduction of invasive species through discharge of ballast water by ocean-going vessels, ocean acidification, and negative
Same Energy, More Powerxiv Executive Summaryxiv
climate change impacts on the marine environment. Evaluating such threats from the perspective of appropriate operational responses requires further research.
As observed in Malaysia, the impacts of climate change include increased air and sea-surface temperatures, and increased frequency and intensity of extreme rainfall, wind, and thunderstorm events. An ongoing study is projecting sea-level rise in Malaysia based on pre-existing global projections.
National Plan of Action Initiatives and Future Plans
Since it joined the CTI, Malaysia has established a number of committees that have formulated plans and programs for implementing the CTI at the national level. At the CTI’s third ministerial meeting in October 2011, Malaysia was appointed chair of the Coral Triangle Initiative Council of Ministers for a 2-year term effective November 2011. As chair, Malaysia faces major challenges such as (i) ensuring a smooth transition from the Interim Regional Secretariat to a permanent regional secretariat based in Manado, Indonesia; (ii) implementing CTI activities; and (iii) strengthen regional cooperation as it relates to achieving sustainable financing for the CTI.
Malaysia has established a CTI National Coordination Committee (NCC) that is chaired by the Ministry of Science, Technology, and Innovation (MOSTI). The national secretariat is the National Oceanography Directorate under MOSTI. Members of the NCC comprise high-level decision makers and senior officers from relevant government departments and agencies. The NCC’s main task is to provide guidance and support in implementing Malaysia’s National Plan of Action (NPOA), and the CTI’s regional plan of action. Further, three technical working groups support the NCC: the Coordination Mechanism Working Group (with duties that include monitoring and evaluation), the Scientific Working Group, and the Financial Resource Working Group.
Malaysia’s NPOA is based on the principles, goals, and targets embodied in the regional plan of action. The action plans for implementing the NPOA include projects and programs in various stages of development or implementation. These initiatives are led by several government agencies, as well as nongovernment organizations. Problems in implementing these action plans include issues such as (i) adequate training and skills of officers, (ii) adequate financing for longer-term programs, and (iii) adequate awareness of decision makers and the public.
xv
Abbreviations
ADB – Asian Development BankCTI – Coral Triangle Initiative on Coral Reefs, Fisheries, and Food Security
(also referred to as Coral Triangle Initiative)EBMF – ecosystem-based management of fisheriesECP – Ecoregion Conservation PlanEEZ – exclusive economic zoneGNI – gross national income GRT – gross register tonnageha – hectareHAB – harmful algal bloomIMWQS – Interim Marine Water Quality Standards IOC – Intergovernmental Oceanographic CommissionIOTC – Indian Ocean Tuna CommissionMMD – Malaysian Meteorological DepartmentMNRE – Ministry of Natural Resources and EnvironmentMOSTI – Ministry of Science, Technology, and Innovation MPA – marine protected areaNCC – National Coordination CommitteeNGO – nongovernment organizationNOD – National Oceanography Directorate NPOA – National Plan of Action PES – payment for ecosystem services PCA – priority conservation areaSSME – Sulu–Sulawesi Marine EcoregionTARP – Tunku Abdul Rahman Park TIHPA – Turtle Islands Heritage Protected Area TWG – technical working groupUNDP – United Nations Development ProgrammeUNEP – United Nations Environment Programme

1
Introduction
The Coral Triangle describes a marine expanse that straddles the Indian and Pacific oceans. This area is known to environmentalists to be extremely abundant of marine life and significant biodiversity. With regard to political boundaries, the Coral Triangle includes
some or all of the land and oceanic area of six countries: Indonesia, Malaysia, Papua New Guinea, the Philippines, Solomon Islands, and Timor-Leste. While comprising only 1.6% of the total area of the earth’s oceans, the Coral Triangle is home to 76% of all known coral species, 37% of all known coral-reef fish species, 53% of the world’s coral reefs, and the most extensive mangrove forests in the world, which are spawning and juvenile growth areas for tuna and other commercial fish species of global importance. These rich marine and coastal resources provide significant economic and social benefits—such as food, income, recreation, and culture—to the 360 million residents of the Coral Triangle, particularly its 120 million residents who live on or near its coastlines. They also protect the coastline and its residents from the damaging impact of extreme weather events.
This report describes the biophysical characteristics of Malaysia’s marine and coastal ecosystems, their governance under the prevailing legal and policy framework, and the institutional arrangements for ensuring compliance with the provisions of that framework. It also describes the socioeconomic characteristics of the populations these ecosystems serve, and the pattern of resource use of these populations. The report summarizes the threats to, and vulnerabilities of these coastal and marine ecosystems, and describes how the country proposes to address these to ensure sustainable use of these ecosystems in the future. From an operational perspective, implementing a national plan of action aimed at improving governance and managing marine resources will ensure future sustainable use of these ecosystems. Management of marine resources is to include an ecosystem-based marine resource management regime and adaptation to the negative impacts of climate change.
As a maritime nation, Malaysia has a long-standing commitment to promote conservation and sustainable management of its marine resources. Of particular interest with regard to Malaysia’s becoming a CTI member country is eastern Sabah, which forms part of the western portion of the Coral Triangle. Several conservation and marine resource management programs in the country are either being implemented or planned. The details of two major activities of this type are briefly summarized below.
Same Energy, More Power2 2 Introduction
Sulu–Sulawesi Marine Ecoregion Initiative
The origin of the Sulu–Sulawesi Marine Ecoregion (SSME) Initiative is a memorandum of understanding signed by the three countries that border the Sulu–Sulawesi Sea: Indonesia, Malaysia, and the Philippines. Signed during the Seventh Conference of Parties of the Convention on Biological Diversity held in Kuala Lumpur in February 2004, this memorandum of understanding formalized an agreement to adopt an ecoregion approach to conserving marine resources in the Sulu–Sulawesi Marine Ecoregion as embodied in the Ecoregion Conservation Plan (ECP). Ratified by the three countries in 2006, the ECP was the output of trilateral consultations by Indonesia, Malaysia, and the Philippines. One of the cornerstones of the ECP is to allow conservation of coastal and marine resources without compromising the livelihood of the people that inhabit the SSME.
Based on the memorandum of understanding, a tri-national committee for the SSME initiative was established in 2006. Three subcommittees, each of which focuses on a particular aspect of marine resource management, in turn support this tri-national committee. For example, Indonesia leads the subcommittee that focuses on threatened, charismatic, and migratory species; Malaysia leads the subcommittee that focuses on sustainable fisheries; and the Philippines leads the subcommittee that focuses on marine protected areas (MPAs) and associated networks.
Technical working groups established in each country support each subcommittee. The first set of work plans for these subcommittees was published in 2009. An initial major output of the subcommittees was a comprehensive action plan for addressing the aspects of marine resource management and conservation.
The Comprehensive Action Plan was the three member governments’ response to the challenge of meeting not only the objectives of the SSME initiative, but also the United Nations (UN) Millennium Development Goal of improving fisheries stocks and socioeconomic conditions in coastal communities by 2015. Similarly, the Comprehensive Action Plan addresses the manner in which the CTI goals are to be met. As a result, the Comprehensive Action Plan is fully consistent with Goal 2 of the Coral Triangle Initiative, which aims to apply the ecosystem approach to management of fisheries and other marine resources.
Sustainable Fisheries: Sulu–Celebes Sea Sustainable Fisheries Management Project
The Sustainable Fisheries Subcommittee set up under the SSME Initiative proposed the first regional initiative, the Sulu–Celebes Sea Sustainable Fisheries Management Project. Funded by the Global Environment Facility (GEF) and implemented by United Nations Development Programme (UNDP), the 5-year fisheries management project is implemented over the period 2009–2014. The fisheries management project is composed of five components, each addressing a particular aspect of marine resource management:
(i) Component 1: Transboundary diagnostic analysis of marine fisheries(ii) Component 2: Planning to reach an agreement on legal, policy, and institutional reforms
for improving fisheries management and the health of the ecosystem to be undertaken at the national and regional levels
Causes of Underinvestment and Persistent Energy Inefficiency 3 3 Introduction
(iii) Component 3: Formulation of institutional reforms to catalyze implementation of policies for reducing overfishing, improving management of both the Sulu–Celebes Sea fisheries and its overall ecosystem, and strengthening national fisheries laws and policies
(iv) Component 4: Demonstration of best management practices at critical sites(v) Component 5: Knowledge management and replication of lessons learned
The technical working group under the sustainable fisheries subcommittee has a mandate from all three governments to (i) review the design of particular projects, (ii) provide information as appropriate, and (iii) facilitate government decisions regarding commitment and mobilization of resources to formulate and implement the project. The fisheries management project will be implemented under CTI auspices.
A project steering committee for the fisheries management project will provide guidance and advice relating to local, national, and regional activities, and overall project activities. The project steering committee comprises (i) one representative each from Conservation International, UNDP, and the UN Office for Project Services; and (ii) three representatives from the SSME subcommittee on sustainable fisheries, representing Indonesia, Malaysia, and the Philippines respectively. In performing its functions, the project steering committee will interact with, and receive inputs from the CTI, as the SSME comprises a subregion of the Coral Triangle.
4
Physical Geography and Oceanography
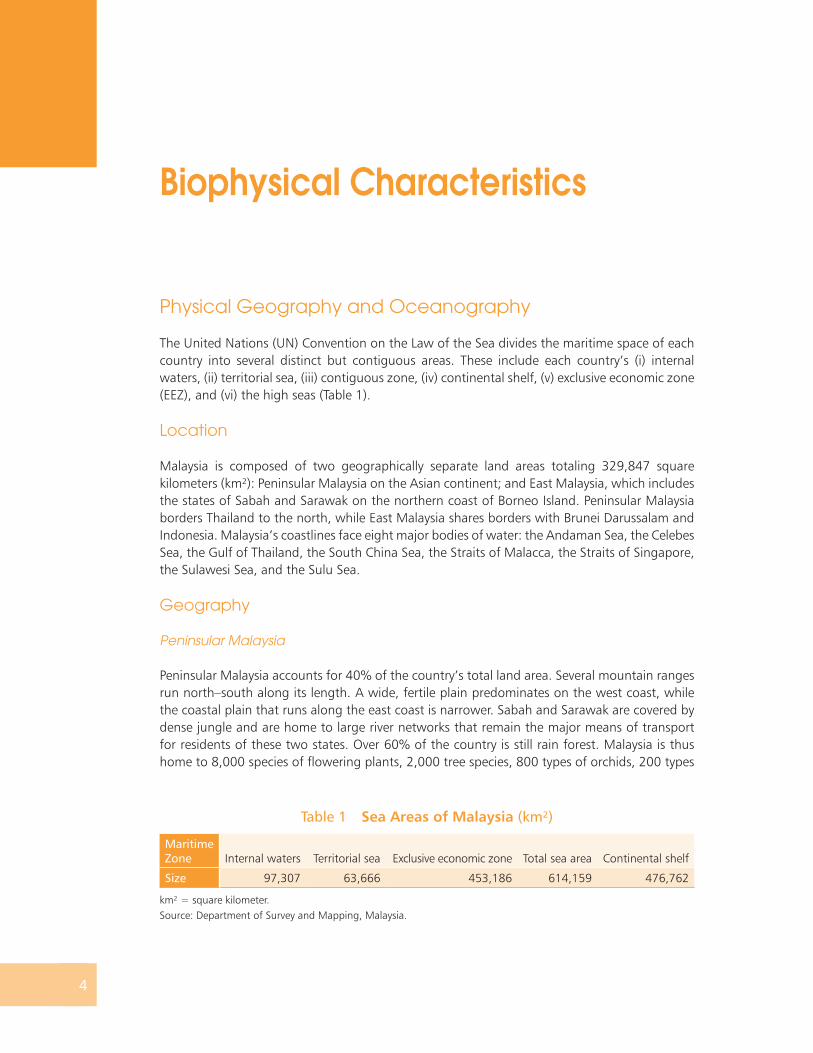
The United Nations (UN) Convention on the Law of the Sea divides the maritime space of each country into several distinct but contiguous areas. These include each country’s (i) internal waters, (ii) territorial sea, (iii) contiguous zone, (iv) continental shelf, (v) exclusive economic zone (EEZ), and (vi) the high seas (Table 1).
Location
Malaysia is composed of two geographically separate land areas totaling 329,847 square kilometers (km²): Peninsular Malaysia on the Asian continent; and East Malaysia, which includes the states of Sabah and Sarawak on the northern coast of Borneo Island. Peninsular Malaysia borders Thailand to the north, while East Malaysia shares borders with Brunei Darussalam and Indonesia. Malaysia’s coastlines face eight major bodies of water: the Andaman Sea, the Celebes Sea, the Gulf of Thailand, the South China Sea, the Straits of Malacca, the Straits of Singapore, the Sulawesi Sea, and the Sulu Sea.
Geography
Peninsular Malaysia
Peninsular Malaysia accounts for 40% of the country’s total land area. Several mountain ranges run north–south along its length. A wide, fertile plain predominates on the west coast, while the coastal plain that runs along the east coast is narrower. Sabah and Sarawak are covered by dense jungle and are home to large river networks that remain the major means of transport for residents of these two states. Over 60% of the country is still rain forest. Malaysia is thus home to 8,000 species of flowering plants, 2,000 tree species, 800 types of orchids, 200 types
Biophysical Characteristics
Table 1 Sea Areas of Malaysia (km²)
Maritime Zone Internal waters Territorial sea Exclusive economic zone Total sea area Continental shelf
Size 97,307 63,666 453,186 614,159 476,762
km² = square kilometer.Source: Department of Survey and Mapping, Malaysia.
Causes of Underinvestment and Persistent Energy Inefficiency 5 Biophysical Characteristics 5
of palms, and numerous types of wildlife. Malaysia’s bird population is abundant and varied, particularly in East Malaysia (Government of Malaysia 2010c).
Sabah
Sabah is located in the South China Sea on the northeast coast of Borneo Island. The state’s total land area of 74,000 km² makes it Malaysia’s second largest after Sarawak. To the northwest, Sabah faces the South China Sea, the Sulu Sea to the northeast, and the Celebes Sea to the southeast. Its total coastline is 1,800 kilometers (km), and its approximate total sea area including the EEZ is 102,000 km². Sabah’s total land area includes many inshore and offshore islands ranging in size from tiny islets to sizable islands that are home to permanent settlements (Ranjith et al. 1999). Sabah shares borders with Brunei Darussalam and Indonesia (Jakobsen et al. 2007).
Due to its fortunate location south of the typhoon-prone region that particularly includes the Philippines, Sabah is known as “The Land below the Wind.” Sabah’s capital city is Kota Kinabalu, which was formerly known as Jesselton. Including its many islands and lagoons, Sabah has three major urbanized centers in addition to Kota Kinabalu: Kudat, Sandakan, and Tawau. The state’s other populated areas include 300 coastal villages, all of which depend on fisheries as their primary source of income. Agriculture and tourism are secondary income sources (Jakobsen et al. 2007).
Sabah’s 4,328-kilometer coastline includes 320,000 hectares (ha) of highly productive mangroves, and ecologically diverse coral reefs located along the coast and around its many islands. The state’s coastal waters are likewise home to rich seagrass and seaweed beds. These complex ecological resources sustain numerous types of commercial enterprise in the fisheries and tourism sectors, the latter being a growing source of income for the state over past decades (Ranjith et al. 1999).
Sarawak
Located southwest of Sabah on the north coast of Borneo Island, Sarawak shares borders with Brunei Darussalam to the northeast, and Indonesia to the south and east. Sarawak’s land area of 124,450 km² comprises 37.5% of Malaysia’s total land area, making it Malaysia’s largest state (Government of Malaysia 2010c). The state’s coastline extends more than 750 km along the north coast of Borneo Island.
The high hills and mountains of Borneo Island’s central mountain range separate Sarawak from Indonesia’s west, central, and east Kalimantan provinces. These mountains are higher in the north, reaching their highest elevation near the source of the Baram River (Government of Malaysia 2010c).
From south to north, Sarawak’s major rivers include the Sarawak, the Lupar, the Saribas, and the 563-kilometer Rajang—the longest river in Malaysia. The Baleh River branch, the Baram River, and the Libang River all drain into Brunei Bay, where it divides into the Brunei and Trusan rivers. The Sarawak River flows through Kuching, the state’s administrative capital (Government of Malaysia 2010c).
Same Energy, More Power6 State of the Coral Triangle: Malaysia6
Sarawak has large tracts of tropical rain forest, and is home to a wide range of plant and animal species. Large swamp and other wetland areas are found in the state’s coastal region. The ports of Kuching and Sibu are built at a distance from the coast near rivers. Bintulu and Miri are near the coastline where the hills stretch out into the South China Sea (Government of Malaysia 2010c).
Offshore Geology
Malaysia’s most interesting offshore geological feature is its sand waves, which form in areas where mobile sand on the seabed is abundant and tidal currents are strong. These areas are transverse bed forms that lie at a 90-degree angle to the dominant tidal flow. The fineness of the sand that makes up these waves depends on the velocity of the current that creates them. As a result, they range in size from gravel to very fine sand. For example, in areas where the average (mean) velocity of the current exceeds 0.4 meters per second, gravel is the dominant size of the particles that make up the sand waves. These conditions predominate off Kuantan (eastern Peninsular Malaysia), off Port Klang (western Peninsular Malaysia), and north of Tanjung Datu (Sarawak) (Government of Malaysia 2010c).
Straits of Malacca
In the northern grabens (i.e., the area north of the mouth of the Perak River), the Cenozoic era began with continental Upper Oligocene beds that rapidly changed into marine deposits. Structural highs were formed from Lower Miocene carbonate buildup. During the rest of the Cenozoic, shallow marine to coastal conditions were maintained, except for minor exposures during the various Quaternary glacial episodes when the strait and the entire Sundal formed a vast Southeast Asian continent. In the late Oligocene, the depressions in the straits south of the Perak River mouth began as lakes, and later received fluvio-deltaic deposits. The environment changed into lower coastal plain and shallow marine conditions from the Pliocene onward, and the southern Straits of Malacca were exposed during the Quaternary glacial episodes (Government of Malaysia 2010c).
The Tertiary basement of the straits that hosts 15 north-trending grabens slope gently toward the southeast. The grabens range from 825 meters to nearly 4,000 meters in depth. These grabens are categorized into (i) Bengkalis Trough related, (ii) the Pematang–Balam Trough, (iii) the Asahan Arch–Kepulauan Arua Nose, and (iv) Tamiang–Yang Besar High related depressions. They could represent regional fracture zones separated from each other by zones of regional highs. These are presumed to have begun developing in the Late Oligocene by regional dextral shearing of the northwesterly trending Straits of Malacca belt. Wrenching is found on major but non-regional faults. Many of the graben outlines at the basement level resemble rhombic or sigmoidal pull-aparts despite alteration by subsequent tectonic deformation, such as those of Johor, East Penang, North Penang, and Port Kelang (Klang) (Government of Malaysia 2010c).
Sunda Shelf
The waters between Peninsular Malaysia and Sarawak form part of the northern Sunda Shelf, which is 40–80 meters deep. These waters emerged during the Pleistocene lowering of sea level. This part is generally smooth, sloping gently northeastward to the continental slope in
Causes of Underinvestment and Persistent Energy Inefficiency 7 Biophysical Characteristics 7
the southern part. Bathymetric contours show a series of open valleys draining northeastward toward the continental slope, where relief across the open shelf is low, and the valley interfluves slope very gently (Government of Malaysia 2010c).
The Sunda Shelf is a stable area that has had no significant vertical movement over the last 300,000 years (Pleistocene), but at the same time, global eustatic sea level fluctuated in concert with changes in the volume of continental ice. River systems eroded the shelf and locally deposited an ocean-ward prograding and accreting wedge onto the erosion surface during periods of lower sea level. In contrast, during periods of high sea level when the shelf was fully marine, deposition of coarser fractions of the alluvial load occurred near the contemporary coasts, while finer-grained materials were distributed widely onto the open shelf (Government of Malaysia 2010c).
Offshore Northeast Sabah and the Sulu Sea
The areas off Sabah’s northeastern shore that extend to the Sulu Sea are characterized by several northeastward trending tectonic elements, such as the northwestern and southeastern Sulu Basin and Cagayan Ridge. A series of north to northeast trending horst and graben features that include normal and/or growth faults are present off Dent Peninsula. The splitting or rifting of the Cagayan–Sulu Ridge extended into Sabah and created northeastward-trending extensional features. A series of strike-slip faults cut these northeastward-trending terrains, and separates the Cagayan Ridge and the northeastern Sabah area, including the Sandakan sub-basin, which probably continues northwestward to join the sinistral strike-slip fault known as the Straits of Balabac Fault in the northwest (Government of Malaysia 2010c). This area of less displacement in terms of changes in sea temperature has maintained its status as the center of biological diversity since the earliest models of Stehli and Wells (1971). New research and findings along the timeline affirm the status of the region (Status of Coral Reefs in Southeast Asia 2004).
Climate
This section describes current climatic conditions and historical changes to them. The Threats and Vulnerabilities section of this report describes the negative impacts of climate change on Malaysia, as well as the country’s climate change adaptation programs.
Temperature and wind patterns
Because it is located near the equator, Malaysia is generally warm throughout the year, with temperatures ranging from 21°C to 32°C in the country’s lowland areas, to as low as 16°C in the highlands. Such tropical conditions result in annual rainfall of 2,500 millimeters (mm) and relatively high humidity levels (80%) (Government of Malaysia 2010c).
While winds in Malaysia are generally light and variable, some uniform periodic changes in wind flow patterns cause Malaysia to experience four distinct seasons: the southwest monsoon, the northeast monsoon, and two shorter inter-monsoon seasons.
The southwest monsoon usually begins during the second half of May or early June, and ends in September. The prevailing wind flow during the southwest monsoon is generally southwesterly,
Same Energy, More Power8 State of the Coral Triangle: Malaysia8
with wind speeds of less than 15 knots. The northeast monsoon typically begins in early November and ends in March. During this season, steady easterly or northeasterly winds of 10–20 knots prevail. Further, the winds over eastern Peninsular Malaysia may reach 30 knots or more during periods of strong surges of cold air from the north. During the two inter-monsoon seasons, the equatorial trough lies over Malaysia, causing winds to be generally light and variable (Malaysian Meteorological Department 2009).
Typhoons frequently develop over the western Pacific and move westward across the Philippines from April to November. During this period, southwesterly winds over the northwestern coast of Sabah and Sarawak can strengthen to 20 knots or more (Malaysian Meteorological Department 2009).
Sea surface temperature
Because Malaysia is located near the equator, the country experiences little annual variation in sea-surface temperature. For example, sea-surface temperatures vary between 26°C and 28°C in January and between 28°C and 29°C in July. Similarly, the air temperature near the sea surface seldom varies more than 1°C above or below the sea surface temperature (Government of Malaysia 2010c).
Hydrology
Malaysia’s average annual rainfall ranges from 2,420 mm in Peninsular Malaysia to 3,830 mm in Sarawak. Open evaporation falls in the range of 1,600–1,800 mm. Malaysia’s main sources of water are rainfall, surface runoff, groundwater, and evaporation (Government of Malaysia 2010c).
Seasonal rainfall variation in Peninsular Malaysia
On the eastern coast of Peninsular Malaysia, rainfall levels are highest in most districts in November, December, and January; and lowest in June and July (Malaysian Meteorological Department 2009). For the remainder of Peninsular Malaysia with the exception of the southwestern coastal area, the monthly rainfall pattern shows two periods of maximum rainfall that are separated by two periods of minimum rainfall. Generally, the primary maximum rainfall occurs in October to November, while the secondary maximum occurs in April to May. Over the northwestern region, the primary minimum rainfall occurs in January to February, while the secondary minimum rainfall occurs in June to July. Elsewhere, the primary minimum rainfall occurs in June to July, while the secondary minimum occurs in February.
The rainfall pattern over the southwestern coastal area is mostly affected by early morning Sumatras from May to August. As a result, the double maxima and minima pattern is no longer distinguishable. Maximum rainfall occurs in October and November, and minimum rainfall in February. The March to May maximum and the June to July minimum are either absent or indistinct.
Seasonal rainfall variation in Sabah and Sarawak
The rainfall regime in the coastal areas of Sarawak and northeast Sabah typically includes one maximum and one minimum (Malaysian Meteorological Department 2009), with rainfall
Causes of Underinvestment and Persistent Energy Inefficiency 9 Biophysical Characteristics 9
reaching a maximum during January in both areas. In coastal Sarawak, rainfall reaches a minimum in June or July, although this occurs during April in Sabah’s northeastern coastal areas. For both areas, a large portion of the annual rainfall is received during the northeast monsoon, which prevails in December to March. For western Sarawak, rainfall during the northeast monsoon accounts for more than half of total annual rainfall.
Rainfall in Sarawak’s inland areas is generally evenly distributed throughout the year, although the area receives slightly less rainfall in June–August when southwesterly winds prevail. The hill slopes of inland areas receive the highest annual rainfall in Malaysia. Because of its location, the mean annual rainfall received by Long Akah exceeds 5,000 mm (Malaysian Meteorological Department 2009).
The rainfall regime in Sabah’s northwestern coastal areas includes two maxima and two minima. The primary maximum occurs in October, and the secondary maximum in June. In contrast, the primary minimum occurs in February and the secondary minimum occurs in August. While the difference between the amounts of rainfall received during the two maxima is small, the amount received during the primary minimum falls substantially short of that received during the secondary minimum. In some areas, the amount received during the primary minimum is only one-fourth of that received during the secondary minimum.
Because central Sabah is hilly and sheltered by mountain ranges, it generally receives less rainfall than other regions. Further, the rainfall that central Sabah does receive is relatively evenly distributed throughout the year. However, while not very distinct, two maxima and two minima have been recorded. In general, the two minima occur in February and August, while the two maxima occur in May and October (Malaysian Meteorological Department 2009).
Relative to central Sabah, the rainfall that southern Sabah receives is evenly distributed throughout the year. That said, slightly drier conditions prevail during February–April than the rest of the year (Malaysian Meteorological Department 2009).
Biodiversity of Coastal and Marine Ecosystems
Marine Protected Areas
Malaysia has approximately 200 gazetted marine protected areas (MPAs), which include marine parks, state parks, protected fisheries areas, mangrove reserves, bird sanctuaries, wildlife sanctuaries, and sites recorded partly to fulfill Malaysia’s commitments under the Convention on Wetlands.1 More than half of Malaysia’s MPAs are mangrove reserves that are located along the country’s substantial coastline (Government of Malaysia 2010c).
1 Signatories to the Convention on Wetlands have committed to sustainable use of wetlands of international importance that are located within their respective jurisdictions. Concluded in Ramsar, Iran, in 1971, the Convention on Wetlands is often referred to as the Ramsar Convention. Though not affiliated with the UN system of multilateral environmental agreements, the Ramsar Convention works closely with the administrations of other multilateral environmental agreements.
Same Energy, More Power10 State of the Coral Triangle: Malaysia10
Peninsular Malaysia
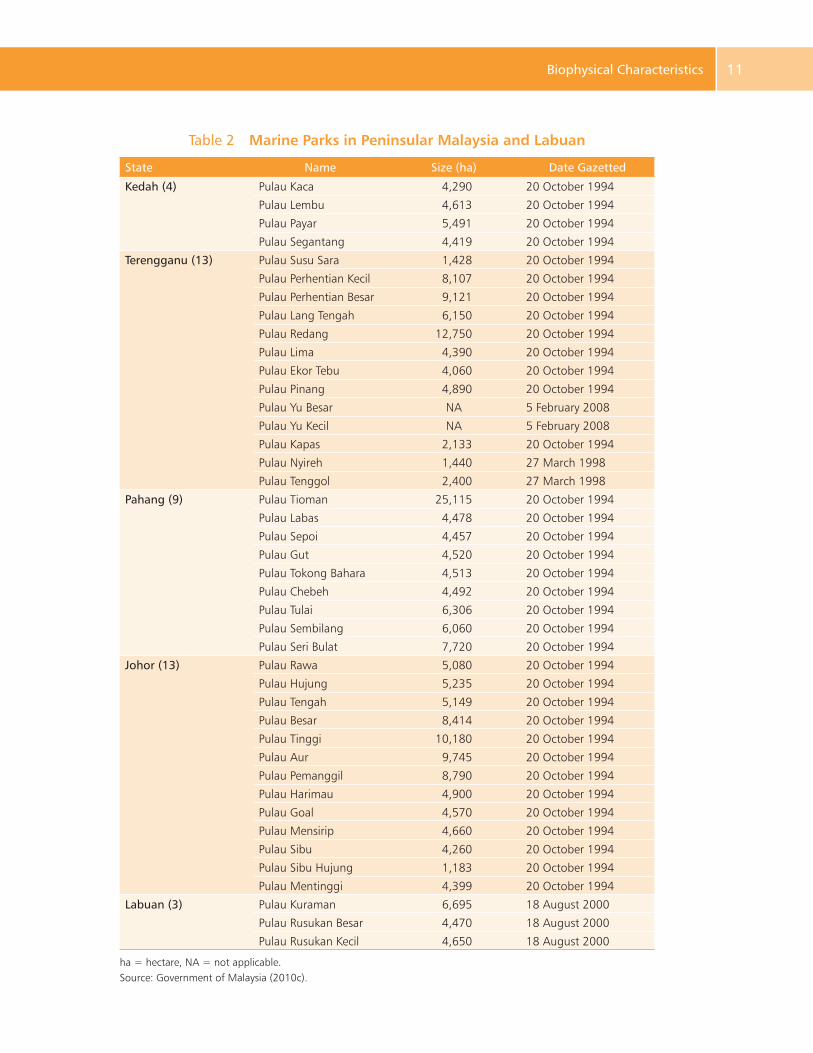
Established in 1983, Peninsular Malaysia’s first MPA was an area where fishing was prohibited in all waters within 8 km of Redang Island. This area was designated under the Fisheries (Prohibited Area) Regulations of 1983, which were promulgated under the then Fisheries Act of 1963. This first MPA was subsequently expanded to include all waters within 3 km of 21 islands located in the states of Johor, Kedah, Pahang, and Terengganu. All of these islands were initially declared fisheries-prohibited areas prior to their being gazetted as marine parks in 1994. Table 2 lists the 42 islands that have been declared marine parks in Peninsular Malaysia and Labuan under the Establishment of the Marine Park Order of 1994 of the Fisheries Act 1985 (Government of Malaysia 2010c). Administratively, these islands are grouped into six marine park centers.
Malaysia’s marine parks serve three purposes: protection, conservation, and management of the marine environment. More specifically, National Marine Parks Malaysia—Policy and Concepts identifies the five specific purposes of these parks:
(i) to afford special protection to aquatic fauna and flora, to preserve and manage the natural breeding ground and habitat of aquatic life, with particular regard to rare and endangered species;
(ii) to allow natural regeneration in cases where depletion has occurred;(iii) to promote scientific study and research;(iv) to preserve and improve the environmental productivity of undamaged systems; and (v) to regulate recreational and other activities so as to ensure that irreversible damage to
the environment is avoided (Government of Malaysia 2010c).
The Department of Marine Parks is only responsible for marine parks located within Peninsular Malaysia and Labuan. Two state agencies are responsible for management of marine parks: Sabah Parks in Sabah, and Sarawak Forestry Corporation in Sarawak.
Sabah
Sabah has five marine parks gazetted under the Sabah Parks Enactment, 1984 (amended in 2002). Established in 1974, Tunku Abdul Rahman National Park located off Kota Kinabalu was Sabah’s first MPA. Turtle Islands National Park was then established in 1975, and Pulau Tiga National Park designated as a marine park area in 1978. Tun Sakaran Marine Park off Semporna and Tun Mustapha Park off Kudat were declared marine parks in 2004 and 2006 respectively.
Pulau Sipadan, which is under the authority of the National Security Council, is now proposed as an MPA under the management of Sabah Parks because of the replacement of Sabah National Parks Ordinance, 1962, with Sabah Parks Enactment, 1984 (amended 2002) (Government of Malaysia 2010c). In addition, two marine park areas are proposed: Tun Mustapha Park and Ligitan Island.
Overall, the reason for establishing and legally protecting these parks is conservation of marine biodiversity, particularly as it relates to coral reef ecosystems. However, in the case of some parks, the reason for establishing them is specific to the park concerned. For example, a major reason for establishing Pulau Tiga Park was protection of its unique ecosystem, which includes
Causes of Underinvestment and Persistent Energy Inefficiency 11 Biophysical Characteristics 11
Table 2 Marine Parks in Peninsular Malaysia and Labuan
State Name Size (ha) Date Gazetted
Kedah (4) Pulau Kaca 4,290 20 October 1994
Pulau Lembu 4,613 20 October 1994
Pulau Payar 5,491 20 October 1994
Pulau Segantang 4,419 20 October 1994
Terengganu (13) Pulau Susu Sara 1,428 20 October 1994
Pulau Perhentian Kecil 8,107 20 October 1994
Pulau Perhentian Besar 9,121 20 October 1994
Pulau Lang Tengah 6,150 20 October 1994
Pulau Redang 12,750 20 October 1994
Pulau Lima 4,390 20 October 1994
Pulau Ekor Tebu 4,060 20 October 1994
Pulau Pinang 4,890 20 October 1994
Pulau Yu Besar NA 5 February 2008
Pulau Yu Kecil NA 5 February 2008
Pulau Kapas 2,133 20 October 1994
Pulau Nyireh 1,440 27 March 1998
Pulau Tenggol 2,400 27 March 1998
Pahang (9) Pulau Tioman 25,115 20 October 1994
Pulau Labas 4,478 20 October 1994
Pulau Sepoi 4,457 20 October 1994
Pulau Gut 4,520 20 October 1994
Pulau Tokong Bahara 4,513 20 October 1994
Pulau Chebeh 4,492 20 October 1994
Pulau Tulai 6,306 20 October 1994
Pulau Sembilang 6,060 20 October 1994
Pulau Seri Bulat 7,720 20 October 1994
Johor (13) Pulau Rawa 5,080 20 October 1994
Pulau Hujung 5,235 20 October 1994
Pulau Tengah 5,149 20 October 1994
Pulau Besar 8,414 20 October 1994
Pulau Tinggi 10,180 20 October 1994
Pulau Aur 9,745 20 October 1994
Pulau Pemanggil 8,790 20 October 1994
Pulau Harimau 4,900 20 October 1994
Pulau Goal 4,570 20 October 1994
Pulau Mensirip 4,660 20 October 1994
Pulau Sibu 4,260 20 October 1994
Pulau Sibu Hujung 1,183 20 October 1994
Pulau Mentinggi 4,399 20 October 1994
Labuan (3) Pulau Kuraman 6,695 18 August 2000
Pulau Rusukan Besar 4,470 18 August 2000
Pulau Rusukan Kecil 4,650 18 August 2000
ha = hectare, NA = not applicable.Source: Government of Malaysia (2010c).
Same Energy, More Power12 State of the Coral Triangle: Malaysia12
mud volcanoes, coral reefs, and its nesting habitat for sea snakes. Similarly, a major reason for establishing Turtle Islands Park was to protect the nesting sites of green and hawksbill turtles.
Turtle Islands Park is unique, both in terms of its location and its role. The park is composed of three islands: Pulau Bakungan Kechil, Pulau Gulisaan, and Pulau Selingaan—all of which are located in Malaysian waters and are part of a cluster of islands collectively referred to as the Turtle Islands. Their beaches are nesting sites for the endangered green and hawksbill turtles. The remainder of the Turtle Islands is under Philippine jurisdiction.
Because of the islands’ role in protecting marine turtles, the governments of Malaysia and the Philippines jointly established Turtle Islands Heritage Protected Area in 1996. This is the first transboundary marine park in the world that protects endangered turtles. Sabah Parks (Malaysia) and the Pawikan (Turtle) Conservation Project (jointly sponsored by the Department of Environment and Natural Resources, Republic of the Philippines, and the Worldwide Fund for Nature—Philippines) conduct conservation activities in this protected area. On the islands under Malaysia’s jurisdiction, Sabah Parks has established hatcheries for increasing the probability of eggs developing to hatchlings that can be released into the sea. A similar program is active on Baguan Island, which is under Philippine jurisdiction. Selingaan Island is home to an ecotourism site where tourists can observe turtle nesting, replanting of eggs in the hatchery, and release of hatchlings into the wild. In 1997, the three agencies that conduct turtle conservation activities in Turtle Islands Heritage Protected Area won the J. Paul Getty Award for Wildlife Conservation.
Sarawak
Sarawak has gazetted three marine parks under the National Parks and Nature Reserves Ordinance, 1998. Pulau Satang-Satang and Pulau Talang-Talang were gazetted for purposes of turtle conservation, while submerged Miri-Sibuti Marine Park was gazetted to preserve its significant coral reef biodiversity.
Most of Sarawak’s parks are terrestrial, and only three are located on the coast (Bako, Similajau, and Tanjung Datu). Of these, only Tanjung Datu has coral reefs. Sarawak’s newest and smallest park, Tanjung Datu, is of strategic importance as it lies in Sarawak’s western tip.
Coral Reefs
Malaysia’s coral reefs cover an estimated 3,600 km² mainly in Sabah and Sarawak, and on the eastern coast of Peninsular Malaysia. The coral reefs near the Sabah mainland are of significant size. These in particular include those located in Kudat (109 km²), Kota Belud (64 km²), Kota Kinabalu (54 km²), and Labuan (37 km²). However, Sarawak’s coral reefs are few and are found only on the offshore islands that lie northeast and southeast of the state.
The degree of coral diversity is highest in Eastern Malaysia, where the estimated number of species exceeds 550. In contrast, the estimated number of coral species in Peninsular Malaysia’s coral reefs exceeds 360. Coral reefs off Peninsular Malaysia are only located to the northwest and southeast of the peninsula. Unfortunately, the coral reefs in the Straits of Malacca are in poor condition (Maritime Institute Malaysia 2006).
Causes of Underinvestment and Persistent Energy Inefficiency 13 Biophysical Characteristics 13
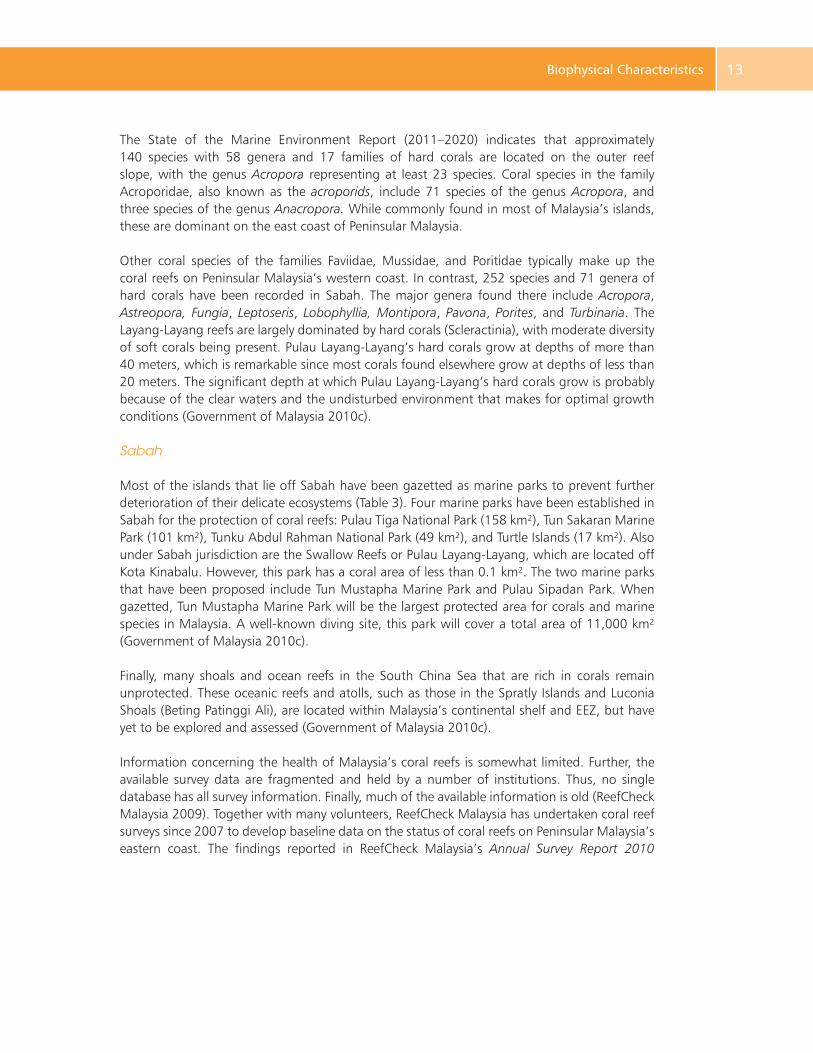
The State of the Marine Environment Report (2011–2020) indicates that approximately 140 species with 58 genera and 17 families of hard corals are located on the outer reef slope, with the genus Acropora representing at least 23 species. Coral species in the family Acroporidae, also known as the acroporids, include 71 species of the genus Acropora, and three species of the genus Anacropora. While commonly found in most of Malaysia’s islands, these are dominant on the east coast of Peninsular Malaysia.
Other coral species of the families Faviidae, Mussidae, and Poritidae typically make up the coral reefs on Peninsular Malaysia’s western coast. In contrast, 252 species and 71 genera of hard corals have been recorded in Sabah. The major genera found there include Acropora, Astreopora, Fungia, Leptoseris, Lobophyllia, Montipora, Pavona, Porites, and Turbinaria. The Layang-Layang reefs are largely dominated by hard corals (Scleractinia), with moderate diversity of soft corals being present. Pulau Layang-Layang’s hard corals grow at depths of more than 40 meters, which is remarkable since most corals found elsewhere grow at depths of less than 20 meters. The significant depth at which Pulau Layang-Layang’s hard corals grow is probably because of the clear waters and the undisturbed environment that makes for optimal growth conditions (Government of Malaysia 2010c).
Sabah
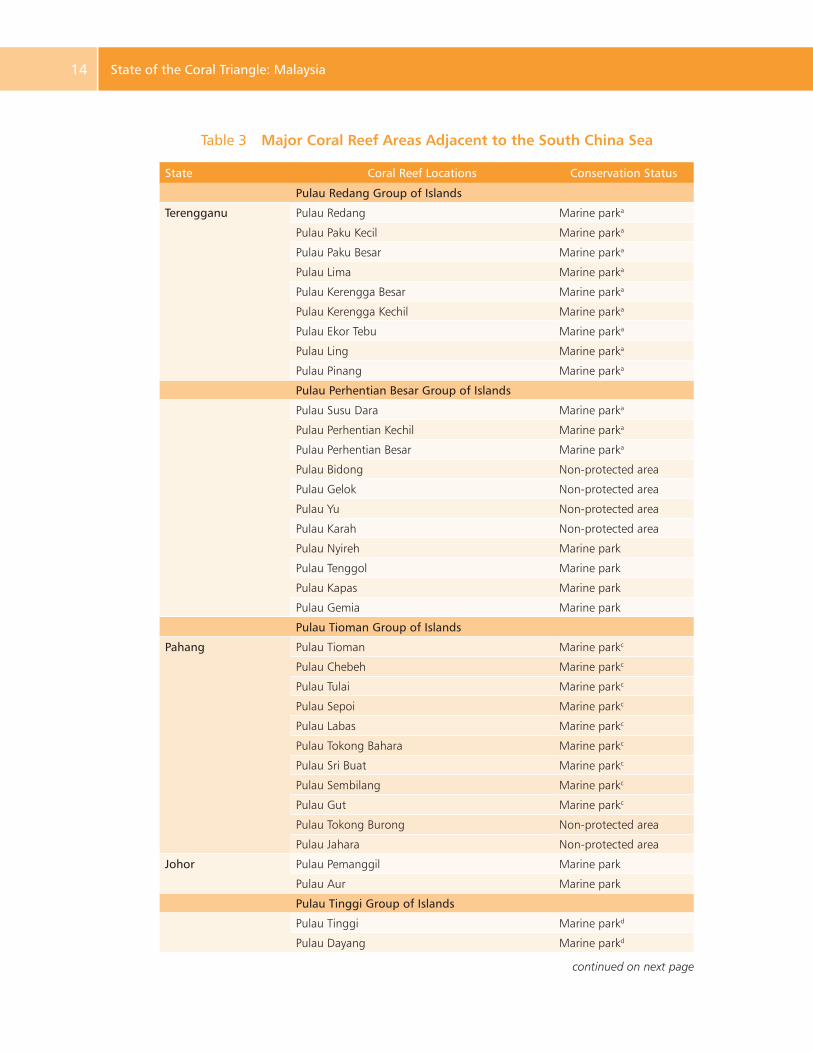
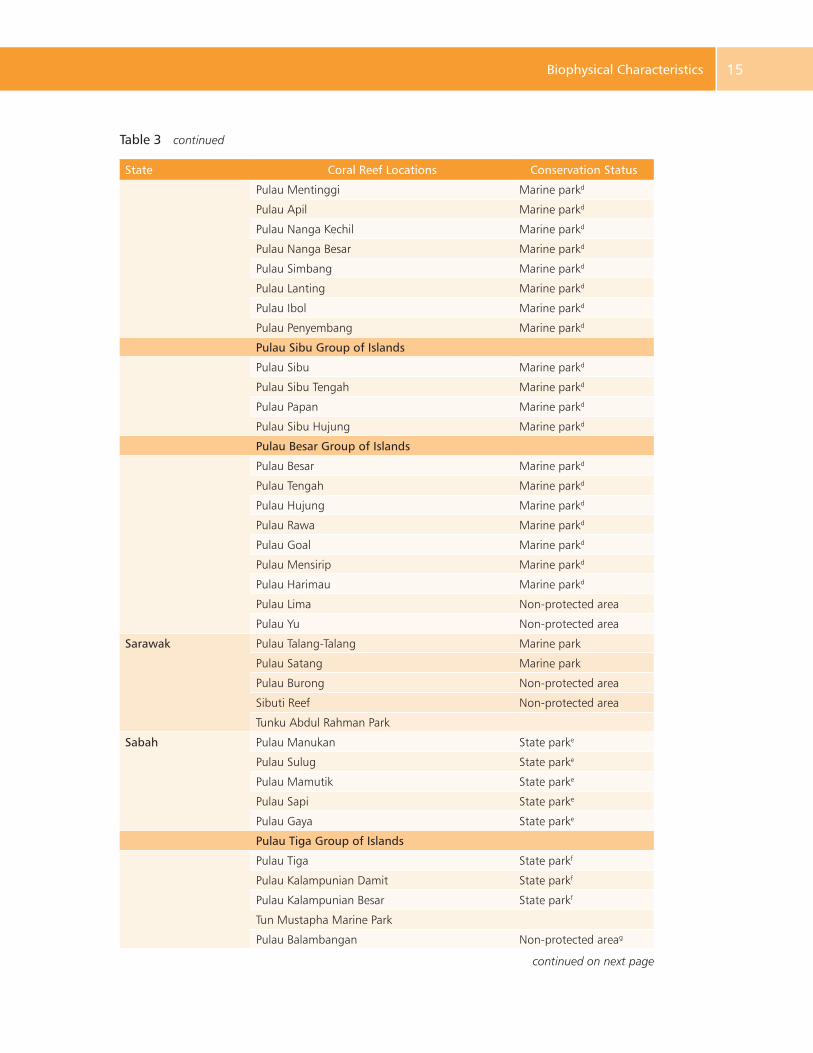
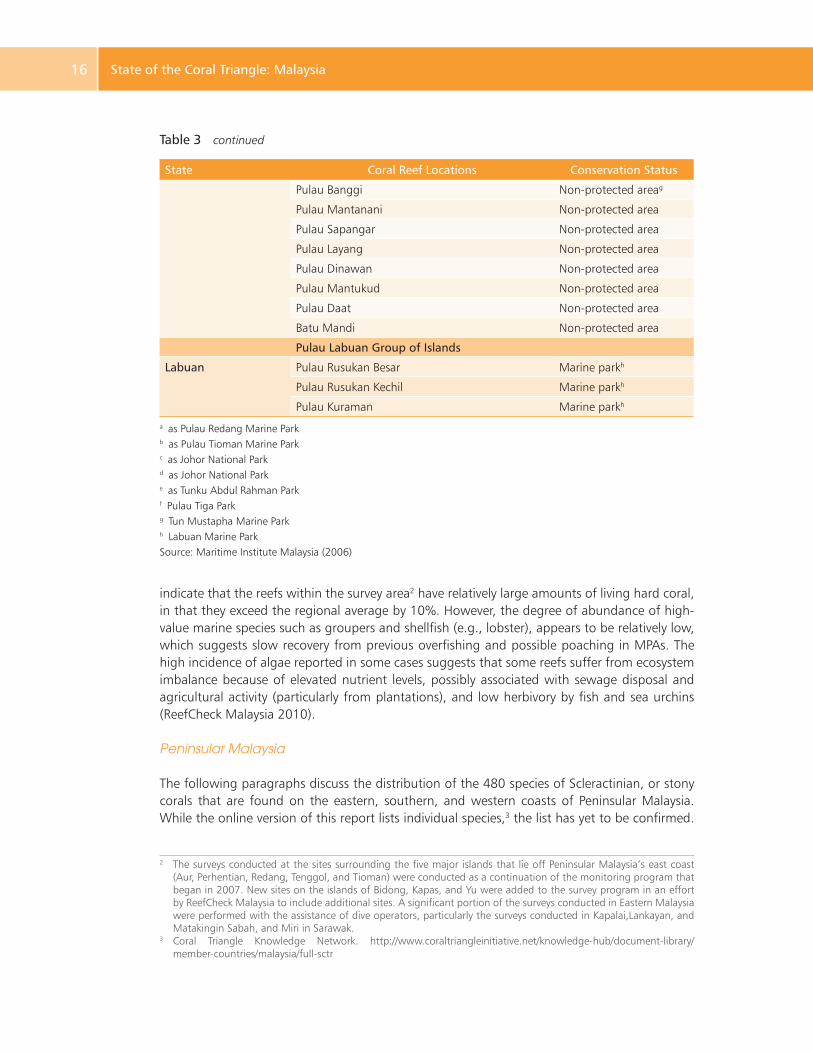
Most of the islands that lie off Sabah have been gazetted as marine parks to prevent further deterioration of their delicate ecosystems (Table 3). Four marine parks have been established in Sabah for the protection of coral reefs: Pulau Tiga National Park (158 km²), Tun Sakaran Marine Park (101 km²), Tunku Abdul Rahman National Park (49 km²), and Turtle Islands (17 km²). Also under Sabah jurisdiction are the Swallow Reefs or Pulau Layang-Layang, which are located off Kota Kinabalu. However, this park has a coral area of less than 0.1 km². The two marine parks that have been proposed include Tun Mustapha Marine Park and Pulau Sipadan Park. When gazetted, Tun Mustapha Marine Park will be the largest protected area for corals and marine species in Malaysia. A well-known diving site, this park will cover a total area of 11,000 km² (Government of Malaysia 2010c).
Finally, many shoals and ocean reefs in the South China Sea that are rich in corals remain unprotected. These oceanic reefs and atolls, such as those in the Spratly Islands and Luconia Shoals (Beting Patinggi Ali), are located within Malaysia’s continental shelf and EEZ, but have yet to be explored and assessed (Government of Malaysia 2010c).
Information concerning the health of Malaysia’s coral reefs is somewhat limited. Further, the available survey data are fragmented and held by a number of institutions. Thus, no single database has all survey information. Finally, much of the available information is old (ReefCheck Malaysia 2009). Together with many volunteers, ReefCheck Malaysia has undertaken coral reef surveys since 2007 to develop baseline data on the status of coral reefs on Peninsular Malaysia’s eastern coast. The findings reported in ReefCheck Malaysia’s Annual Survey Report 2010
Same Energy, More Power14 State of the Coral Triangle: Malaysia14
Table 3 Major Coral Reef Areas Adjacent to the South China Sea
State Coral Reef Locations Conservation Status
Pulau Redang Group of Islands
Terengganu Pulau Redang Marine parka
Pulau Paku Kecil Marine parka
Pulau Paku Besar Marine parka
Pulau Lima Marine parka
Pulau Kerengga Besar Marine parka
Pulau Kerengga Kechil Marine parka
Pulau Ekor Tebu Marine parka
Pulau Ling Marine parka
Pulau Pinang Marine parka
Pulau Perhentian Besar Group of Islands
Pulau Susu Dara Marine parka
Pulau Perhentian Kechil Marine parka
Pulau Perhentian Besar Marine parka
Pulau Bidong Non-protected area
Pulau Gelok Non-protected area
Pulau Yu Non-protected area
Pulau Karah Non-protected area
Pulau Nyireh Marine park
Pulau Tenggol Marine park
Pulau Kapas Marine park
Pulau Gemia Marine park
Pulau Tioman Group of Islands
Pahang Pulau Tioman Marine parkc
Pulau Chebeh Marine parkc
Pulau Tulai Marine parkc
Pulau Sepoi Marine parkc
Pulau Labas Marine parkc
Pulau Tokong Bahara Marine parkc
Pulau Sri Buat Marine parkc
Pulau Sembilang Marine parkc
Pulau Gut Marine parkc
Pulau Tokong Burong Non-protected area
Pulau Jahara Non-protected area
Johor Pulau Pemanggil Marine park
Pulau Aur Marine park
Pulau Tinggi Group of Islands
Pulau Tinggi Marine parkd
Pulau Dayang Marine parkd
continued on next page
Causes of Underinvestment and Persistent Energy Inefficiency 15 Biophysical Characteristics 15
State Coral Reef Locations Conservation Status
Pulau Mentinggi Marine parkd
Pulau Apil Marine parkd
Pulau Nanga Kechil Marine parkd
Pulau Nanga Besar Marine parkd
Pulau Simbang Marine parkd
Pulau Lanting Marine parkd
Pulau Ibol Marine parkd
Pulau Penyembang Marine parkd
Pulau Sibu Group of Islands
Pulau Sibu Marine parkd
Pulau Sibu Tengah Marine parkd
Pulau Papan Marine parkd
Pulau Sibu Hujung Marine parkd
Pulau Besar Group of Islands
Pulau Besar Marine parkd
Pulau Tengah Marine parkd
Pulau Hujung Marine parkd
Pulau Rawa Marine parkd
Pulau Goal Marine parkd
Pulau Mensirip Marine parkd
Pulau Harimau Marine parkd
Pulau Lima Non-protected area
Pulau Yu Non-protected area
Sarawak Pulau Talang-Talang Marine park
Pulau Satang Marine park
Pulau Burong Non-protected area
Sibuti Reef Non-protected area
Tunku Abdul Rahman Park
Sabah Pulau Manukan State parke
Pulau Sulug State parke
Pulau Mamutik State parke
Pulau Sapi State parke
Pulau Gaya State parke
Pulau Tiga Group of Islands
Pulau Tiga State parkf
Pulau Kalampunian Damit State parkf
Pulau Kalampunian Besar State parkf
Tun Mustapha Marine Park
Pulau Balambangan Non-protected areag
continued on next page
Table 3 continued
Same Energy, More Power16 State of the Coral Triangle: Malaysia16
State Coral Reef Locations Conservation Status
Pulau Banggi Non-protected areag
Pulau Mantanani Non-protected area
Pulau Sapangar Non-protected area
Pulau Layang Non-protected area
Pulau Dinawan Non-protected area
Pulau Mantukud Non-protected area
Pulau Daat Non-protected area
Batu Mandi Non-protected area
Pulau Labuan Group of Islands
Labuan Pulau Rusukan Besar Marine parkh
Pulau Rusukan Kechil Marine parkh
Pulau Kuraman Marine parkh
a as Pulau Redang Marine Parkb as Pulau Tioman Marine Parkc as Johor National Parkd as Johor National Parke as Tunku Abdul Rahman Parkf Pulau Tiga Parkg Tun Mustapha Marine Parkh Labuan Marine ParkSource: Maritime Institute Malaysia (2006)
indicate that the reefs within the survey area2 have relatively large amounts of living hard coral, in that they exceed the regional average by 10%. However, the degree of abundance of high-value marine species such as groupers and shellfish (e.g., lobster), appears to be relatively low, which suggests slow recovery from previous overfishing and possible poaching in MPAs. The high incidence of algae reported in some cases suggests that some reefs suffer from ecosystem imbalance because of elevated nutrient levels, possibly associated with sewage disposal and agricultural activity (particularly from plantations), and low herbivory by fish and sea urchins (ReefCheck Malaysia 2010).
Peninsular Malaysia
The following paragraphs discuss the distribution of the 480 species of Scleractinian, or stony corals that are found on the eastern, southern, and western coasts of Peninsular Malaysia. While the online version of this report lists individual species,3 the list has yet to be confirmed.
2 The surveys conducted at the sites surrounding the five major islands that lie off Peninsular Malaysia’s east coast (Aur, Perhentian, Redang, Tenggol, and Tioman) were conducted as a continuation of the monitoring program that began in 2007. New sites on the islands of Bidong, Kapas, and Yu were added to the survey program in an effort by ReefCheck Malaysia to include additional sites. A significant portion of the surveys conducted in Eastern Malaysia were performed with the assistance of dive operators, particularly the surveys conducted in Kapalai,Lankayan, and Matakingin Sabah, and Miri in Sarawak.
3 Coral Triangle Knowledge Network. http://www.coraltriangleinitiative.net/knowledge-hub/document-library/ member-countries/malaysia/full-sctr
Table 3 continued
Causes of Underinvestment and Persistent Energy Inefficiency 17 Biophysical Characteristics 17
Nevertheless, in the context of the Coral Triangle, the species count for Peninsular Malaysia is of significant magnitude. In all, 431 species are found on the east coast, 245 species on the south coast, and 63 species on the west coast.
East coast. In 1978, a team of researchers surveyed coral reefs on Peninsular Malaysia’s east coast. This survey included sites at Pulau Besar, Pulau Gual/Harimau, Pulau Mensirip, Pulau Rawa, Pulau Sembilang/Seri Buat, Pulau Tengah, Pulau Tinggi/Mentigi, Pulau Tioman, and Pulau Tulai. A total of 156 Scleractinian coral species were recorded. However, this number excludes the “blue coral,” three species of fire coral, four species of unidentified Porites sp., and seven other Scleractinian corals that were not fully described (Affendi and Faedzul 2011).
South coast. In October 2008, a biological resource survey at Middle Rocks, Johor (Yusuf et al. 2009) found 203 species of Scleractinian corals. This result and earlier research findings dating back to 1956 indicate total Scleractinian coral diversity of 245 species in this area.
West coast. During the second Xarifa expedition of 1957–1958, coral samples representing 38 species of Scleractinian corals were collected from Jarak Island, Kepulauan Sembilan (Lalang, Rumbia, and Saga islands); and Perak Island. In a 1976 survey at Cape Rachadon, Port Dickson, Negeri Sembilan, 34 additional species were recorded (excluding the fire coral Millepora platyphylla), making a total of 63 Scleractinian coral species (Affendi and Faedzul 2011).
One of the more extensive coral diversity studies was conducted in 2000. Commissioned by the Marine Parks Department, this study was performed by Coral Cay Conservation Ltd (Harborne et al. 2000). This study surveyed three marine park areas on Peninsular Malaysia’s east coast: Pulau Redang Marine Park, Pulau Tinggi Marine Park, and Pulau Tioman Marine Park. This study recorded 202 Scleractinian coral species, however, excluding 14 species that were not fully described, 1 species of “blue coral,” and 4 species of fire coral. This study added 119 species to the list of Scleractinian corals found in Peninsular Malaysia.
In 2005, the Malaysia Coral Reef Conservation Project reported the results of their 2003 study of Pulau Perhentian. This report listed 88 Scleractinian coral species, excluding the “blue coral,” and 2 species of fire coral.
In 2004, an extensive survey of Scleractinian corals was performed at Teluk Tekek, Pulau Tioman (Affendi et al. 2005). This study listed 221 species (excluding 6 species not fully described, the “blue coral,” and 2 species of fire coral). Of these, 17 species of Scleractinian corals found by the study are considered rare. Another survey at the same island was performed along Kampung Paya through to Kampung Genting in 2007 (Affendi et al. 2007). This study documented 291 Scleractinian coral species (excluding the “blue coral”). Based on all of these studies mentioned above, Scleractinian coral diversity on Peninsular Malaysia’s eastern coast currently stands at 431 species.
Sabah
Sabah is home to 75% of Malaysia’s reefs (Burke et al. 2002). A total of 471 species, 79 genera, and 21 families of hard corals (including 4 families of non-Scleractinian corals) have been recorded in Sabah. However, most coral reef studies in Sabah are works-in-progress, and thus require extensive verification.
Same Energy, More Power18 State of the Coral Triangle: Malaysia18
From the information available at this writing, the number of coral species is highest at the Semporna reef complex (269 species). The next highest number is found in the Banggi group of islands (238 species), followed by Darvel Bay (237 species). All three of these sites are located off Sabah’s eastern coast.
Functions and Importance
There are three major types of coral reefs: atoll, fringing, and patch. Most of Malaysia’s coral reefs are of the fringing type, with the exception of Pulau Layang-Layang in Peninsular Malaysia, which is an atoll. As Pulau Layang-Layang’s reefs are pristine, they support various corals and up to 600 coral reef fish species, more than any other site in Peninsular Malaysia. The major families of reef fish found there are Chaetodontids, Labrids, Pomacanthids, Pomacentrids, Scarids, and Serranids. Chaetodontids is the species most commonly used as an indicator of reef health (Maritime Institute Malaysia 2006).
In addition to reef fishes, many invertebrate organisms live in reef areas. Among these, seven of the nine giant clam species from the genera Hippopus and Tridacna live in the water surrounding islands in Malaysia. Of these, four species (H. hippopus, T. crocea, T. maxima, and T. squamosa) are found in Peninsular Malaysia’s eastern coast. Together with these, three additional species are found in Sabah (T. derasa, T. gigas, and H. porcellanus) (Maritime Institute Malaysia 2006). While other coral and non-coral associated species live in Malaysia’s coral communities, these are still under research, and are thus only described in a few publications.
Commercial and pharmaceutical species, such as sea cucumbers from the families Holothuridae and Stichopodidae, are used in traditional medicines. Approximately 44 species of this type have been recorded in Malaysia’s marine parks (Maritime Institute Malaysia 2006).
Coral reefs are also nurseries and breeding grounds for both pelagic and migratory fish species, including fusiliers, groupers, parrot fishes, rabbit fishes, snappers, and yellow fin tuna (Thunnus albacores).They are a direct source of food and income for the human communities that live adjacent to them. Coral reefs also help maintain the health of mangrove forests and seagrass communities on which human communities indirectly depend, and protect the shoreline from erosion and direct damage by storms.
While coral reefs are known to be a significant source of tourism revenue, the fact that this revenue would be lost if their health is not maintained is often overlooked. In fact, in 2003, the conservation charges collected for entrance to Malaysia’s marine parks totaled RM1 million. During that year alone, these parks attracted 778,482 foreign visitors and 820,116 domestic tourists (Maritime Institute Malaysia 2006). Further, these statistics represent a lower bound for the variables they represent, as collection of such charges and fees is not perfectly enforced. In addition to being a potential source of new pharmaceutical products, coral reefs provide aesthetic, religious, and spiritual value to domestic and foreign human populations.
Threats
The 2008 edition of Status of Coral Reefs of the World reported a general decline in the health of coral reefs at monitoring sites in Malaysia, in that the coral coverage at these sites was previously classified as “very good” or “good” (Tun et al. 2008). Threats to the ecological health of coral
Causes of Underinvestment and Persistent Energy Inefficiency 19 Biophysical Characteristics 19
reefs include destructive fishing practices, overfishing, sedimentation, and damage from coastal development. However, the degree to which each of these threatens coral-reef health varies with the geographic location concerned. In Peninsular Malaysia, agricultural development poses a significant threat to coral-reef health by increasing rates of nutrient runoff and sedimentation. This is particularly true of some of the coral reefs on Peninsular Malaysia’s west coast, as seasonal macro-algae blooms are now occurring there (ReefCheck Malaysia 2009).
Destructive fishing practices, such as using cyanide to kill reef fish, is more prevalent In Eastern Malaysia than in Peninsular Malaysia. This is particularly true of Sabah, where more than 68% of coral reefs have been damaged by cyanide (Government of Malaysia 2010c). Cyanide fishing is particularly damaging because its impact is non-specific. As a result, it kills valuable fish species, such as groupers, snappers, and wrasses, all of which are a significant source of revenue for the live fish trade. This is true of the entire area from Kudat, out of Marudu Bay in northeastern Sabah, to Banggi Island, and to Labuan (Government of Malaysia 2010c).
In Sarawak, the major threat to the health of reefs near the Miri River is the rate at which river sediment is deposited. This impacts 20%–30% of the live coral cover there, and causes significant algal growth (ReefCheck Malaysia 2009).
Over the past 30 years, fish stocks have been declining in nearly all Southeast Asian countries, largely a result of overfishing, itself a response to rapid increases in demand for food by the region’s burgeoning coastal population. This is a particularly perverse outcome, as the natural response to declining fish stocks is a shift toward more efficient means of increasing fish harvests. Unfortunately, this often means using cyanide, dynamite, or other destructive fishing practices to increase the size of fish kills. As such practices imperil or even destroy coral reef ecosystems, they accelerate the demise of the fish stocks that they so efficiently target in the short term.
A second impact of rapid coastal population growth is equally rapid growth in human settlements. While negative impacts on coral reefs similarly result from expanding industrial activity or building tourist-related infrastructure, the result is the same: removal of forest cover. This increases the rate at which sediment is deposited on coral reefs, which in turn increasingly blocks the sunlight on which coral growth depends. Even more damaging to the health of coral reefs is the direct removal of coral reef substrate for use as a construction material.
Tourist-related activity within Malaysia’s MPAs negatively impacts the country’s coral reefs, as it increases the rate at which grease, greywater, oil, and sewage are discharged, thus accelerating damage to coral reefs from pollution (Government of Malaysia 2010c). In short, more than 85% of Malaysia’s coral reefs are threatened in one way or another. Table 4 identifies the threats to Malaysia’s coral reef, and ranks the intensity of these threats for the eastern and western coasts of Peninsular Malaysia, and for Sabah and Sarawak taken together.
The State of the Marine Environment Report 2010 identifies several threats to the health of Malaysia’s coral reefs:
(i) Comprehensive surveys of both soft and hard coral reef resources are lacking.(ii) Manpower for enforcing rules and regulations for protecting the biodiversity of coral
reefs in Malaysia’s marine parks is insufficient.
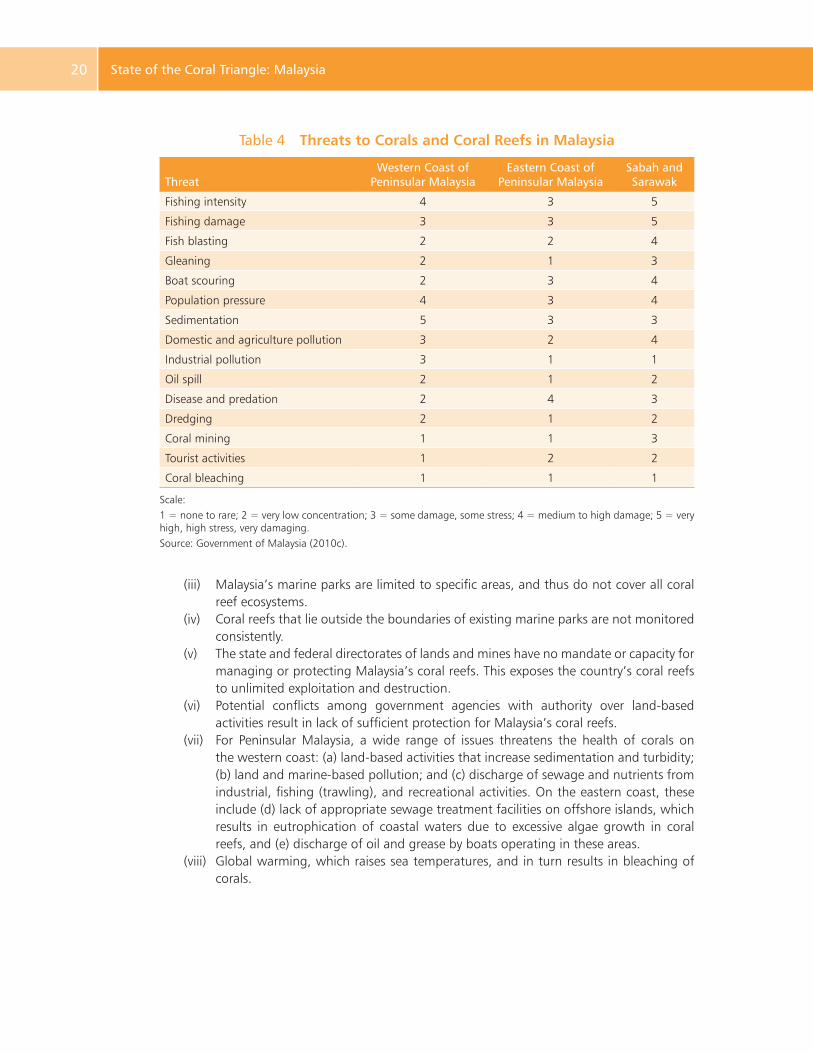
Same Energy, More Power20 State of the Coral Triangle: Malaysia20
Table 4 Threats to Corals and Coral Reefs in Malaysia
ThreatWestern Coast of
Peninsular MalaysiaEastern Coast of
Peninsular MalaysiaSabah and Sarawak
Fishing intensity 4 3 5
Fishing damage 3 3 5
Fish blasting 2 2 4
Gleaning 2 1 3
Boat scouring 2 3 4
Population pressure 4 3 4
Sedimentation 5 3 3
Domestic and agriculture pollution 3 2 4
Industrial pollution 3 1 1
Oil spill 2 1 2
Disease and predation 2 4 3
Dredging 2 1 2
Coral mining 1 1 3
Tourist activities 1 2 2
Coral bleaching 1 1 1
Scale:1 = none to rare; 2 = very low concentration; 3 = some damage, some stress; 4 = medium to high damage; 5 = very high, high stress, very damaging.Source: Government of Malaysia (2010c).
(iii) Malaysia’s marine parks are limited to specific areas, and thus do not cover all coral reef ecosystems.
(iv) Coral reefs that lie outside the boundaries of existing marine parks are not monitored consistently.
(v) The state and federal directorates of lands and mines have no mandate or capacity for managing or protecting Malaysia’s coral reefs. This exposes the country’s coral reefs to unlimited exploitation and destruction.
(vi) Potential conflicts among government agencies with authority over land-based activities result in lack of sufficient protection for Malaysia’s coral reefs.
(vii) For Peninsular Malaysia, a wide range of issues threatens the health of corals on the western coast: (a) land-based activities that increase sedimentation and turbidity; (b) land and marine-based pollution; and (c) discharge of sewage and nutrients from industrial, fishing (trawling), and recreational activities. On the eastern coast, these include (d) lack of appropriate sewage treatment facilities on offshore islands, which results in eutrophication of coastal waters due to excessive algae growth in coral reefs, and (e) discharge of oil and grease by boats operating in these areas.
(viii) Global warming, which raises sea temperatures, and in turn results in bleaching of corals.
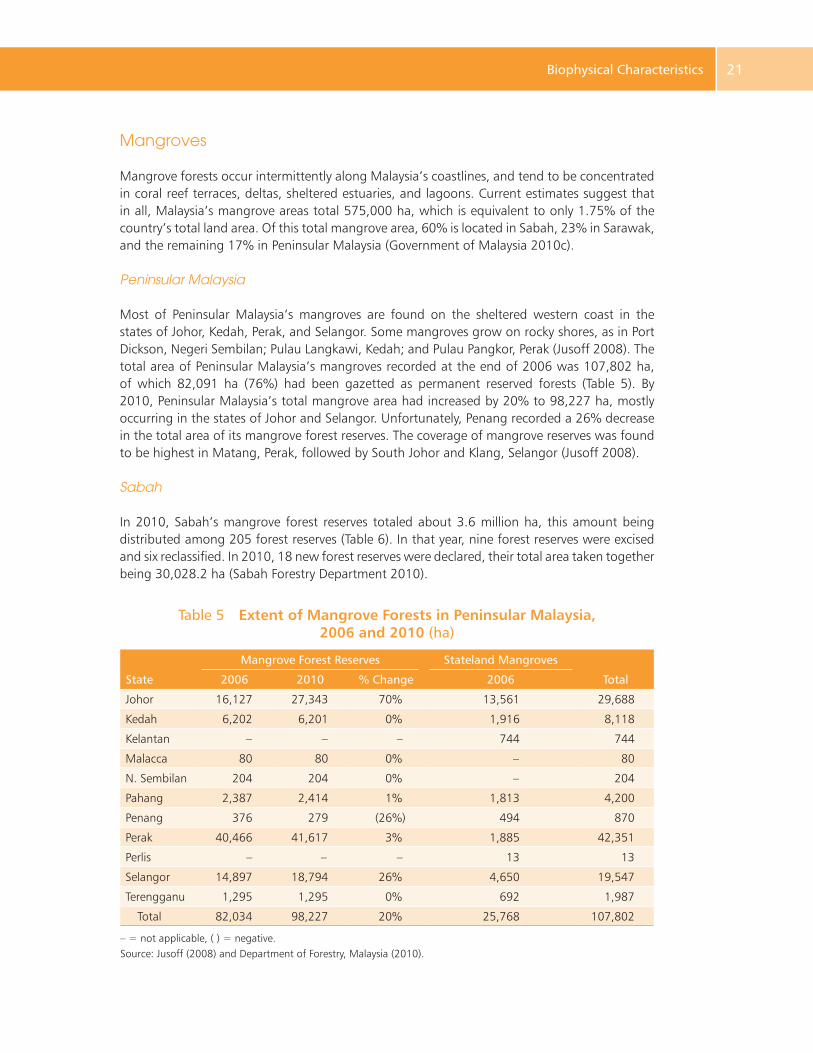
Causes of Underinvestment and Persistent Energy Inefficiency 21 Biophysical Characteristics 21
Mangroves
Mangrove forests occur intermittently along Malaysia’s coastlines, and tend to be concentrated in coral reef terraces, deltas, sheltered estuaries, and lagoons. Current estimates suggest that in all, Malaysia’s mangrove areas total 575,000 ha, which is equivalent to only 1.75% of the country’s total land area. Of this total mangrove area, 60% is located in Sabah, 23% in Sarawak, and the remaining 17% in Peninsular Malaysia (Government of Malaysia 2010c).
Peninsular Malaysia
Most of Peninsular Malaysia’s mangroves are found on the sheltered western coast in the states of Johor, Kedah, Perak, and Selangor. Some mangroves grow on rocky shores, as in Port Dickson, Negeri Sembilan; Pulau Langkawi, Kedah; and Pulau Pangkor, Perak (Jusoff 2008). The total area of Peninsular Malaysia’s mangroves recorded at the end of 2006 was 107,802 ha, of which 82,091 ha (76%) had been gazetted as permanent reserved forests (Table 5). By 2010, Peninsular Malaysia’s total mangrove area had increased by 20% to 98,227 ha, mostly occurring in the states of Johor and Selangor. Unfortunately, Penang recorded a 26% decrease in the total area of its mangrove forest reserves. The coverage of mangrove reserves was found to be highest in Matang, Perak, followed by South Johor and Klang, Selangor (Jusoff 2008).
Sabah
In 2010, Sabah’s mangrove forest reserves totaled about 3.6 million ha, this amount being distributed among 205 forest reserves (Table 6). In that year, nine forest reserves were excised and six reclassified. In 2010, 18 new forest reserves were declared, their total area taken together being 30,028.2 ha (Sabah Forestry Department 2010).
Table 5 Extent of Mangrove Forests in Peninsular Malaysia, 2006 and 2010 (ha)
State
Mangrove Forest Reserves Stateland Mangroves
Total2006 2010 % Change 2006
Johor 16,127 27,343 70% 13,561 29,688
Kedah 6,202 6,201 0% 1,916 8,118
Kelantan – – – 744 744
Malacca 80 80 0% – 80
N. Sembilan 204 204 0% – 204
Pahang 2,387 2,414 1% 1,813 4,200
Penang 376 279 (26%) 494 870
Perak 40,466 41,617 3% 1,885 42,351
Perlis – – – 13 13
Selangor 14,897 18,794 26% 4,650 19,547
Terengganu 1,295 1,295 0% 692 1,987
Total 82,034 98,227 20% 25,768 107,802
– = not applicable, ( ) = negative.Source: Jusoff (2008) and Department of Forestry, Malaysia (2010).
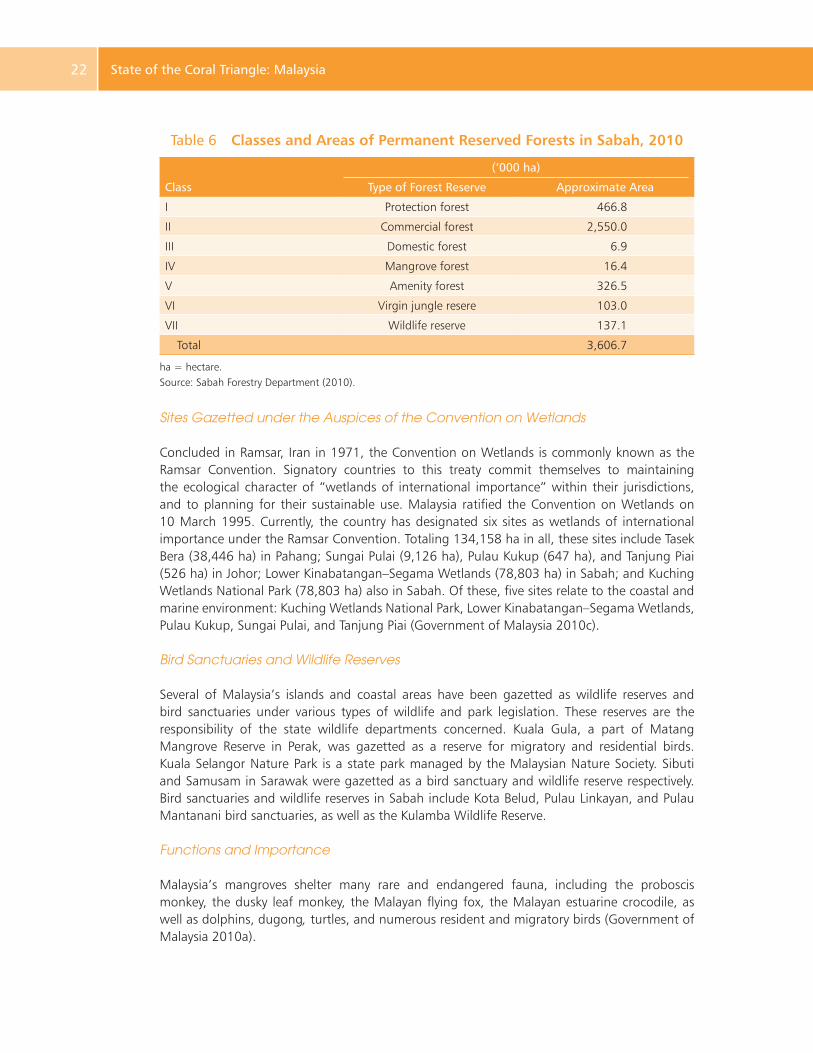
Same Energy, More Power22 State of the Coral Triangle: Malaysia22
Sites Gazetted under the Auspices of the Convention on Wetlands
Concluded in Ramsar, Iran in 1971, the Convention on Wetlands is commonly known as the Ramsar Convention. Signatory countries to this treaty commit themselves to maintaining the ecological character of “wetlands of international importance” within their jurisdictions, and to planning for their sustainable use. Malaysia ratified the Convention on Wetlands on 10 March 1995. Currently, the country has designated six sites as wetlands of international importance under the Ramsar Convention. Totaling 134,158 ha in all, these sites include Tasek Bera (38,446 ha) in Pahang; Sungai Pulai (9,126 ha), Pulau Kukup (647 ha), and Tanjung Piai (526 ha) in Johor; Lower Kinabatangan–Segama Wetlands (78,803 ha) in Sabah; and Kuching Wetlands National Park (78,803 ha) also in Sabah. Of these, five sites relate to the coastal and marine environment: Kuching Wetlands National Park, Lower Kinabatangan–Segama Wetlands, Pulau Kukup, Sungai Pulai, and Tanjung Piai (Government of Malaysia 2010c).
Bird Sanctuaries and Wildlife Reserves
Several of Malaysia’s islands and coastal areas have been gazetted as wildlife reserves and bird sanctuaries under various types of wildlife and park legislation. These reserves are the responsibility of the state wildlife departments concerned. Kuala Gula, a part of Matang Mangrove Reserve in Perak, was gazetted as a reserve for migratory and residential birds. Kuala Selangor Nature Park is a state park managed by the Malaysian Nature Society. Sibuti and Samusam in Sarawak were gazetted as a bird sanctuary and wildlife reserve respectively. Bird sanctuaries and wildlife reserves in Sabah include Kota Belud, Pulau Linkayan, and Pulau Mantanani bird sanctuaries, as well as the Kulamba Wildlife Reserve.
Functions and Importance
Malaysia’s mangroves shelter many rare and endangered fauna, including the proboscis monkey, the dusky leaf monkey, the Malayan flying fox, the Malayan estuarine crocodile, as well as dolphins, dugong, turtles, and numerous resident and migratory birds (Government of Malaysia 2010a).
Table 6 Classes and Areas of Permanent Reserved Forests in Sabah, 2010
Class
(‘000 ha)
Type of Forest Reserve Approximate Area
I Protection forest 466.8
II Commercial forest 2,550.0
III Domestic forest 6.9
IV Mangrove forest 16.4
V Amenity forest 326.5
VI Virgin jungle resere 103.0
VII Wildlife reserve 137.1
Total 3,606.7
ha = hectare.Source: Sabah Forestry Department (2010).
Causes of Underinvestment and Persistent Energy Inefficiency 23 Biophysical Characteristics 23
Thus far, 41 true mangrove species belonging to 13 families have been recorded in Malaysia, an amount that represents two-thirds of the world’s mangrove species. Thus, due to the significant degree of biodiversity they contain, Malaysia’s mangroves are of global importance. Further, Malaysia’s mangrove areas are home to more than 100 associated or back mangrove species. As for floral diversity, no endemic species have been recorded, and most of the common species are widely distributed. The distribution of rare species such as Aegiceras floridum, Algaia cucullata, Bruguiera hainessi, Heritiera fornes, Heritiera globosa, Osbornia octodonta, and Sonneratia griffithii is quite restricted. Finally, all of these species are at serious risk of extinction because of localized threats (Government of Malaysia 2010c).
The wide range of ecological services that mangrove forests provide to human communities makes their protection and conservation a necessary part of sustainable use of marine resources. These services include acting as a nursery for shrimp and fish, which makes them an important part of the food chain, which in turn indirectly makes them a source of food. However, residents of some coastal communities consume mangrove propagules directly as food, and use the wood obtained from them as construction material or for firewood. One of the values of mangrove forests that is often overlooked results from their adaptability. For example, the reproductive systems of mangroves allow their roots to physically adapt to increased wave intensity. Similarly, mangroves are capable of physiologically adapting to increases in salinity levels, and decreases in the level of oxygen available to them. Mangrove forests are thus a tool for minimizing the negative impacts of both climate change and sea-level rise (Government of Malaysia 2010a).
The east coast of Sabah is home to more than 300,000 ha of mangrove forests, many of which are associated with extended mudflats. In addition to being important wintering sites for some species, these mudflats are stopovers for birds that migrate along the East Asian–Australasian Flyway.
Peninsular Malaysia is likewise home to several important stopover sites for migratory birds. Such sites include Benut (Johor), Kapar (Selangor), Kuala Gula (Perak), Kukup (Johor), Parit Jawa (Johor), Pontian (Johor), and Tanjung Piai (Johor). These areas support approximately 300 species of migratory and resident birds.
The southern part of Sabah’s Klias Peninsular has extensive areas of tidal wetlands that are home to mangroves and nipah, while freshwater wetlands are found in coastal areas of Sabah’s western coast, particularly at Beaufort, Kota Belud, and Papar (State of Marine Environment Report, Government of Malaysia [2010a]).
Fireflies, which usually gather in Peninsular Malaysia’s river estuaries, are another major tourism attraction for Kampong Kuantan, Selangor; Kampong Yakyoh, Terengganu; the Kelantan Delta; Kuala Linggi, Negeri Sembilan/Melaka; and Sungai Lebam, Johor (Jusoff 2008). These areas are thus potential niche ecotourism sites, which if developed successfully, could generate a significant income stream for residents of local communities (Government of Malaysia 2010a).
Threats
Degradation of mangrove forests for the most part results from irresponsible or unsustainable development of coastal areas, which is in turn driven by population growth. This in particular includes land conversion or reclamation for purposes of expanding economic activity relating to
Same Energy, More Power24 State of the Coral Triangle: Malaysia24
agriculture, aquaculture, mining, ports, urban settlements, or tourism. Such expansion brings with it additional threats to the health of mangrove forests from development of physical infrastructure, coastal pollution from oil spills, and discharge of domestic and industrial waste (Government of Malaysia 2010c).
Malaysia has lost approximately 36% of its mangrove forests and 22% of its mangrove forest reserves to unsustainable human use of mangroves and unsustainable rates of natural resource exploitation. The State of Kedah has lost 1,500 ha of mangroves to rice production, and Selangor, 7,500 ha (30%) of its total mangrove area to coconut and oil palm plantations. Mangrove forests have been cleared in Kedah and Selangor for purposes of expanding prawn aquaculture (Penaeus monodon and P. merguiensis) and fish (siakap, Lates calcarifer; and snappers, Lutjanus spp.). Similarly, ports such as Port Klang, North Port, and West Port have been constructed on land reclaimed by destroying mangrove forests. The largest mangrove area cleared for development thus far is on Lumut Island, where the total loss of mangrove forest is estimated at 4,349 ha (Government of Malaysia 2010a).
In 1983–1986, Malaysia’s overall water bird population declined by 22%. However, this decline was not uniform across the country. In 2004–2006, the water bird population along the coast of Perak declined by 86%, while Johor and Selangor lost 40% and 26% of their water bird populations respectively. Such losses are in all probability related to loss of mangroves, which negatively impacts coastal ecosystems, and eventually, the livelihood of traditional fishers. Losses of this type are evidenced by a 2005 survey performed in Pahang (Government of Malaysia 2010a).
Other threats to Malaysia’s mangrove forests include unsustainable rates of discharge of industrial park effluents into river systems, particularly in Perak and Selangor. Similarly, unsustainable traditional fishing methods, such as the use of empang4 in Johor and motorized push-net activity in Matang, Perak have seriously affected the populations of juvenile fishes and prawns in mangrove areas (Government of Malaysia 2010a).
Clearing of mangroves—particularly in Malaysia—results in a number of irreversible long-term negative environmental impacts. These include (i) deterioration in marine water quality; (ii) loss of nursery grounds for many commercially valuable fish species, which in turn affects recruitment to fisheries stocks and the entire marine food chain; and (iii) increases in the rate of erosion of coastal and riverine environments, which in turn necessitates significant financial investment in erosion-mitigating infrastructure (Government of Malaysia 2010a).
Seagrass
Seagrass is the only group of flowering plants or angiosperms that live in the coastal and marine environment of both temperate and tropical regions (Nurridan 2007). Seagrasses are
4 Empang parit is the traditional form of integrated aquaculture in mangrove areas. It usually consists of an unexcavated central platform that alternates between being flooded and exposed, and a canal that runs along the pond dikes where crabs, fish, and shrimp are cultured. Tidal action carries seed stock into the system and allows water to be exchanged. The forests in which empang parit is carried out are operated and managed by community residents themselves. http://courses.washington.edu/larescue/pam/4-aquaculture.pdf
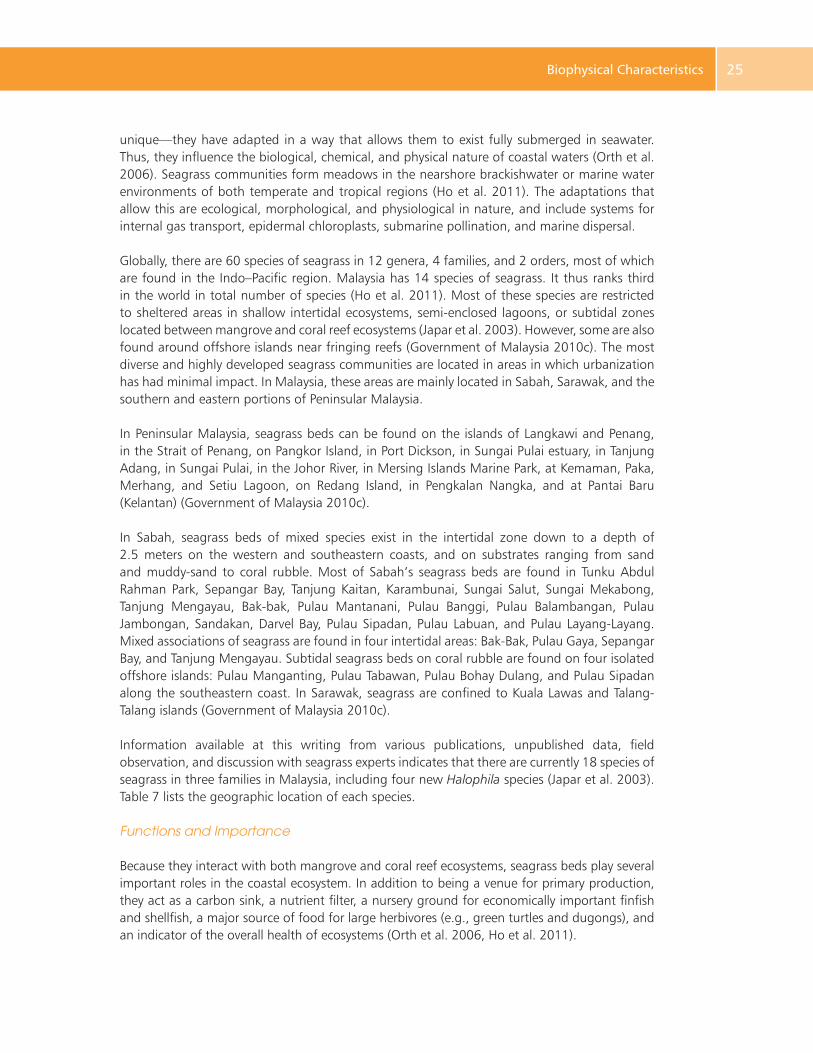
Causes of Underinvestment and Persistent Energy Inefficiency 25 Biophysical Characteristics 25
unique—they have adapted in a way that allows them to exist fully submerged in seawater. Thus, they influence the biological, chemical, and physical nature of coastal waters (Orth et al. 2006). Seagrass communities form meadows in the nearshore brackishwater or marine water environments of both temperate and tropical regions (Ho et al. 2011). The adaptations that allow this are ecological, morphological, and physiological in nature, and include systems for internal gas transport, epidermal chloroplasts, submarine pollination, and marine dispersal.
Globally, there are 60 species of seagrass in 12 genera, 4 families, and 2 orders, most of which are found in the Indo–Pacific region. Malaysia has 14 species of seagrass. It thus ranks third in the world in total number of species (Ho et al. 2011). Most of these species are restricted to sheltered areas in shallow intertidal ecosystems, semi-enclosed lagoons, or subtidal zones located between mangrove and coral reef ecosystems (Japar et al. 2003). However, some are also found around offshore islands near fringing reefs (Government of Malaysia 2010c). The most diverse and highly developed seagrass communities are located in areas in which urbanization has had minimal impact. In Malaysia, these areas are mainly located in Sabah, Sarawak, and the southern and eastern portions of Peninsular Malaysia.
In Peninsular Malaysia, seagrass beds can be found on the islands of Langkawi and Penang, in the Strait of Penang, on Pangkor Island, in Port Dickson, in Sungai Pulai estuary, in Tanjung Adang, in Sungai Pulai, in the Johor River, in Mersing Islands Marine Park, at Kemaman, Paka, Merhang, and Setiu Lagoon, on Redang Island, in Pengkalan Nangka, and at Pantai Baru (Kelantan) (Government of Malaysia 2010c).
In Sabah, seagrass beds of mixed species exist in the intertidal zone down to a depth of 2.5 meters on the western and southeastern coasts, and on substrates ranging from sand and muddy-sand to coral rubble. Most of Sabah’s seagrass beds are found in Tunku Abdul Rahman Park, Sepangar Bay, Tanjung Kaitan, Karambunai, Sungai Salut, Sungai Mekabong, Tanjung Mengayau, Bak-bak, Pulau Mantanani, Pulau Banggi, Pulau Balambangan, Pulau Jambongan, Sandakan, Darvel Bay, Pulau Sipadan, Pulau Labuan, and Pulau Layang-Layang. Mixed associations of seagrass are found in four intertidal areas: Bak-Bak, Pulau Gaya, Sepangar Bay, and Tanjung Mengayau. Subtidal seagrass beds on coral rubble are found on four isolated offshore islands: Pulau Manganting, Pulau Tabawan, Pulau Bohay Dulang, and Pulau Sipadan along the southeastern coast. In Sarawak, seagrass are confined to Kuala Lawas and Talang-Talang islands (Government of Malaysia 2010c).
Information available at this writing from various publications, unpublished data, field observation, and discussion with seagrass experts indicates that there are currently 18 species of seagrass in three families in Malaysia, including four new Halophila species (Japar et al. 2003). Table 7 lists the geographic location of each species.
Functions and Importance
Because they interact with both mangrove and coral reef ecosystems, seagrass beds play several important roles in the coastal ecosystem. In addition to being a venue for primary production, they act as a carbon sink, a nutrient filter, a nursery ground for economically important finfish and shellfish, a major source of food for large herbivores (e.g., green turtles and dugongs), and an indicator of the overall health of ecosystems (Orth et al. 2006, Ho et al. 2011).
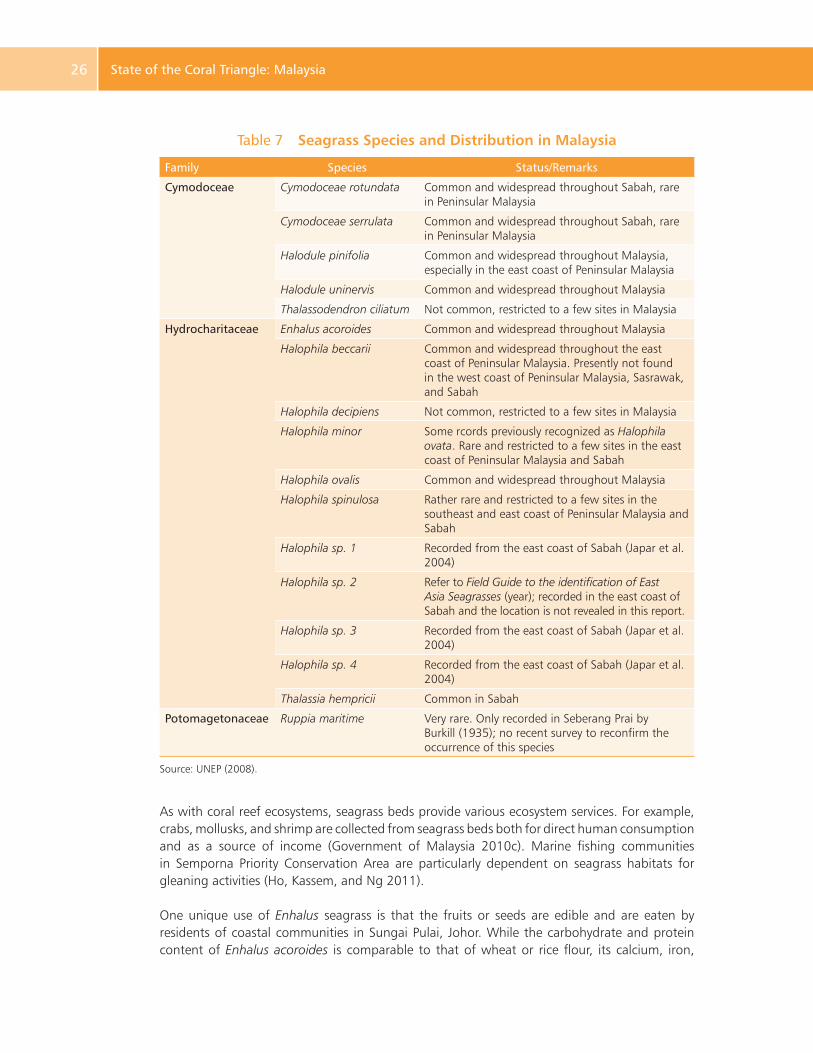
Same Energy, More Power26 State of the Coral Triangle: Malaysia26
Table 7 Seagrass Species and Distribution in Malaysia
Family Species Status/Remarks
Cymodoceae Cymodoceae rotundata Common and widespread throughout Sabah, rare in Peninsular Malaysia
Cymodoceae serrulata Common and widespread throughout Sabah, rare in Peninsular Malaysia
Halodule pinifolia Common and widespread throughout Malaysia, especially in the east coast of Peninsular Malaysia
Halodule uninervis Common and widespread throughout Malaysia
Thalassodendron ciliatum Not common, restricted to a few sites in Malaysia
Hydrocharitaceae Enhalus acoroides Common and widespread throughout Malaysia
Halophila beccarii Common and widespread throughout the east coast of Peninsular Malaysia. Presently not found in the west coast of Peninsular Malaysia, Sasrawak, and Sabah
Halophila decipiens Not common, restricted to a few sites in Malaysia
Halophila minor Some rcords previously recognized as Halophila ovata. Rare and restricted to a few sites in the east coast of Peninsular Malaysia and Sabah
Halophila ovalis Common and widespread throughout Malaysia
Halophila spinulosa Rather rare and restricted to a few sites in the southeast and east coast of Peninsular Malaysia and Sabah
Halophila sp. 1 Recorded from the east coast of Sabah (Japar et al. 2004)
Halophila sp. 2 Refer to Field Guide to the identification of East Asia Seagrasses (year); recorded in the east coast of Sabah and the location is not revealed in this report.
Halophila sp. 3 Recorded from the east coast of Sabah (Japar et al. 2004)
Halophila sp. 4 Recorded from the east coast of Sabah (Japar et al. 2004)
Thalassia hempricii Common in Sabah
Potomagetonaceae Ruppia maritime Very rare. Only recorded in Seberang Prai by Burkill (1935); no recent survey to reconfirm the occurrence of this species
Source: UNEP (2008).
As with coral reef ecosystems, seagrass beds provide various ecosystem services. For example, crabs, mollusks, and shrimp are collected from seagrass beds both for direct human consumption and as a source of income (Government of Malaysia 2010c). Marine fishing communities in Semporna Priority Conservation Area are particularly dependent on seagrass habitats for gleaning activities (Ho, Kassem, and Ng 2011).
One unique use of Enhalus seagrass is that the fruits or seeds are edible and are eaten by residents of coastal communities in Sungai Pulai, Johor. While the carbohydrate and protein content of Enhalus acoroides is comparable to that of wheat or rice flour, its calcium, iron,
Causes of Underinvestment and Persistent Energy Inefficiency 27 Biophysical Characteristics 27
and phosphorus content per unit weight is greater than either (United Nations Environment Programme [UNEP] 2008).
Threats
Seagrass communities are fragile ecosystems that can be negatively impacted by both natural weather events and human activity. Natural catastrophes such as typhoons, storm surge, and coastal erosion, in particular, can damage seagrass beds. Fortunately, typhoons and storm surges rarely strike Malaysia. However, when hurricane Greg struck Kota Kinabalu and Tunku Abdul Rahman Marine Park (Sabah) in December 1996, it significantly altered the surrounding coral reefs, seagrass beds, and adjacent areas such as Sepangar Bay and Menggatal. Similarly, the northeast monsoon that prevails November–March often causes severe coastal erosion, particularly on the islands that lie off the east coast of Peninsular Malaysia (Government of Malaysia 2010c).
Negative impacts of human origin that have affected the health of seagrass habitats in Malaysia include:
(i) sediment runoff from coastal development;(ii) elevated nutrient levels that result from direct discharge of untreated domestic and
industrial effluent;(iii) pollution caused by agrochemical runoff;(iv) sand mining, port development, and urban expansion;(v) illegal encroachment by trawlers into coastal areas;(vi) use of destructive fishing methods;(vii) traditional harvesting of fisheries resources;(viii) shipping traffic; and(ix) general pollution of the marine environment (Government of Malaysia 2010c).
Activities such as these may likewise affect the fauna and flora associated with seagrass beds. Table 8 identifies the environmental threats facing Malaysia’s major seagrass sites.
Several issues associated with degradation of Malaysia’s seagrass beds deserve attention (Government of Malaysia 2010c). The most important of these include the following:
(i) Lack of a current comprehensive survey of seagrass resources.(ii) Human activities that degrade seagrass beds, which include agrochemical runoff;
digging for polychaetes and bivalves (Hiatula solida, Meretrix meretrix); discharge of domestic and industrial effluent; dredging for shoreline stabilization and flood control, illegal trawling and push-net activity and illegal fishing in general, land-based development; land reclamation; marine transport pollution (from propeller oil, grease, and anchors); pollution from tourist- and even eco-tourist-related activities; clearing of mangroves for purposes such as expansion of aquaculture, sand mining; and uncontrolled harvesting of fishery resources by coastal inhabitants, particularly in the Straits of Malacca.
(iii) Strong currents and waves that shift sand during the northeast monsoon and erode the coastline along Peninsular Malaysia’s east coast.
(iv) Disjointed and fragmented legislation governing seagrass meadows. This includes potential conflicts between the Land and Mines Directorate and the authorities
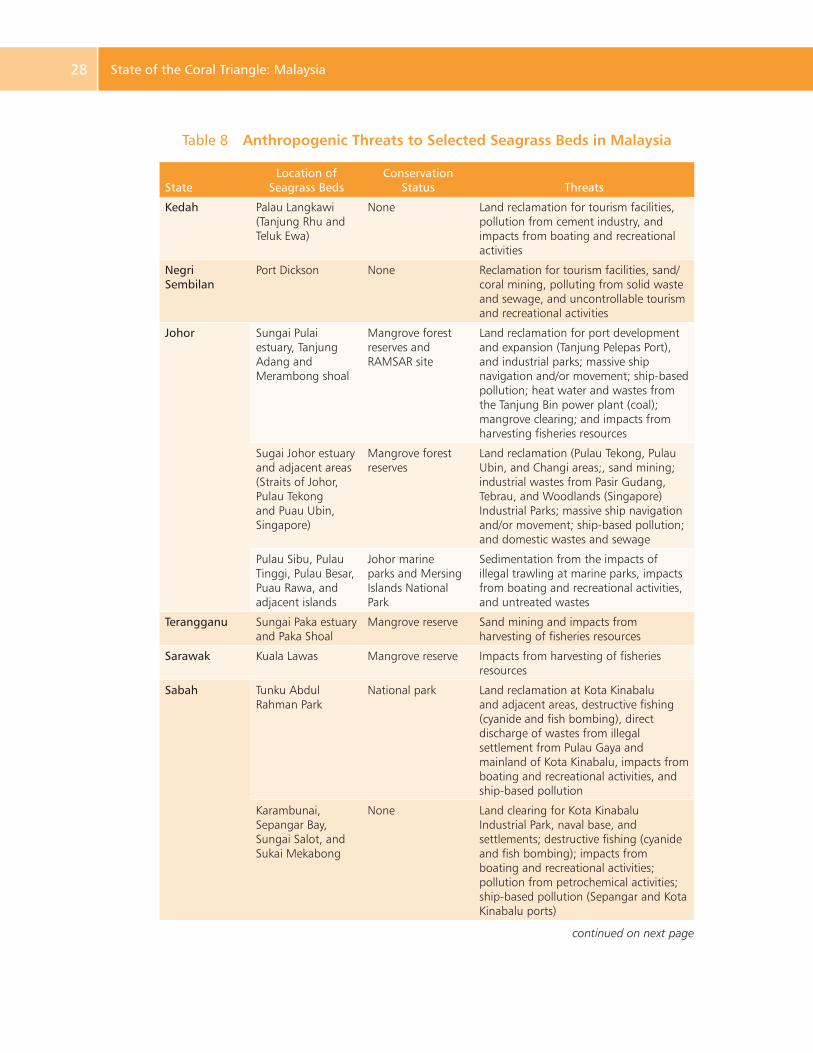
Same Energy, More Power28 State of the Coral Triangle: Malaysia28
Table 8 Anthropogenic Threats to Selected Seagrass Beds in Malaysia
StateLocation of
Seagrass BedsConservation
Status Threats
Kedah Palau Langkawi (Tanjung Rhu and Teluk Ewa)
None Land reclamation for tourism facilities, pollution from cement industry, and impacts from boating and recreational activities
Negri Sembilan
Port Dickson None Reclamation for tourism facilities, sand/coral mining, polluting from solid waste and sewage, and uncontrollable tourism and recreational activities
Johor Sungai Pulai estuary, Tanjung Adang and Merambong shoal
Mangrove forest reserves and RAMSAR site
Land reclamation for port development and expansion (Tanjung Pelepas Port), and industrial parks; massive ship navigation and/or movement; ship-based pollution; heat water and wastes from the Tanjung Bin power plant (coal); mangrove clearing; and impacts from harvesting fisheries resources
Sugai Johor estuary and adjacent areas (Straits of Johor, Pulau Tekong and Puau Ubin, Singapore)
Mangrove forest reserves
Land reclamation (Pulau Tekong, Pulau Ubin, and Changi areas;, sand mining; industrial wastes from Pasir Gudang, Tebrau, and Woodlands (Singapore) Industrial Parks; massive ship navigation and/or movement; ship-based pollution; and domestic wastes and sewage
Pulau Sibu, Pulau Tinggi, Pulau Besar, Puau Rawa, and adjacent islands
Johor marine parks and Mersing Islands National Park
Sedimentation from the impacts of illegal trawling at marine parks, impacts from boating and recreational activities, and untreated wastes
Terangganu Sungai Paka estuary and Paka Shoal
Mangrove reserve Sand mining and impacts from harvesting of fisheries resources
Sarawak Kuala Lawas Mangrove reserve Impacts from harvesting of fisheries resources
Sabah Tunku Abdul Rahman Park
National park Land reclamation at Kota Kinabalu and adjacent areas, destructive fishing (cyanide and fish bombing), direct discharge of wastes from illegal settlement from Pulau Gaya and mainland of Kota Kinabalu, impacts from boating and recreational activities, and ship-based pollution
Karambunai, Sepangar Bay, Sungai Salot, and Sukai Mekabong
None Land clearing for Kota Kinabalu Industrial Park, naval base, and settlements; destructive fishing (cyanide and fish bombing); impacts from boating and recreational activities; pollution from petrochemical activities; ship-based pollution (Sepangar and Kota Kinabalu ports)
continued on next page
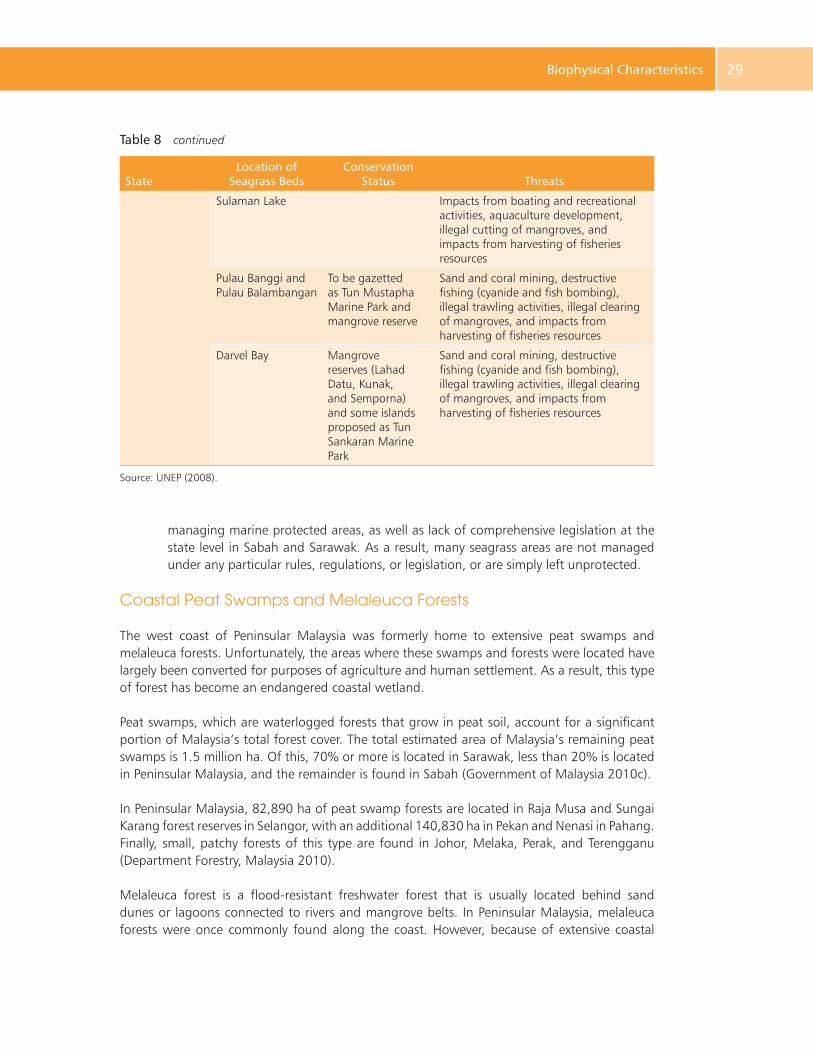
Causes of Underinvestment and Persistent Energy Inefficiency 29 Biophysical Characteristics 29
StateLocation of
Seagrass BedsConservation
Status Threats
Sulaman Lake Impacts from boating and recreational activities, aquaculture development, illegal cutting of mangroves, and impacts from harvesting of fisheries resources
Pulau Banggi and Pulau Balambangan
To be gazetted as Tun Mustapha Marine Park and mangrove reserve
Sand and coral mining, destructive fishing (cyanide and fish bombing), illegal trawling activities, illegal clearing of mangroves, and impacts from harvesting of fisheries resources
Darvel Bay Mangrove reserves (Lahad Datu, Kunak, and Semporna) and some islands proposed as Tun Sankaran Marine Park
Sand and coral mining, destructive fishing (cyanide and fish bombing), illegal trawling activities, illegal clearing of mangroves, and impacts from harvesting of fisheries resources
Source: UNEP (2008).
managing marine protected areas, as well as lack of comprehensive legislation at the state level in Sabah and Sarawak. As a result, many seagrass areas are not managed under any particular rules, regulations, or legislation, or are simply left unprotected.
Coastal Peat Swamps and Melaleuca Forests
The west coast of Peninsular Malaysia was formerly home to extensive peat swamps and melaleuca forests. Unfortunately, the areas where these swamps and forests were located have largely been converted for purposes of agriculture and human settlement. As a result, this type of forest has become an endangered coastal wetland.
Peat swamps, which are waterlogged forests that grow in peat soil, account for a significant portion of Malaysia’s total forest cover. The total estimated area of Malaysia’s remaining peat swamps is 1.5 million ha. Of this, 70% or more is located in Sarawak, less than 20% is located in Peninsular Malaysia, and the remainder is found in Sabah (Government of Malaysia 2010c).
In Peninsular Malaysia, 82,890 ha of peat swamp forests are located in Raja Musa and Sungai Karang forest reserves in Selangor, with an additional 140,830 ha in Pekan and Nenasi in Pahang. Finally, small, patchy forests of this type are found in Johor, Melaka, Perak, and Terengganu (Department Forestry, Malaysia 2010).
Melaleuca forest is a flood-resistant freshwater forest that is usually located behind sand dunes or lagoons connected to rivers and mangrove belts. In Peninsular Malaysia, melaleuca forests were once commonly found along the coast. However, because of extensive coastal
Table 8 continued
Same Energy, More Power30 State of the Coral Triangle: Malaysia30
development and conversion of land to other uses, melaleuca forests now only exist in small, patchy stands. That said, there remains significant melaleuca forest cover along the coastal road from Marang to Kemaman in Terengganu. Similarly, small areas of degraded melaleuca forest still exist in Johor, Kelantan, Melaka, and Negeri Sembilan (Government of Malaysia 2010c).
Functions and Importance
Peat swamps and melaleuca forests provide an extensive array of ecological services. They produce forestry and fishery products, mitigate the damaging impacts of floods, and supply water for agriculture and groundwater. These forests are likewise home to many commercially valuable tree species, and are the principal habitat of a wide variety of flora and fauna (Government of Malaysia 2010c). Malaysia’s waterlogged forests are likewise home to several globally endangered threatened species, including the orangutan, the proboscis monkey, the Sumatran rhinoceros, the Storm’s stork, and the wrinkled hornbill. These forests are also the principal habitat of many unique blackwater (acidic water) fish of commercial importance to the aquarium industry and as commercial food fish. Unfortunately, many of Malaysia’s peat swamp forests have been extensively logged for timber. They have likewise fallen victim to the illegal worldwide trade in wildlife (Government of Malaysia 2010c).
Threats
Agricultural development, conversion of land for establishing oil palm plantations, tin mining, and residential development all threaten the very existence of Malaysia’s waterlogged forests. Overexploitation of timber and illegal harvesting of wildlife from peat swamps also pose major environmental threats to these forests (Government of Malaysia 2010c).
Economic Value of Ecosystems and Beneficial Uses of Indicator Species
Economic Value of Coral Reef Ecosystems
Malaysia has completed the transition from an agriculture-based economy to a newly industrialized country. Immediately following independence, rubber and tin were the mainstays of the economy, following which Malaysia diversified into large-scale oil palm and rubber plantations. Agriculture and mining were thus the main contributors to national income for nearly 3 decades following independence. Then, in the mid-1980s, Malaysia began a period of rapid industrialization. By 2005, the percentage share of agriculture in gross domestic product had fallen to only 9.7%, while that of services had grown to 45.7%, and industry to 44.6% (Government of Malaysia 2010c).
Tourism has become a significant component of Malaysia’s service sector. As a result, the country’s 3,600 km² of coral reefs are an economically important ecosystem that supports a significant portion of tourism revenue (Government of Malaysia 2010c). Further, the abundance of marine flora and fauna that coral reefs support is not only a source of tourist revenue, but also a source of livelihood for residents of coastal communities, particularly in Sabah. Malaysia’s coral reefs are thus of significant importance to the national economy.
Causes of Underinvestment and Persistent Energy Inefficiency 31 Biophysical Characteristics 31
Methodologies for Economic Valuation of Malaysia’s Coral Reefs
The inherent interactions among the economic, social, and biological functions of coral reefs make it difficult to estimate their full value in monetary terms. Thus, it is unsurprising that few studies have attempted to estimate the economic value of Malaysia’s coral reef resources in a comprehensive manner. Maritime Institute Malaysia (2006) has used several methodologies for valuing Malaysia’s coral reef resources in in-house research. These include methodologies for calculating (i) total economic value, (ii) travel cost, (iii) replacement cost, (iv) effect of production, and (v) damage costs.
For example, when applied to Pulau Payar, the contingent valuation method yields an estimated $390,000 annual conservation fee that could be collected from visitors (Yeo 1998, Ahmed et al. 2004). Similarly, use of the travel cost methodology estimates the total annual travel cost borne by tourists visiting Australia’s Great Barrier Reef at $107 million (Hundloe et al. 1987, in Ahmed et al. 2004). Finally, the effect-of-production methodology was used to estimate the decrease in the total annual value of the yield of reef fishes in the wake of collapse of protective management of a small marine reserve at Sumilon Island in the Philippines. In this case, the estimated value totaled $54,000 (Alcala and Russ 1990).
In the case of Malaysia, the total economic value methodology was used to estimate the use value of the country’s marine resources, taking into account both the direct and indirect benefits that result from their exploitation. The results of this estimation are as follows:
Sustainable fisheries for local consumption and live reef fish export contribute approximately $17,500–$41,000 per year. However, if the effort to protect coastal shores from erosion is also included, the potential benefits total $20,000–$151,000 per year. Tourism activities in a coral ecosystem are estimated to generate $700–$110,000 for every 100–1,000 persons. For every 600–2,000 persons willing to pay to conserve the beauty and biodiversity of coral reefs, an estimated value of $2,400–$8,000 per year could be achieved. Thus, using the total economic value methodology, the potential economic contribution of Malaysia’s coral reefs is $23,000–$271,000 per year (Maritime Institute Malaysia 2006).
Table 9 reports the total estimated economic value of mangroves in western Peninsular Malaysia in 1999. The values for indirect variables were derived from intangible services such as the role of mangroves as nursery grounds for economically important species, their potential for carbon sequestration, and the value of the protection they provide from damage through coastal erosion. The total estimated economic value of mangroves reported in Table 9 also includes existence value, which is an estimate of the economic value of “simply knowing that mangroves exist.”
A rapid appraisal of the economic value of the Semporna Priority Conservation Area (PCA) was completed in February 2011 by Worldwide Fund for Nature-Malaysia. Semporna PCA has coral coverage of 66,947 ha, and includes 170 km² of mangrove forest. This research is important, as Semporna PCA is part of the Coral Triangle’s Sulu–Sulawesi Marine Ecoregion. The appraisal methodology estimated (i) the total economic value of the services that the PCA provided to residents of local communities, (ii) the PCA’s value to national and global stakeholders, and (iii) the value of services provided to those who benefit from Semporna PCA directly and indirectly. This assessment estimated that the Semporna PCA annually generates more than RM185.3 million in gross value, and more than RM118.9 million in net value.
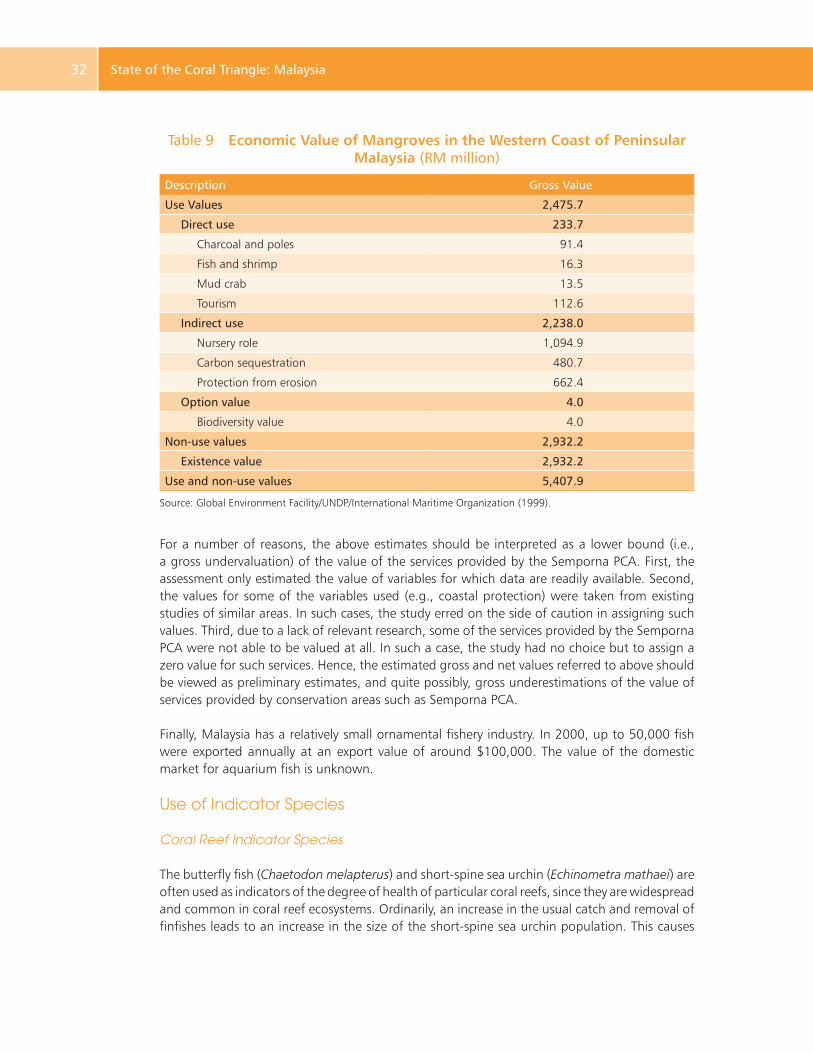
Same Energy, More Power32 State of the Coral Triangle: Malaysia32
For a number of reasons, the above estimates should be interpreted as a lower bound (i.e., a gross undervaluation) of the value of the services provided by the Semporna PCA. First, the assessment only estimated the value of variables for which data are readily available. Second, the values for some of the variables used (e.g., coastal protection) were taken from existing studies of similar areas. In such cases, the study erred on the side of caution in assigning such values. Third, due to a lack of relevant research, some of the services provided by the Semporna PCA were not able to be valued at all. In such a case, the study had no choice but to assign a zero value for such services. Hence, the estimated gross and net values referred to above should be viewed as preliminary estimates, and quite possibly, gross underestimations of the value of services provided by conservation areas such as Semporna PCA.
Finally, Malaysia has a relatively small ornamental fishery industry. In 2000, up to 50,000 fish were exported annually at an export value of around $100,000. The value of the domestic market for aquarium fish is unknown.
Use of Indicator Species
Coral Reef Indicator Species
The butterfly fish (Chaetodon melapterus) and short-spine sea urchin (Echinometra mathaei) are often used as indicators of the degree of health of particular coral reefs, since they are widespread and common in coral reef ecosystems. Ordinarily, an increase in the usual catch and removal of finfishes leads to an increase in the size of the short-spine sea urchin population. This causes
Table 9 Economic Value of Mangroves in the Western Coast of Peninsular Malaysia (RM million)
Description Gross Value
Use Values 2,475.7
Direct use 233.7
Charcoal and poles 91.4
Fish and shrimp 16.3
Mud crab 13.5
Tourism 112.6
Indirect use 2,238.0
Nursery role 1,094.9
Carbon sequestration 480.7
Protection from erosion 662.4
Option value 4.0
Biodiversity value 4.0
Non-use values 2,932.2
Existence value 2,932.2
Use and non-use values 5,407.9
Source: Global Environment Facility/UNDP/International Maritime Organization (1999).
Causes of Underinvestment and Persistent Energy Inefficiency 33 Biophysical Characteristics 33
high rates of bio-erosion, which further degrades the ecosystem and decreases the size of the corallivore butterfly fish population (Chaetodon melapterus) (Valavi et al. 2010).
Groupers, grunts, and snappers may also be useful for long-term monitoring of overfishing in coral reefs, although they may not be reliable indicators for short-term monitoring of overfishing.
Marine snails of the genus Drupella are predators of reef-building corals, and are widespread in Indo–Pacific coral reef ecosystems. Because outbreaks of these marine snails have been associated with considerable death of corals, the size of the population of these snails is one of the best indicators of reef health. Cumming (2009) notes that the first reports of coral destruction by Drupella began in 1972 with Moyer et al. (1982) in Japan, which was followed by high densities of Drupella at Western Australia’s Ningaloo Reefs (Ayling and Ayling 1987). Two scenarios may indicate a rise in the density of Drupella populations as a result of unsustainable or abnormal outcomes in the coral community (Cumming 2009). These include Drupella accounting for a relatively high proportion of coral colonies, and appearance of Drupella assemblages on corals that are bleached or diseased. Reefs under environmental pressure sustain a considerable density of Drupella. This in turn raises questions as to the ability of these marine snails to transmit disease.
Outbreaks of corallivorous crown-of-thorns starfish (Acanthaster planci) can create significant biological disturbances on tropical reefs. Such outbreaks can destroy coral reefs, alter the composition of the coral community, promote algal colonization, and affect the size of fish populations. As a result, such outbreaks can have a significant negative economic impact on areas where coral reef tourism could potentially generate millions of dollars in annual revenue (Timmers et al. 2010).
Mangrove Indicator Species
The gastropod mollusk Telescopium telescopium is a key component of the mangrove food chain. Its presence or absence is thus a vital determinant of the abundance of wading birds and some sea birds. This snail’s diet is detritus and algae sucked up by its proboscis during low tide. As a result, it is useful in studies that monitor environmental contamination or assess metal bioavailability. The degree of abundance and diversity of this mollusk have thus sometimes been used as an indicator of ecosystem health, and the degree of biodiversity locally present in mangroves (Ghasemi et al. 2011). Further, significant abundance of gastropods of low species richness could indicate a poor environment for mangroves.
34
Legislation
Federal Legislation
In force since 27 August 1957, the Federal Constitution of Malaysia governs the delicate relationship between the country’s federal and state governments. The Constitution has 188 articles and applies to all of the 13 states that comprise the country. Schedule 9 of the Constitution provides a list of areas where the federal government can make laws (Federal List), a list of areas where the state government can make laws (State List), and a list of areas where the federal and state government can make laws concurrently (Concurrent List). Supplemental lists that pertain solely to the states of Sabah and Sarawak are also provided (List IIIA). The Constitution makes no specific reference to the manner in which either the environment or biodiversity are to be managed. Nevertheless, all natural land resources (including forests, bodies of freshwater, and the animals that live in them) are under the jurisdiction of the respective states.
Four articles of the Federal, State, and Concurrent Lists directly address the conservation of marine biodiversity (UNEP 2008): (i) Article 9(c) of the Federal List, which gives the federal government jurisdiction over marine fishing and fisheries, except for turtles; (ii) Articles 2 and 3 of the State List, which give the states jurisdiction over land and land-use matters, including those pertaining to forestry and agriculture; (iii) Article 12 of the State List, which gives control over turtles and riverine fishing to the states; and (iv) Article 3 of the Concurrent List, which provides for joint responsibility for the conservation of wildlife and the establishment of national parks.
Jurisdiction over Maritime Estate
The separation of jurisdiction between federal and state governments in the management and enforcement of laws governing the use of marine and coastal resources is a sensitive issue. Section 5 of the National Land Code, 1965, describes “state land” as “all land in the state, including so much of the bed of any river, and of the foreshore5 and bed of the sea, as is within the territories of the state or the limits of territorial waters other than alienated land, reserved land, mining land, and any land, which under the provisions of any law relating to forests (whether passed before or after the commencement of this act) is, for the time being, reserved forest.” The federal government has jurisdiction over the marine estate up to 200 nautical
5 The National Land Code defines “shore line” as the high water mark of ordinary spring tides.
Governance
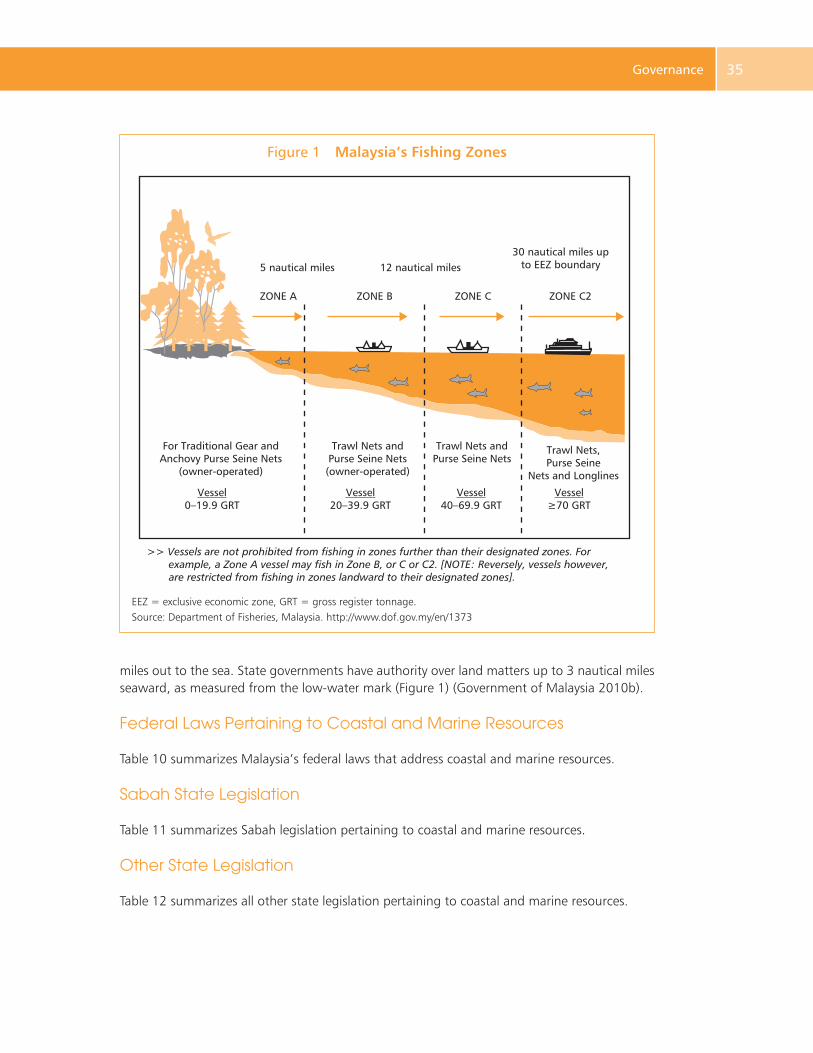
Causes of Underinvestment and Persistent Energy Inefficiency 35 Governance 35
Vessel0–19.9 GRT
Vessel20–39.9 GRT
Vessel40–69.9 GRT
Vessel≥70 GRT
5 nautical miles 12 nautical miles
ZONE A
For Traditional Gear andAnchovy Purse Seine Nets
(owner-operated)
Trawl Nets andPurse Seine Nets(owner-operated)
Trawl Nets andPurse Seine Nets
Trawl Nets,Purse Seine
Nets and Longlines
ZONE B ZONE C ZONE C2
30 nautical miles upto EEZ boundary
>> Vessels are not prohibited from fishing in zones further than their designated zones. For example, a Zone A vessel may fish in Zone B, or C or C2. [NOTE: Reversely, vessels however, are restricted from fishing in zones landward to their designated zones].
Figure 1 Malaysia’s Fishing Zones
EEZ = exclusive economic zone, GRT = gross register tonnage.Source: Department of Fisheries, Malaysia. http://www.dof.gov.my/en/1373
miles out to the sea. State governments have authority over land matters up to 3 nautical miles seaward, as measured from the low-water mark (Figure 1) (Government of Malaysia 2010b).
Federal Laws Pertaining to Coastal and Marine Resources
Table 10 summarizes Malaysia’s federal laws that address coastal and marine resources.
Sabah State Legislation
Table 11 summarizes Sabah legislation pertaining to coastal and marine resources.
Other State Legislation
Table 12 summarizes all other state legislation pertaining to coastal and marine resources.
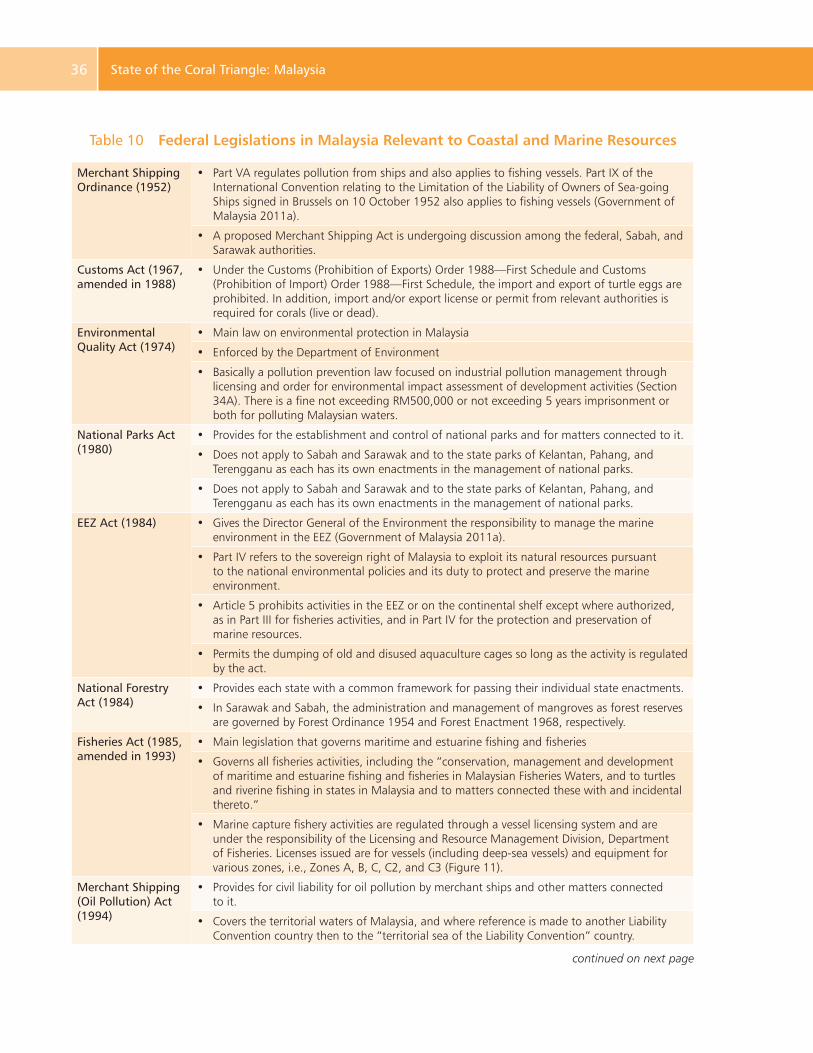
Same Energy, More Power36 State of the Coral Triangle: Malaysia36
Table 10 Federal Legislations in Malaysia Relevant to Coastal and Marine Resources
Merchant Shipping Ordinance (1952)
• Part VA regulates pollution from ships and also applies to fishing vessels. Part IX of the International Convention relating to the Limitation of the Liability of Owners of Sea-going Ships signed in Brussels on 10 October 1952 also applies to fishing vessels (Government of Malaysia 2011a).
• A proposed Merchant Shipping Act is undergoing discussion among the federal, Sabah, and Sarawak authorities.
Customs Act (1967, amended in 1988)
• Under the Customs (Prohibition of Exports) Order 1988—First Schedule and Customs (Prohibition of Import) Order 1988—First Schedule, the import and export of turtle eggs are prohibited. In addition, import and/or export license or permit from relevant authorities is required for corals (live or dead).
Environmental Quality Act (1974)
• Main law on environmental protection in Malaysia
• Enforced by the Department of Environment
• Basically a pollution prevention law focused on industrial pollution management through licensing and order for environmental impact assessment of development activities (Section 34A). There is a fine not exceeding RM500,000 or not exceeding 5 years imprisonment or both for polluting Malaysian waters.
National Parks Act (1980)
• Provides for the establishment and control of national parks and for matters connected to it.
• Does not apply to Sabah and Sarawak and to the state parks of Kelantan, Pahang, and Terengganu as each has its own enactments in the management of national parks.
• Does not apply to Sabah and Sarawak and to the state parks of Kelantan, Pahang, and Terengganu as each has its own enactments in the management of national parks.
EEZ Act (1984) • Gives the Director General of the Environment the responsibility to manage the marine environment in the EEZ (Government of Malaysia 2011a).
• Part IV refers to the sovereign right of Malaysia to exploit its natural resources pursuant to the national environmental policies and its duty to protect and preserve the marine environment.
• Article 5 prohibits activities in the EEZ or on the continental shelf except where authorized, as in Part III for fisheries activities, and in Part IV for the protection and preservation of marine resources.
• Permits the dumping of old and disused aquaculture cages so long as the activity is regulated by the act.
National Forestry Act (1984)
• Provides each state with a common framework for passing their individual state enactments.
• In Sarawak and Sabah, the administration and management of mangroves as forest reserves are governed by Forest Ordinance 1954 and Forest Enactment 1968, respectively.
Fisheries Act (1985, amended in 1993)
• Main legislation that governs maritime and estuarine fishing and fisheries
• Governs all fisheries activities, including the “conservation, management and development of maritime and estuarine fishing and fisheries in Malaysian Fisheries Waters, and to turtles and riverine fishing in states in Malaysia and to matters connected these with and incidental thereto.”
• Marine capture fishery activities are regulated through a vessel licensing system and are under the responsibility of the Licensing and Resource Management Division, Department of Fisheries. Licenses issued are for vessels (including deep-sea vessels) and equipment for various zones, i.e., Zones A, B, C, C2, and C3 (Figure 11).
Merchant Shipping (Oil Pollution) Act (1994)
• Provides for civil liability for oil pollution by merchant ships and other matters connected to it.
• Covers the territorial waters of Malaysia, and where reference is made to another Liability Convention country then to the “territorial sea of the Liability Convention” country.
continued on next page
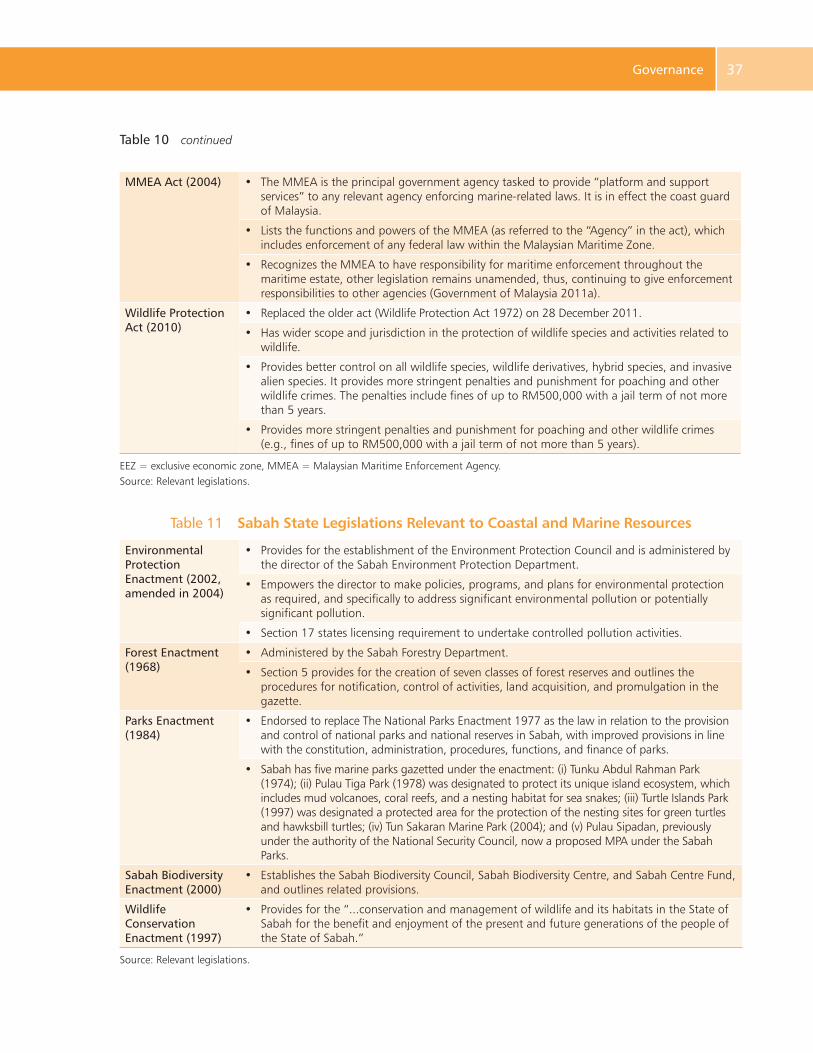
Causes of Underinvestment and Persistent Energy Inefficiency 37 Governance 37
MMEA Act (2004) • The MMEA is the principal government agency tasked to provide “platform and support services” to any relevant agency enforcing marine-related laws. It is in effect the coast guard of Malaysia.
• Lists the functions and powers of the MMEA (as referred to the “Agency” in the act), which includes enforcement of any federal law within the Malaysian Maritime Zone.
• Recognizes the MMEA to have responsibility for maritime enforcement throughout the maritime estate, other legislation remains unamended, thus, continuing to give enforcement responsibilities to other agencies (Government of Malaysia 2011a).
Wildlife Protection Act (2010)
• Replaced the older act (Wildlife Protection Act 1972) on 28 December 2011.
• Has wider scope and jurisdiction in the protection of wildlife species and activities related to wildlife.
• Provides better control on all wildlife species, wildlife derivatives, hybrid species, and invasive alien species. It provides more stringent penalties and punishment for poaching and other wildlife crimes. The penalties include fines of up to RM500,000 with a jail term of not more than 5 years.
• Provides more stringent penalties and punishment for poaching and other wildlife crimes (e.g., fines of up to RM500,000 with a jail term of not more than 5 years).
EEZ = exclusive economic zone, MMEA = Malaysian Maritime Enforcement Agency.Source: Relevant legislations.
Table 11 Sabah State Legislations Relevant to Coastal and Marine Resources
Environmental Protection Enactment (2002, amended in 2004)
• Provides for the establishment of the Environment Protection Council and is administered by the director of the Sabah Environment Protection Department.
• Empowers the director to make policies, programs, and plans for environmental protection as required, and specifically to address significant environmental pollution or potentially significant pollution.
• Section 17 states licensing requirement to undertake controlled pollution activities.
Forest Enactment (1968)
• Administered by the Sabah Forestry Department.
• Section 5 provides for the creation of seven classes of forest reserves and outlines the procedures for notification, control of activities, land acquisition, and promulgation in the gazette.
Parks Enactment (1984)
• Endorsed to replace The National Parks Enactment 1977 as the law in relation to the provision and control of national parks and national reserves in Sabah, with improved provisions in line with the constitution, administration, procedures, functions, and finance of parks.
• Sabah has five marine parks gazetted under the enactment: (i) Tunku Abdul Rahman Park (1974); (ii) Pulau Tiga Park (1978) was designated to protect its unique island ecosystem, which includes mud volcanoes, coral reefs, and a nesting habitat for sea snakes; (iii) Turtle Islands Park (1997) was designated a protected area for the protection of the nesting sites for green turtles and hawksbill turtles; (iv) Tun Sakaran Marine Park (2004); and (v) Pulau Sipadan, previously under the authority of the National Security Council, now a proposed MPA under the Sabah Parks.
Sabah Biodiversity Enactment (2000)
• Establishes the Sabah Biodiversity Council, Sabah Biodiversity Centre, and Sabah Centre Fund, and outlines related provisions.
Wildlife Conservation Enactment (1997)
• Provides for the “...conservation and management of wildlife and its habitats in the State of Sabah for the benefit and enjoyment of the present and future generations of the people of the State of Sabah.”
Source: Relevant legislations.
Table 10 continued
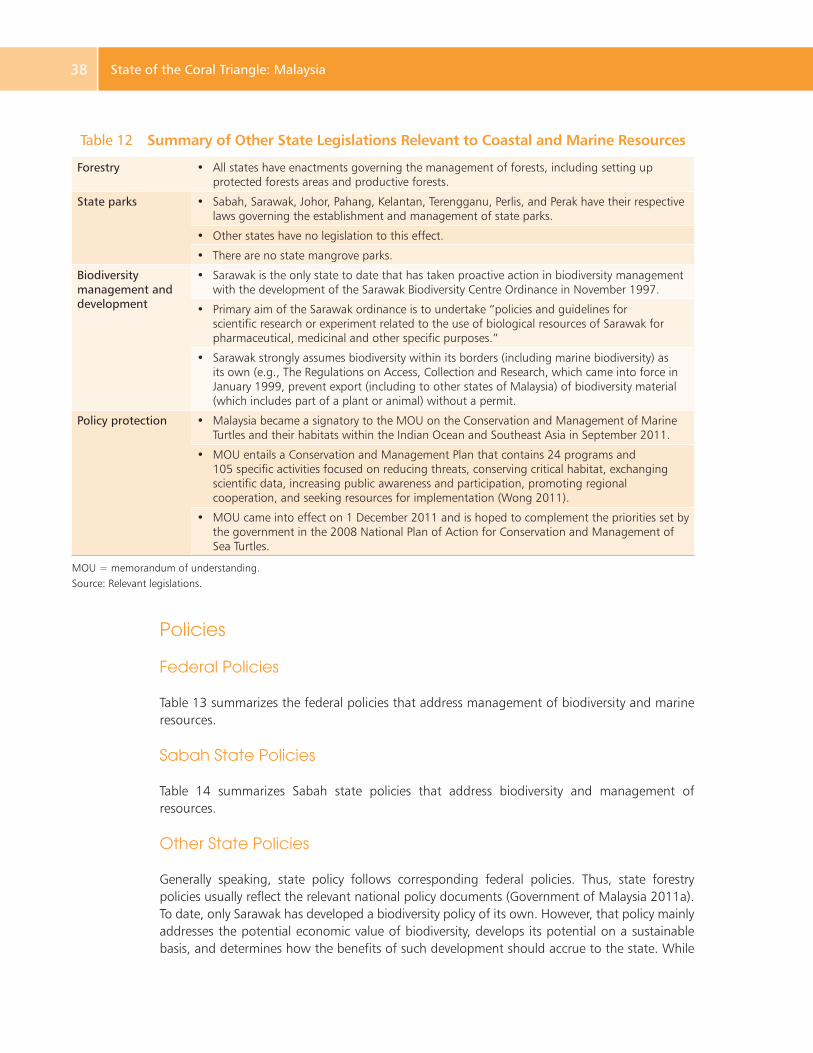
Same Energy, More Power38 State of the Coral Triangle: Malaysia38
Table 12 Summary of Other State Legislations Relevant to Coastal and Marine Resources
Forestry • All states have enactments governing the management of forests, including setting up protected forests areas and productive forests.
State parks • Sabah, Sarawak, Johor, Pahang, Kelantan, Terengganu, Perlis, and Perak have their respective laws governing the establishment and management of state parks.
• Other states have no legislation to this effect.
• There are no state mangrove parks.
Biodiversity management and development
• Sarawak is the only state to date that has taken proactive action in biodiversity management with the development of the Sarawak Biodiversity Centre Ordinance in November 1997.
• Primary aim of the Sarawak ordinance is to undertake “policies and guidelines for scientific research or experiment related to the use of biological resources of Sarawak for pharmaceutical, medicinal and other specific purposes.”
• Sarawak strongly assumes biodiversity within its borders (including marine biodiversity) as its own (e.g., The Regulations on Access, Collection and Research, which came into force in January 1999, prevent export (including to other states of Malaysia) of biodiversity material (which includes part of a plant or animal) without a permit.
Policy protection • Malaysia became a signatory to the MOU on the Conservation and Management of Marine Turtles and their habitats within the Indian Ocean and Southeast Asia in September 2011.
• MOU entails a Conservation and Management Plan that contains 24 programs and 105 specific activities focused on reducing threats, conserving critical habitat, exchanging scientific data, increasing public awareness and participation, promoting regional cooperation, and seeking resources for implementation (Wong 2011).
• MOU came into effect on 1 December 2011 and is hoped to complement the priorities set by the government in the 2008 National Plan of Action for Conservation and Management of Sea Turtles.
MOU = memorandum of understanding.Source: Relevant legislations.
Policies
Federal Policies
Table 13 summarizes the federal policies that address management of biodiversity and marine resources.
Sabah State Policies
Table 14 summarizes Sabah state policies that address biodiversity and management of resources.
Other State Policies
Generally speaking, state policy follows corresponding federal policies. Thus, state forestry policies usually reflect the relevant national policy documents (Government of Malaysia 2011a). To date, only Sarawak has developed a biodiversity policy of its own. However, that policy mainly addresses the potential economic value of biodiversity, develops its potential on a sustainable basis, and determines how the benefits of such development should accrue to the state. While
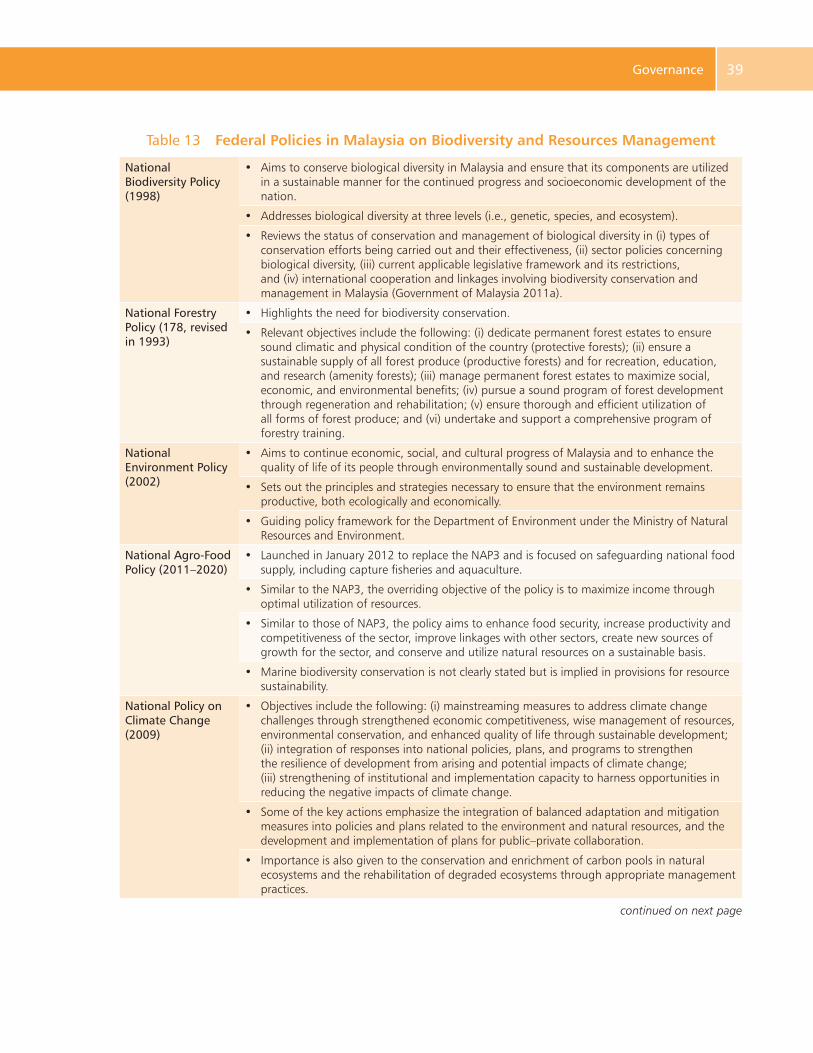
Causes of Underinvestment and Persistent Energy Inefficiency 39 Governance 39
Table 13 Federal Policies in Malaysia on Biodiversity and Resources Management
National Biodiversity Policy (1998)
• Aims to conserve biological diversity in Malaysia and ensure that its components are utilized in a sustainable manner for the continued progress and socioeconomic development of the nation.
• Addresses biological diversity at three levels (i.e., genetic, species, and ecosystem).
• Reviews the status of conservation and management of biological diversity in (i) types of conservation efforts being carried out and their effectiveness, (ii) sector policies concerning biological diversity, (iii) current applicable legislative framework and its restrictions, and (iv) international cooperation and linkages involving biodiversity conservation and management in Malaysia (Government of Malaysia 2011a).
National Forestry Policy (178, revised in 1993)
• Highlights the need for biodiversity conservation.
• Relevant objectives include the following: (i) dedicate permanent forest estates to ensure sound climatic and physical condition of the country (protective forests); (ii) ensure a sustainable supply of all forest produce (productive forests) and for recreation, education, and research (amenity forests); (iii) manage permanent forest estates to maximize social, economic, and environmental benefits; (iv) pursue a sound program of forest development through regeneration and rehabilitation; (v) ensure thorough and efficient utilization of all forms of forest produce; and (vi) undertake and support a comprehensive program of forestry training.
National Environment Policy (2002)
• Aims to continue economic, social, and cultural progress of Malaysia and to enhance the quality of life of its people through environmentally sound and sustainable development.
• Sets out the principles and strategies necessary to ensure that the environment remains productive, both ecologically and economically.
• Guiding policy framework for the Department of Environment under the Ministry of Natural Resources and Environment.
National Agro-Food Policy (2011–2020)
• Launched in January 2012 to replace the NAP3 and is focused on safeguarding national food supply, including capture fisheries and aquaculture.
• Similar to the NAP3, the overriding objective of the policy is to maximize income through optimal utilization of resources.
• Similar to those of NAP3, the policy aims to enhance food security, increase productivity and competitiveness of the sector, improve linkages with other sectors, create new sources of growth for the sector, and conserve and utilize natural resources on a sustainable basis.
• Marine biodiversity conservation is not clearly stated but is implied in provisions for resource sustainability.
National Policy on Climate Change (2009)
• Objectives include the following: (i) mainstreaming measures to address climate change challenges through strengthened economic competitiveness, wise management of resources, environmental conservation, and enhanced quality of life through sustainable development; (ii) integration of responses into national policies, plans, and programs to strengthen the resilience of development from arising and potential impacts of climate change; (iii) strengthening of institutional and implementation capacity to harness opportunities in reducing the negative impacts of climate change.
• Some of the key actions emphasize the integration of balanced adaptation and mitigation measures into policies and plans related to the environment and natural resources, and the development and implementation of plans for public–private collaboration.
• Importance is also given to the conservation and enrichment of carbon pools in natural ecosystems and the rehabilitation of degraded ecosystems through appropriate management practices.
continued on next page
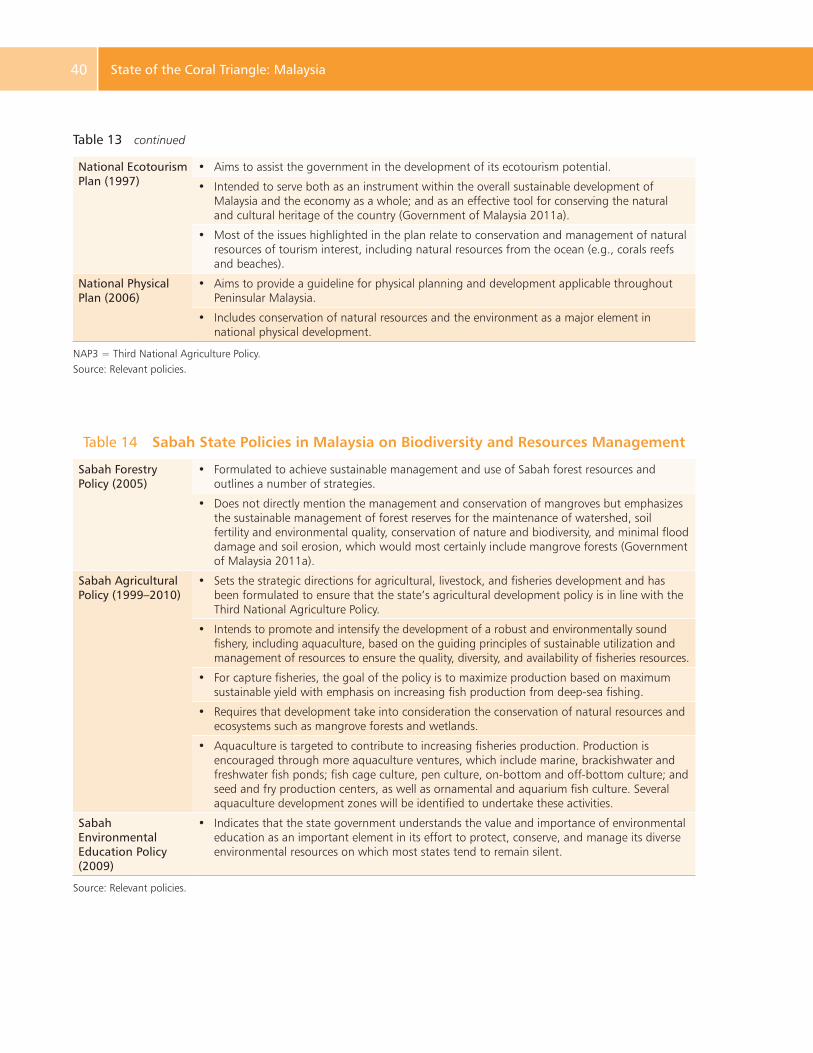
Same Energy, More Power40 State of the Coral Triangle: Malaysia40
National Ecotourism Plan (1997)
• Aims to assist the government in the development of its ecotourism potential.
• Intended to serve both as an instrument within the overall sustainable development of Malaysia and the economy as a whole; and as an effective tool for conserving the natural and cultural heritage of the country (Government of Malaysia 2011a).
• Most of the issues highlighted in the plan relate to conservation and management of natural resources of tourism interest, including natural resources from the ocean (e.g., corals reefs and beaches).
National Physical Plan (2006)
• Aims to provide a guideline for physical planning and development applicable throughout Peninsular Malaysia.
• Includes conservation of natural resources and the environment as a major element in national physical development.
NAP3 = Third National Agriculture Policy.Source: Relevant policies.
Table 14 Sabah State Policies in Malaysia on Biodiversity and Resources Management
Sabah Forestry Policy (2005)
• Formulated to achieve sustainable management and use of Sabah forest resources and outlines a number of strategies.
• Does not directly mention the management and conservation of mangroves but emphasizes the sustainable management of forest reserves for the maintenance of watershed, soil fertility and environmental quality, conservation of nature and biodiversity, and minimal flood damage and soil erosion, which would most certainly include mangrove forests (Government of Malaysia 2011a).
Sabah Agricultural Policy (1999–2010)
• Sets the strategic directions for agricultural, livestock, and fisheries development and has been formulated to ensure that the state’s agricultural development policy is in line with the Third National Agriculture Policy.
• Intends to promote and intensify the development of a robust and environmentally sound fishery, including aquaculture, based on the guiding principles of sustainable utilization and management of resources to ensure the quality, diversity, and availability of fisheries resources.
• For capture fisheries, the goal of the policy is to maximize production based on maximum sustainable yield with emphasis on increasing fish production from deep-sea fishing.
• Requires that development take into consideration the conservation of natural resources and ecosystems such as mangrove forests and wetlands.
• Aquaculture is targeted to contribute to increasing fisheries production. Production is encouraged through more aquaculture ventures, which include marine, brackishwater and freshwater fish ponds; fish cage culture, pen culture, on-bottom and off-bottom culture; and seed and fry production centers, as well as ornamental and aquarium fish culture. Several aquaculture development zones will be identified to undertake these activities.
Sabah Environmental Education Policy (2009)
• Indicates that the state government understands the value and importance of environmental education as an important element in its effort to protect, conserve, and manage its diverse environmental resources on which most states tend to remain silent.
Source: Relevant policies.
Table 13 continued
Causes of Underinvestment and Persistent Energy Inefficiency 41 Governance 41
the other states do not have policies that specifically address biodiversity, in some cases, other policies do address biodiversity. For example, Selangor’s 2010 policy (to become a developed state by 2010) and the Agenda 21 policy implemented by its local authorities, call for conservation and management of natural resources. However, neither the 2010 policy nor the Agenda 21 policy identifies specific policy objectives for conservation of biodiversity or its management.
Institutional Arrangements
At the federal level, at least six departments and three ministries are involved in governing conservation and management of marine biodiversity:
(i) National Council on Biodiversity and Biotechnology of the Ministry of Natural Resources and Environment (MNRE);
(ii) Biodiversity Secretariat of the MNRE;(iii) Department of Forestry of the MNRE;(iv) Marine Park Department Division of the MNRE;(v) Department of Fisheries, Ministry of Agriculture; and(vi) Environmental and Natural Resource Economics Division of the Economic Planning
Unit, Prime Minister’s Department.
Established in 2002 and headed by the Prime Minister, the National Council on Biodiversity and Biotechnology is the central agency governing conservation and management of marine biodiversity. Composed of 19 cabinet ministers and 13 state chief ministers, the council takes the lead role in decision making as it relates to management of biodiversity in Malaysia.
In addition to the National Council on Biodiversity and Biotechnology, other biodiversity-related councils play important roles in managing biodiversity at the national level:
(i) National Forestry Council;(ii) National Land Council;(iii) National Minerals Council;(iv) National Physical Plan, Biodiversity Unit of the Town Country Planning Department; (v) National Maritime Council;(vi) National Strategies and Plans for Agro-Biodiversity;(vii) National Tropical Biodiversity Centre (planned);(viii) National Bio-Safety Board (planned); and the(ix) National Advisory Council for Marine Park and Marine Reserve.
Table 15 lists the agencies that govern conservation and management of marine biodiversity, as well as the scope of their respective jurisdictions.
International Commitments and Participation
Following independence, Malaysia immediately began pursuing its national interests at the international level. This was particularly the case with regard to expanding the country’s maritime jurisdiction as it relates to (i) security and self-preservation, (ii) exploration and exploitation of
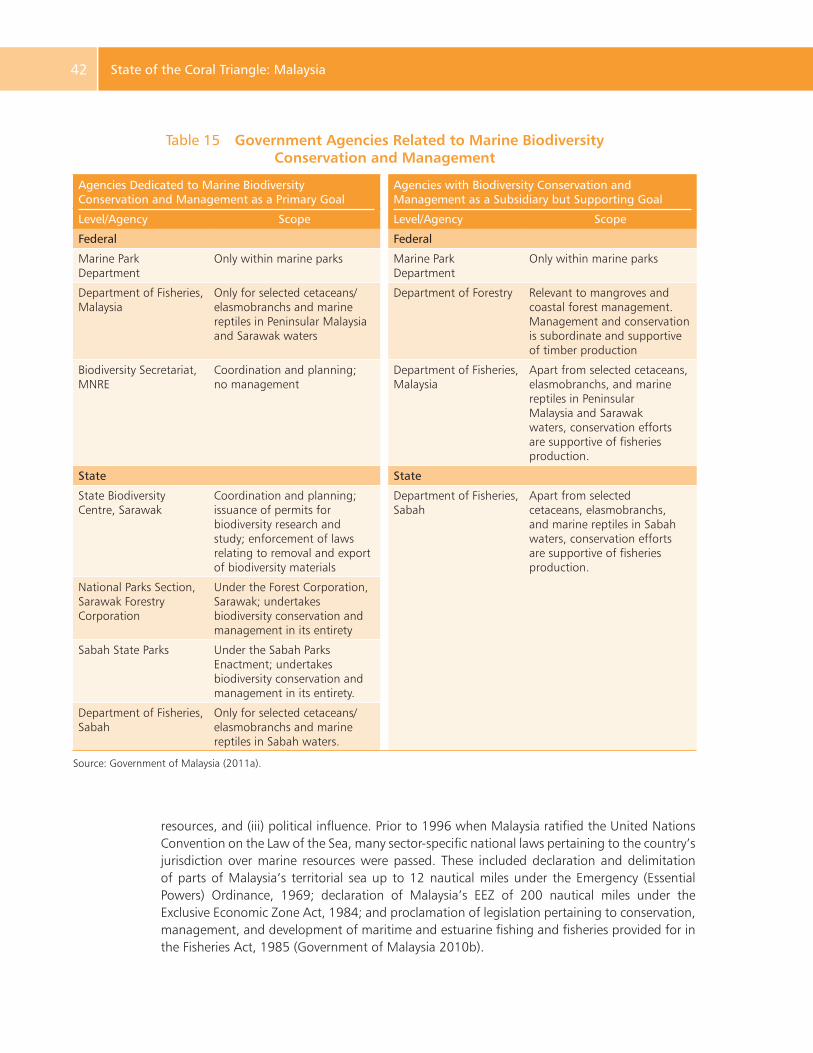
Same Energy, More Power42 State of the Coral Triangle: Malaysia42
Table 15 Government Agencies Related to Marine Biodiversity Conservation and Management
Agencies Dedicated to Marine Biodiversity Conservation and Management as a Primary Goal
Agencies with Biodiversity Conservation and Management as a Subsidiary but Supporting Goal
Level/Agency Scope Level/Agency Scope
Federal Federal
Marine Park Department
Only within marine parks Marine Park Department
Only within marine parks
Department of Fisheries, Malaysia
Only for selected cetaceans/elasmobranchs and marine reptiles in Peninsular Malaysia and Sarawak waters
Department of Forestry Relevant to mangroves and coastal forest management. Management and conservation is subordinate and supportive of timber production
Biodiversity Secretariat, MNRE
Coordination and planning; no management
Department of Fisheries, Malaysia
Apart from selected cetaceans, elasmobranchs, and marine reptiles in Peninsular Malaysia and Sarawak waters, conservation efforts are supportive of fisheries production.
State State
State Biodiversity Centre, Sarawak
Coordination and planning; issuance of permits for biodiversity research and study; enforcement of laws relating to removal and export of biodiversity materials
Department of Fisheries, Sabah
Apart from selected cetaceans, elasmobranchs, and marine reptiles in Sabah waters, conservation efforts are supportive of fisheries production.
National Parks Section, Sarawak Forestry Corporation
Under the Forest Corporation, Sarawak; undertakes biodiversity conservation and management in its entirety
Sabah State Parks Under the Sabah Parks Enactment; undertakes biodiversity conservation and management in its entirety.
Department of Fisheries, Sabah
Only for selected cetaceans/elasmobranchs and marine reptiles in Sabah waters.
Source: Government of Malaysia (2011a).
resources, and (iii) political influence. Prior to 1996 when Malaysia ratified the United Nations Convention on the Law of the Sea, many sector-specific national laws pertaining to the country’s jurisdiction over marine resources were passed. These included declaration and delimitation of parts of Malaysia’s territorial sea up to 12 nautical miles under the Emergency (Essential Powers) Ordinance, 1969; declaration of Malaysia’s EEZ of 200 nautical miles under the Exclusive Economic Zone Act, 1984; and proclamation of legislation pertaining to conservation, management, and development of maritime and estuarine fishing and fisheries provided for in the Fisheries Act, 1985 (Government of Malaysia 2010b).
Causes of Underinvestment and Persistent Energy Inefficiency 43 Governance 43
On 2 October 1996, the Minister of Foreign Affairs of Malaysia, Dato’ Seri Abdullah bin Haji Ahmad Badawi, signed the instrument of ratification of the 1982 UN Convention on the Law of the Sea on behalf of the Government of Malaysia. Malaysia has demonstrated further commitment to management of national maritime affairs. This commitment includes active engagement:
(i) at the UN Meetings of States Parties to the UN Convention on the Law of the Sea;(ii) in the Commission on the Limits of the Continental Shelf, including successful lobbying
for the election of a Malaysian as a member of the commission;(iii) in International Maritime Organization committee meetings, including appointment of
a maritime attaché to the International Maritime Organization;(iv) at the Conference of Parties to the Convention on Biological Diversity; and(v) many other marine-related international forums.
Table 16 summarizes the international conventions and treaties to which Malaysia is a party, and thus the country’s commitment to meeting their objectives.
Malaysia’s Role in Regional Fisheries Management Agencies
Regional fisheries agencies are critical to achieving long-term sustainable management of the region’s fisheries. Since the 1992 UN Conference on Environment and Development (or “Earth Summit”), a number of international instruments have been created for this purpose.
Regional fisheries management organizations are unique in that they address conservation and management of regional fish stocks at the operational level. More specifically, they address issues that result from the fact that fish stocks (i) migrate across international boundaries, (ii) migrate between international boundaries and the high seas, and (iii) migrate exclusively in high-seas areas. Efficiently addressing such issues requires that the conservation and management measures agreed to by members of these organizations be legally binding.
Malaysia is currently a member of three regional fisheries bodies: (i) the Asia-Pacific Fishery Commission (APFIC), (ii) the Indian Ocean Tuna Commission (IOTC), and (iii) the Southeast Asian Fisheries Development Center.
The APFIC aims to promote full and proper utilization of living aquatic resources in the Asia and Pacific region. This particularly includes development and management of fishing and aquaculture operations, and development of related processing and marketing activities that conform to the objectives of its membership (APFIC 2010).
The IOTC aims to promote cooperation among its membership to ensure conservation and optimum utilization of stocks covered by the commission’s agreement through appropriate management, and to encourage sustainable development of fisheries based on such stocks (IOTC 2010).
Finally, the Southeast Asian Fisheries Development Center’s mandate is “to develop and manage the fisheries potential of the region by rational utilization of the resources for providing food security and safety for people, and alleviating poverty through transfer of new technologies, research, and information dissemination activities.” (Southeast Asian Fisheries Development Center 2010).
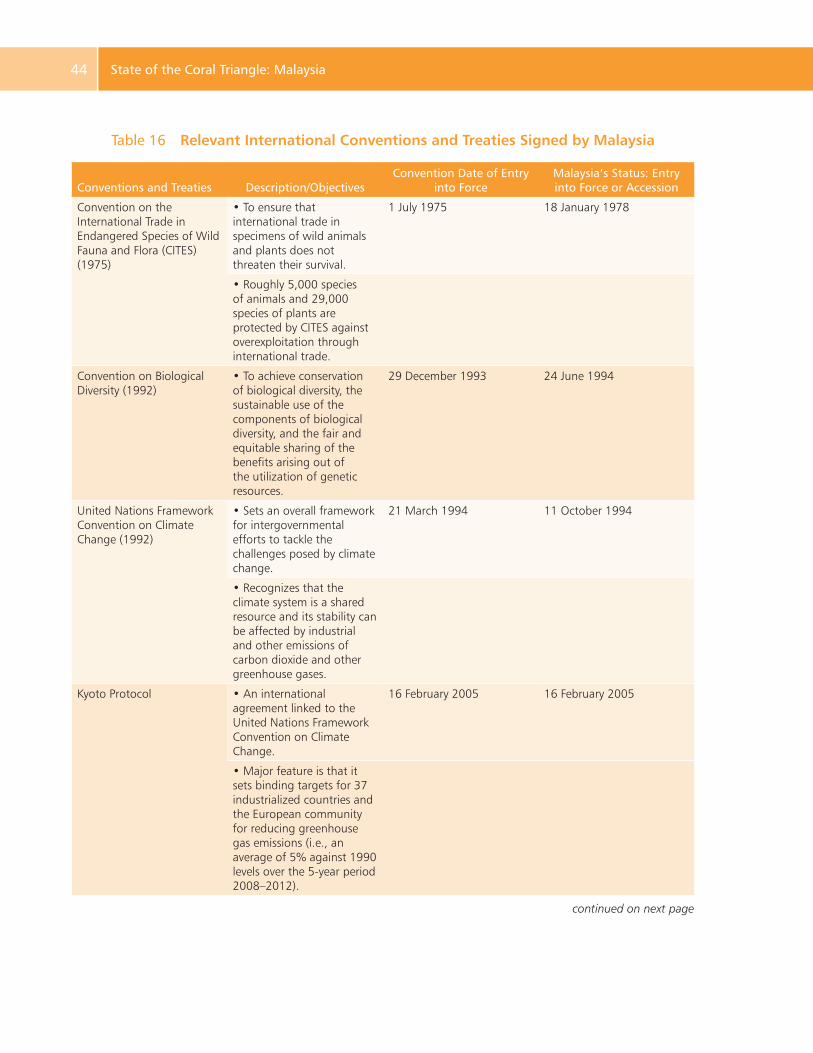
Same Energy, More Power44 State of the Coral Triangle: Malaysia44
Table 16 Relevant International Conventions and Treaties Signed by Malaysia
Conventions and Treaties Description/ObjectivesConvention Date of Entry
into ForceMalaysia’s Status: Entry into Force or Accession
Convention on the International Trade in Endangered Species of Wild Fauna and Flora (CITES) (1975)
• To ensure that international trade in specimens of wild animals and plants does not threaten their survival.
1 July 1975 18 January 1978
• Roughly 5,000 species of animals and 29,000 species of plants are protected by CITES against overexploitation through international trade.
Convention on Biological Diversity (1992)
• To achieve conservation of biological diversity, the sustainable use of the components of biological diversity, and the fair and equitable sharing of the benefits arising out of the utilization of genetic resources.
29 December 1993 24 June 1994
United Nations Framework Convention on Climate Change (1992)
• Sets an overall framework for intergovernmental efforts to tackle the challenges posed by climate change.
21 March 1994 11 October 1994
• Recognizes that the climate system is a shared resource and its stability can be affected by industrial and other emissions of carbon dioxide and other greenhouse gases.
Kyoto Protocol • An international agreement linked to the United Nations Framework Convention on Climate Change.
16 February 2005 16 February 2005
• Major feature is that it sets binding targets for 37 industrialized countries and the European community for reducing greenhouse gas emissions (i.e., an average of 5% against 1990 levels over the 5-year period 2008–2012).
continued on next page
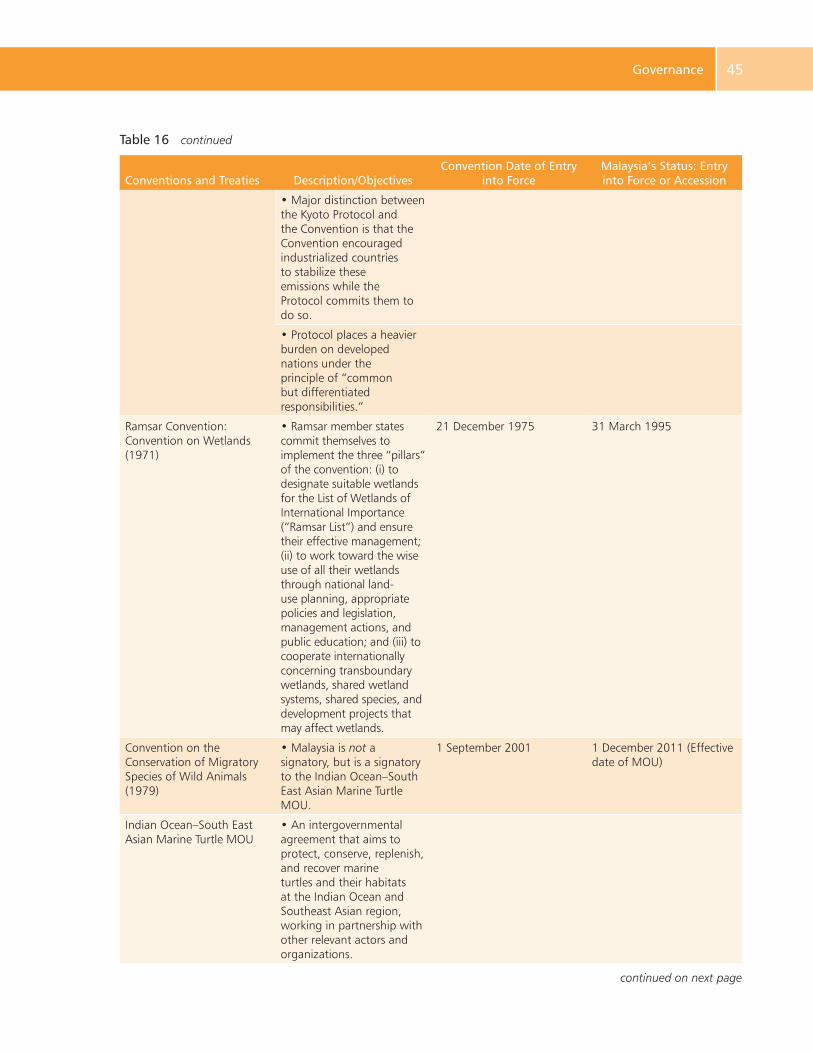
Causes of Underinvestment and Persistent Energy Inefficiency 45 Governance 45
Conventions and Treaties Description/ObjectivesConvention Date of Entry
into ForceMalaysia’s Status: Entry into Force or Accession
• Major distinction between the Kyoto Protocol and the Convention is that the Convention encouraged industrialized countries to stabilize these emissions while the Protocol commits them to do so.
• Protocol places a heavier burden on developed nations under the principle of “common but differentiated responsibilities.”
Ramsar Convention: Convention on Wetlands (1971)
• Ramsar member states commit themselves to implement the three “pillars” of the convention: (i) to designate suitable wetlands for the List of Wetlands of International Importance (“Ramsar List”) and ensure their effective management; (ii) to work toward the wise use of all their wetlands through national land-use planning, appropriate policies and legislation, management actions, and public education; and (iii) to cooperate internationally concerning transboundary wetlands, shared wetland systems, shared species, and development projects that may affect wetlands.
21 December 1975 31 March 1995
Convention on the Conservation of Migratory Species of Wild Animals (1979)
• Malaysia is not a signatory, but is a signatory to the Indian Ocean–South East Asian Marine Turtle MOU.
1 September 2001 1 December 2011 (Effective date of MOU)
Indian Ocean–South East Asian Marine Turtle MOU
• An intergovernmental agreement that aims to protect, conserve, replenish, and recover marine turtles and their habitats at the Indian Ocean and Southeast Asian region, working in partnership with other relevant actors and organizations.
continued on next page
Table 16 continued
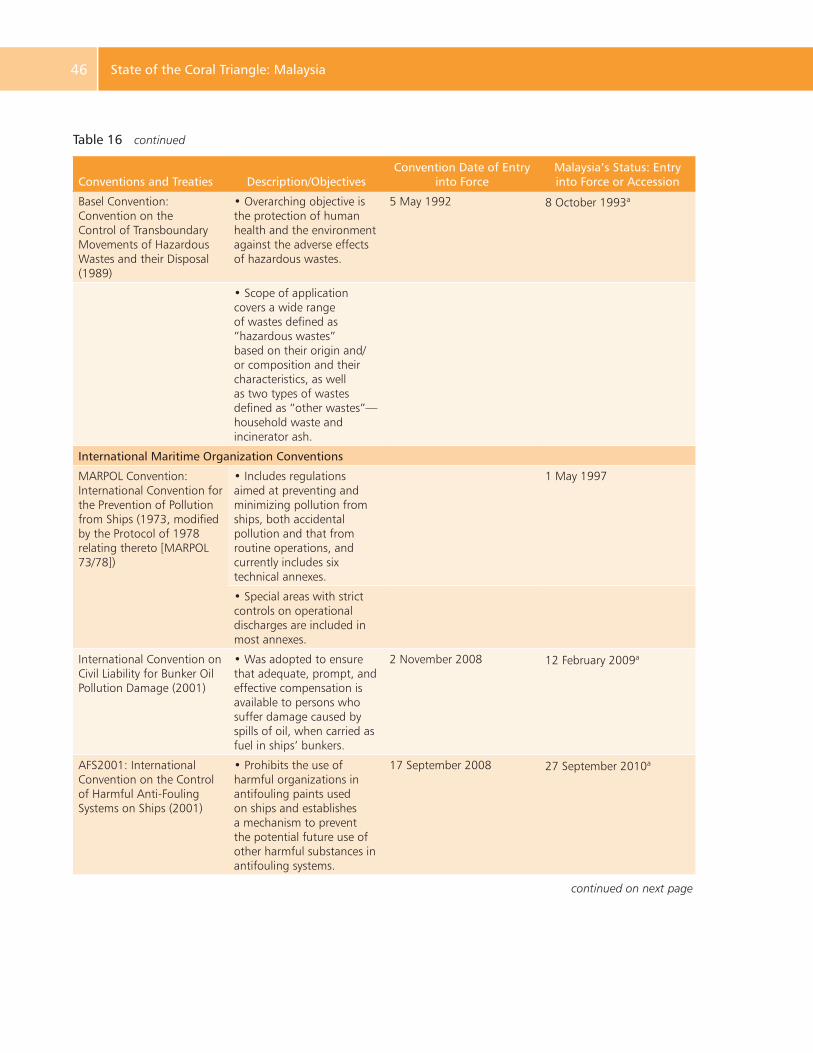
Same Energy, More Power46 State of the Coral Triangle: Malaysia46
Conventions and Treaties Description/ObjectivesConvention Date of Entry
into ForceMalaysia’s Status: Entry into Force or Accession
Basel Convention: Convention on the Control of Transboundary Movements of Hazardous Wastes and their Disposal (1989)
• Overarching objective is the protection of human health and the environment against the adverse effects of hazardous wastes.
5 May 1992 8 October 1993a
• Scope of application covers a wide range of wastes defined as ”hazardous wastes” based on their origin and/or composition and their characteristics, as well as two types of wastes defined as “other wastes”—household waste and incinerator ash.
International Maritime Organization Conventions
MARPOL Convention: International Convention for the Prevention of Pollution from Ships (1973, modified by the Protocol of 1978 relating thereto [MARPOL 73/78])
• Includes regulations aimed at preventing and minimizing pollution from ships, both accidental pollution and that from routine operations, and currently includes six technical annexes.
1 May 1997
• Special areas with strict controls on operational discharges are included in most annexes.
International Convention on Civil Liability for Bunker Oil Pollution Damage (2001)
• Was adopted to ensure that adequate, prompt, and effective compensation is available to persons who suffer damage caused by spills of oil, when carried as fuel in ships’ bunkers.
2 November 2008 12 February 2009a
AFS2001: International Convention on the Control of Harmful Anti-Fouling Systems on Ships (2001)
• Prohibits the use of harmful organizations in antifouling paints used on ships and establishes a mechanism to prevent the potential future use of other harmful substances in antifouling systems.
17 September 2008 27 September 2010a
Table 16 continued
continued on next page
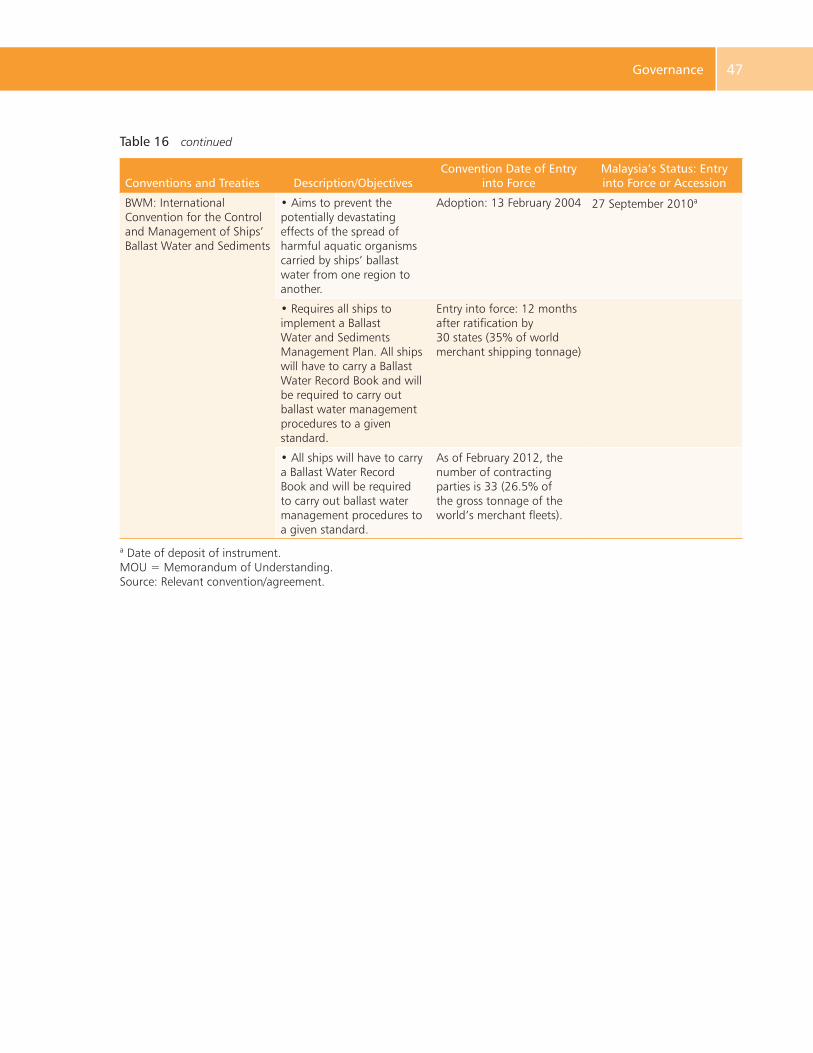
Causes of Underinvestment and Persistent Energy Inefficiency 47 Governance 47
Conventions and Treaties Description/ObjectivesConvention Date of Entry
into ForceMalaysia’s Status: Entry into Force or Accession
BWM: International Convention for the Control and Management of Ships’ Ballast Water and Sediments
• Aims to prevent the potentially devastating effects of the spread of harmful aquatic organisms carried by ships’ ballast water from one region to another.
Adoption: 13 February 2004 27 September 2010a
• Requires all ships to implement a Ballast Water and Sediments Management Plan. All ships will have to carry a Ballast Water Record Book and will be required to carry out ballast water management procedures to a given standard.
Entry into force: 12 months after ratification by 30 states (35% of world merchant shipping tonnage)
• All ships will have to carry a Ballast Water Record Book and will be required to carry out ballast water management procedures to a given standard.
As of February 2012, the number of contracting parties is 33 (26.5% of the gross tonnage of the world’s merchant fleets).
a Date of deposit of instrument.MOU = Memorandum of Understanding.Source: Relevant convention/agreement.
Table 16 continued
Same Energy, More Power48 State of the Coral Triangle: Malaysia48
Regional Cooperation
Malaysia participates in a number of intergovernmental and regional cooperation initiatives, each of which is briefly described below.
(i) Putrajaya Declaration of Regional Cooperation for the Sustainable Development of the Seas of East Asia. Adopted on 12 December 2003, this declaration addresses key concerns regarding coasts and oceans. It thus provides a platform for (a) cooperation at the regional, subregional, national, and local levels, and for intergovernmental, interagency, and intersector collaboration on achieving the World Summit for Sustainable Development targets; (b) implementation of integrated ocean and coastal management approaches; and (c) action programs aimed at solving problems and deficiencies in ocean and coastal governance (Partnerships in Environmental Management for the Seas of East Asia [PEMSEA] 2003).
(ii) Sulu–Sulawesi Marine Ecoregion. Established through the signing of a memorandum of understanding in February 2004, the goal of the Sulu–Sulawesi Marine Ecoregion (SSME) is conservation of marine biodiversity and sustainable development of the SSME’s marine resources by Indonesia, Malaysia, and the Philippines. Malaysia prepared the Ecoregional Conservation Plan in association with a number of government bodies that included federal and state departments and agencies, mostly from Sabah. The final stage of planning was formulation of a Malaysia Stakeholder Conservation Plan in early 2003. By late 2003, this national plan became an integral part of the Ecoregional Conservation Plan.6
(iii) Intergovernmental Oceanographic Commission. The Intergovernmental Oceanographic Commission (IOC) is the UN body that addresses issues relating to ocean science, ocean observatories, ocean data and information exchange, and ocean services such as tsunami warning systems. It coordinates research, service, and capacity-building programs that further knowledge relating to the resources of oceanic and coastal areas, and application of this knowledge in a way that improves the management, sustainable development, and protection of the marine environment, and the decision-making processes of states as these relate to the marine resource.7 On a regional level, the IOC coordinates establishment of tsunami early warning and mitigation systems in the Pacific Ocean, the Indian Ocean, the Northeastern Atlantic Ocean, and the Mediterranean and Caribbean seas. Malaysia has been an IOC member since July 1964, and is now a member of the IOC Executive Council.
6 http://www.fishdept.sabah.gov.my/ssme.asp7 http://ioc-unesco.org
49
Socioeconomic Characteristics
Demography
Malaysia’s population is estimated at 28.3 million, of which 74.1% (22.5 million) live in Peninsular Malaysia and 25.9% (5.72 million) in East Malaysia (Sabah, Sarawak, and Labuan). The country’s three major ethnic groups are Malay, Chinese, and Indian. The Malays comprise 53.3% of the population. However, this figure excludes other bumiputra8 groups that account for another 11.8%. Malaysia’s Constitution defines Malays as Muslims who practice Malay customs and culture. Bumiputra status is also accorded to some non-Malay indigenous peoples, including Chams, Khmers, Thais, and natives of Sabah and Sarawak. Non-Malay bumiputra make up more than half of Sarawak’s population, and more than two-thirds of Sabah’s population. Other less numerous aboriginal groups live in Peninsular Malaysia, where they are known as orang asli. Other non-bumiputra minorities include persons of Chinese descent (26.0%), Indian descent (7.7%), and others (1.2%).
Population growth in Malaysia is slowing. The 2010 census revealed that Malaysia’s average annual population growth rate was 2.0% in 2000–2010, which represents a significant reduction from the 2.6% recorded during the previous census period of 1991–2000. In fact, the average annual growth rate of the overall population in 2009 and 2010 was only 1.3%. Kelantan registered the highest average annual growth rate for this period at 1.9%, and Sabah the lowest at 1.0% (Census of Malaysia 2010).
Selangor is Malaysia’s most populous state (5.1 million), followed by Johor (3.3 million), and Sabah (3.2 million). Together, these three states account for 42.4% of Malaysia’s total population. The least populous state is the Federal Territory of Labuan, which has only 0.1 million inhabitants.
Malaysia is clearly a coastal country, in that in 2003, approximately 98% of the total population resided within 100 km of the coast (PEMSEA 2003). Despite this, only three coastal cities are included in Malaysia’s 10 most populous urban areas: Johor Bahru (Johor), Kota Kinabalu (Sabah), and Kuching (Sarawak). Although Klang is not the capital city of Selangor state, it is the state’s royal capital. Both Klang and Johor are located along major shipping routes, and thus operate several major ports including North Port, West Port, and the Port of Tanjung Pelepas.
In 2010, Malaysia’s population density was 85 persons per square kilometer (km²). This represents a significant increase from the year-2000 level, which was 71. The most densely
8 The Malay term bumiputera (also spelled bumiputra) refers to indigenous peoples of the Malay Archipelago.
Same Energy, More Power50 State of the Coral Triangle: Malaysia50
populated states are the Federal Territory, Kuala Lumpur (6,891 persons per km²); Pulau Pinang (1,490 persons); and Putrajaya (1,478 persons).
Changes in Malaysia’s urbanization rate in 2000–2010 mirror the country’s relatively rapid increase in population density, as in 2010, 71% of the population lived in urban areas as opposed to 62% in 2000. The most heavily urbanized states are the Federal Territory and Kuala Lumpur (100%), as well as Selangor (88.4%) and Pulau Pinang (80.9%).
The fall in Malaysia’s population growth rate referred to above is mirrored in the country’s share of population aged 15 years or less, which by 2010 had fallen to 27.6% from its year-2000 level of 33.3%. Over the same period, the share of the working-age population (aged 15–64 years) increased to 67.3% from 62.8%, while the share of population aged 65 years and above increased to 5.1% from 3.9%. These changes caused the median age of Malaysia’s population to increase from 23.6 years in 2000 to 26.2 years in 2010, with a corresponding decline in the dependency ratio from 59.2% to 48.5%. These indicators suggest a change in the age composition of Malaysia’s population that is consistent with industrialization and rapid economic growth. In short, as with most industrialized economies, Malaysia’s population is aging (Census of Malaysia 2010).
Resource Use Patterns and Issues
Capture Fisheries
Marine capture fisheries are an important economic sector in Malaysia, not only as a major source of food for the population, but also as a generator of foreign exchange and employment. In 2010, per capita fish consumption in Malaysia was 56 kilogram (kg), which makes fish a strategic food commodity (Abdullah et al. 2010). In 2010, marine capture fisheries (inshore and deep-sea fisheries) accounted for 70.9% of the total fish harvest of 1.4 million tons, which was valued at RM6.7 billion. This represents an increase of 2.6% from the previous year (Department of Fisheries, Malaysia 2010).
Malaysia has four major fishing grounds: the waters off the western and eastern coasts of Peninsular Malaysia, and those off Sarawak and Sabah states. The government defines resources that lie within 30 nautical miles of the shore as “coastal resources,” and those that lie beyond that as “deep-sea” or “offshore” resources. Malaysia’s capture fisheries are both demersal and pelagic. The country’s demersal catch includes many species, none of which is individually dominant. While pelagic species are few, some are of major economic importance.
Most of Peninsular Malaysia’s fishing grounds are in shallow water, at depths of less than 40 meters, and are located relatively close to mangrove areas (Arshad et al. 1997). The country’s coastal fishing grounds are exploited with both commercial and traditional fishing gear, while larger commercial boats are predominantly used to exploit the country’s deep-sea fisheries. Commercial fishing gear consists of trawl net and purse seine vessels, while traditional or artisanal fishing gear largely comprises drift and/or gill nets, hook-and-line gear, and bag nets. While the artisanal gear units far outnumber commercial gear units, the latter account for 80% of the national catch.
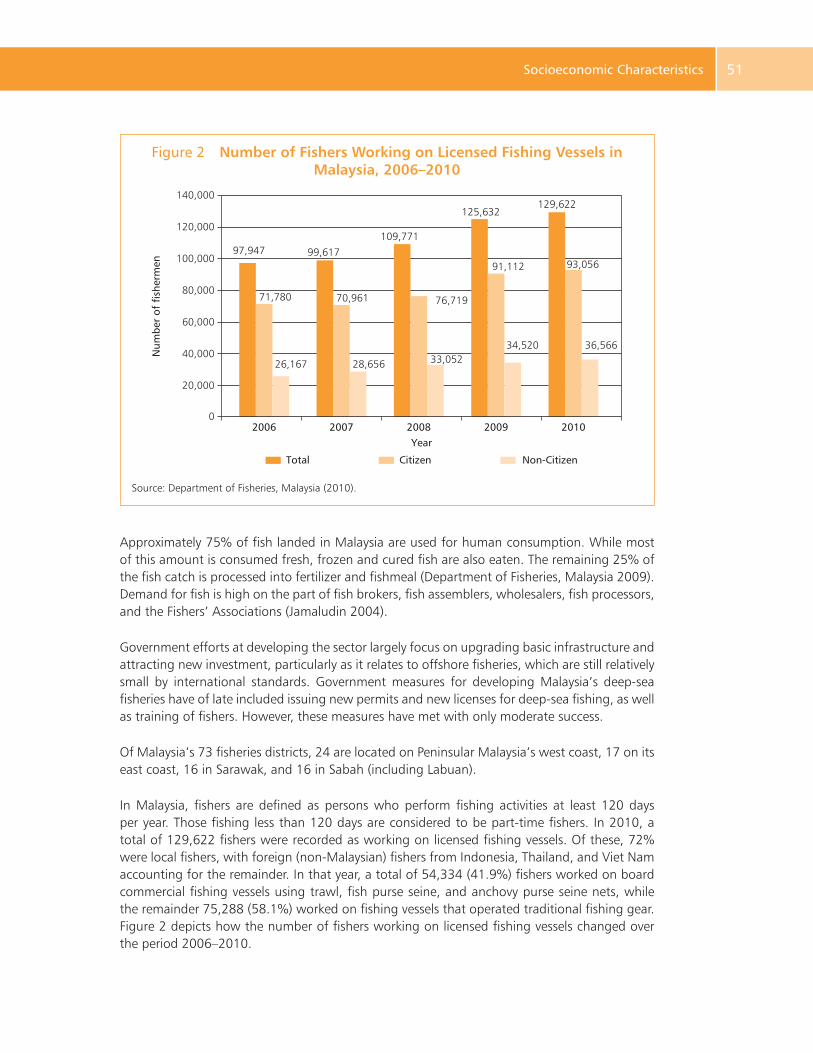
Causes of Underinvestment and Persistent Energy Inefficiency 51 Socioeconomic Characteristics 51
Approximately 75% of fish landed in Malaysia are used for human consumption. While most of this amount is consumed fresh, frozen and cured fish are also eaten. The remaining 25% of the fish catch is processed into fertilizer and fishmeal (Department of Fisheries, Malaysia 2009). Demand for fish is high on the part of fish brokers, fish assemblers, wholesalers, fish processors, and the Fishers’ Associations (Jamaludin 2004).
Government efforts at developing the sector largely focus on upgrading basic infrastructure and attracting new investment, particularly as it relates to offshore fisheries, which are still relatively small by international standards. Government measures for developing Malaysia’s deep-sea fisheries have of late included issuing new permits and new licenses for deep-sea fishing, as well as training of fishers. However, these measures have met with only moderate success.
Of Malaysia’s 73 fisheries districts, 24 are located on Peninsular Malaysia’s west coast, 17 on its east coast, 16 in Sarawak, and 16 in Sabah (including Labuan).
In Malaysia, fishers are defined as persons who perform fishing activities at least 120 days per year. Those fishing less than 120 days are considered to be part-time fishers. In 2010, a total of 129,622 fishers were recorded as working on licensed fishing vessels. Of these, 72% were local fishers, with foreign (non-Malaysian) fishers from Indonesia, Thailand, and Viet Nam accounting for the remainder. In that year, a total of 54,334 (41.9%) fishers worked on board commercial fishing vessels using trawl, fish purse seine, and anchovy purse seine nets, while the remainder 75,288 (58.1%) worked on fishing vessels that operated traditional fishing gear. Figure 2 depicts how the number of fishers working on licensed fishing vessels changed over the period 2006–2010.
Figure 2 Number of Fishers Working on Licensed Fishing Vessels in Malaysia, 2006–2010
Source: Department of Fisheries, Malaysia (2010).
Num
ber
of f
ishe
rmen
2006 2007 2008 2009 2010Year
140,000
120,000
100,000
80,000
60,000
40,000
20,000
0
Total Citizen Non-Citizen
97,947
71,780
26,167
99,617
70,961
28,656
109,771
76,719
33,052
125,632
91,112
34,520
129,622
93,056
36,566
Same Energy, More Power52 State of the Coral Triangle: Malaysia52
Despite various government policies and programs introduced over the past 40 years, fishers remain the country’s slowest-income group. This is evident from the Household Income Survey performed in 2004, which recorded 26,576 poor and very poor fishers in Malaysia overall. Of this number, 53.4% were residents of Sabah. Based on a survey called E-kasih, approximately 2,036 were poor and very poor fishers on the east coast of Peninsular Malaysia in 2006. Of these, Kuala Terengganu recorded the greatest number, with 428 of its fishers being classified as near poor, poor, or very poor (21%).
This low-income characteristic of Malaysia’s fishing population is reflected both in its relative age, and in the sector’s low rates of recruitment, both of which have been confirmed by surveys performed at several fishing bases. In fact, data from several fishing villages indicate that most fishers are 41–64 years old, as this age group represented 50%–70% of all fishers at bases including Kuala Kemaman (Terengganu), Kuala Sg. Bharu (Melaka), Paka (Terengganu), Pulau Kambing (Terengganu), and Sg. Duyong (Melaka). Interestingly, 70% of fishers at Setiu lagoon are 26–40 years old. In most cases, availability of alternative land-based job opportunities accounts for the relatively limited number of fishers aged 17–25. This group is mainly located in Kuala Sg. Bharu, Pulau Kambing, and Sg. Duyong, all of which are adjacent to major urban areas.
If not somehow lowered over the coming 2 decades, this current average age of Malaysia’s fishers of 41–64 years will likely have a negative impact on the country’s annual domestic fish catch when those currently active in fishing retire. The result could be a significantly smaller pool of coastal fishers, or even abandonment of fishing altogether as a livelihood strategy. Given a rising average national wage level over the coming 2 decades, the default response to such an outcome would likely be recruitment of foreign labor.
Indeed, this appears to be already occurring. While foreign workers are technically prohibited from working in Malaysia’s fishing sector other than on deep-sea vessels, traditional vessels operating out of developed states, such as Melaka, are commonly staffed with foreign labor. Technically, these foreign laborers are not hired as employees. Instead, they are self-employed operators of fishing boats leased directly from owners. As they are thus classed as self-employed workers, they do not require a work permit issued by the government. While this practice of leasing fishing boats to foreign operators is increasingly common, it does nothing to raise the productivity of local fishers, who are unable to invest in modern vessels and equipment because of their poor credit ratings.
West Coast of Peninsular Malaysia
The fisheries resources in the Straits of Malacca are the most exploited in the country because of the greater intensity of fishing effort in these waters as opposed to elsewhere. This latter outcome results from two factors: the relatively high population density along the west coast of Peninsular Malaysia, and rapid development of the trawl and purse seine fisheries since the mid-1960s (Khoo 1976). In 2007, there were 40,831 fishers on the west coast of Peninsular Malaysia, this number accounting for 41% of the national fishing population. Further, this number of licensed fishers represents a 27.8% increase over the corresponding figure for 2003 (Table 17).
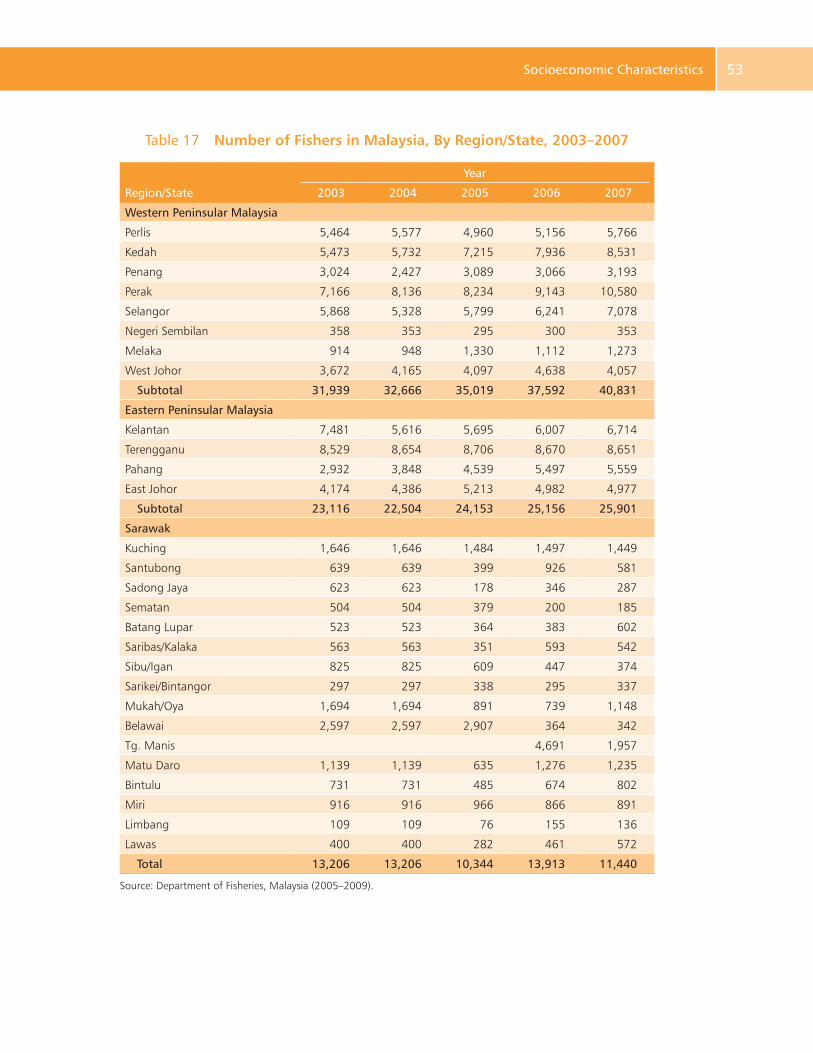
Causes of Underinvestment and Persistent Energy Inefficiency 53 Socioeconomic Characteristics 53
Table 17 Number of Fishers in Malaysia, By Region/State, 2003–2007
Region/State
Year
2003 2004 2005 2006 2007
Western Peninsular Malaysia
Perlis 5,464 5,577 4,960 5,156 5,766
Kedah 5,473 5,732 7,215 7,936 8,531
Penang 3,024 2,427 3,089 3,066 3,193
Perak 7,166 8,136 8,234 9,143 10,580
Selangor 5,868 5,328 5,799 6,241 7,078
Negeri Sembilan 358 353 295 300 353
Melaka 914 948 1,330 1,112 1,273
West Johor 3,672 4,165 4,097 4,638 4,057
Subtotal 31,939 32,666 35,019 37,592 40,831
Eastern Peninsular Malaysia
Kelantan 7,481 5,616 5,695 6,007 6,714
Terengganu 8,529 8,654 8,706 8,670 8,651
Pahang 2,932 3,848 4,539 5,497 5,559
East Johor 4,174 4,386 5,213 4,982 4,977
Subtotal 23,116 22,504 24,153 25,156 25,901
Sarawak
Kuching 1,646 1,646 1,484 1,497 1,449
Santubong 639 639 399 926 581
Sadong Jaya 623 623 178 346 287
Sematan 504 504 379 200 185
Batang Lupar 523 523 364 383 602
Saribas/Kalaka 563 563 351 593 542
Sibu/Igan 825 825 609 447 374
Sarikei/Bintangor 297 297 338 295 337
Mukah/Oya 1,694 1,694 891 739 1,148
Belawai 2,597 2,597 2,907 364 342
Tg. Manis 4,691 1,957
Matu Daro 1,139 1,139 635 1,276 1,235
Bintulu 731 731 485 674 802
Miri 916 916 966 866 891
Limbang 109 109 76 155 136
Lawas 400 400 282 461 572
Total 13,206 13,206 10,344 13,913 11,440
Source: Department of Fisheries, Malaysia (2005–2009).
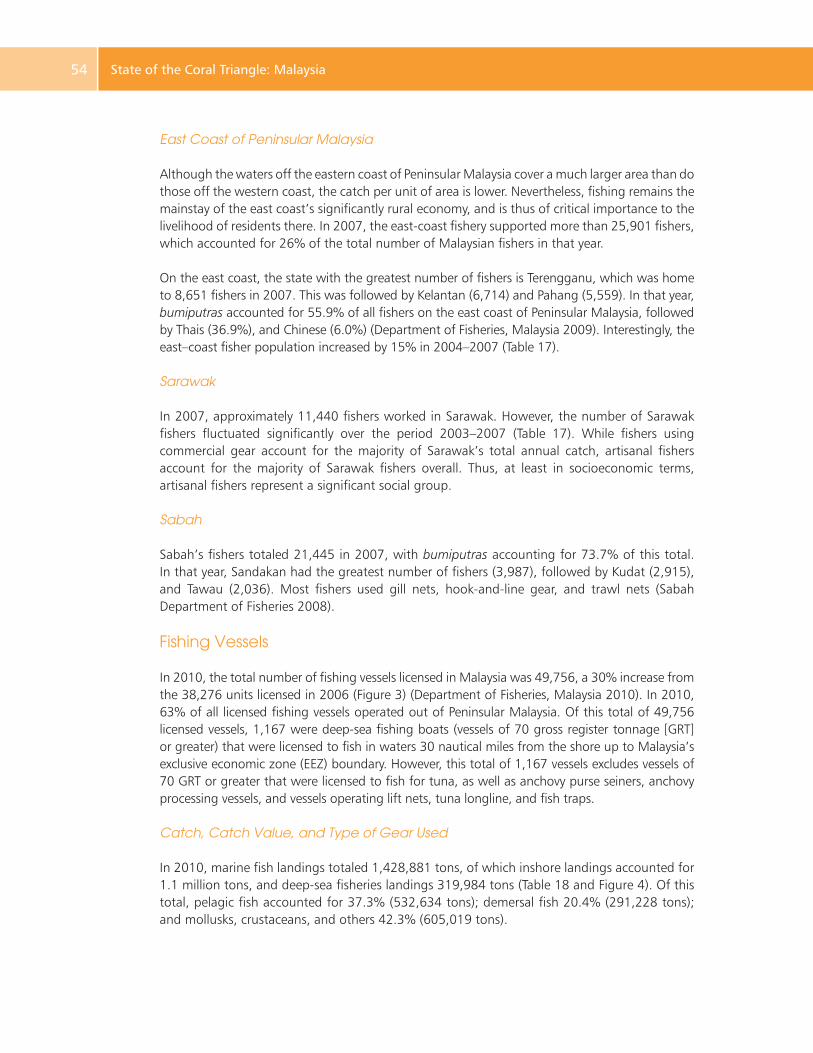
Same Energy, More Power54 State of the Coral Triangle: Malaysia54
East Coast of Peninsular Malaysia
Although the waters off the eastern coast of Peninsular Malaysia cover a much larger area than do those off the western coast, the catch per unit of area is lower. Nevertheless, fishing remains the mainstay of the east coast’s significantly rural economy, and is thus of critical importance to the livelihood of residents there. In 2007, the east-coast fishery supported more than 25,901 fishers, which accounted for 26% of the total number of Malaysian fishers in that year.
On the east coast, the state with the greatest number of fishers is Terengganu, which was home to 8,651 fishers in 2007. This was followed by Kelantan (6,714) and Pahang (5,559). In that year, bumiputras accounted for 55.9% of all fishers on the east coast of Peninsular Malaysia, followed by Thais (36.9%), and Chinese (6.0%) (Department of Fisheries, Malaysia 2009). Interestingly, the east–coast fisher population increased by 15% in 2004–2007 (Table 17).
Sarawak
In 2007, approximately 11,440 fishers worked in Sarawak. However, the number of Sarawak fishers fluctuated significantly over the period 2003–2007 (Table 17). While fishers using commercial gear account for the majority of Sarawak’s total annual catch, artisanal fishers account for the majority of Sarawak fishers overall. Thus, at least in socioeconomic terms, artisanal fishers represent a significant social group.
Sabah
Sabah’s fishers totaled 21,445 in 2007, with bumiputras accounting for 73.7% of this total. In that year, Sandakan had the greatest number of fishers (3,987), followed by Kudat (2,915), and Tawau (2,036). Most fishers used gill nets, hook-and-line gear, and trawl nets (Sabah Department of Fisheries 2008).
Fishing Vessels
In 2010, the total number of fishing vessels licensed in Malaysia was 49,756, a 30% increase from the 38,276 units licensed in 2006 (Figure 3) (Department of Fisheries, Malaysia 2010). In 2010, 63% of all licensed fishing vessels operated out of Peninsular Malaysia. Of this total of 49,756 licensed vessels, 1,167 were deep-sea fishing boats (vessels of 70 gross register tonnage [GRT] or greater) that were licensed to fish in waters 30 nautical miles from the shore up to Malaysia’s exclusive economic zone (EEZ) boundary. However, this total of 1,167 vessels excludes vessels of 70 GRT or greater that were licensed to fish for tuna, as well as anchovy purse seiners, anchovy processing vessels, and vessels operating lift nets, tuna longline, and fish traps.
Catch, Catch Value, and Type of Gear Used
In 2010, marine fish landings totaled 1,428,881 tons, of which inshore landings accounted for 1.1 million tons, and deep-sea fisheries landings 319,984 tons (Table 18 and Figure 4). Of this total, pelagic fish accounted for 37.3% (532,634 tons); demersal fish 20.4% (291,228 tons); and mollusks, crustaceans, and others 42.3% (605,019 tons).
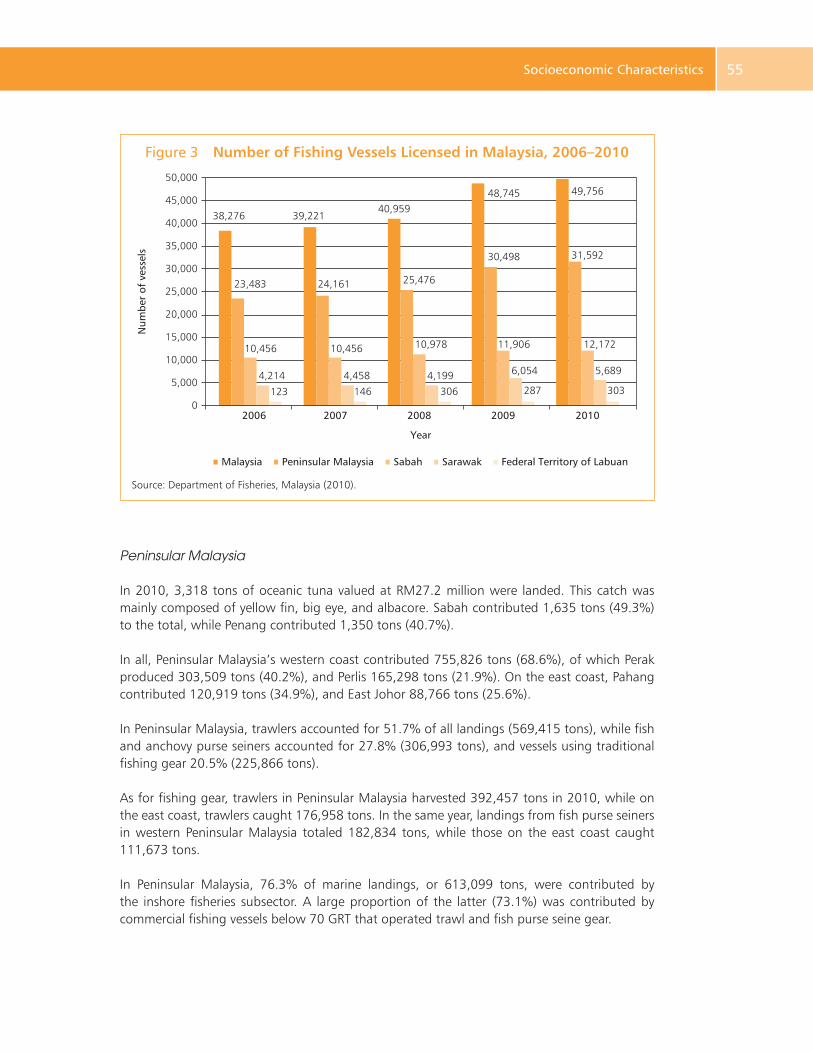
Causes of Underinvestment and Persistent Energy Inefficiency 55 Socioeconomic Characteristics 55
Peninsular Malaysia
In 2010, 3,318 tons of oceanic tuna valued at RM27.2 million were landed. This catch was mainly composed of yellow fin, big eye, and albacore. Sabah contributed 1,635 tons (49.3%) to the total, while Penang contributed 1,350 tons (40.7%).
In all, Peninsular Malaysia’s western coast contributed 755,826 tons (68.6%), of which Perak produced 303,509 tons (40.2%), and Perlis 165,298 tons (21.9%). On the east coast, Pahang contributed 120,919 tons (34.9%), and East Johor 88,766 tons (25.6%).
In Peninsular Malaysia, trawlers accounted for 51.7% of all landings (569,415 tons), while fish and anchovy purse seiners accounted for 27.8% (306,993 tons), and vessels using traditional fishing gear 20.5% (225,866 tons).
As for fishing gear, trawlers in Peninsular Malaysia harvested 392,457 tons in 2010, while on the east coast, trawlers caught 176,958 tons. In the same year, landings from fish purse seiners in western Peninsular Malaysia totaled 182,834 tons, while those on the east coast caught 111,673 tons.
In Peninsular Malaysia, 76.3% of marine landings, or 613,099 tons, were contributed by the inshore fisheries subsector. A large proportion of the latter (73.1%) was contributed by commercial fishing vessels below 70 GRT that operated trawl and fish purse seine gear.
Figure 3 Number of Fishing Vessels Licensed in Malaysia, 2006–2010
Source: Department of Fisheries, Malaysia (2010).
Num
ber
of v
esse
ls
50,000
45,000
40,000
35,000
25,000
30,000
15,000
20,000
10,000
0
5,000
38,276 39,22140,959
48,745 49,756
31,592
12,172
5,689
303
30,498
11,906
6,054
287
25,476
10,978
4,199
306
24,161
10,456
4,458
146
23,483
10,456
4,214
123
2006 2007 2008 2009 2010
Year
Malaysia Sabah SarawakPeninsular Malaysia Federal Territory of Labuan
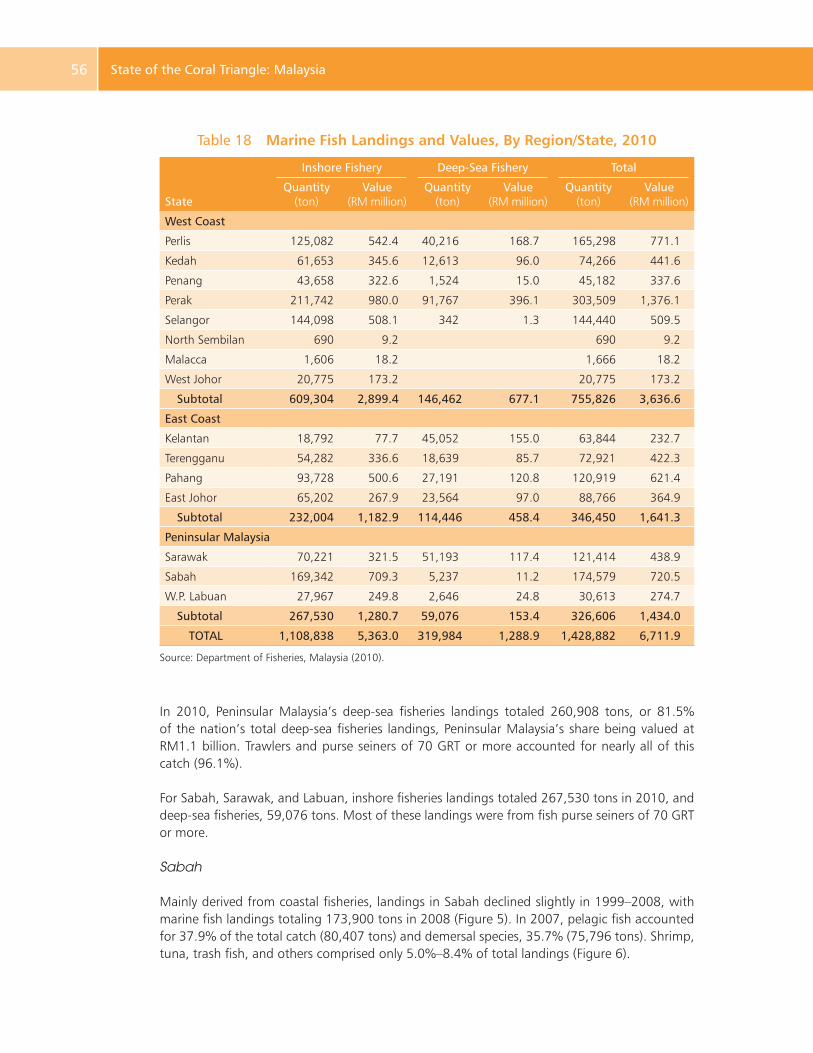
Same Energy, More Power56 State of the Coral Triangle: Malaysia56
Table 18 Marine Fish Landings and Values, By Region/State, 2010
State
Inshore Fishery Deep-Sea Fishery Total
Quantity(ton)
Value(RM million)
Quantity(ton)
Value(RM million)
Quantity(ton)
Value(RM million)
West Coast
Perlis 125,082 542.4 40,216 168.7 165,298 771.1
Kedah 61,653 345.6 12,613 96.0 74,266 441.6
Penang 43,658 322.6 1,524 15.0 45,182 337.6
Perak 211,742 980.0 91,767 396.1 303,509 1,376.1
Selangor 144,098 508.1 342 1.3 144,440 509.5
North Sembilan 690 9.2 690 9.2
Malacca 1,606 18.2 1,666 18.2
West Johor 20,775 173.2 20,775 173.2
Subtotal 609,304 2,899.4 146,462 677.1 755,826 3,636.6
East Coast
Kelantan 18,792 77.7 45,052 155.0 63,844 232.7
Terengganu 54,282 336.6 18,639 85.7 72,921 422.3
Pahang 93,728 500.6 27,191 120.8 120,919 621.4
East Johor 65,202 267.9 23,564 97.0 88,766 364.9
Subtotal 232,004 1,182.9 114,446 458.4 346,450 1,641.3
Peninsular Malaysia
Sarawak 70,221 321.5 51,193 117.4 121,414 438.9
Sabah 169,342 709.3 5,237 11.2 174,579 720.5
W.P. Labuan 27,967 249.8 2,646 24.8 30,613 274.7
Subtotal 267,530 1,280.7 59,076 153.4 326,606 1,434.0
TOTAL 1,108,838 5,363.0 319,984 1,288.9 1,428,882 6,711.9
Source: Department of Fisheries, Malaysia (2010).
In 2010, Peninsular Malaysia’s deep-sea fisheries landings totaled 260,908 tons, or 81.5% of the nation’s total deep-sea fisheries landings, Peninsular Malaysia’s share being valued at RM1.1 billion. Trawlers and purse seiners of 70 GRT or more accounted for nearly all of this catch (96.1%).
For Sabah, Sarawak, and Labuan, inshore fisheries landings totaled 267,530 tons in 2010, and deep-sea fisheries, 59,076 tons. Most of these landings were from fish purse seiners of 70 GRT or more.
Sabah
Mainly derived from coastal fisheries, landings in Sabah declined slightly in 1999–2008, with marine fish landings totaling 173,900 tons in 2008 (Figure 5). In 2007, pelagic fish accounted for 37.9% of the total catch (80,407 tons) and demersal species, 35.7% (75,796 tons). Shrimp, tuna, trash fish, and others comprised only 5.0%–8.4% of total landings (Figure 6).
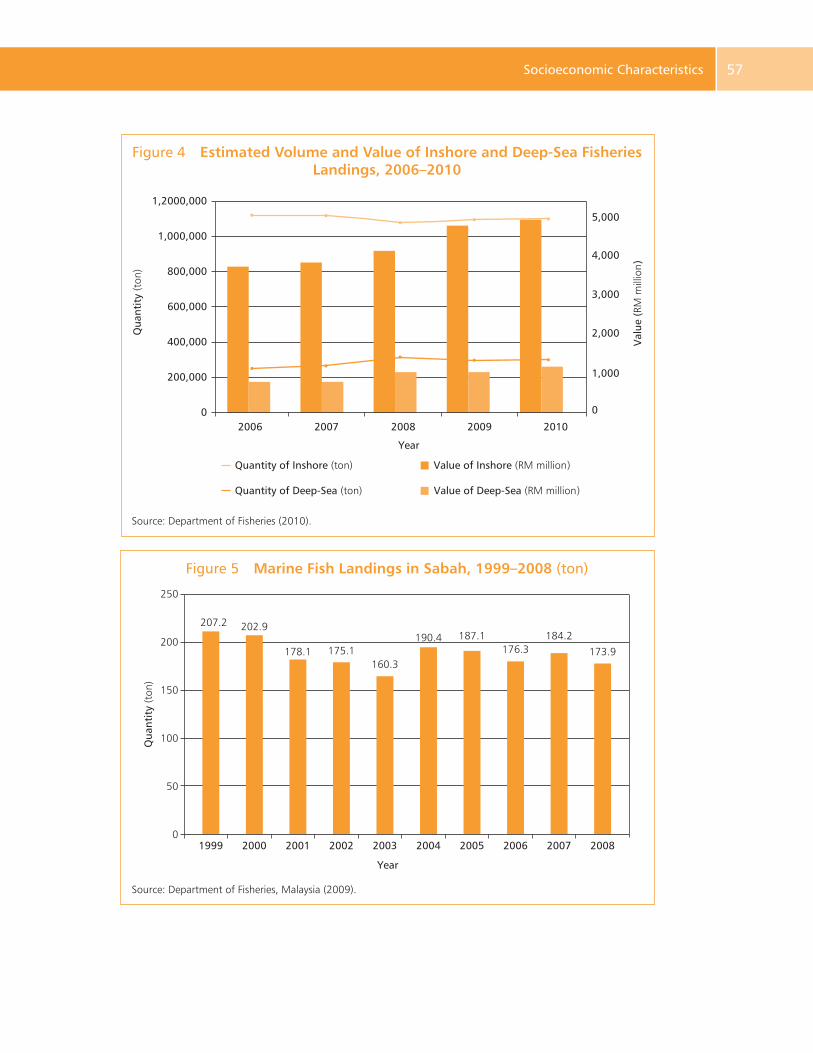
Causes of Underinvestment and Persistent Energy Inefficiency 57 Socioeconomic Characteristics 57
Figure 4 Estimated Volume and Value of Inshore and Deep-Sea Fisheries Landings, 2006–2010
Source: Department of Fisheries (2010).
Qua
ntit
y (t
on)
1,000,000
5,000
4,000
Val
ue (
RM m
illio
n)
3,000
2,000
1,000
0
1,2000,000
600,000
400,000
800,000
200,000
02006 2007 2008 2009 2010
Year
Quantity of Inshore (ton) Value of Inshore (RM million)
Value of Deep-Sea (RM million)Quantity of Deep-Sea (ton)
Figure 5 Marine Fish Landings in Sabah, 1999–2008 (ton)
250
200
207.2 202.9
178.1 175.1160.3
190.4 187.1176.3
184.2173.9
150
100
50
1999 2000 2001 2002 2003 2004 2005 2006 2007 20080
Year
Qua
ntit
y (t
on)
Source: Department of Fisheries, Malaysia (2009).
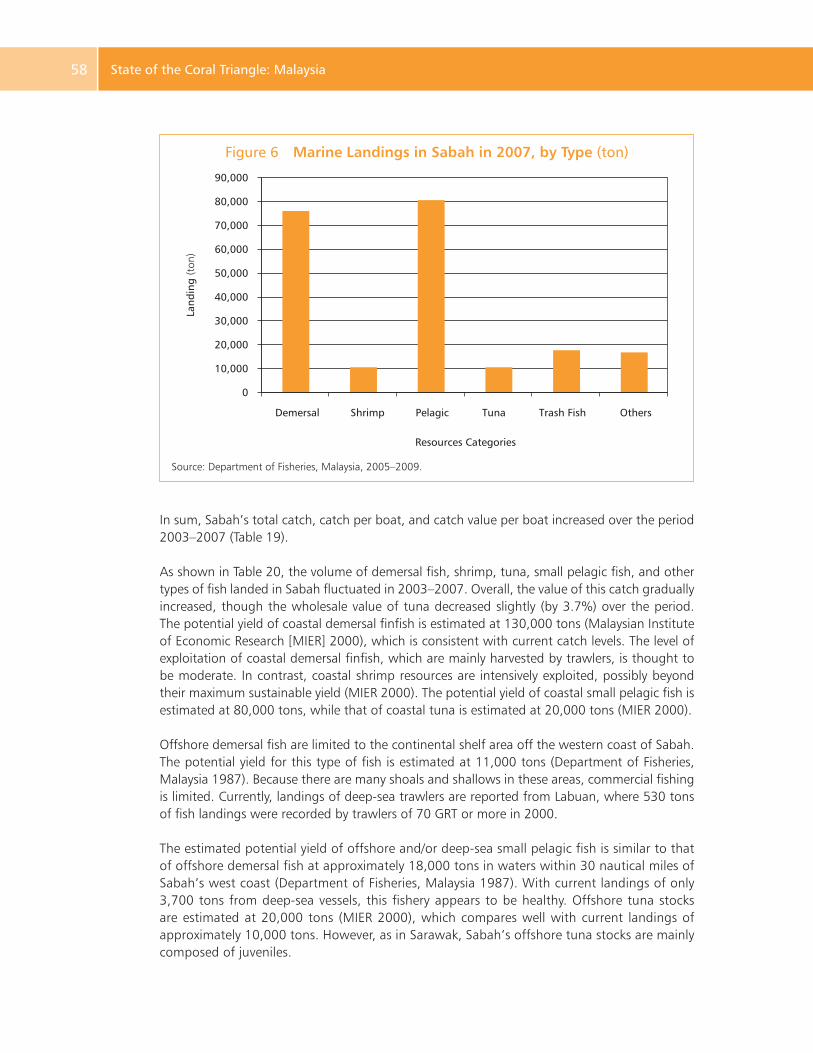
Same Energy, More Power58 State of the Coral Triangle: Malaysia58
Figure 6 Marine Landings in Sabah in 2007, by Type (ton)
Source: Department of Fisheries, Malaysia, 2005–2009.
90,000
80,000
70,000
60,000
50,000
40,000
30,000
20,000
10,000
0
Demersal Shrimp Pelagic
Resources Categories
Land
ing
(ton
)
Tuna Trash Fish Others
In sum, Sabah’s total catch, catch per boat, and catch value per boat increased over the period 2003–2007 (Table 19).
As shown in Table 20, the volume of demersal fish, shrimp, tuna, small pelagic fish, and other types of fish landed in Sabah fluctuated in 2003–2007. Overall, the value of this catch gradually increased, though the wholesale value of tuna decreased slightly (by 3.7%) over the period. The potential yield of coastal demersal finfish is estimated at 130,000 tons (Malaysian Institute of Economic Research [MIER] 2000), which is consistent with current catch levels. The level of exploitation of coastal demersal finfish, which are mainly harvested by trawlers, is thought to be moderate. In contrast, coastal shrimp resources are intensively exploited, possibly beyond their maximum sustainable yield (MIER 2000). The potential yield of coastal small pelagic fish is estimated at 80,000 tons, while that of coastal tuna is estimated at 20,000 tons (MIER 2000).
Offshore demersal fish are limited to the continental shelf area off the western coast of Sabah. The potential yield for this type of fish is estimated at 11,000 tons (Department of Fisheries, Malaysia 1987). Because there are many shoals and shallows in these areas, commercial fishing is limited. Currently, landings of deep-sea trawlers are reported from Labuan, where 530 tons of fish landings were recorded by trawlers of 70 GRT or more in 2000.
The estimated potential yield of offshore and/or deep-sea small pelagic fish is similar to that of offshore demersal fish at approximately 18,000 tons in waters within 30 nautical miles of Sabah’s west coast (Department of Fisheries, Malaysia 1987). With current landings of only 3,700 tons from deep-sea vessels, this fishery appears to be healthy. Offshore tuna stocks are estimated at 20,000 tons (MIER 2000), which compares well with current landings of approximately 10,000 tons. However, as in Sarawak, Sabah’s offshore tuna stocks are mainly composed of juveniles.
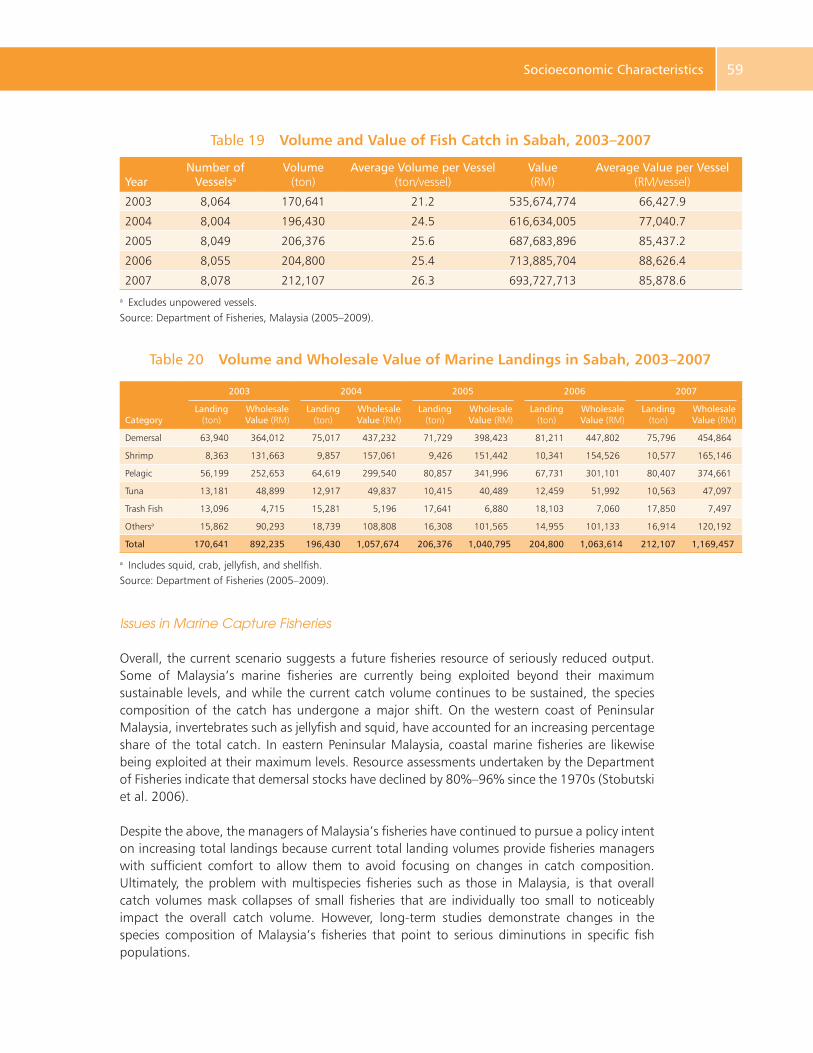
Causes of Underinvestment and Persistent Energy Inefficiency 59 Socioeconomic Characteristics 59
Table 19 Volume and Value of Fish Catch in Sabah, 2003–2007
YearNumber of
VesselsaVolume
(ton)Average Volume per Vessel
(ton/vessel)Value(RM)
Average Value per Vessel(RM/vessel)
2003 8,064 170,641 21.2 535,674,774 66,427.9
2004 8,004 196,430 24.5 616,634,005 77,040.7
2005 8,049 206,376 25.6 687,683,896 85,437.2
2006 8,055 204,800 25.4 713,885,704 88,626.4
2007 8,078 212,107 26.3 693,727,713 85,878.6a Excludes unpowered vessels.Source: Department of Fisheries, Malaysia (2005–2009).
Table 20 Volume and Wholesale Value of Marine Landings in Sabah, 2003–2007
Category
2003 2004 2005 2006 2007
Landing(ton)
Wholesale Value (RM)
Landing(ton)
Wholesale Value (RM)
Landing(ton)
Wholesale Value (RM)
Landing(ton)
Wholesale Value (RM)
Landing(ton)
Wholesale Value (RM)
Demersal 63,940 364,012 75,017 437,232 71,729 398,423 81,211 447,802 75,796 454,864
Shrimp 8,363 131,663 9,857 157,061 9,426 151,442 10,341 154,526 10,577 165,146
Pelagic 56,199 252,653 64,619 299,540 80,857 341,996 67,731 301,101 80,407 374,661
Tuna 13,181 48,899 12,917 49,837 10,415 40,489 12,459 51,992 10,563 47,097
Trash Fish 13,096 4,715 15,281 5,196 17,641 6,880 18,103 7,060 17,850 7,497
Othersa 15,862 90,293 18,739 108,808 16,308 101,565 14,955 101,133 16,914 120,192
Total 170,641 892,235 196,430 1,057,674 206,376 1,040,795 204,800 1,063,614 212,107 1,169,457
a Includes squid, crab, jellyfish, and shellfish.Source: Department of Fisheries (2005–2009).
Issues in Marine Capture Fisheries
Overall, the current scenario suggests a future fisheries resource of seriously reduced output. Some of Malaysia’s marine fisheries are currently being exploited beyond their maximum sustainable levels, and while the current catch volume continues to be sustained, the species composition of the catch has undergone a major shift. On the western coast of Peninsular Malaysia, invertebrates such as jellyfish and squid, have accounted for an increasing percentage share of the total catch. In eastern Peninsular Malaysia, coastal marine fisheries are likewise being exploited at their maximum levels. Resource assessments undertaken by the Department of Fisheries indicate that demersal stocks have declined by 80%–96% since the 1970s (Stobutski et al. 2006).
Despite the above, the managers of Malaysia’s fisheries have continued to pursue a policy intent on increasing total landings because current total landing volumes provide fisheries managers with sufficient comfort to allow them to avoid focusing on changes in catch composition. Ultimately, the problem with multispecies fisheries such as those in Malaysia, is that overall catch volumes mask collapses of small fisheries that are individually too small to noticeably impact the overall catch volume. However, long-term studies demonstrate changes in the species composition of Malaysia’s fisheries that point to serious diminutions in specific fish populations.
Same Energy, More Power60 State of the Coral Triangle: Malaysia60
Similarly, recent studies of Malaysia’s deep-sea fisheries point to a significant decline in fish stocks, possibly due to poaching. While there is still scope for developing the offshore fisheries of Sabah and Sarawak, the extent of poaching there makes further development a risky policy option. In short, it is likely that foreign poachers have exploited the resources that are thought to remain.
While a comprehensive fisheries management regimen is in place in Malaysia, it is inadequate for addressing many issues relating to marine resource health. The health of the fisheries resource cannot be divorced from that of the overall marine environment in which extraction is undertaken. For example, current management regimes have tended to focus on controlling fishing effort through licensing and access limitations as a means of sustaining current stock levels. However, the complexity of the marine environment precludes such a unidimensional approach to managing fisheries.
Fisheries resource management cannot be considered in isolation of issues such as habitat degradation and pollution. In this respect, the present regimen is fundamentally lacking. For example, habitat conservation has been limited to establishing marine parks and protecting coral reefs. While the parks have, to a large extent, managed to limit the type of degradation seen elsewhere in the region (McManus 1988), the dichotomy in jurisdiction between the federal government and state governments means that while the former is in charge of marine parks, land matters (and land-based development on the islands) largely remains under the jurisdiction of the state governments. Thus, the dangers of coral reef ecosystem destruction posed by water quality degradation associated with unsustainable land development on islands adjacent to marine parks is very much still a concern.
Because of various legal and administrative issues, no mangroves or seagrass reserves have been declared exclusively for marine environmental or fisheries purposes. The degradation of the environmental health of the marine environment, and the fisheries resources that depend on it, have strong sociopolitical implications. Fish is a staple source of protein in the local diet, and is a major feature of Malaysia’s national cuisine. As a result, the increased affluence that has accompanied Malaysia’s economic growth has escalated fish consumption. Though aquaculture will undoubtedly supply a portion of this increase in the quantity of fish demanded, traditional consumer preferences dictate that marine fisheries will be called upon to cater to much of this increased demand.
As a result of these factors, changes in the availability of fish can have far-reaching impacts. More specifically, retail fish prices rose dramatically during the 1990s. For example, in 1991–2000, the retail price of Grade 1 fish rose by 46.4%, that for Grade 2 fish rose by 59.4%, and for Grade 3, 61.4%, while shrimp prices increased by 46.9%. For the period 1998–2007, the retail price of Grade 2 fish increased by 15.2%, that for Grade 3 fish by 34.1%, and that for shrimp by 3.9%, even though the retail price of Grade 1 fish declined by about 10% over this period.
Existing fisheries regimes can only work in an environment where stakeholders are willing to make short-term sacrifices to ensure long-term sustainability. However, in the case of Malaysia’s coastal fisheries, fishers are increasingly unwilling to exercise short-term self-restraint as catches stagnate. In short, the economic imperative to which the sector currently responds is that of harvesting fish now, rather than waiting for some future time when conditions will most likely become untenable for the fish to survive anyway. In this view, any reduction in catch is expected to be counterbalanced by higher market prices that are driven by such a reduction.
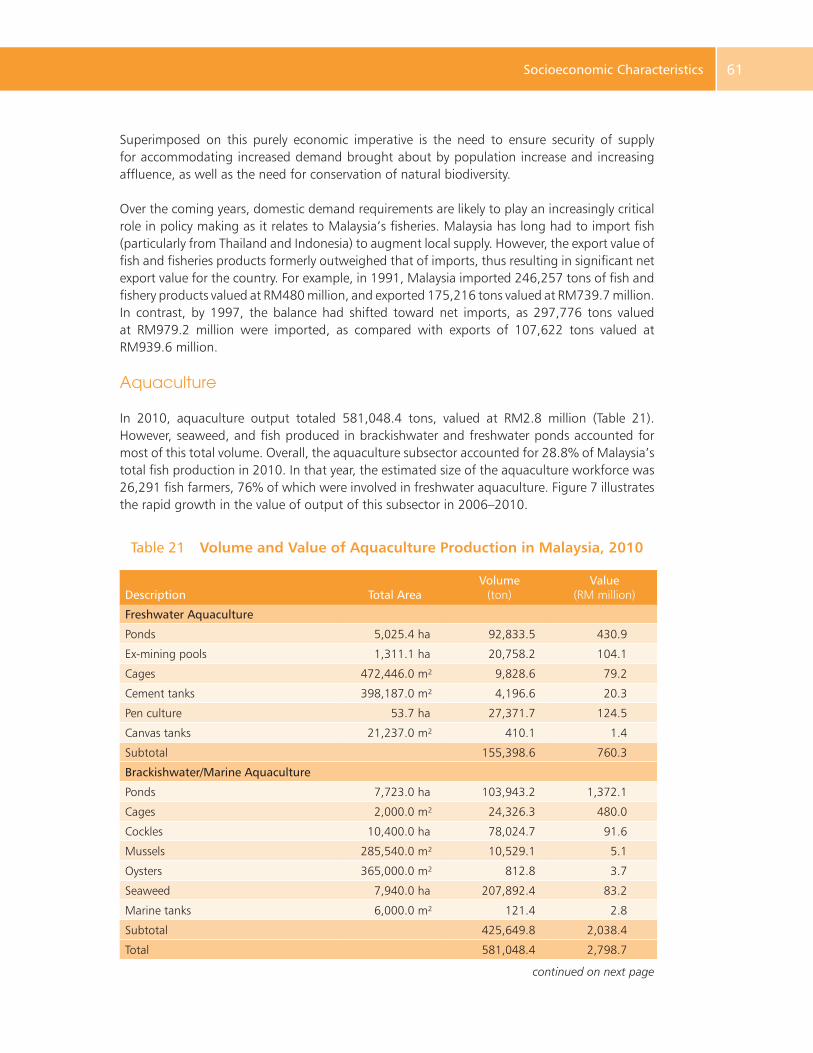
Causes of Underinvestment and Persistent Energy Inefficiency 61 Socioeconomic Characteristics 61
Superimposed on this purely economic imperative is the need to ensure security of supply for accommodating increased demand brought about by population increase and increasing affluence, as well as the need for conservation of natural biodiversity.
Over the coming years, domestic demand requirements are likely to play an increasingly critical role in policy making as it relates to Malaysia’s fisheries. Malaysia has long had to import fish (particularly from Thailand and Indonesia) to augment local supply. However, the export value of fish and fisheries products formerly outweighed that of imports, thus resulting in significant net export value for the country. For example, in 1991, Malaysia imported 246,257 tons of fish and fishery products valued at RM480 million, and exported 175,216 tons valued at RM739.7 million. In contrast, by 1997, the balance had shifted toward net imports, as 297,776 tons valued at RM979.2 million were imported, as compared with exports of 107,622 tons valued at RM939.6 million.
Aquaculture
In 2010, aquaculture output totaled 581,048.4 tons, valued at RM2.8 million (Table 21). However, seaweed, and fish produced in brackishwater and freshwater ponds accounted for most of this total volume. Overall, the aquaculture subsector accounted for 28.8% of Malaysia’s total fish production in 2010. In that year, the estimated size of the aquaculture workforce was 26,291 fish farmers, 76% of which were involved in freshwater aquaculture. Figure 7 illustrates the rapid growth in the value of output of this subsector in 2006–2010.
Table 21 Volume and Value of Aquaculture Production in Malaysia, 2010
Description Total AreaVolume
(ton)Value
(RM million)
Freshwater Aquaculture
Ponds 5,025.4 ha 92,833.5 430.9
Ex-mining pools 1,311.1 ha 20,758.2 104.1
Cages 472,446.0 m² 9,828.6 79.2
Cement tanks 398,187.0 m² 4,196.6 20.3
Pen culture 53.7 ha 27,371.7 124.5
Canvas tanks 21,237.0 m² 410.1 1.4
Subtotal 155,398.6 760.3
Brackishwater/Marine Aquaculture
Ponds 7,723.0 ha 103,943.2 1,372.1
Cages 2,000.0 m² 24,326.3 480.0
Cockles 10,400.0 ha 78,024.7 91.6
Mussels 285,540.0 m² 10,529.1 5.1
Oysters 365,000.0 m² 812.8 3.7
Seaweed 7,940.0 ha 207,892.4 83.2
Marine tanks 6,000.0 m² 121.4 2.8
Subtotal 425,649.8 2,038.4
Total 581,048.4 2,798.7
continued on next page
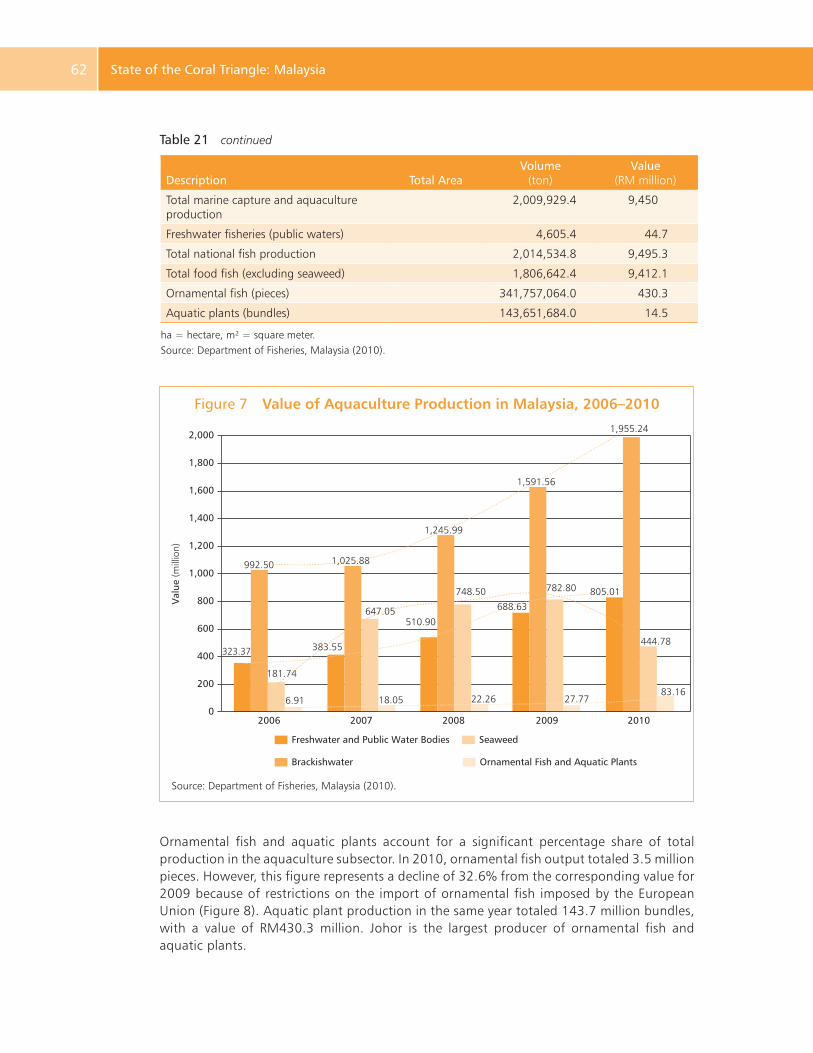
Same Energy, More Power62 State of the Coral Triangle: Malaysia62
Description Total AreaVolume
(ton)Value
(RM million)
Total marine capture and aquaculture production
2,009,929.4 9,450
Freshwater fisheries (public waters) 4,605.4 44.7
Total national fish production 2,014,534.8 9,495.3
Total food fish (excluding seaweed) 1,806,642.4 9,412.1
Ornamental fish (pieces) 341,757,064.0 430.3
Aquatic plants (bundles) 143,651,684.0 14.5
ha = hectare, m² = square meter.Source: Department of Fisheries, Malaysia (2010).
Figure 7 Value of Aquaculture Production in Malaysia, 2006–2010
Source: Department of Fisheries, Malaysia (2010).
Val
ue (m
illio
n)
2,000
1,800
1,600
1,400
1,200
1,000
800
600
400
200
02006 2007 2008 2009 2010
Freshwater and Public Water Bodies
Brackishwater
Seaweed
Ornamental Fish and Aquatic Plants
992.50
323.37
181.74
6.91
647.05
383.55
1,025.88
1,245.99
1,591.56
805.01
444.78
83.1627.7722.2618.05
510.90
748.50
688.63
782.80
1,955.24
Ornamental fish and aquatic plants account for a significant percentage share of total production in the aquaculture subsector. In 2010, ornamental fish output totaled 3.5 million pieces. However, this figure represents a decline of 32.6% from the corresponding value for 2009 because of restrictions on the import of ornamental fish imposed by the European Union (Figure 8). Aquatic plant production in the same year totaled 143.7 million bundles, with a value of RM430.3 million. Johor is the largest producer of ornamental fish and aquatic plants.
Table 21 continued
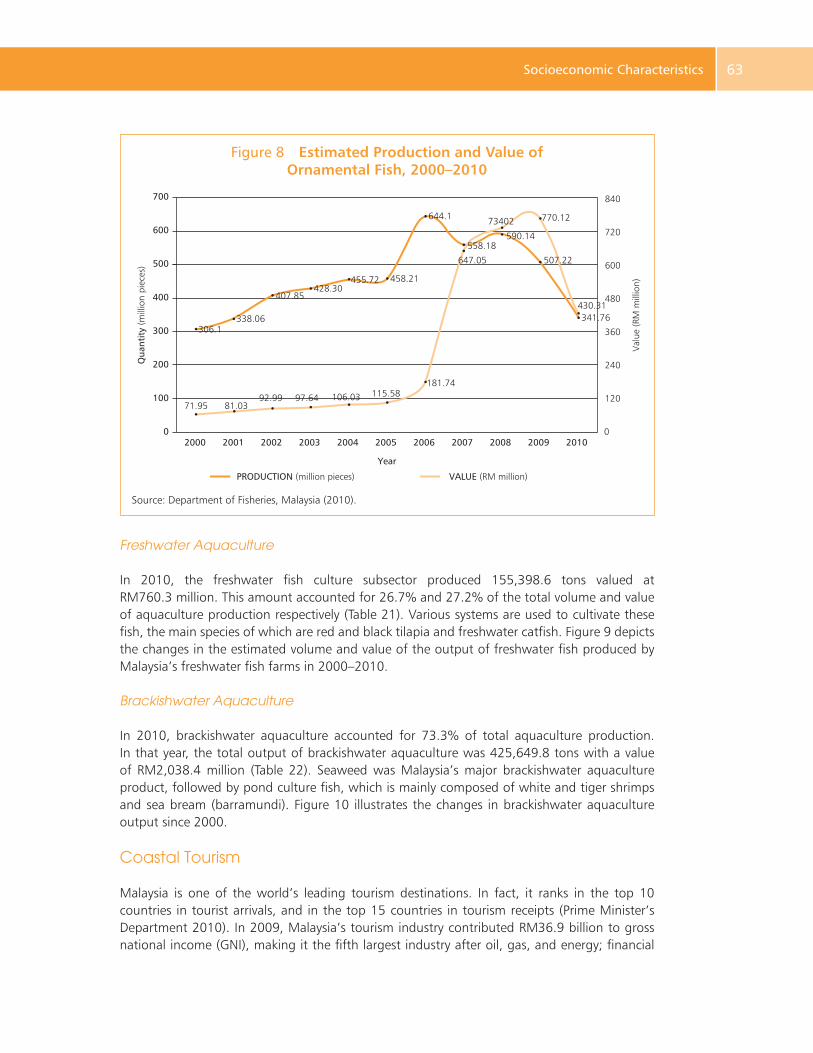
Causes of Underinvestment and Persistent Energy Inefficiency 63 Socioeconomic Characteristics 63
Freshwater Aquaculture
In 2010, the freshwater fish culture subsector produced 155,398.6 tons valued at RM760.3 million. This amount accounted for 26.7% and 27.2% of the total volume and value of aquaculture production respectively (Table 21). Various systems are used to cultivate these fish, the main species of which are red and black tilapia and freshwater catfish. Figure 9 depicts the changes in the estimated volume and value of the output of freshwater fish produced by Malaysia’s freshwater fish farms in 2000–2010.
Brackishwater Aquaculture
In 2010, brackishwater aquaculture accounted for 73.3% of total aquaculture production. In that year, the total output of brackishwater aquaculture was 425,649.8 tons with a value of RM2,038.4 million (Table 22). Seaweed was Malaysia’s major brackishwater aquaculture product, followed by pond culture fish, which is mainly composed of white and tiger shrimps and sea bream (barramundi). Figure 10 illustrates the changes in brackishwater aquaculture output since 2000.
Coastal Tourism
Malaysia is one of the world’s leading tourism destinations. In fact, it ranks in the top 10 countries in tourist arrivals, and in the top 15 countries in tourism receipts (Prime Minister’s Department 2010). In 2009, Malaysia’s tourism industry contributed RM36.9 billion to gross national income (GNI), making it the fifth largest industry after oil, gas, and energy; financial
Figure 8 Estimated Production and Value of Ornamental Fish, 2000–2010
Source: Department of Fisheries, Malaysia (2010).
Qua
ntit
y (m
illio
n pi
eces
)
Year
Val
ue (R
M m
illio
n)
700
600
500
400
300
200
100
0
VALUE (RM million)PRODUCTION (million pieces)
2000 2001
306.1
71.95 81.0392.99 97.64 106.03 115.58
181.74
338.06
407.85428.30
455.72 458.21
644.1
558.18
647.05
73402
590.14
770.12
507.22
430.31341.76
2002 2003 2004 2005 2006 2007 2008 2009 2010
840
720
600
480
360
240
120
0
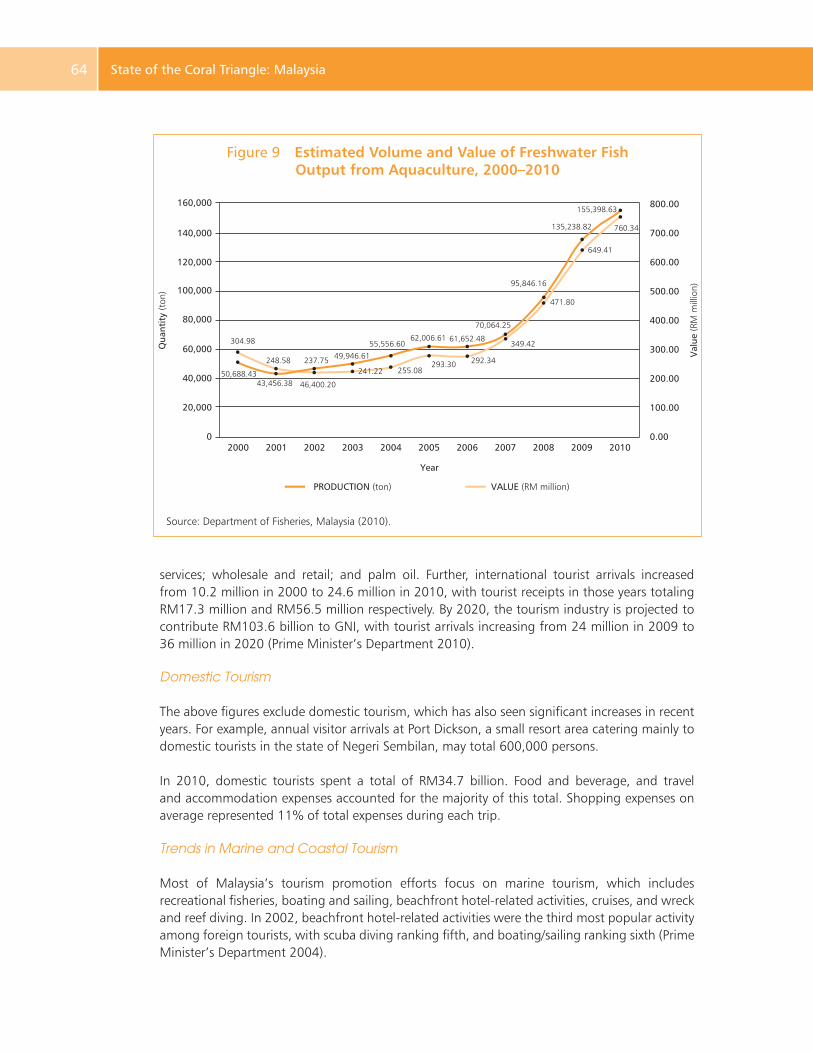
Same Energy, More Power64 State of the Coral Triangle: Malaysia64
Figure 9 Estimated Volume and Value of Freshwater Fish Output from Aquaculture, 2000–2010
Source: Department of Fisheries, Malaysia (2010).
Qua
ntit
y (t
on)
Year
Val
ue (R
M m
illio
n)
160,000
140,000
120,000
80,000
100,000
60,000
40,000
20,000
0
VALUE (RM million)PRODUCTION (ton)
2000 2001 2002 2003 2004 2005 2006 2007 2008 2009 2010
800.00
293.30
155,398.63
135,238.82
95,846.16
62,006.6155,556.60
49,946.61
46,400.2043,456.38
61,652.48
760.34
649.41
471.80
349.42
292.34255.08
237.75
304.98
248.58
50,688.43 241.22
70,064.25
700.00
600.00
500.00
400.00
300.00
200.00
100.00
0.00
services; wholesale and retail; and palm oil. Further, international tourist arrivals increased from 10.2 million in 2000 to 24.6 million in 2010, with tourist receipts in those years totaling RM17.3 million and RM56.5 million respectively. By 2020, the tourism industry is projected to contribute RM103.6 billion to GNI, with tourist arrivals increasing from 24 million in 2009 to 36 million in 2020 (Prime Minister’s Department 2010).
Domestic Tourism
The above figures exclude domestic tourism, which has also seen significant increases in recent years. For example, annual visitor arrivals at Port Dickson, a small resort area catering mainly to domestic tourists in the state of Negeri Sembilan, may total 600,000 persons.
In 2010, domestic tourists spent a total of RM34.7 billion. Food and beverage, and travel and accommodation expenses accounted for the majority of this total. Shopping expenses on average represented 11% of total expenses during each trip.
Trends in Marine and Coastal Tourism
Most of Malaysia’s tourism promotion efforts focus on marine tourism, which includes recreational fisheries, boating and sailing, beachfront hotel-related activities, cruises, and wreck and reef diving. In 2002, beachfront hotel-related activities were the third most popular activity among foreign tourists, with scuba diving ranking fifth, and boating/sailing ranking sixth (Prime Minister’s Department 2004).
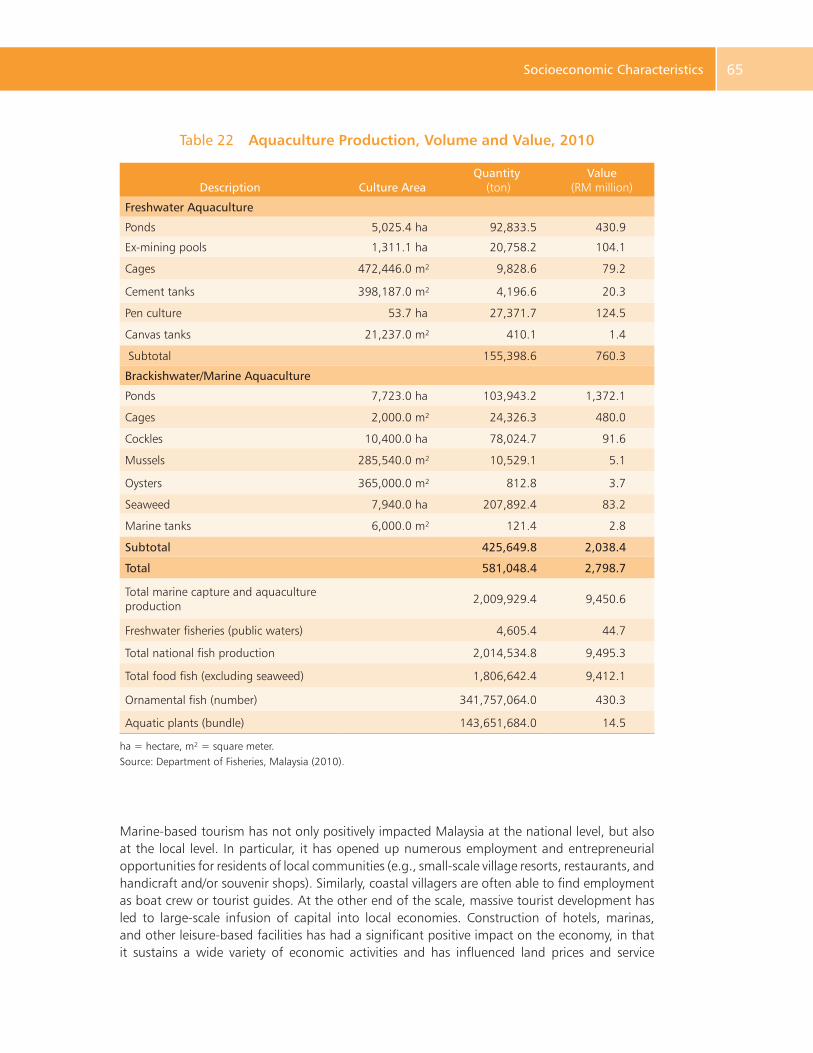
Causes of Underinvestment and Persistent Energy Inefficiency 65 Socioeconomic Characteristics 65
Table 22 Aquaculture Production, Volume and Value, 2010
Description Culture AreaQuantity
(ton)Value
(RM million)
Freshwater Aquaculture
Ponds 5,025.4 ha 92,833.5 430.9
Ex-mining pools 1,311.1 ha 20,758.2 104.1
Cages 472,446.0 m² 9,828.6 79.2
Cement tanks 398,187.0 m² 4,196.6 20.3
Pen culture 53.7 ha 27,371.7 124.5
Canvas tanks 21,237.0 m² 410.1 1.4
Subtotal 155,398.6 760.3
Brackishwater/Marine Aquaculture
Ponds 7,723.0 ha 103,943.2 1,372.1
Cages 2,000.0 m² 24,326.3 480.0
Cockles 10,400.0 ha 78,024.7 91.6
Mussels 285,540.0 m² 10,529.1 5.1
Oysters 365,000.0 m² 812.8 3.7
Seaweed 7,940.0 ha 207,892.4 83.2
Marine tanks 6,000.0 m² 121.4 2.8
Subtotal 425,649.8 2,038.4
Total 581,048.4 2,798.7
Total marine capture and aquaculture production
2,009,929.4 9,450.6
Freshwater fisheries (public waters) 4,605.4 44.7
Total national fish production 2,014,534.8 9,495.3
Total food fish (excluding seaweed) 1,806,642.4 9,412.1
Ornamental fish (number) 341,757,064.0 430.3
Aquatic plants (bundle) 143,651,684.0 14.5
ha = hectare, m² = square meter.Source: Department of Fisheries, Malaysia (2010).
Marine-based tourism has not only positively impacted Malaysia at the national level, but also at the local level. In particular, it has opened up numerous employment and entrepreneurial opportunities for residents of local communities (e.g., small-scale village resorts, restaurants, and handicraft and/or souvenir shops). Similarly, coastal villagers are often able to find employment as boat crew or tourist guides. At the other end of the scale, massive tourist development has led to large-scale infusion of capital into local economies. Construction of hotels, marinas, and other leisure-based facilities has had a significant positive impact on the economy, in that it sustains a wide variety of economic activities and has influenced land prices and service
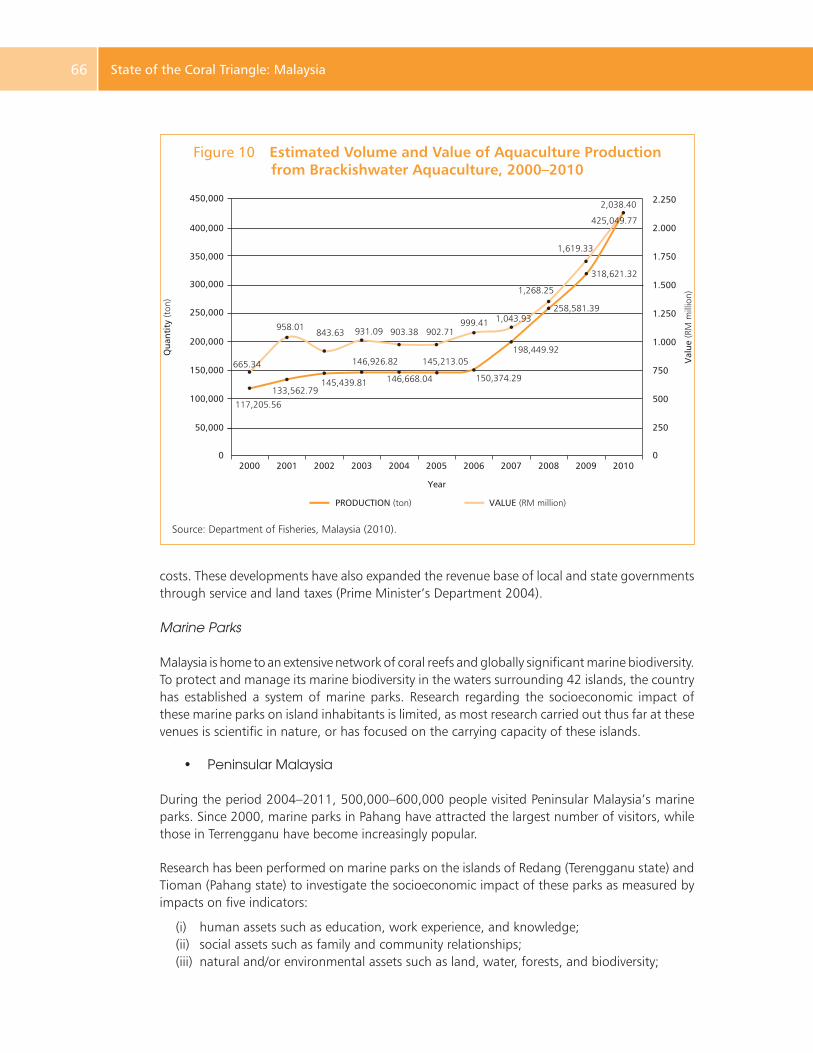
Same Energy, More Power66 State of the Coral Triangle: Malaysia66
costs. These developments have also expanded the revenue base of local and state governments through service and land taxes (Prime Minister’s Department 2004).
Marine Parks
Malaysia is home to an extensive network of coral reefs and globally significant marine biodiversity. To protect and manage its marine biodiversity in the waters surrounding 42 islands, the country has established a system of marine parks. Research regarding the socioeconomic impact of these marine parks on island inhabitants is limited, as most research carried out thus far at these venues is scientific in nature, or has focused on the carrying capacity of these islands.
• Peninsular Malaysia
During the period 2004–2011, 500,000–600,000 people visited Peninsular Malaysia’s marine parks. Since 2000, marine parks in Pahang have attracted the largest number of visitors, while those in Terrengganu have become increasingly popular.
Research has been performed on marine parks on the islands of Redang (Terengganu state) and Tioman (Pahang state) to investigate the socioeconomic impact of these parks as measured by impacts on five indicators:
(i) human assets such as education, work experience, and knowledge;(ii) social assets such as family and community relationships;(iii) natural and/or environmental assets such as land, water, forests, and biodiversity;
Figure 10 Estimated Volume and Value of Aquaculture Production from Brackishwater Aquaculture, 2000–2010
Source: Department of Fisheries, Malaysia (2010).
Qua
ntit
y (t
on)
Val
ue (R
M m
illio
n)
450,000
400,000
350,000
250,000
300,000
200,000
150,000
100,000
50,000
2.2502,038.40
425,049.77
1,619.33
1,268.25
1,043.93999.41902.71903.38931.09
146,926.82 145,213.05
146,668.04145,439.81
117,205.56
133,562.79
665.34
843.63958.01
198,449.92
150,374.29
258,581.39
318,621.32
2.000
1.750
1.500
1.250
1.000
750
500
250
00
Year
VALUE (RM million)PRODUCTION (ton)
2000 2001 2002 2003 2004 2005 2006 2007 2008 2009 2010
Causes of Underinvestment and Persistent Energy Inefficiency 67 Socioeconomic Characteristics 67
(iv) physical assets such as transport, infrastructure, and technology; and (v) financial assets such as savings and loans.
Although the standard of living has improved on both islands since these marine parks were established, several issues will need to be addressed if these parks are to meet the government’s goal of providing high-value tourism services. A few differences between the two islands influence the standard of living. For example, the villages on Redang Island are located at quite a distance from the major tourist attraction, while those on Tioman Island lie within a comfortable distance from the major tourist areas. Further, on Tioman Island, local residents own most of the resorts and chalets, while this is not the case on Redang Island.
Overall, the study concluded that the tourism industry focusing on Peninsular Malaysia’s marine parks has been unsuccessful in generating the desired income multiplier effect on the economies of the local communities concerned. Despite a mature tourism industry in the various marine parks, the dichotomous nature of the industry may have contributed to its limited income multiplier effect (Kari et al. 2011). The study thus concluded that a more systematic, people-oriented approach to supporting community priorities that accords with their capabilities is required if the desired income multiplier effect is to be achieved.
• Sabah
There are three large marine parks in Sabah, as well as a number of rain forest and other marine conservation areas. Tunku Abdul Rahman Park (TARP), which lies off Kota Kinabalu, was established in 1974 for protecting marine life from human exploitation, its coral reefs in particular. In 1979, TARP was expanded to include small low-lying islands that form Malaysia’s portion of Turtle Islands Park, as these are well known as nesting sites for green and hawksbill turtles.
The fringing reefs around Pulau Tiga Park are considered to be among the most beautiful in Sabah. This island is famed for its wild animals such as the megapod (Megapodius freycinet), the harlequin tree frog (Rhacophorus pardalis), the monitor lizard (Varanus salvator), the common skink, and the yellow-lipped sea krait (Laticauda colubrina) (Spait 2001).
Located at the heart of the Indo-Pacific basin, Sipadan is Malaysia’s only oceanic island. Rising 600 meters from the seabed, the island was formed by living corals growing on top of an extinct volcanic cone over thousands of years. More than 3,000 species of fish and hundreds of coral species have been recorded in this ecosystem. Green and hawksbill turtles are frequently seen in the waters around Sipadan, as they mate and nest there. Large schools of barracuda, big-eye trevally, and bumphead parrotfish, as well as pelagic species such as manta rays, eagle rays, scalloped hammerhead sharks, and whale sharks also frequent the island. A turtle tomb lies underneath the island’s column. Formed by an underwater limestone cave with a labyrinth of tunnels and chambers, this turtle tomb contains many skeletal remains of turtles that became lost and drowned before finding the surface. Sipadan was declared a marine park in 2004.
The number of domestic and international visitors to these three marine parks in Sabah has increased steadily, reaching 358,741 in 2009. Due to its proximity to Kota Kinabalu, TARP is the most frequented marine park in Sabah, as it accounts for more than 90% of total visitors to the state’s marine parks. However, due to deterioration of this resource as a result of human activity (e.g., fish bombing and pollution), the number of visitors to TARP has declined by
Same Energy, More Power68 State of the Coral Triangle: Malaysia68
1%–2% annually in recent years. Excluding TARP, Sipadan Island is the major attraction for international visitors, as it accounts for 17%–18% of total international visits. Similarly, the number of domestic and international visits to Sabah’s other marine parks is undergoing a gradual but minimal decrease.
Due to economic and human wants, the quality of the marine resource on these islands has deteriorated. A general survey carried out by the Marine Research Unit of Sabah Parks in 1998 showed that more than 50% of the coral reefs in TARP are in Index 2 of the Reef Health Index, and only about 16% of the coral reefs located at the monitoring stations are in Index 3 and 4 (Table 31) (Spait 2001). For Turtle Islands Park, a “manta tow” survey performed in 1998 showed that the average live coral cover for three islands was about 27%, with the remainder composed of either dead coral or sand and rubble (Spait 2001). This finding reflects the rate of decline in visitors to TARP.
Data regarding total receipts and total visitors to marine parks are not publicly available. However, it is reasonable to assume that the structure of fees imposed on visitors to the various parks reflects the financial value of the experience provided by the natural resources of these islands. These fees are based on the type of activity purchased by visitors, such as scuba diving, or use of conference rooms, campsites, cameras, or accommodation provided by the state government.
Issues in Marine Tourism
Given the widespread socioeconomic benefits of tourism, state governments have promoted the industry heavily with funding and technical support from the federal government. As a result, new resorts have sprung up and old resorts have been upgraded. While this has benefited many rural areas, it has also caused problems.
There are two distinct aspects to the challenges faced by coastal tourism in Malaysia: (i) maintaining the integrity of the resource to ensure its sustainability, and (ii) resolving resource-use conflicts. With regard to particular coastal areas, there is significant debate as to whether tourism is the appropriate type of development as opposed to other types of coastal economic activity.
Unsustainable use of resources. The haphazard small-scale resort development that dots many of Malaysia’s islands and rural areas has caused numerous problems, particularly with regard to solid waste management, sewage disposal, and availability of drinking water. All of these problems share a common source, which is lack of adequate support infrastructure. Other negative impacts include aesthetic pollution in the area (e.g., the Pasir Panjang area in Pulau Redang Marine Park), conflicting uses of the immediate coastal waters, and danger to users, particularly when powerboats, unpowered boats, and swimmers form a dangerous mix.
Unplanned or uncoordinated development has also deteriorated and eventually destroyed the natural resources that are the very source of the tourist industry’s economic wealth such as coral reefs, mangrove areas, and natural habitats. This negatively impacts the livelihood of low-income groups. Further, increased tourism-related traffic in ecosystems that support marine fisheries, such as coral reefs and mangrove belts, negatively impacts the sustainability of fish catch, both in overall volume and species composition (Prime Minister’s Department
Causes of Underinvestment and Persistent Energy Inefficiency 69 Socioeconomic Characteristics 69
2004). Similarly, indiscriminate removal of young fish, rocks, and coral, which are then sold as souvenirs to transient tourism traffic adversely impacts fishing habitats.
Irresponsible behavior of users. Beachfront-based tourism can also lead to serious solid waste problems, litter in particular. Residents of local communities often cite tourism as a source of beach litter, perhaps because it is a highly visible form of pollution. Litter includes materials deposited directly into the sea from boats or shore-based facilities such as fishing platforms and seafood restaurants, or material left on beaches by visitors. Litter decreases the amenity value of recreational areas, poses safety risks to beach users and boaters, and negatively impacts the ecosystem. Discarded plastic can clog boat propellers, water intake pipes, and drainage outlets. Further, turtles often mistake plastic for sponges, and as a result, consume it as if it were food. It is thus a major source of mortality among these endangered animals. Similarly, the decaying contents of discarded food containers generate unpleasant odors and spreads bacteria on beaches.
Resource-use conflicts. The same resources that form the foundation of coastal tourism are also used in fishing, mining, and agriculture. As a result, resource-use conflicts are relatively common. Such conflicts underscore the necessity of taking harmonious use of these resources into account when formulating and implementing policies, development plans, and laws.
Federal Government Initiatives
Economic Transformation Program. Malaysia’s Economic Transformation Program addresses both leisure and business tourism. As a result, it addresses development of accommodation, shopping, tourist-related products, and food and beverage, as well as inbound and domestic transport (Prime Minister’s Department 2010). Educational and medical tourism are not addressed by the Economic Transformation Program.
The results of research performed as part of preparing for the Economic Transformation Program report show that growth in tourist arrivals has a far more powerful impact on tourist-related revenue than does yield (i.e., receipts per tourist). The program proposes 12 entry-point projects, one of which is establishing Malaysia as a global biodiversity hub.
Such a biodiversity hub is an accreditation body that is overseen by a board of management, drawn from key stakeholder groups. It aims to establish standards of excellence relating to the management and presentation of key ecotourism sites. The key functions of the board will be to accredit and monitor each site to ensure the sustainability of ecotourism development and activities, and assist with the promotion and marketing of accredited sites (Prime Minister’s Department 2010).The Global Biodiversity Hub comprises a network of natural areas that showcase the biodiversity of Malaysia’s rain forests, freshwater habitats, and marine environments, as well as their associated flora and fauna. Total funding required for the hub is estimated at RM896 million over 10 years (2010–2020), which will be used to construct a new Rainforest Discovery Centre, and to upgrade identified sites. The total GNI impact of this project is estimated at RM1.5 billion, and its employment impact, 2,900 jobs.
Another segment of the tourism industry is the “family-fun” category. Two types of projects would cater to families in this regard: integrated resorts and cruise tourism.
Malaysia plans to develop an eco-nature integrated resort in Sabah as a showcase of green development. This resort will feature energy-efficient buildings, renewable energy products,
Same Energy, More Power70 State of the Coral Triangle: Malaysia70
recycling, use of electric transport, and a mangrove education center that will highlight Sabah’s biodiversity. Overall, the GNI impact of this initiative is expected to be RM707 million, with 7,700 jobs being created by 2020.
Based on the 12 proposed entry-point projects for the tourism industry, the total GNI gain by 2020 is expected to be RM66.7 billion, with 497,000 additional jobs being created.
Sabah Government Initiatives
Sabah is positioning itself as a premier eco-adventure destination that will particularly feature coastal and marine tourist-related activities. The goal of Sabah’s tourism strategy is spreading the benefits of tourism to the people of Sabah. To ensure that Sabah’s tourism development is distributed geographically in an appropriate way, the strategy divides the state into three distinct zones. Kota Kinabalu will remain the state’s primary gateway, and will function as a central hub from which travel will emanate to the state’s eastern and western subregions. This is consistent with existing air travel routes that function as spokes of a wheel in that they emanate from Kota Kinabalu to Lahad Datu, Sandakan, and Tawau. All of these three destinations are secondary hubs that serve the scattered tourism sites in eastern Sabah, which are home to most of the state’s natural marine treasures. Coastal development along the northern and southern circuits of the western subregion will include integrated beach resorts, a marina, and cruise terminal. Sabah plans to attract renowned signature resorts to these areas.
Gender Issues
Since independence in 1957, Malaysian women and girls have enjoyed equal access to social services along with men and boys. Beginning with the Fifth Malaysian Plan (1986–1990), the role of women in development has increasingly been highlighted in national development plans. Similarly, gender-sensitive policies and programs that have accompanied sustained economic growth have helped to promote both gender equality and the empowerment of women (UNDP 2005).
Four key indicators are used to monitor Malaysia’s progress in achieving the Millennium Development Goal of promoting gender equality and empowering women:
(i) the ratio of female to male students in primary, secondary, and tertiary education;(ii) the ratio of literate women to that of men aged 15–24 years;(iii) the share of women in nonagricultural wage employment; and(iv) the proportion of seats held by women in the national parliament.
Since the early 1990s, the enrollment rates of females have equaled or exceeded those of males at all educational levels. At the tertiary level, the enrollment rates of females have shown an increasing trend, which in part reflect the fact that more females seek tertiary education than do males. This in turn reflects the fact that females perform better than males in public examinations. However, gender gaps still prevail with regard to course selection.
Causes of Underinvestment and Persistent Energy Inefficiency 71 Socioeconomic Characteristics 71
In 1975–2002, the labor force participation rate for females aged15–64 remained at approximately 47%. In contrast, over the same period, the labor force participation rate for males consistently exceeded 80%. Age-specific female labor force participation rates in Malaysia generally show a sharp decline after ages 20–24 (Department of Statistics 2000). This contrasts sharply with the age-specific female labor force participation rates in many industrialized countries where women either fail to depart the labor force during childbearing, or reenter the labor force once they exceed childbearing age.
Since independence, the number of females elected to political decision-making bodies in Malaysia has increased, albeit at a moderate rate, as in 1990, women comprised only 5% of all parliamentarians. While the proportion of women elected to state assemblies nearly doubled between 1990 and 2004, their representation remains low at 6%. In contrast, in the Senate where members are appointed to represent various societal groups, the proportion of female senators increased from 18% to 33% over the same period.
Several constraints inhibit female participation in mainstream economic activities. These include women’s overlapping responsibilities at home and at work, the choice of courses at school, and inadequate access to credit and market information. Some policies and programs are being implemented to address these constraints such as improving education and training for women, removing discriminatory legislation, and improving the legal status of women.
Payment for Ecosystem Services Schemes
Ecosystems provide society with a wide array of valuable services that range from clean water to productive soil and carbon sequestration. These services are often taken for granted, and are thus undervalued, or in some cases, assigned no economic value whatsoever.
Payment for ecosystem services (PES) schemes allow buyers (e.g., of clean water) to pay sellers (landowners, or other resource managers) for maintaining the service in question (e.g., by not disturbing or polluting the watershed). Overall, PES schemes are formulated in four steps: (i) identification of ecosystem service markets, (ii) assessment of institutional and technical capacity, (iii) structuring agreements, and (iv) implementation of these agreements.
Malaysia is currently at the first step in formulating its own PES schemes. The Economic Planning Unit under the Prime Minister’s Office together with the United Nations Development Programme (UNDP)–Malaysia is currently spearheading this effort. The research group responsible for this project is Universiti Putra Malaysia.
72
Threats and Vulnerabilities
Current Issues in Marine Resource Management
Degradation of Fisheries and Food Security
Malaysia’s fishing industry employs more than 129,000 fishers and fish farmers (Department of Fisheries 2010). This reflects the fact that Malaysia consumes more fish protein than any other Southeast Asian country (Ecosystem-Based Management of Fisheries [EBMF] 2011).
Demersal fish biomass, densities, and catch rates have all dropped by up to, and beyond, 90% since 1971. In 2003, a consensus was reached at the National Conference on Management of Coastal Fisheries in Malaysia that “the abundance of coastal fisheries resources has declined substantially and that the coastal fishing sector suffers from excess fishing capacity.”
In response, the Government of Malaysia and nongovernment organizations (NGOs) have begun working together to ensure sustainability of this vital protein source by implementing ecosystem-based management of fisheries (EBMF).9 As the overall objective of the EBMF is sustainable exploitation of fisheries, this approach to managing fisheries must consider all aspects of fisheries, including the habitats that support these fisheries themselves. As a result, the EBMF includes two major complementary themes: (i) the impact of the overall environment on the fisheries resource, and (ii) the impact of exploitation of fisheries on the overall environment.
In fact, as early as 2006, Malaysia had already embraced EBMF principles as these are embedded in the Sulu–Sulawesi Marine Ecoregion (SSME) initiative that Malaysia ratified together with Indonesia and the Philippines. However, being a trilateral initiative, in the case of the SSME, EBMF principles were applied without putting into place appropriate institutional and legal provisions for ensuring their full implementation. As a result, this attempt at addressing the decline in fisheries output and the overall ecological integrity of the marine environment was relatively ineffective.
As addressing the current fisheries crisis in Malaysia is completely under the country’s own control, in this case it will be possible to systematically expand the coverage of EBMF principles to include appropriate institutional and legal provisions for ensuring their full implementation. As a result, the Ministry of Agriculture and Agro-based Industries and its technical arm, which
9 In a number of countries outside Malaysia, the EBMF is referred to as the “ecosystem approach to fisheries management” or EAFM.
Causes of Underinvestment and Persistent Energy Inefficiency 73 Threats and Vulnerabilities 73
is the Department of Fisheries Malaysia, are well positioned to implement EBMF principles. However, due to the all-encompassing nature of EBMF, this can only be undertaken together with a wide range of implementation partners drawn from government, civil society, and the fishing industry. The first step in this process is to form a steering committee or national council for guiding EBMF implementation.
Implementation of Ecosystem-Based Management of Fisheries
Resource, data, and information constraints. The amount of essential data such as that relating to the size of the fisheries stock, fish landings, and rate of fishing effort that is available to managers of Malaysia’s fisheries is limited. Unfortunately, it is precisely these data that are used in implementing EBFM principles. Further, the financial allocation afforded the Department of Fisheries for Peninsular Malaysia for implementing marine resource conservation and rehabilitation programs within its jurisdictional areas is limited under the 10th Malaysia Plan. As a result, cooperation with, and assistance from research institutions and NGOs will be required to fully implement EBFM principles in Malaysia. Similarly, high-quality scientific and economic research will be required if decisions regarding EBFM implementation at the operational level are to be efficient.
Degradation of Marine Water Quality
Marine ecologists are well aware that degradation of coral reef ecosystems is inextricably linked with degradation of marine water quality. This is equally true of marine habitats that are closely related to coral reef ecosystems such as mangroves and seagrass beds, and coastal and nearshore ecosystems in general. As with other countries in the Coral Triangle, in Malaysia’s case, degradation of marine water quality is often associated with unsustainable land development on islands adjacent to marine parks. Problems associated with such unsustainable land development patterns typically include discharge of insufficiently treated industrial effluent and domestic waste, environmental disturbance caused by coastal land reclamation projects, illegal dumping of sludge by vessels, and accidental oil spills (Government of Malaysia 2010a). The issues faced by Malaysia that relate to degradation of marine water quality are discussed in detail below.
Jurisdictional Issues Relating to Management of Mangrove Forests and Seagrass Beds
In addition to the wide range of other ecological services they provide, mangroves and seagrass beds serve as nursery areas for commercially important fish and prawn species, and generally support inshore fish production (MacNae 1974). However, from a jurisdictional point of view, Malaysia classifies mangroves as a forestry resource. As a result, they are under the direct jurisdiction of state governments. Similarly, state governments have jurisdiction over seagrass beds that lie within 3 nautical miles of the low-water line.
Coral-reef-based parks have immediate—indeed, photogenic—appeal as tourist destinations. As a result, government planners have few problems providing justification for setting them aside as nature reserves. However, mangroves and seagrass beds lack this immediate appeal. Setting aside mangroves and seagrass beds is thus difficult for government planners, as they
Same Energy, More Power74 State of the Coral Triangle: Malaysia74
must often provide economic justification for setting such areas aside as nature reserves. As a result, no mangrove or seagrass reserves have been declared exclusively for conserving the marine environment, or for ensuring sustainable exploitation of Malaysia’s fisheries.
Threatened and Endangered Species
Marine Turtles
People have used marine turtles and products derived from them for thousands of years, for food and non-food purposes. The human non-food uses of turtles today vary widely, and include tourism, education and research, and employment. That said, marine turtle populations in Southeast Asia have been seriously depleted through harvesting of eggs and mature turtles over the long term, and as bycatch in trawl fisheries. More recently, direct poaching has become a major threat to the survival of marine turtles. The Red List Global Status published by the International Union for the Conservation of Nature (IUCN) lists hawksbill and leatherback turtles as being “critically endangered,”10 green turtles and loggerheads as being “endangered,”11 and olive ridley as being “vulnerable.”12
A common issue in marine turtle conservation that has frequently arisen over several years is inadequate coordination of efforts undertaken by entities and agencies that address marine turtle conservation. Perhaps a more pressing issue is absence of a national policy or strategic plan relating to marine turtle conservation (Chan 2006).
Several major issues relating to conservation of marine turtles in Malaysia are discussed in the paragraphs below.
Trawl fisheries. Marine turtles constitute a considerable portion of the bycatch of trawl fishing in the Coral Triangle. In fact, the number of trawling fleets operating in Southeast Asia has expanded considerably over the past 3 decades. However, in Terengganu, turtle drowning in trawl nets fell from more than 700 per year during the 1980s (Chan et al. 1988) to about 50 per year more recently (Chan and Liew 2001). In addition to inshore territorial waters, turtle mortality likewise occurs on the high seas during their long migrations between feeding and nesting grounds.
Direct poaching. The major markets for marine turtles and products derived from them are the People’s Republic of China (PRC) and Viet Nam. Most vessels that engage in direct poaching are based in these countries, with the majority of poached-turtle catches being landed in Hainan, PRC, where they are processed and then transported to the northern part of the PRC. Anecdotal reports suggest that most of the Vietnamese catch is traded with Hainan-based vessels for other commodities on the high seas. Indonesia, Malaysia, and the Philippines each apprehend at least 2–3 such vessels each year, and confiscate thousands of stuffed turtles and other body parts. Unfortunately, the high profit margins turtle poachers enjoy has caused this trade to grow (Pilcher et al. 2008).
10 Defined as extremely high risk of extinction in the wild.11 Defined as high risk of extinction in the wild.12 Defined as high risk of endangerment in the wild.
Causes of Underinvestment and Persistent Energy Inefficiency 75 Threats and Vulnerabilities 75
Habitat destruction and pollution. Except for areas in which turtle sanctuaries have been established, loss of nesting habitats occurs where pristine beaches have been developed for tourism purposes. The Turtle Islands Heritage Protected Areas (TIHPAs) are the world’s first and only transboundary protected area for marine turtles. Jointly established by the governments of Malaysia and the Philippines, the TIHPA is likewise jointly managed by these two countries. However, the migratory pathways of the marine turtles that visit TIHPA include large oceanic areas that lie outside the jurisdictional boundaries of these two countries. Extending the TIHPA to the Berau Islands Conservation Area in Indonesia would strengthen key nesting aggregations in Southeast Asia. At present, TIHPA in Sabah only includes Turtle Islands Park. However, there are plans to extend the initiative to Tun Sakaran Marine Park and Pulau Sipadan Park (Pilcher et al. 2008).
Marine pollution degrades turtle feeding grounds. Although there is evidence of pollution and marine debris in the South China Sea, no studies have been conducted locally to determine the exact interaction between marine pollution and degradation of turtle feeding grounds (Chan 2006). However, debris floating on the ocean’s surface is one cause of turtle mortality, as turtles sometimes mistake plastic bags for sponges, and thus accidentally ingest them. Similarly, turtles have been killed by entanglement in monofilament fishing line and discarded fishing nets (National Research Council 1990).
Migration. Marine turtles migrate great distances. As a result, turtles are a coastal resource shared by several countries. A major issue in marine turtle management is thus formulation of appropriate transboundary institutional and legal arrangements for the joint protection of this precious resource. Thus, national laws and international conventions are necessary in this regard. Examples of the latter currently in force include the Convention on Migratory Species, which was brought into force by the signing of the Memorandum of Understanding on Conservation and Management of Marine Turtles and their Habitats in the Indian Ocean and Southeast Asia (IOSEA Marine Turtle Memorandum of Understanding). Malaysia signed this memorandum of understanding in September 2011.
Protracted harvesting of turtles and eggs. Protracted harvesting of adult turtles and eggs has caused valuable breeding populations to collapse. For example, the eggs of the leatherback turtle have been systematically harvested for hundreds of years in Terengganu. As a result, the nesting population has declined from 5,000 nests per year to an average of only 10 per year. Fortunately, leatherback turtle eggs are now completely protected under national law. However, given the extent of damage already done, and the long lifecycle of leatherback turtles, it is doubtful that the population will recover (Workshop on Regional Cooperation to Address Direct Capture of Sea Turtles, 2009). One of the reasons for uncontrolled harvesting of marine turtle eggs despite the ban is villagers’ lack of understanding of turtle nesting cycles.
Status in Peninsular Malaysia. Nesting data for Terengganu are available for all four major species for the last 24 years. The trends relating to nesting sites that have been observed in recent years are summarized below (Workshop on Regional Cooperation to Address Direct Capture of Sea Turtles, 2009).
(i) Occurrences of leatherback turtle nesting have declined by 99.9% over the last 24 years. The current annual nesting density is about four nests per year.
Same Energy, More Power76 State of the Coral Triangle: Malaysia76
(ii) Nesting of olive ridley turtles has suffered a total collapse, in that no nesting has been recorded since 2005.
(iii) Nesting of green turtles has steadily declined. The current annual nesting density is 2,300, which is a value equal to 75% of that which occurred 20 years previously.
(iv) Hawksbill turtle nestings have declined from 50 per year in the 1980s to 14 per year, which is equivalent to a 70% decline.
Status of marine turtles in Sabah. Of the four marine turtle species found in Malaysia, only the leatherback turtle fails to nest in Sabah. In contrast, the green turtle is Sabah’s most abundant species. However, the olive ridley turtle is infrequently found nesting in Sabah. Turtle nesting in Sabah occurs primarily in the archipelago of Selingan Island, Bakungan Kecil Island, and Gulisan Island (Turtle Islands Park), and on Sipadan Island. Although green and hawksbill turtles have been recorded at Layang-Layang Island, neither specie has been known to have landed or nested there (Government of Malaysia 2010a).
From 1984 to 2006, increasing numbers of green turtles have visited Turtle Islands Park. However, the number of turtle sightings has leveled off over the past 10 years. When the number of annual nesting events is averaged over each 5-year span that comprises this period, the nesting rate declined by 38% from the 1990s to 2000s. Sightings of hawksbills turtles in Turtle Islands Park declined by 25% between the periods 1989–1993 and 2004–2008 (Workshop on Regional Cooperation to Address Direct Capture of Sea Turtles 2009).
In an effort to reduce the bycatch of turtles in Sabah trawl fisheries, the Sabah Fisheries Department and the Marine Research Foundation have jointly introduced turtle-excluding devices into the Sandakan trawl fishery. As this program is sponsored by a Global Environment Facility small grant program, it could potentially expand to include other trawl fishing ports.
Status of marine turtles in Sarawak. All four of the species of marine turtles that visit Sarawak are listed as totally protected animals and endangered species. The major turtle nesting sites in Sarawak include Turtle Islands Park (composed of Talang-Talang Besar, Talang-Talang Kecil, and Satang Besar islands), Telok Melano, Sematan, Samunsam Wildlife Sanctuary, Tanjung Dato National Park, and Similajau National Park.
Nestings of green turtles in the Turtle Islands have declined by 84% over the past 50 years, with the number of annual nesting events falling from 13,062 nests during the 1950s to 2,152 in recent years. However, the rate of decline over the past 30 years has been approximately 25% (Workshop on Regional Cooperation to Address Direct Capture of Sea Turtles, 2009). As a result of improper use of fishing gear, 70–100 adult turtles were stranded on Sarawak beaches annually before 1998.
Several initiatives including the Sarawak Reef Balls Project and the Marine Turtle Adoption Programme have addressed turtle strandings in Sarawak. From 1998 to 2006, 2,584 reef balls were deployed along the Sarawak coast; more specifically, around Talang-Satang National Parks, and near Bintulu, Lawas, and Kuching. This markedly reduced turtle mortality due to stranding to about 20 turtles annually. Further, the number of turtles nesting at Talang-Satang National Parks rose from 737 in 2004 to 1,104 in 2009. The number of turtles tagged at the park for purposes of monitoring also increased from 639 in 2004 to 1,028 in 2009 (The Star, 22 October 2009).
Causes of Underinvestment and Persistent Energy Inefficiency 77 Threats and Vulnerabilities 77
Status of marine turtles in Peninsular Malaysia. In Peninsular Malaysia, green turtles are known to nest mostly in the state of Perak (Pantai Remis). However, they can also be found in Kedah, Melaka, and Penang. The main nesting area of hawksbill turtles is Melaka, while that of the olive ridley turtle is fragmented and confined to Penang Island (Government of Malaysia 2010a). The hawksbill nesting population in Melaka appears to have stabilized at around 200 nests per year (Chan 2006).
Marine Mammals
Several marine mammal species have been identified as residents of Malaysian waters, or else as occasional transients. These include: dugongs, a sirenian; and 17 species of cetaceans belonging to the families Balaenopteridae (baleen whales), Delphinidae (dolphins), Phocaenidae (porpoises), Kogiidae (dwarf and pygmy sperm whales), and Physeteridae (sperm whales) (Government of Malaysia 2010a). While most of these marine species are listed as “data deficient” or “least concerned,” two species are listed as being “vulnerable to extinction” on IUCN’s Red List of Threatened Species (Marsh 2008).These include the Irrawaddy dolphin and the dugong.
Many of these species—the dugong in particular—have been hunted to the point of endangerment, as they were long considered a delicacy by coastal inhabitants (Jakobsen et al. 2007). Dugongs are thus still highly sought after, particularly by the Bajau Laut community. Dolphins are also hunted for food, but only by the Bajau Pelauh community in Semporna (Government of Malaysia 2010a). While the hunting and trading of cetaceans by these indigenous maritime communities appears to be seasonal, it continues in remote areas of Sabah such as Kudat, Lahad Datu, Sandakan, and Semporna (Jaaman and Lah-Anyi 2002).
Use of gillnets and kelongs (or offshore platforms) is the major cause of incidental catch of dugongs and inshore cetaceans, the Irrawaddy dolphin and finless porpoise in particular (Jaaman and Lah-Anyi 2003). This has caused the numbers of these species to dwindle over the past few decades (Ponnampalam et al. 2010). Overall, the incidental catch is greatest in gillnets. Jaaman et al. (2009) reports that 306 cetaceans and 479 dugongs were estimated to be incidentally caught annually by fishing fleets in Sabah.
Several actions have been taken to prevent the catch of marine mammals. These particularly include enforcement of two acts to manage fisheries and protect marine mammals from direct or indirect catches. These are the Wildlife Protection Act 1972 and the Fisheries Act 1985. Other actions include establishing MPAs and promoting marine mammals as an ecotourism attraction.
Sea Cucumbers
The sea cucumber fisheries in Peninsular Malaysia and Sabah are artisanal in nature. In Peninsular Malaysia, sea cucumber fishing occurs on a very small scale and is limited to a few localities. These include Telok Nipah on Pangkor Island on the west coast of Peninsular Malaysia where sea cucumbers are harvested for use in traditional medicinal products (Choo 2008). Harvesting of S. horrens on Pangkor Island is performed by handpicking during low spring tides, and takes place about 20 days each month.
Before the mid-1990s, more than 90% of the sea cucumber harvest in Sabah was bycatch of trawlers. However, in more recent years, handpicking (or diving without scuba gear) accounted
Same Energy, More Power78 State of the Coral Triangle: Malaysia78
for 70%–80% of the sea cucumber harvest, the remainder being caught by trawlers. The fact that sea cucumbers have disappeared from trawler landings at some ports suggests that the populations of the species in adjacent areas have become depleted (Choo 2008). In all probability, the magnitude of sea cucumber landings recorded in Sabah’s Annual Fisheries Statistics are underestimates, as handpickers are not required to report their catches to a central authority. As a result, the sea cucumber landings that are reported in all likelihood predominantly represent the bycatch of trawlers (Choo 2008).
Statistics reported by the Food and Agriculture Organization of the United Nations as well as Sabah’s Department of Fisheries show a nearly tenfold decline in sea cucumber landings between the 1990s and 2000s. More specifically, from an average of 1,000 tons (wet weight) in the 1990s, sea cucumber landings have declined to about 100 tons (wet weight) in the 2000s. A survey performed in Sabah over the period 1996–1998 (Forbes and Ilias 1999) showed that many high-value sea cucumber species, such as H. scabra had become rare, and that this has resulted in increased pressure on the stocks of mid- to low-value, including species such as T. anax, T. ananas, and Stichopus spp. Anecdotal information obtained locally likewise suggests that both the population and average size of individuals of T. anax have decreased. Studies performed in marine parks along the east coast of Peninsular Malaysia where illegal fishing is uncommon show healthy populations of sea cucumbers (Comley et al. 2004).
Other threats facing Malaysia’s sea cucumber populations include habitat loss, lack of information and statistics regarding their numbers, confusion regarding commodity codes (Choo 2004), and threats to their coral reef habitats from climate change (Choo 2008). The major threats facing Sabah’s sea cucumber population include pollution, unsustainable or environmentally irresponsible land clearing, overfishing, and degradation of natural habitats (Biusing 1997).
Humphead Wrasse
The live reef fish trade in Asia and the Pacific is a lucrative business that has threatened marine species through overexploitation and habitat destruction (Government of Malaysia 2010c). One of the live reef fish species that is overexploited is the humphead wrasse (Cheilinus undulates). At the 13th Conference of the Parties to the Convention on International Trade in Endangered Species in October 2004, the humphead wrasse was listed in Appendix II of the convention. As a result, international trade in this species is regulated under a permit system that requires exporting and re-exporting countries to authorize trade.
An extensive series of underwater visual censuses at more than 30 sites around Sabah (performed by the major supplier and source of this species in Malaysia) found that due to extensive and uncontrolled fishing, only two sites had more than one humphead wrasse per kilometer; further, most of those that were observed were small in size. One exception was Layang-Layang Island, where an estimated 350 humpheads were recorded. In the late 1990s, an estimated 70 humpheads were recorded in western Sabah and Sipadan Island. These locations are protected by the Royal Malaysian Navy and by dive resorts. On Peninsular Malaysia’s east coast, divers report that humpheads have vanished from reefs altogether, particularly on islands such as Redang, Tenggol, and Tioman.
Causes of Underinvestment and Persistent Energy Inefficiency 79 Threats and Vulnerabilities 79
Marine Water Pollution
The major sources of pollution of Malaysia’s coastal and marine waters include economic activity in the agriculture, manufacturing, maritime transport and shipping, and oil and gas extraction sectors, as well as pollution resulting from urbanization (discharge of organic waste, garbage, and sewage). The manufacturing sector is the major contributor to pollution relating to metals (e.g., from electroplating, etching, and manufacture of metallic components) (Rahman and Surif 1993). In fact, in 1992, the semiconductor and electronics industry alone released 69,000 cubic meters of sludge containing heavy metals (Hamid and Sidhu 1993). However, copper released from pig farms is known to contaminate coastal sediments and marine fauna (mollusks) (Ismail and Rosniza 1997). In addition to activities relating to tin, port and shipping activities are responsible for the release of arsenic, copper, and lead into the Straits of Malacca (Abdullah et al. 1999).
Available data regarding the heavy-metal content of marine sediment show that the concentration of lead in Peninsular Malaysia is greater than that which naturally occurs in places such as Kemaman, Penang, and Tanjung Karang (Wood et al. 1993). Further, corresponding levels of zinc and lead were higher in the Johor Straits than in the former areas by 2–3 times respectively. This outcome is attributed to vehicular traffic between Malaysia and Singapore, and in particular, discharge of pollutants through consumption of gasoline and tire wear (Wood et al. 1997).
Water quality data obtained from 233 monitoring stations in both Peninsular Malaysia and East Malaysia (2000–2007) show that some monitoring stations reported contaminant levels exceeding those specified by the Interim Marine Water Quality Standards (IMWQS). In such cases, the values for total suspended solids exceeded IMWQS by 56.9%, Escherichia coli by 44.1%, and oil and grease by 43.6%. In 2007, the major marine water contaminant that exceeded IMWQS was E. coli. In this regard, the coastal waters off Johor, Kedah, Penang, and Terengganu showed the highest bacteria pollution levels, while the coastal waters off Kedah, Labuan, and Penang showed the highest levels of total suspended solids (Government of Malaysia 2010a).
Encouragingly, in November 2010, the Department of Environment replaced the IMWQS with the new Malaysian Marine Water Quality Criteria and Standard. The new criteria and standard groups coastal waters into four classes based on the uses to which these waters are put, and the type of ecosystem in which they are present. The four relevant classes are: (i) marine protected areas and marine parks; (ii) marine life, fisheries, coral reefs, recreational venues, and aquaculture; (iii) ports, oil, and gas fields; and (iv) mangroves, estuarine, and river-mouth water. No data have yet been published that reflect the new criteria.
Although the jurisdiction enjoyed by the states extends 3 nautical miles seaward from the low-water line, spatial zonation planning does not extend into the marine area, and marine water quality objectives are not taken into account during development planning. As a result, no link exists between land-based activities and their impacts on the water quality in adjacent aquatic environments. Although the Department of Environment publishes marine water quality data annually, no administrative or legislative sanctions are levied if the criteria currently in force have been exceeded (Government of Malaysia 2010b).
Same Energy, More Power80 State of the Coral Triangle: Malaysia80
Current Developments in Marine Resource Management
Rehabilitation and Restoration of Threatened Habitats
Mangrove Restoration
The total area under mangroves in Malaysia fell from 800,000 hectares (ha) in the early 1950s to about 695,000 ha in 1973, and then further to about 575,180 ha in 2004. This represents a 25% loss in Malaysia’s mangrove forests over a 50-year period (Tan 2005). Many mangrove reserves gazetted during the colonial period have since been degazetted to allow them to be used for other purposes. Of Malaysia’s total remaining mangrove areas, 85% have been gazetted as forest reserves, wildlife sanctuaries, Ramsar sites, and state and national parks (Tan and Jurgenne 2006). Unprotected mangroves located on state lands cover an estimated 100,000 ha.
Peninsular Malaysia. The tsunami of 2004 prompted the Government of Malaysia to step up conservation and protection efforts in the country’s coastal areas. A Special Task Force Committee on Operational Tree Planting Programme with Mangrove and Other Suitable Tree Species along The National Coastlines was formed under the Ministry of Natural Resources and Environment (MNRE) on 7 February 2005. Two technical committees were formed under the Special Task Force Committee to coordinate replanting efforts: the Technical Committee on Planning and Implementation, and the Technical Committee on Research and Development. As a result of this initiative, nearly 6 million mangroves were planted over the period 2005–2010.
Sabah. The Sabah Forestry Department has conserved most, if not all, of the state’s mangrove forests. Exploitation of mangrove forests in Sabah is thus occurring at a minimal rate. Further, the exploitation that is occurring mainly includes collection of charcoal, firewood, and timber piling for local use (Sabah Forestry Department 2010). A mangrove restoration program in place since 2006 has planted 636,000 mangrove saplings. In 2006–2010, these saplings were planted within a total area of 584 ha that is spread across eight planting sites near coastal beaches or within forest reserves. In 2009, Sabah was allocated RM1 million for mangrove replanting under the Sabah Development Corridor project. The areas targeted under this initiative include Beaufort, Semporna, and Tawau.
Restoration of Coral Reefs
Malaysia’s coral reef restoration efforts have generally focused on transplanting corals and substrate modification. One project implemented in Peninsular Malaysia transplanted about 100 branching coral colonies to an area located 30 meters (m) from the original site that measured 20 m x 10 m. Wire mesh was placed at the bottom of the area receiving the plantings to ensure that the colonies transplanted remained upright during the 6-month monitoring period that followed. Approximately 70% of the corals transplanted survived the transfer (Chou et al. 2009). Malaysia’s marine parks authority used this technique to restore small shallow reefs of less than 6 m depth that had been damaged by boat grounding or anchors being dropped on them (Chou et al. 2009). Further refinement of this technique by raising transplanted corals to within half a meter of the bottom is thought to increase the survival rate of the transplanted corals.
Causes of Underinvestment and Persistent Energy Inefficiency 81 Threats and Vulnerabilities 81
Stabilizing the bottom substrate or providing an artificial substrate may be necessary if the bottom of a coral reef is damaged, becomes unstable due to the presence of loose rubble, or becomes silted over, which would prevent larval recruitment and survival. This approach is similar to that taken in forming an artificial reef, except that it is used only when the substrate has been damaged. Various structural configurations have been used to construct artificial substrate in Malaysia. These range from simple cover slabs to high-profile complex structures (Chou et al. 2009). Materials used for this purpose range from polyvinyl chloride (PVC) tubing to concrete and fiberglass. In 1995, five PVC units were installed in coral reef areas at a depth of 5 m at two sites in Terengganu: Pulau Perhentian and Pulau Redang. This study showed that coral colonization on PVC material was slow, in that it took 10 years to achieve the desired size (Chou et al. 2009).
In Malaysia, coral transplanting is viewed as a costly and rigorous procedure, but one that assures good survival rates for transplanted corals. As a result, cordoning off the area to be rehabilitated and allowing natural regeneration to occur is generally recognized as the most economic option. In this regard, Malaysia’s experience is that transplant survival rates are low in areas where water quality has deteriorated. Coral rehabilitation at such sites is thus viewed as being uneconomic. Ultimately, further research is necessary to identify the most efficient coral restoration strategies. Monitoring of the success of existing coral reef restoration projects over the long term would be particularly valuable in this regard. Finally, commitment to coral reef restoration by residents of adjacent communities is of paramount importance to successful coral reef restoration initiatives. Achieving such commitment has the added benefit of raising awareness among community residents as to the long-term benefits of maintaining coral reef ecosystems (Chou et al. 2009).
Emerging Issues in Marine Resource Management
Aquaculture
While the income and employment-generating effects of the rapid expansion of marine aquaculture that has taken place over the past 2 decades in Malaysia are welcome, this expansion has brought with it a number of negative environmental impacts: (i) waste discharge from cage culture; (ii) escapees from aquaculture farms and invasive species; (iii) genetic pollution, spread of disease, and parasite transfer; and (iv) habitat modification. As with most farming practices, the degree of environmental impact depends on the size of the farm, the species cultured, the stocking density, the type of feed used, the hydrograph of the site concerned, and the husbandry methods employed (Wu 1995).
Waste discharge from cage culture. Culture of finfish often requires use of significant amounts of fishmeal or other high-protein food (Jennings 2001). In earlier stages of aquaculture development, significant amounts of fishmeal were wasted as a result of inefficient feeding regimes and poor digestibility of formulated feeds, both of which resulted in poor feed conversion ratios. Several methods are used for feeding cage-cultured fish. These range from simple hand-feeding to sophisticated computer-controlled systems that dispense food automatically and use uptake sensors to determine consumption rates.
Same Energy, More Power82 State of the Coral Triangle: Malaysia82
The primary negative impact of overfeeding in coastal fish farms is increased deposition of detritus on the seafloor. This can potentially smother seafloor-dwelling invertebrates and alter the seafloor itself. Similarly, in hatcheries and land-based farms, wasted food can pollute adjacent catchments and coastal environments. However, such impacts are usually highly localized. The degree to which such catchments and adjacent ecosystems are impacted mainly depends on the velocity at which the waste feed settles to the bottom of the catchment concerned, as opposed to the velocity of the current in the river or steam in question as well as the latter’s depth. Both the velocity at which the waste feed settles to the bottom and the velocity of current in the river or steam in question vary over time, and differ with respect to the geographic location of the river or stream in question (Jennings 2001).
Escapees from aquaculture farms and invasive species. The degree of impact caused by escapees from aquaculture operations depends on two factors: the degree to which close relatives of the escapees exist in the wild in the receiving environment, and whether the escapees are reproductively capable (Black 2001). Escapees can adversely impact local ecosystems through several channels: (i) hybridization and loss of genetic diversity in native stocks, (ii) increasing negative interactions within an ecosystem (such as predation and competition), (iii) transmission of disease, and (iv) habitat changes (from tropic cascades and ecosystem shifts to varying sediment regimes and thus, turbidity).
Unfortunately, aquaculture is one of the major vectors for invasive species, given accidental release of farmed stocks into the wild (Naylor et al. 2001). Mollusk farming also enables species to be introduced to new environments in that it allows “hitchhiking” by invasive species on farmed mollusks. Further, farmed mollusks themselves can become dominant predators or competitors, and can potentially spread pathogens and parasites (Naylor et al. 2001).
Genetic pollution, spread of disease, and parasite transfer. One of the primary concerns with marine aquaculture is the potential for transfer of disease and parasites (Jennings 2001). Farmed stocks are often selectively bred to increase disease and parasite resistance, as well as to improve growth rates and product quality. Consequently, the genetic diversity within reared stocks decreases with each generation. Genetic pollution from escaped aquaculture stock can potentially reduce the wild population’s ability to adjust to changes in the natural environment. Further, cultured species can harbor diseases and parasites (e.g., lice), which upon their escape can be introduced into wild populations. Since wild populations have no immunity to such diseases and parasites, their introduction could have devastating impacts on the wild populations.
Habitat modification. With the exception of benthic habitats located directly beneath marine farms, most marine aquaculture causes minimal habitat destruction. However, the destruction of mangrove forests from shrimp farming is of concern (Jennings 2001).
Other threats. Nitrogen and phosphorus compounds released from food and wastes may lead to blooms of phytoplankton, the subsequent degradation of which can drastically reduce oxygen levels. If these algae are toxic, fish can be killed as a result, or shellfish contaminated (UNEP 2002).
Sustainability. Successful development of marine aquaculture depends on high-quality research in several fields including nutrition, genetics, system management, product handling, and socioeconomics. One approach to ensuring sustainability of marine aquaculture enterprises
Causes of Underinvestment and Persistent Energy Inefficiency 83 Threats and Vulnerabilities 83
is use of closed systems that do not interact with the local environment. However, both the magnitude of the initial investment required, and the operating costs of such systems currently exceed those of open-cage systems. As a result, the use of both is currently limited.
Potential benefits. Sustainable marine aquaculture holds the promise of significant economic and environmental benefits. Given sufficient economies of scale, fish ranching can produce fish at lower cost than can industrial fishing. The result of such an outcome could be both superior human diets and gradual elimination of unsustainable fisheries. However, such a scenario would depend on consistent supply and quality control.
Harmful Algal Blooms
Harmful algal blooms (HABs) in marine waters are widespread. This is unfortunate in that they are sometimes fatal to humans and often result in economic losses in both capture fisheries and fish farming. Countries that import shellfish from Malaysia—mollusks in particular—thus require certification that the level of HAB toxins present in the food material in question does not exceed stipulated values.
In Malaysia, Sabah experiences the most frequent occurrences of HABs, particularly on the state’s west coast (mainly in Binsuluk, Kuala Penyu, Sipatang, and Kota Kinabalu). HABs usually occur when heavy rain and strong winds occur after a short dry period (Wang et al. 2008). The organism that causes HABs is the dinoflagellate Pyrodinium bahamense var. compressum, which renders bivalve mollusks poisonous. Apart from mollusks, planktivorous fish, such as Sardinella (sardines, selayang/curut) and Decapterus sp. (round scad, tamban) have been reported to accumulate HAB toxins in their gut and gills. High levels of mortality in cage-cultured fish have been found to be caused by Cochlodinium polykrikoidas.
No HAB incidences have been reported in Sarawak. In fact, one survey found that Pyrodinium was completely absent in Kuching Bay and Brunei Bay (Pang and Yong 1995), and that several species of mollusks tested by the standard (mouse) bioassay tested negative for toxins.
In Peninsular Malaysia, HABs are sporadic. Since the first report of a paralytic shellfish poisoning incident in Melaka in November 1993, there has been no recurrence. In September 2001, the first incident of paralytic shellfish poisoning was reported on the east coast of Peninsular Malaysia in Tumpat, Kelantan. The organisms that caused this incident were Alexandrium minutum and another species, Alexandrium sp. yet to be identified (Lim et al. 2001). One fatality and one case in which the victim was hospitalized were reported following a meal that included the clam Polymesoda sp., locally known as lokan, which was collected from the wild.
Climate Change Impacts and Adaptation Measures
The Intergovernmental Panel for Climate Change 2007 report on the science of climate change noted small increases in temperature and rainfall throughout Southeast Asia over the past decade.
Outputs generated by the Atmosphere-Ocean General Circulation Models used in this scientific report that were analyzed by the Malaysian Meteorological Department (MMD) indicate that all models projected an increase in temperature for Malaysia. However, the degree of this increase varied with the model used.
Same Energy, More Power84 State of the Coral Triangle: Malaysia84
Observed and Projected Climate Change
The estimated temperature increase in Eastern Malaysia over 2001–2099 ranges from 1.1°C to 3.2°C for Sabah, and 1.0°C to 3.8°C for Sarawak. No clear trend regarding changes in rainfall levels are observable. Based on data reported by MMD surface observation stations, annual rainfall changes in 2000–2007 relative to 1990–1999 were as follows: an increase of 6%–10% on the western coast of Peninsular Malaysia; a decrease of 4%–6% in central Pahang and coastal Kelantan; an increase of 6%–10% in Sarawak; and an increase of more than 10% in Sabah (MMD 2009).
Data on sea-level rise collected over a 20-year period (1986–2006) from an area at the southern tip of the peninsula (Tanjung Piai in Johor) indicate an increase at a rate of 1.3 millimeters per year (United Nations Framework Convention on Climate Change [UNFCCC] 2011). MMD expects more extreme hydrological conditions to occur (UNEP 2010).
Until recently, several factors made assessment of the vulnerability of particular areas to the negative impacts of climate change a difficult task. Similarly, these same factors make it difficult to assess the efficiency of particular climate change adaptation measures for such areas. One of these factors was that climate change projections then available lacked the spatial detail necessary for them to be useful for areas of limited size, such as towns or surrounding areas. In short, until recently, climate change projections were not able to be downscaled sufficiently for them to be operationally useful (UNFCCC 2011).
A significant achievement in this regard since the Initial National Communication in 2000 was development of a dynamic downscaled (9-kilometer [km] resolution) model. Known as the Regional Hydro-Climate Model for Peninsular Malaysia, this model is able to generate climate and hydrological projections for particular areas of Peninsular Malaysia. A similar model for Sabah and Sarawak was to be completed by the end of 2010.
Another projection model called Providing Regional Climates for Impacts Studies was developed by the Hadley Centre for Climate Prediction and Research of the United Kingdom’s Meteorological Office. This model has also been used to project climate change. However, while this model can be downscaled to a 25 km resolution, current computing power limitations only allow it to be downscaled to a 50 km resolution (UNFCCC 2011). As a result, the Regional Hydro-Climate Model for Peninsular Malaysia was used to produce climatic projections up to the year 2050, while the Hadley Centre’s model referred to above was used to produce climate change scenarios up to 2099.
Projections based on these two models indicate that Malaysia’s surface temperature is projected to rise, while rainfall and river flows are projected to fluctuate to a greater degree than previously. Further details regarding these projections are available in UNFCCC (2011).
Vulnerability to Climate Change
As mangrove forests are found along low-lying coastlines, they are vulnerable to sea-level rise. This vulnerability would be exacerbated by the changes in temperature and in rainfall patterns projected for Malaysia. In all areas of the country, increased rainfall is projected to result in waterlogged soils and soil nutrient leaching that could lead to tree mortality.
Causes of Underinvestment and Persistent Energy Inefficiency 85 Threats and Vulnerabilities 85
A National Coastal Vulnerability Index study completed in 2007 assessed the vulnerability of Malaysia’s coastal areas to sea-level rise. This study was based on physical, biological, and socioeconomic parameters at two pilot areas: Tanjung Piaito Sungai Pulai in Johor, and the western coast of Langkawi Island.
To determine how much of Malaysia’s area could be inundated by sea-level rise, the results of the National Coastal Vulnerability Index study were superimposed on the worst-case projection of sea-level rise of 10 millimeters per year (equivalent to 1 meter by the end of the century). The results of this exercise indicated that an estimated 1,820 ha of coastal land in the two pilot areas referred to above would be inundated. The areas projected to be thus affected include mudflats, mangroves, and riverbanks. Further, this exercise likewise suggests that erosion damage to coastal roads and bunds is possible.
Climate change is projected to increase the intensity, duration, and frequency of storms, thus increasing the risk of erosion, particularly in areas near coastal settlements. This would likewise result in increased sedimentation at locations near jetties and the mouths of rivers.
Increased sea-surface temperature is a major stressor for aquatic life. Higher than normal water temperatures could cause corals to expel their symbiont algae (zooxanthellae), on which they partly depend for food (via algal photosynthesis), the result of this process being coral bleaching. Prolonged coral bleaching events could thus negatively impact coastal economies that depend on tourism and fishing.
Climate Change Adaptation Measures
Malaysia has long been fully engaged with the climate change community, and has committed itself to steep greenhouse gas reductions. However, the country has been more reactive than it has been proactive in addressing climate change adaptation. Only recently, in Malaysia’s Second National Communication to the UNFCCC had serious consideration been given to adaptation measures other than flood control and disaster risk reduction in the country’s major population centers.
As part of Malaysia’s shift toward anticipating—as opposed to responding to—climate change, a Regional Climate Change Adaptation Knowledge Platform for Asia was formed. A scoping study (published in October 2011) with Malaysian stakeholders was conducted under the auspices of this initiative for planning concrete actions for responding to climate change in Malaysia.
The results of studies presented in the Second National Communication to the UNFCCC indicated a moderate increase in average temperature of 1°C–2°C. While such a change would benefit some agricultural sectors, its impact would be detrimental for most. For example, rice production would fall by 4.6%–6.1% (at +1°C change), and 9.6%–10% (at +2°C change) (Siwar et al. 2009). With regard to the impact of such a change on Malaysia’s natural resources, climate variation would likely exceed the environmental thresholds at which habitats and ecosystems would be able to recover, thus resulting in significant losses in biodiversity. Table 23 summarizes the climate change adaptation strategies proposed for Malaysia's coastal and marine areas.
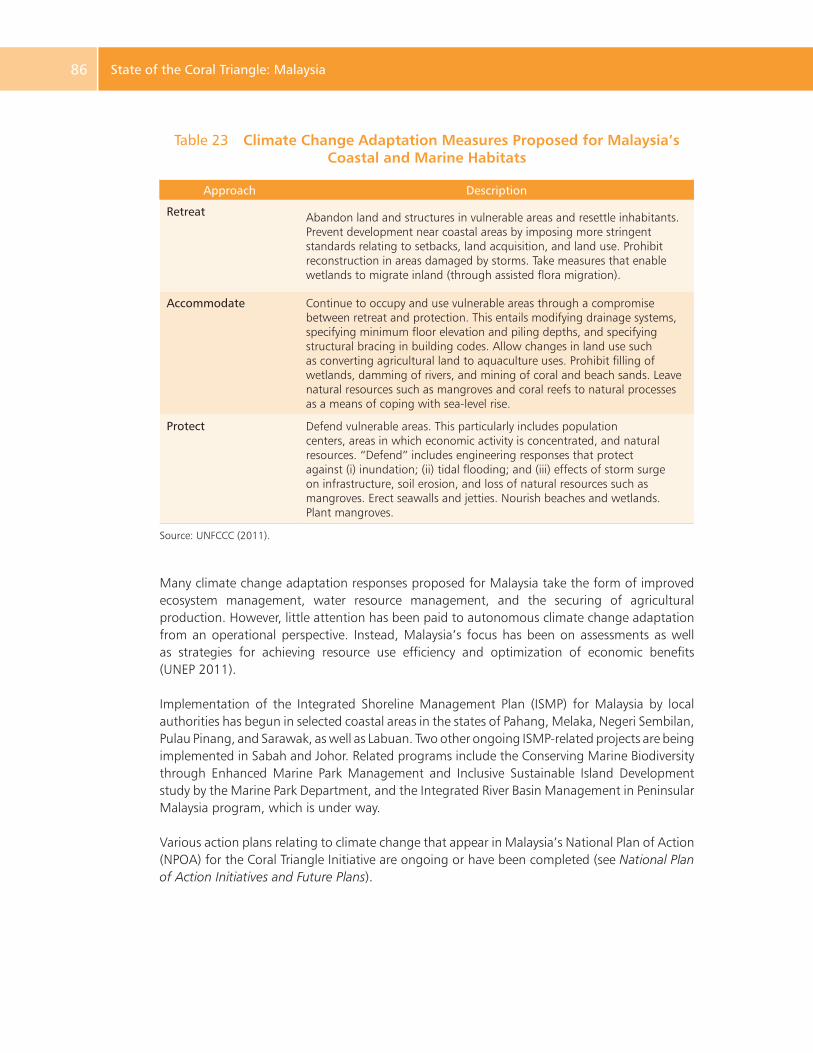
Same Energy, More Power86 State of the Coral Triangle: Malaysia86
Table 23 Climate Change Adaptation Measures Proposed for Malaysia’s Coastal and Marine Habitats
Approach Description
Retreat Abandon land and structures in vulnerable areas and resettle inhabitants. Prevent development near coastal areas by imposing more stringent standards relating to setbacks, land acquisition, and land use. Prohibit reconstruction in areas damaged by storms. Take measures that enable wetlands to migrate inland (through assisted flora migration).
Accommodate Continue to occupy and use vulnerable areas through a compromise between retreat and protection. This entails modifying drainage systems, specifying minimum floor elevation and piling depths, and specifying structural bracing in building codes. Allow changes in land use such as converting agricultural land to aquaculture uses. Prohibit filling of wetlands, damming of rivers, and mining of coral and beach sands. Leave natural resources such as mangroves and coral reefs to natural processes as a means of coping with sea-level rise.
Protect Defend vulnerable areas. This particularly includes population centers, areas in which economic activity is concentrated, and natural resources. “Defend” includes engineering responses that protect against (i) inundation; (ii) tidal flooding; and (iii) effects of storm surge on infrastructure, soil erosion, and loss of natural resources such as mangroves. Erect seawalls and jetties. Nourish beaches and wetlands. Plant mangroves.
Source: UNFCCC (2011).
Many climate change adaptation responses proposed for Malaysia take the form of improved ecosystem management, water resource management, and the securing of agricultural production. However, little attention has been paid to autonomous climate change adaptation from an operational perspective. Instead, Malaysia’s focus has been on assessments as well as strategies for achieving resource use efficiency and optimization of economic benefits (UNEP 2011).
Implementation of the Integrated Shoreline Management Plan (ISMP) for Malaysia by local authorities has begun in selected coastal areas in the states of Pahang, Melaka, Negeri Sembilan, Pulau Pinang, and Sarawak, as well as Labuan. Two other ongoing ISMP-related projects are being implemented in Sabah and Johor. Related programs include the Conserving Marine Biodiversity through Enhanced Marine Park Management and Inclusive Sustainable Island Development study by the Marine Park Department, and the Integrated River Basin Management in Peninsular Malaysia program, which is under way.
Various action plans relating to climate change that appear in Malaysia’s National Plan of Action (NPOA) for the Coral Triangle Initiative are ongoing or have been completed (see National Plan of Action Initiatives and Future Plans).
Causes of Underinvestment and Persistent Energy Inefficiency 87 Threats and Vulnerabilities 87
Climate Change Adaptation Capacity Development Strategy
Malaysia’s two priorities regarding its climate change adaptation strategy are to (i) improve the country’s capacity for assessing vulnerability to climate change and the efficiency of responses to it; and (ii) define the financial requirements of the country’s climate change adaptation strategy (UNEP 2011).
With regard to the latter, the United Nations Development Programme (UNDP) initiated the Economics of Climate Change in Malaysia project, which aims to enable policy and decision makers to identify measures for addressing climate change that are based on sound economic assessment. However, the knowledge development and capacity requirements discussed below have yet to be addressed (UNEP 2011).
The first step in identifying measures for addressing climate change is formulation of the framework to be used for assessing Malaysia’s vulnerability to climate change. This framework must
(i) identify Malaysia’s current limits of ecological and biological sustainability and/or stability under climate change;
(ii) increase Malaysia’s capacity for assessing the country’s vulnerability to climate change impacts;
(iii) identify Malaysia’s adaptation requirements, particularly with regard to the sectors most vulnerable to climate change (water, transport, and agriculture, as well as energy, including dams and water catchments);
(iv) incorporate cost–benefit analysis in a way that compares the economic value of the services provided by Malaysia’s ecosystems against the costs associated with the expected loss of these services as a result of climate change; and
(v) include ecological resilience and land-use studies. In other words, it must identify the costs and benefits of rehabilitation from climate change impacts as opposed to the costs and benefits of adaptation.
Climate Change and Coral Reefs
The temperature increases that have occurred in tropical and subtropical waters over the past 50 years have pushed reef-building corals to their thermal limits. Over this same period, coral reefs have likewise endured a number of other stresses. The sources of these stresses are overfishing, physical damage resulting from both tourist-related activities and storms of an intensity greater than previously, declines in marine water quality, and increases in seawater acidity. The result of all of these stresses taken together could be reefs that are dominated by algae rather than coral.
Similarly, ocean acidification could result in coral communities no longer being able to produce calcium carbonate at rates sufficient for maintaining coral reef structures (Garnaut 2008). Most importantly, coordinated reductions in carbon emissions will be required if coral reefs are to be maintained in their current state. This notwithstanding, Malaysia can unilaterally strengthen its reef ecosystems by reducing other stressors to the maximum extent possible (Government of Malaysia 2010a).
Same Energy, More Power88 State of the Coral Triangle: Malaysia88
Invasive Species
Increases in travel, trade, and tourism associated with globalization and human population increase have enabled movement of species beyond their natural biogeographical barriers. This has allowed alien species to invade geographic areas once separated from one another by these barriers. The result of these changes has been substantial environmental and economic damage, which has in turn been exacerbated by climate change, pollution, habitat loss, and human-induced disturbance.
Based on the Biological Diversity Clearing House Mechanism (BDCHM)13 set up by the Ministry of Natural Resources and Environment (MNRE), a checklist of invasive organisms in Malaysia has been prepared by the Global Invasive Species Database (MNRE 2011). As of November 2011, this database lists 12 species of algae, 45 species of aquatic plants, and 32 species of mollusks present in Malaysia that are classified as invasive.
Some of these species have entered Malaysia through discharge of ballast water by ocean-going transport vessels. In this regard, Malaysia has ratified the International Convention for the Control and Management of Ships’ Ballast Water and Sediments (the Ballast Water Management Convention, or BWM). On 27 September 2011, Malaysia began requiring ships of both Malaysian and foreign registry operating in Malaysian waters to comply with the provisions of the BWM (Marine Department Malaysia 2011).
13 The BDCHM is a mechanism that enables relevant persons and institutions to exchange information regarding biological diversity. The BDCHM likewise facilitates international access to information regarding the status of biodiversity studies and biodiversity management in Malaysia. http://chmfrim.optima.my/About-CHM/CBD-Cross-Cutting-Issues/Invasive-Alien-Species.aspx
89
National Plan of Action Initiatives and Future Plans
Malaysia joined the Coral Triangle Initiative (CTI) in 2009. Together with the support of the Regional Secretariat and its CTI development partners, Malaysia hosted the Fourth Senior Officials Meeting in Kota Kinabalu, Sabah, as well as meetings of several
working committees. Following the Seventh Senior Officials Meeting, the Third Ministerial Meeting in October 2011 resulted in the election of Malaysia as the chair of the Coral Triangle Initiative Council of Ministers for a 2-year term effective November 2011.
Some of the major challenges that Malaysia faces as chair include (i) ensuring a smooth transition from the Interim Regional Secretariat to a permanent Regional Secretariat in Manado, Indonesia, by April 2012; (ii) ensuring implementation of the CTI Activities Road Map 2012; and (iii) strengthening regional cooperation to achieve sustainable financing for the CTI.
National Coordination Committee
In addition to participating in Interim Regional Secretariat activities, Malaysia has established its own CTI National Coordination Committee (NCC) for supporting implementation of Malaysia’s NPOA, as well as the CTI’s regional plan of action. The NCC currently resides in the Ministry of Science, Technology and Innovation (MOSTI). Malaysia’s national secretariat is the National Oceanography Directorate (NOD) within MOSTI.
Initial members of the NCC were drawn from relevant government agencies, research institutions, and nongovernment organizations (NGOs). Over time, the NCC has been reorganized and expanded to accommodate functions that operate in parallel with existing regional working groups (Figure 11). The NCC’s permanent membership includes representatives of 13 federal and 4 Sabah ministries. The NCC convenes three times per year. Nonmember ministries and/or agencies are invited as needed.
Technical Working Groups
The NCC is supported by four technical working groups (TWGs):
(i) The Coordination Mechanisms TWG is responsible for coordinating various projects and CTI-related programs (e.g., regional exchanges, capacity-building programs, community outreach, and sub-working group activities) at both the national and regional levels. It is also responsible for ensuring publication of project results. The chair of the Coordination
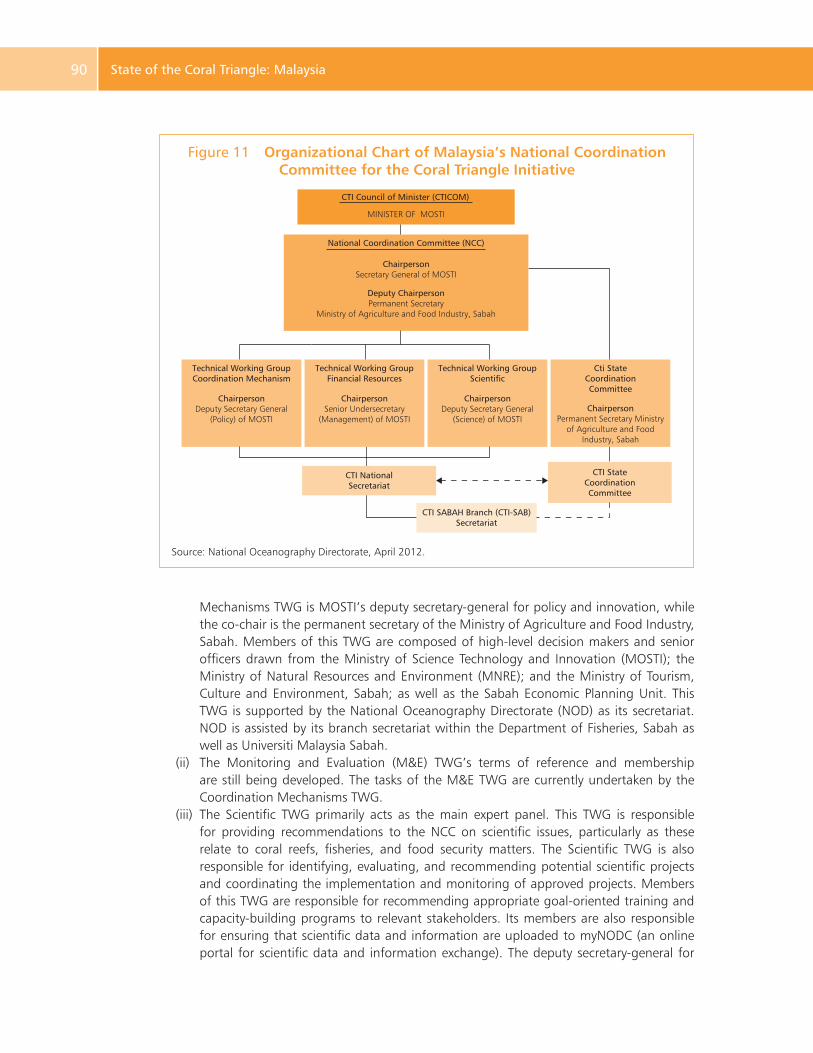
Same Energy, More Power90 State of the Coral Triangle: Malaysia90
Mechanisms TWG is MOSTI’s deputy secretary-general for policy and innovation, while the co-chair is the permanent secretary of the Ministry of Agriculture and Food Industry, Sabah. Members of this TWG are composed of high-level decision makers and senior officers drawn from the Ministry of Science Technology and Innovation (MOSTI); the Ministry of Natural Resources and Environment (MNRE); and the Ministry of Tourism, Culture and Environment, Sabah; as well as the Sabah Economic Planning Unit. This TWG is supported by the National Oceanography Directorate (NOD) as its secretariat. NOD is assisted by its branch secretariat within the Department of Fisheries, Sabah as well as Universiti Malaysia Sabah.
(ii) The Monitoring and Evaluation (M&E) TWG’s terms of reference and membership are still being developed. The tasks of the M&E TWG are currently undertaken by the Coordination Mechanisms TWG.
(iii) The Scientific TWG primarily acts as the main expert panel. This TWG is responsible for providing recommendations to the NCC on scientific issues, particularly as these relate to coral reefs, fisheries, and food security matters. The Scientific TWG is also responsible for identifying, evaluating, and recommending potential scientific projects and coordinating the implementation and monitoring of approved projects. Members of this TWG are responsible for recommending appropriate goal-oriented training and capacity-building programs to relevant stakeholders. Its members are also responsible for ensuring that scientific data and information are uploaded to myNODC (an online portal for scientific data and information exchange). The deputy secretary-general for
Figure 11 Organizational Chart of Malaysia’s National Coordination Committee for the Coral Triangle Initiative
Source: National Oceanography Directorate, April 2012.
MINISTER OF MOSTI
ChairpersonSecretary General of MOSTI
CTI NationalSecretariat
CTI StateCoordinationCommittee
CTI SABAH Branch (CTI-SAB)Secretariat
ChairpersonDeputy Secretary General
(Policy) of MOSTI
ChairpersonDeputy Secretary General
(Science) of MOSTI
ChairpersonSenior Undersecretary
(Management) of MOSTI
Deputy ChairpersonPermanent Secretary
Ministry of Agriculture and Food Industry, Sabah
Technical Working GroupCoordination Mechanism
Technical Working GroupFinancial Resources
Technical Working GroupScientific
ChairpersonPermanent Secretary Ministry
of Agriculture and FoodIndustry, Sabah
Cti StateCoordinationCommittee
National Coordination Committee (NCC)
CTI Council of Minister (CTICOM)
Causes of Underinvestment and Persistent Energy Inefficiency 91 National Plan of Action Initiatives and Future Plans 91
Science and Technology is the chair of the Scientific TWG. The membership of this TWG is composed of high-level decision makers and senior officers drawn from agencies, departments, and ministries, whose functions directly relate to the functions of Scientific TWG.
(iv) The main responsibility of the Financial Resources TWG is to assist the NCC in relevant financial matters. These include managing the funds that have been allocated for approved projects, identifying alternative sources of funding for potential projects, providing advice regarding the acquisition of such funding, and most importantly, developing a mechanism for sustainable financing. This TWG is still in its infancy, and has yet to decide on the appropriate entity for receiving financial support. However, it may be a CTI trust fund, an endowment, a foundation, or some type of other financial entity. The membership of the Financial Resources TWG is composed of high-level decision makers and senior officers drawn from various ministries.
National Plan of Action
Malaysia’s National Plan of Action (NPOA) for the CTI is the first attempt of its kind to formally bring together all programs and projects that relate to marine and coastal management into one document. This will enable all relevant stakeholders to be aware of which projects and programs the agencies and organizations in various ministries are planning or have undertaken within the CTI scientific boundary, which includes Peninsular Malaysia. Several action plans are planned for activities outside the CTI scientific boundary. However, all CTI member countries have mutually agreed that these programs can be regarded as CTI programs.
Malaysia’s NPOA thus provides the full list of action plans (programs, projects, and related initiatives) that address CTI goals and targets. It includes full descriptions of each action that relates to the CTI, as well as the names of the lead agencies concerned, the implementation period relating to each project and program, and the status of each (Government of Malaysia 2012).
The NPOA embodies 134 action plans (some of which satisfy several goals, and thus may seem repetitive), each of which is accompanied by a comprehensive program of implementation, relevant target dates, and performance indicators. These action plans are composed of projects and programs that are ongoing, or that have been proposed by the respective agencies and organizations. These action plans are led by 16 government agencies and departments, 1 research institution, and 1 NGO. Some are led by more than one entity. Table 24 summarizes the status of these action plans as of April 2012.
Several project implementation issues that relate to these action plans have arisen thus far, which include (i) an insufficient number of experienced permanent officers that dedicate themselves to the project; (ii) insufficient availability of experts in science, economics, management, and legal matters; and (iii) inadequate funding for long-term activities, management, and monitoring activities in particular.
Funding has been secured for four action plans, but their implementation has yet to commence. The issues cited for this outcome relate to inadequate funding and insufficient availability of
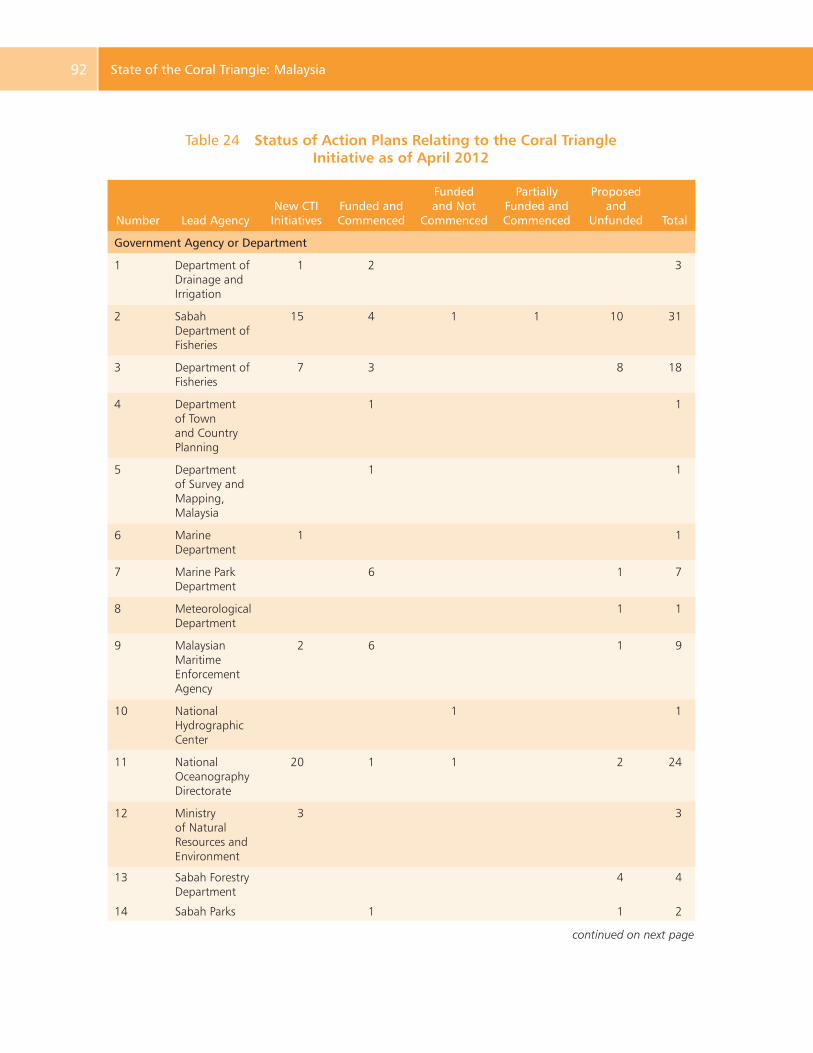
Same Energy, More Power92 State of the Coral Triangle: Malaysia92
continued on next page
Table 24 Status of Action Plans Relating to the Coral Triangle Initiative as of April 2012
Number Lead AgencyNew CTI
InitiativesFunded and Commenced
Funded and Not
Commenced
Partially Funded and Commenced
Proposed and
Unfunded Total
Government Agency or Department
1 Department of Drainage and Irrigation
1 2 3
2 Sabah Department of Fisheries
15 4 1 1 10 31
3 Department of Fisheries
7 3 8 18
4 Department of Town and Country Planning
1 1
5 Department of Survey and Mapping, Malaysia
1 1
6 Marine Department
1 1
7 Marine Park Department
6 1 7
8 Meteorological Department
1 1
9 Malaysian Maritime Enforcement Agency
2 6 1 9
10 National Hydrographic Center
1 1
11 National Oceanography Directorate
20 1 1 2 24
12 Ministry of Natural Resources and Environment
3 3
13 Sabah Forestry Department
4 4
14 Sabah Parks 1 1 2
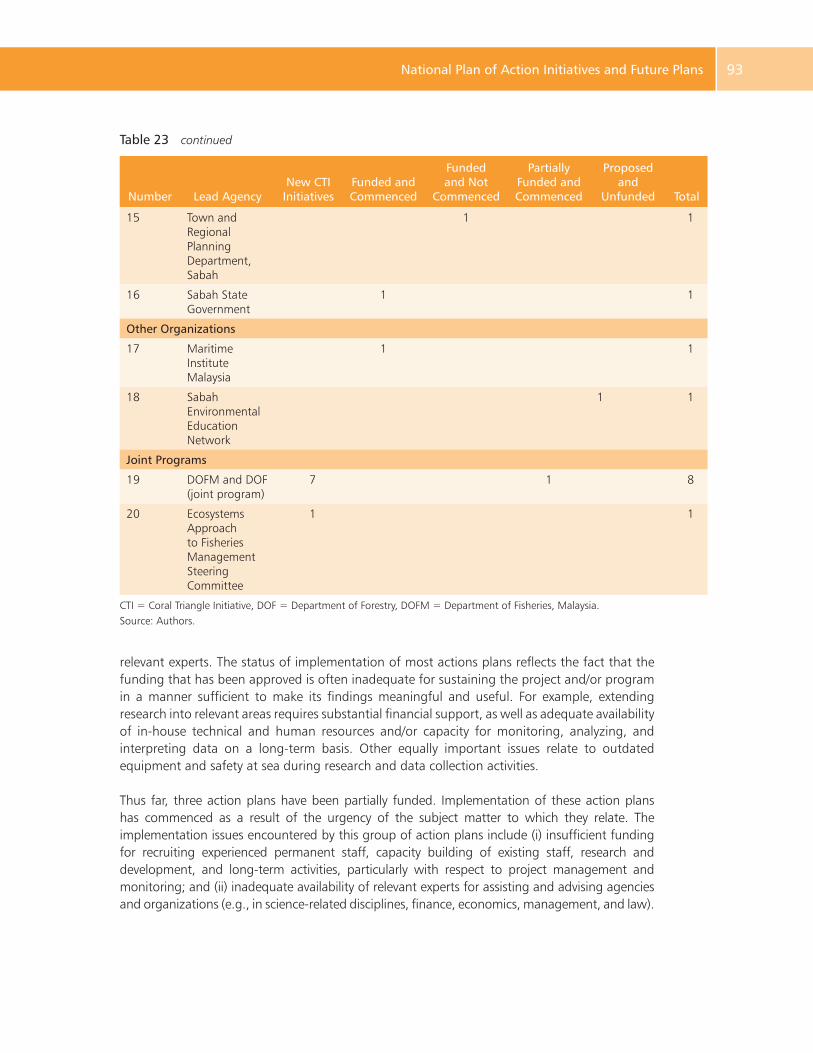
Causes of Underinvestment and Persistent Energy Inefficiency 93 National Plan of Action Initiatives and Future Plans 93
relevant experts. The status of implementation of most actions plans reflects the fact that the funding that has been approved is often inadequate for sustaining the project and/or program in a manner sufficient to make its findings meaningful and useful. For example, extending research into relevant areas requires substantial financial support, as well as adequate availability of in-house technical and human resources and/or capacity for monitoring, analyzing, and interpreting data on a long-term basis. Other equally important issues relate to outdated equipment and safety at sea during research and data collection activities.
Thus far, three action plans have been partially funded. Implementation of these action plans has commenced as a result of the urgency of the subject matter to which they relate. The implementation issues encountered by this group of action plans include (i) insufficient funding for recruiting experienced permanent staff, capacity building of existing staff, research and development, and long-term activities, particularly with respect to project management and monitoring; and (ii) inadequate availability of relevant experts for assisting and advising agencies and organizations (e.g., in science-related disciplines, finance, economics, management, and law).
Table 23 continued
Number Lead AgencyNew CTI
InitiativesFunded and Commenced
Funded and Not
Commenced
Partially Funded and Commenced
Proposed and
Unfunded Total
15 Town and Regional Planning Department, Sabah
1 1
16 Sabah State Government
1 1
Other Organizations
17 Maritime Institute Malaysia
1 1
18 Sabah Environmental Education Network
1 1
Joint Programs
19 DOFM and DOF (joint program)
7 1 8
20 Ecosystems Approach to Fisheries Management Steering Committee
1 1
CTI = Coral Triangle Initiative, DOF = Department of Forestry, DOFM = Department of Fisheries, Malaysia.Source: Authors.
Same Energy, More Power94 State of the Coral Triangle: Malaysia94
A number of action plans proposed by related agencies and organizations remain unfunded for several reasons: (i) funding that has yet to be approved by the government as a result of unforeseen circumstances; (ii) lack of awareness of the types of funds available at the international and regional levels that can supplement government support; (iii) inadequate availability of experienced staff capable of efficiently pursuing financial assistance (i.e., as regards knowledge of appropriate procedures, documentation, and other requirements); and (iv) lack of awareness and understanding by financial decision makers of the importance of the action plans themselves.
Other Programs and Projects Related to the National Plan of Action
Goals and Targets
In addition to government support, Malaysia receives financial and technical assistance from CTI development partners such as the Asian Development Bank (ADB), the Global Environment Facility, and NGOs including the Worldwide Fund for Nature (formerly World Wildlife Fund)-Malaysia and Conservation International.
One ongoing program in Sabah that closely relates to the CTI is the Sulu–Sulawesi Sea Marine Ecoregion (SMME) Initiative. This program includes the regional Global Environment Facility/UNDP-funded project Sustainable Fisheries: Sulu Celebes Sea Sustainable Fisheries Management. This project is described in the Introduction of this report.
Other ongoing SSME-related programs in Sabah include the following (ADB 2011):
(i) a non-detrimental study for humphead wrasse for the regulation of exports;(ii) research on the migration of small pelagic fish that employs the tag–recapture technique
(Southeast Asian Fisheries Development Center);(iii) training of Department of Fisheries staff and fishing boat operators on the use of turtle-
excluding devices for reducing bycatch in trawling operations;(iv) strengthening of enforcement of prohibitions against poaching of marine resources
(Malaysian Maritime Enforcement Agency);(v) compliance of deep-sea vessels in installing devices that enable a vessel monitoring
system; and(vi) engagement of trawl fishing operators in the trial use of turtle-excluding devices for
gathering data on bycatch for fishery policy formulation (through the Marine Research Foundation–Department of Fisheries Sabah–Conservation International partnership).
Management Issues
Capacity Building
One of the more pressing issues Malaysia faces is strengthening of the capacity of the National Secretariat, particularly now that Malaysia chairs the Coral Triangle Initiative Council of Ministers. The National Secretariat thus requires institutional and administrative support, both in terms of financial resources and technical expertise.
Causes of Underinvestment and Persistent Energy Inefficiency 95 National Plan of Action Initiatives and Future Plans 95
Maintaining the support required for successfully implementing Malaysia’s NPOA requires a transparent communication mechanism and strategy that benefits all relevant stakeholders. Manageable communication mechanisms at the national, regional, and international levels for governments, development partners, and donors thus need to be formulated and formalized.
Another pressing issue is the apparent lack of local expertise in relevant fields, particularly as this relates to (i) ocean-based science and planning (e.g., marine spatial planning), (ii) economics (e.g., payment for ecosystem services [PES] schemes), and (iii) management and law (e.g., as it relates to the ecosystem approach to fisheries management). Such expertise is necessary for appropriately advising and guiding decision makers.
Traditionally, conservation efforts have been assumed to be solely the responsibility of government. However, in recent years, many successful conservation and sustainable management initiatives have been implemented by civil society organizations, albeit for the most part on a voluntary basis (e.g., in response to corporate social responsibility imperatives).
While such initiatives are welcome, the organizations that implement them require training and awareness programs for ensuring that their membership recognizes the potential economic value of environmental conservation and sustainable marine resource management. One area for consideration in this regard is public–private partnership (PPP) training programs for both the public and private sectors. Such training could include a PES module. Malaysia is still at an early stage in developing PES mechanisms, and the pool of PES experts upon which Malaysia can draw is limited.
Financial Considerations
As with many developing countries, Malaysia mainly relies on government budgetary allocations and supplemental donor-agency funding for financing its conservation and sustainable marine resource management initiatives.
As a result, sustainable financing has been earmarked as one of the most important agenda items for discussion during Malaysia’s tenure as the chair of the Coral Triangle Initiative Council of Ministers. As evidenced by issues disclosed by stakeholders and discussed in this report, identification of sources of adequate funding is a continual constraint in implementing environmental programs. For example, the SSME is continually exploring means of financing its various programs.
Sabah has implemented self-financing mechanisms such as registration and licensing fees for a number of years. However, due to the subsistence nature of most fishers, these funding mechanisms have not generated adequate revenue for funding all of the state’s sustainable marine resource management programs (ADB 2011). In all, the amount raised from licensing fees is approximately RM500,000 per year. This amount is deposited into a consolidated fund from which the Department of Fisheries bids for its annual budget.
Sabah Parks has implemented a user-fee scheme in an effort to sustain the cost of park management. In the Kota Kinabalu National Park alone, approximately RM5 million–RM6 million has been collected per annum. This covers at least 80% of total park operating expenses. However, as with licensing fees, this revenue is deposited into a consolidated fund. It thus does not necessarily go
Same Energy, More Power96 State of the Coral Triangle: Malaysia96
directly to the park that generates the revenue. There are indications that users are willing to pay higher fees than those currently charged, provided that the revenue thus generated is used for conservation programs benefiting the park that generated the additional revenue.
Another financing mechanism employed in Sabah is the levying of penalties and fines for violations of environment-related ordinances. This mechanism could be reevaluated and improved.
A wide range of additional mechanisms for financing conservation initiatives are available (Spergel and Moye 2004). Based on the experience of the SSME initiative in Sabah, the appropriateness of each of these financing mechanisms varies with the local context. Factors such as the number and intensity of conflicts in resource use, the prevailing legal arrangements, the institutional capacity of the local management agency, and the degree of environmental degradation in the area concerned all impact the appropriateness of particular types of funding mechanisms, as well as the level of funding that each can potentially produce (ADB 2011). In most cases, obtaining the total amount of funding required for sustaining environmental programs requires drawing on a number of financing sources simultaneously.
One potential funding mechanism is a fee that targets charismatic or flagship species, such as marine turtles in the Turtle Island Heritage Protected Area. Another potential mechanism developed in 2011 is the trust fund approach proposed by the Sabah Department of Fisheries. Such a trust fund would be used solely to finance conservation programs (ADB 2011). The PPP mechanism could also be a significant source of revenue for financing conservation and sustainable management initiatives.
Another potential financing mechanism is levying taxes for the sole purpose of financing conservation initiatives. For example, a tourist tax might be collected at airports, the proceeds of which would be used to finance conservation initiatives. Several feasibility studies regarding this potential source of financing are ongoing. Another source of funding currently being considered is a tax levied on polluting industries (e.g., palm oil, logging, and other industries that contribute to water pollution). However, such a tax would in all likelihood be collected at the federal level. As a result, disbursements for conservation initiatives at the local level would not be automatic (ADB 2011).
Finally, the Sabah Fisheries Department is currently studying the feasibility of taxing the fish trade, and using the revenue thus generated solely for purposes of conservation and sustainable management of fisheries (ADB 2011).
Public Awareness
Public awareness regarding the CTI remains at a minimal level. However, a number of NGOs—the Worldwide Fund for Nature-Malaysia in particular—have actively promoted awareness of, and interest in the CTI. Conservation NGOs at all levels and their increasing use of social networks and other forms of media have increased general public awareness of the importance of sustainably managing and conserving marine resources. This has increased the number of articles disseminated by print media that highlight the importance of conserving and sustainably managing marine resources.
Causes of Underinvestment and Persistent Energy Inefficiency 97 National Plan of Action Initiatives and Future Plans 97
Private sector interests such as in Malaysia’s tourism industry (e.g., diving operators, beach resorts, and hotels) are likewise sponsoring their own conservation public awareness programs. While these were initially implemented to satisfy corporate social responsibility imperatives, these programs are expanding at an impressive rate. For example, under its new sustainable seafood policy, Shangri-La Hotels and Resorts has banned all sharksfin dishes from its restaurant and banquet menus across its entire 72-hotel portfolio effective January 2012. In this regard, Shangri-La’s Sabah-based hotel Rasa Ria and Tanjung Aru resorts were among the first to remove sharksfin dishes from their menus in support of the Sabah government’s ban on shark hunting in Sabah waters. Bluefin tuna and Chilean seabass will also be phased out by the end of the year.
Finally, the National Secretariat has recently developed an internet portal through which it communicates with the general public. More specifically, myNODC (http://www.mynodc.gov.my/) aims to disseminate information regarding conservation and sustainable management of marine resources to researchers, and the public. However, the impact of this portal could be expanded, both by improving its internal infrastructure, and by connecting it to other similar portals worldwide. Ultimately, optimal communication with the public regarding the importance of sustainably managing marine resources would require a media team that is dedicated to managing the portal, as well as all communication-related activities. This could be addressed by formulating a marine conservation media plan that would address high-priority marine conservation issues.
98
References
Abdullah, A.R., N.M. Tahir, S.L. Tong, T.M. Hoque, and A.H. Sulaiman. 1999. The GEF/UNDP/IMO Malacca Straits Demonstration Project: Sources of Pollution. Marine Pollution Bulletin. 39. pp. 229–233.
Abreu-Grobois, A. and P. Plotkin. 2008. Lepidochelys olivacea. In IUCN 2010: IUCN Red List of Threatened Species. Version 2010.3. www.iucnredlist.org
Affendi, Y.A., B.H. Tajuddin, Y.L. Lee, A.A. Kee Alfian, and Y. Yusri. 2005. Scleractinian Coral Diversity of Kg. Tekek, Pulau Tioman Marine Park. In Sahibin Abdul Rahim et al., eds. Proceedings of the 2nd Regional Symposium on Environment and Natural Resources, Vol. 2, pp. 20–31. 22–23 March 2005, Kuala Lumpur.
Affendi, Y.A., B.H. Tajuddin, Y. Yusuf, A.A. Kee Alfian, N.L. Wong, J.L.S. Ooi, and M.N. Nayan. 2007. The Marine Biological Resources Survey of the Proposed Area for Pulau Tioman Airport Pahang Darul Makmur. Universiti Malaya Maritime Research Centre (UMMaritime) Universiti Malaya, Kuala Lumpur. Technical report submitted to the Marine Parks Department, Ministry of Natural Resources and Environment, Putrajaya, Malaysia.
Affendi, Y.A. and R.R. Faedzul. 2011. Current Knowledge on Scleractinian Coral Diversity of Peninsular Malaysia: Malaysia’s Marine Biodiversity—Inventory and Current Status. Putrajaya: Department of Marine Parks Malaysia.
Ahmed, A.F., Z.A. Mohamed, and M. Harron. 2010. The Influence of Consumer’s Socio-demographic Factors on Fish Purchasing Behavior in Malaysia. Agribusiness and Information Systems. Faculty of Agriculture, Universiti Putra Malaysia.
Ahmed, M., C.K. Chong, and H. Cesar (eds). 2005. Economic Valuation and Policy Priorities for Sustainable Management of Coral Reefs. Second Edition. WorldFish Center: Malaysia. http://www.worldfishcenter.org/resource_centre/CoralReef_14March2006_low%20res.pdf
Alcala, A.C. and G.R. Russ. 1990. A direct test of the effects of protective management on abundance and yield of tropical marine resources. J. Cons. int. Explor. Mer., Vol. 46, pp. 40-47.
Amin, B., A. Ismail, M.S. Kamarudin, A. Arshad, and C.K. Yap. 2005. Heavy Metals (Cd, Cu, Pb and Zn) Concentrations in Telescopium telescopium from Dumai Coastal Waters, Indonesia. Pertanika Journal of Tropical Agricultural Science. 28(1). pp. 33–39.
Arshad, A.B., J. Sidik, and M.S. Mohd. Zaki. 1997. Roles of Mangrove Ecosystem. In Malaysian Fisheries, edited by Japar Sidik, B. F.M. Yusoff, M.S. Zaki, and T. Petr. Universiti Putra Malaysia, Serdang, Malaysia.
ASEAN Centre for Biodiversity. 2010. ASEAN Biodiversity Outlook. Los Baños, Laguna, Philippines.
Causes of Underinvestment and Persistent Energy Inefficiency 99 References 99
Asian Development Bank (ADB). 2011. Comprehensive Action Plans of the Sulu–Sulawesi Marine Ecoregion. A Priority Seascape of the Coral Triangle Initiative. Manila.
Asia-Pacific Fishery Commission (APFIC). 2010. Fishery Governance Fact Sheets. http://www.fao.org/fishery/rfb/apfic/en (accessed 18 March 2012).
Ayling, A.M. and A.L. Ayling. 1987. A biological survey of selected sites on the Ningaloo fringing reefs. Unpublished report to the West Australian Department of Conservation and Land Management. 47 pp.
Baine, M., ed. Darwin Initiative-Funded Project. 1998. International Center for Island Technology; Heriot–Watt University, Orkney, Scotland; and Institut Penyelidikan Perikanan, Penang, Malaysia (project partners).
Baine, M. and B. Forbes. 1996. The Taxonomy and Exploitation of Sea Cucumbers in Malaysia. Heriot-Watt University, Scotland. Unpublished report.
Baine, M. and P.S. Choo. 1999. Sea Cucumber Fisheries and Trade in Malaysia. In M. Baine, ed. The Conservation of Sea Cucumbers in Malaysia: Their Taxonomy, Ecology and Trade. Proceedings of an international conference, 25 February.
Bali, J.H., H.C. Liew, E.H. Chan, and O.B. Tise. 2002. Long-Distance Migration of Green Turtles from the Sarawak Turtle Islands, Malaysia. In A. Mosier, A. Foley, and B. Brost, eds. Proceedings of the Twentieth Annual Symposium on Sea Turtle Biology and Conservation, Orlando, Florida.
Biusing, R. 1997. Status of the Sea Cucumber Fishery in Sabah. In The Sea Cucumbers of Malaysia. Proceedings of a seminar held at the Borneo Marine Research Unit, Universiti Malaysia Sabah, Kota Kinabalu.
Black, K.D. 2001. Environmental economic and social impacts of mariculture. In J. Steele, S. Thorpe, K. Turekian, eds. Encyclopedia of Ocean Sciences. Academic Press.
Burke, L., E. Selig, and M. Spalding. 2002. Reefs at Risk in Southeast Asia. World Resources Institute: US.
Census of Malaysia. 2010. Population and Housing Census of Malaysia: Population Distribution and Basic Demographic Characteristics. Kuala Lumpur: Department of Statistics.
Chan, E.H. 2006. Marine Turtles in Malaysia: On the Verge of Extinction? Aquatic Ecosystem Health and Management. 9(2). pp. 175–184.
______. 2007. Threats to Turtle Conservation in Malaysia. Paper presented at the National Conference on Coastal and Marine Biodiversity, 17–18 April 2007, Kuala Lumpur, Malaysia.
Chan, E.H. and H.C. Liew. 2001. Sea Turtles. In J.E. Ong and W.K. Gong, eds. The Encyclopaedia of Malaysia, V. 6: The Seas. Kuala Lumpur: Editions Didier Millet.
Chan, E.H., H.C. Liew, and A.G. Mazlan. 1988. The Incidental Capture of Sea Turtles in Fishing Gear in Terengganu, Malaysia. Biological Conservation. 43(1). pp. 1–7.
Choo, P.S. 2002. Regulating Biotoxins in Seafood—The Need for Rational Approach. INFOFISH International. No. 2/2002. pp. 47–51.
Same Energy, More Power100 References100
______. 2004. Fisheries, Trade and Utilization of Sea Cucumbers in Malaysia. In Advances in Sea Cucumber Aquaculture and Management, edited by A. Lovatelli, C. Conand, S. Purcell, S. Uthicke, J.F. Hamel, and A. Mercier. FAO Fisheries Technical Paper. No. 463. Rome.
______. 2008. Population Status, Fisheries and Trade of Sea Cucumbers in Asia. In Sea Cucumbers. A Global Review of Fisheries and Trade, edited by V. Toral-Granda, A. Lovatelli, and M. Vasconcellos. FAO Fisheries and Aquaculture Technical Paper. No. 516. Rome.
Chou, L.M., T. Yeemin, A.R. Gor Yaman, S. Tuan, P. Alino, and Suharsono. 2009. Galaxea. Journal of Coral Reef Studies. 11. pp. 67–74.
Coates, R. 2009. Juru Selam—Malaysia’s Expert Divers. London: Seiche Ltd.
Comley, J., R. Walker, J. Wilson, A. Ramsay, I. Smith, and P. Raines. 2004. Malaysia Coral Reef Conservation Project: Pulau Redang. Report to the Department of Marine Parks, Malaysia, March–September 2004. Surrey, UK: Coral Cay Conservation.
Cumming, R.L. 2009. Population Outbreaks and Large Aggregations of Drupella on the Great Barrier Reef. Townsville: Great Barrier Reef Marine Park Authority.
Daily, G.C. 1997. Nature’s Services: Societal Dependence on Natural Ecosystems. Washington, DC: Island Press.
Department of Fisheries, Malaysia. http://www.dof.gov.my/en/1373.
Ecosystem-Based Management of Fisheries (EBMF). 2011. Visioning Workshop for the Management and Development of Peninsular Malaysia Marine Resources through EBMF. WWF (Formerly World Wildlife Fund) Malaysia, Port Dickson, Negeri Sembilan, Malaysia.
Forbes, R. and Z. Ilias. 1999. The Taxonomy and Ecology of Sea Cucumbers in Malaysia. In The Conservation of Sea Cucumbers in Malaysia: Their Taxonomy, Ecology and Trade. Proceedings of an International Conference, 25 February 1999, edited by M. Baine. Department of Agriculture, Kuala Lumpur, Malaysia. Orkney, UK: Heriot–Watt University.
Fortes, M.D. and H. Ogawa. 2006. Field guide to the identification of East Asian seagrasses. The Japanese Funds-in-Trust for UNESCO and The Japan Society for the Promotion of Science (in a form of portable plastic sheet for fieldwork).
Garnaut, R. 2008. Climate Change Review. Draft report. June. Canberra, Commonwealth of Australia.
Ghasemi, S., M. Zakaria, and N.M. Hoveizeh. 2011. Abundance of Molluscs (Gastropods) at Mangrove Forests of Iran. Journal of American Science 7 (1). pp. 660–669.
Global Coral Reef Monitoring Network (GCRMN). Status of Coral Reefs in Eastern Malaysia: Marine Protected Areas (MPAs) and Level of Management. Townsville: Australian Institute of Marine Science. http://gcrmn.org/
Global Environment Facility (GEF)/United Nations Development Programme (UNDP)/International Maritime Organization (IMO). 1999. Total Economic Valuation: Coastal and Marine Resources in the Straits of Malacca; MPP-EAS Technical Report No. 24; GEF/UNDP/IMO Regional Programme for the Prevention and Management of Marine Pollution in the East Asian Seas (MPP-EAS): Quezon City, Philippines.
Causes of Underinvestment and Persistent Energy Inefficiency 101 References 101
Government of Malaysia. 2010a. State of the Marine Environment Report. Malaysia Ocean Policy (2010–2020). National Oceanography Directorate, Ministry of Science, Technology and Innovation: Malaysia, Kuala Lumpur.
______. 2010b. Malaysia Ocean Policy. Draft Final Report. Kuala Lumpur.
______. 2010c. National Coastal Resources and Marine Environmental Profile of Malaysia. Ministry of Science, Technology and Innovation. Kuala Lumpur.
______. 2011a. Progress Report: Rapid Assessment of the Legal, Institutional and Management Arrangements for Mangroves, Ecotourism and Water Quality at Kota Marudu, Sabah, Kuala Lumpur, Malaysia. pp. 39–82.
______. 2011b. 10th Malaysia Plan. Chapter 6: Building An Environment that Enhances Quality of Life. Kuala Lumpur. http://www.epu.gov.my/html/themes/epu/html/RMKE10/img/pdf/en/chapt6.pdf
______. 2012. Malaysia National Plan of Action. Kuala Lumpur. http://www.mynodc.gov.my/administrator/components/com_jresearch/files/publications/NPOA.pdf
Government of Malaysia, Department of Fisheries. 1987. Final Report—Deep-Sea Fisheries Resources Survey within the Malaysian Exclusive Economic Zone. Kuala Lumpur.
______. 1992. Annual Fisheries Statistics–1991. Kuala Lumpur: Department of Fisheries, Malaysia.
______. 2002. Annual Fisheries Statistics–2000. Kuala Lumpur: Department of Fisheries, Malaysia.
______. 2008. Annual Fisheries Statistics–2007. Kuala Lumpur.
______. 2009. Annual Fisheries Statistics–2008. Kuala Lumpur: Department of Fisheries, Malaysia.
______. 2010. Annual Fisheries Statistics–2009. Kuala Lumpur: Department of Fisheries, Malaysia
Government of Malaysia, Department of Forestry. 2010. Forestry Statistics Peninsular Malaysia. Kuala Lumpur.
Government of Malaysia, Department of Standards. 2010. Basic Population Characteristics by Administrative Districts. Kuala Lumpur: Department of Statistics.
Government of Malaysia, Department of Statistics. 2000. Labour Force Survey Report. Kuala Lumpur.
______. 2010. Domestic Tourism Survey: Summary Findings. Kuala Lumpur.
Hamid, M.Y.A. and H.S. Sidhu. 1993. Metal Finishing Wastewater Characteristics and Minimization. In Waste Management in Malaysia: Current Status and Prospect for Bioremediation, edited by B.G. Yeoh, K.S. Chee, S.M. Phang, Z. Isa, A. Idris, and M. Mohamed. Kuala Lumpur: Ministry of Science, Technology and Innovation, Malaysia.
Harborne, A., D. Fenner, A. Barnes, M. Beger, S. Harding, and T. Roxburgh. 2000. Status Report on the Coral Reefs of the East Coast of Peninsula Malaysia. London: Coral Cay Conservation Ltd.
Hendrickson, J.R. 1961. Conservation Investigations on Malayan Turtles. Malayan Nature Journal. 21st Anniversary Special Issue. pp. 214–223.
Same Energy, More Power102 References102
Ho, N., K. Kassem, and S. Ng. 2011. Seagrass Assessment Report of Semporna Priority Conservation Area. Kota Kinabalu, Malaysia: WWF-Malaysia. http://repository.wwf.org.my/technical_reports/S/Seagrass%20Assessment%20Report%20of%20Semporna%20PCA%20.PDF
Hoegh-Guldberg, O., P. Mumby, A. Hooten, R. Steneck, P. Greenfield, E. Gomez, C. Harvell, P. Sale, A. Edwards, K. Caldeira, N. Knowlton, C. Eakin, R. Iglesias-Prieto, N. Muthiga, R. Bradbury, A. Dubi, and M. Hatziolos. 2007. Coral Reefs under Rapid Climate Change and Ocean Acidification. Science 318 (5857). pp. 1,737–1,742.
Hong, Y.B. 2011. Rapid Appraisal of the Economic Values of the Semporna Priority Conservation Area. Kuala Lumpur: WWF-Malaysia.
Hundloe et al. 1987. Willingness to Pay Survey of the Great Barrier Reef.
Indian Ocean Tuna Commission (IOTC). 2010. Fishery Governance Fact. Regional Fishery Bodies Summary Descriptions. Sheets. http://www.fao.org/fishery/rfb/iotc/en (accessed 18 March 2012).
Ismail, A. and R. Rosniza. 1997. Trace Metals in Sediments and Mollusks from An Estuary Receiving Pig Farm Effluent. Environmental Technology. 18. pp. 509–515.
Isnain, I. 2010. Malaysia Marine Protected Areas. Presentation at the 6th ICRI East Asia Regional Workshop. Phuket, Thailand. 26–28 June. http://earw.icriforum.org/EastAsiaRW2010-agenda.html
IUCN Red List. Humphead Wrasse (Cheilinus undulatus). http://www.iucnredlist.org/documents/attach/4592.pdf (accessed 10 February 2012).
Jaaman, S.A. and U.L.A. Yuhana. 2002. Current Knowledge of Dugong (Dugong dugon Muller, 1776) in East Malaysian Waters. Presented at the Asia Pacific Conference on Marine Science and Technology. Kuala Lumpur. 12–16 May.
Jaaman, S.A. and Y.U. Lah-Anyi. 2002. Human Perspectives on Marine Mammals in East Malaysia. Paper presented in the 7th Biennial International Conference of the Borneo Research Council. Kota Kinabalu. 15–18 July.
______. 2003. Dugongs (Dugong dugon Müller, 1776) in East Malaysian Waters. ASEAN Review of Biodiversity and Environmental Conservation Online Journal. October. http://www.arbec.com.my/dugongs
Jaaman, S.A., Y.U. Lah-Anyi, and G.J. Pierce. 2009. The Magnitude and Sustainability of Marine Mammal By-Catch in Fisheries in East Malaysia. Journal of the Marine Biological Association of the United Kingdom. 89. pp. 907–920.
Jakobsen, F., N. Hartstein, J. Frachisse, and T. Golingi. 2007. Sabah Shoreline Management Plan (Borneo, Malaysia): Ecosystems and Pollution. Ocean and Coastal Management. 50. pp. 84–102.
Japar Sidik, B., Z. Muta Harah, and A. Arshad. 2003. The Occurrence of Enhalus acoroides Fruits, Seeds and Seedlings. In Aquatic Resources and Environmental Studies of the Straits of Malacca—Managing the Straits through Science and Technology. B. Japar Sidik et al., eds. Serdang, Malaysia: Research and Development Center (MASDEC), Universiti Putra Malaysia.
Jennings, S., M.J. Kaiser, and J.D. Reynolds. 2001. Marine Fisheries Ecology. Victoria: Blackwell.
Causes of Underinvestment and Persistent Energy Inefficiency 103 References 103
Jusoff, K. 2008. Managing Sustainable Mangrove Forests in Peninsular Malaysia. Journal of Sustainable Development. 1 (1). pp. 88–96.
Kamal, M. 2007. Climate Change—Its Effects on the Agricultural Sector in Malaysia. National Seminar on Socio-Economic Impact of Extreme Weather and Climate Change, organized by the Ministry of Science, Technology and Innovation, 21–22 June 2007. Putrajaya, Malaysia.
Kari, F. et al. 2011. Growth, Equity and Vulnerability in Marine Park Areas: In Search of Economic-Environmental Balance. World Applied Sciences Journal. 14(2). pp. 277–284.
Karlson, R.H. 1999. Dynamics of Coral Communities.Population and Community Biology Series, Volume 23. London: Kluwer Academic Publishers.
Kathiresan, K. and S.Z. Qasim. 2005. Biodiversity of Mangrove Ecosystem. Delhi: Hindustan Publishing Corporation.
Khalid, N. 2010. The curious case of the Malaysian shipbuilding industry: Challenges faced by Malaysian shipyards. Baird Maritime. 6 May. http://www.bairdmaritime.com/index.php?option=com_content&view=article&id=6584%3Athe-curious-case-of-the-malaysian-shipbuilding-industry&catid=98%3Afull-speed-ahead&Itemid=122&limitstart=1
Kiew, B.H. 1984. Conservation Status of the Malaysian Fauna. V. Turtles, Terrapins and Tortoises. Malayan Naturalist. November. pp. 2–3.
Khoo, K.H. 1976. Optimal Utilization and Management of Fishery Resources. Kajian Ekonomi Malaysia, 13 Nos. 1&2. Malaysian Economic Association: Kuala Lumpur.
Leong, T.S. and K.T. Siow. 1980. Tourism in the East Coast of Peninsular Malaysia. In T.E. Chua and J.K. Charles, eds. Coastal Resources of East Coast Peninsular Malaysia. Kuala Lumpur: Universiti Sains Malaysia.
Liew, H.C., E.H. Chan, P. Papi, and P. Luschi. 1995. Long Distance Migration of Green Turtles from Redang Island, Malaysia. In The Need for Regional Cooperation in Sea Turtle Conservation. Proceedings of the International Congress of Chelonian Conservation. Gonfaron, France.
Lim, P.T., C.P. Leaw, and G. Usup. 2001. First Incidence of Paralytic Shellfish Poisoning on the East Coast of Peninsular Malaysia. In A. Sasekumar, G. Usup, M. Noraieni, E.H. Ung, and S.C. Lee, eds. Abstracts. Marine Science into the New Millennium: New Perspectives and Challenges. Asia-Pacific Conference on Marine Science and Technology, 12–16 May. Kuala Lumpur.
MacNae, W. 1974. Mangrove Forests and Fisheries. Food and Agriculture Organization/UNDP Indian Ocean Program (Indian Ocean Fishery Commission) IOFC/DEV/74/34. Rome.
Mah, D.Y.S., S.H. Lai, R. Aldrino, R.B. Chan, and F. J. Putuhena. 2010. Investigative modelling of the flood bypass channel in Kuching, Sarawak, by assessing its impact on the inundations of Kuching-Batu Kawa-Bau Expressway. Structure and Infrastructure Engineering. pp. 1–10.
Malaysian Institute of Economic Research (MIER). 2000. Fisheries Development Study in Malaysia. Kuala Lumpur: MIER.
Malaysia Logistics Directory (MLD). 2010. Malaysia Logistics Directory, 2010/2011. http://www.msialogistics.com/IndProf%5CMLD%5Cmldeditorial.pdf
Same Energy, More Power104 References104
Malaysian Meteorological Department (MMD). 2009. Climate Change Scenarios for Malaysia (2001–2099). Scientific report. Kuala Lumpur: Ministry of Sciences, Technology and Innovation.
Malaysian Shipbuilding Ship Repair 2025. 2010. Malaysian Shipbuilding and Ship Repair Industry 2025 Strategic Plan. Cyberjaya, Malaysia: Malaysian Industry-Government Group for High Technology.
Marine Department Malaysia. 2011. Malaysia Shipping Notice. Implementation of International Convention for the Control and Management of Ships’ Ballast Water and Sediments, 2004 (BWM 2004). http://www.marine.gov.my/service/notice/NPM/2011/MSN282011BWM.pdf (accessed 20 March 2012).
Maritime Institute Malaysia. 2006. Malaysia National Coral Reef Report. UNEP-GEF project and Marine Park Section, Ministry of Natural Resources and Environment, Malaysia.
Marsh, H. 2008. Dugong dugon. Cited in IUCN 2010. IUCN Red List of Threatened Species. Version 2010.3. www.iucnredlist.org (accessed 20 October 2010).
McKenzie, L., S. Campbell, and F. Lasi. 2006. Seagrasses and Mangroves. In A. Green, P. Lokani, W. Atu, P. Ramohia, P. Thomas, and J. Almany, eds. Solomon Islands Marine Assessment: Technical Report of Survey. The Nature Conservancy Pacific Island Countries Report No. 1/06.
Metcalfe, I. 1988. Origin and Assembly of Southeast Asian Continental Terranes. In M.G. Audley-Charles, and A. Hallam, eds. Gondwana and Tethys, Geological Society of London Special Publication. 37. pp. 101–118.
______. 2000. The Bentong-Raub Suture Zone. Journal of Asian Earth Sciences. 8. pp. 691–712.
______. 2002. Permian Tectonic Framework and Palaeogeography of SE Asia. Journal of Asian Earth Sciences. 20. pp. 551–766.
Mcllgorm, A. 2004. Economic Value of the Marine Sector across the APEC Marine Economies. Draft report to the APEC Marine Resource Conservation Working Group Project (05/2004), by the Centre for Marine Policy, University of Wollongong, Australia.
______. 2009. What can measuring the marine economies of Southeast Asia tell us in times of economic and environmental change?. Tropical Coasts. 16(1). pp. 40–48.
McManus, J.W. 1988. Coral Reefs of the ASEAN Region: Status and Management. Ambio.17(3). pp. 189–193.
Millennium Ecosystem Assessment. 2005. Ecosystems and Human Well-Being: Synthesis. Washington, DC: World Resources Institute. http://www.maweb.org/documents/document.356.aspx.pdf
Minerals and Geoscience Department. 2009. Malaysian Minerals Yearbook 2008. Kuala Lumpur.
Ministry of Agriculture. 1999. Third National Agricultural Policy (1998–2010). Kuala Lumpur.
Ministry of Natural Resources and Environment. 2011. Biological Diversity: Clearing House Mechanism. Ministry of Natural Resources and Environment, Putrajaya, Malaysia. http://chmfrim.optima.my/About-CHM/CBD-Cross-Cutting-Issues/Invasive-Alien-Species.aspx (accessed 20 March 2012).
Causes of Underinvestment and Persistent Energy Inefficiency 105 References 105
Moberg, F. and C. Folke. 1999. Ecological Goods and Services of Coral Reef Ecosystems. Ecological Economics. 29. pp. 215–233.
Mohd Salleh, N.H., R. Othman, and N.F.A. Harun. 2010. The Impact of Marine Park Gazettement to Local Community Sustainable Livelihoods: A Case Study of Redang and Tioman Islands. Universiti Kebangsaan Malaysia, Bangi, Selangor.
Mortimer, J.A. and M. Donnelly. 2008. Eretmochelys imbricata.Cited in IUCN 2010.IUCN Red List of Threatened Species. Version 2010.3. www.iucnredlist.org (accessed 20 October 2010).
Moyer, J.T., W.K. Emerson, and M. Ross. 1982. Massive destruction of scleractinian corals by the muricid gastropod Drupella in Japan and the Philippines. Nautilus, 96: 69–82.
National Research Council. 1990. Decline of the Sea Turtles: Causes and Prevention. Washington, DC: The National Academies Press.
Naylor, R.L., S.L. Williams, and D.R. Strong. 2001. Aquaculture—a Gateway for Exotic Species. Science 294. No. 5547.
Norfadhilah, M.A. 2006. Sustainability of Petroleum and Environmental Control in the Malaysian Petroleum Law. Faculty of Syariah and Law, Kolej University Islam Malaysia, Negeri Sembilan, Malaysia.
Nurridan, A.H. 2007. Seaweeds of Sarawak, Malaysia, Borneo. Sarawak, Malaysia: Fisheries Research Institute.
Orth, R.J., T.J.B. Carruthers, W.C. Dennison, C.M. Duarte, J.W. Fourqurean, K.L. Heck Jr., A.R. Hughes, G.A. Kendrick, W.J. Kenworthy, S. Olyarnik, F.T. Short, M. Waycott, and S.L. Williams. 2006. BioScience 56(12). pp. 987–996.
Pang, S.C. and A.H. Yong. 1995. A Baseline Study on the Occurrence of Harmful Algal Bloom Organisms in the Coastal Waters of Sarawak. In D. Watson, K.S. Ong, and G. Vigers, eds. ASEAN Criteria and Monitoring: Advances in Marine Environmental Management and Human Health Protection.. Proceedings of the ASEAN–Canada Midterm Technical Review Conference on Marine Science, 24–28 October 1994, Singapore. Vancouver: EVS Environment Consultants; and Singapore: National Science and Technology Board.
Partnerships in Environmental Management for the Seas of East Asia (PEMSEA). 2003. Sustainable Development Strategy for the Seas of East Asia: Regional Implementation of the World Summit on Sustainable Development Requirements for the Coasts and Oceans. Quezon City, Philippines.
Pilcher, N.J. 2008. A Network of Protected Areas to Safeguard Marine Turtles in the Sulu–Sulawesi Seascape. Quezon City, Philippines: Conservation International Philippines.
Pilcher, N.J., E.H. Chan, and K. Hiew. 2008. Battling the Direct Poaching of Sea Turtles in Southeast Asia. Site visit report to Hainan, [People’s Republic of] China. Marine Research Foundation, Sabah; Turtle Conservation Foundation; Terengganu: WWF-Malaysia.
Ponnampalam, L.S., J.H. Fairul Izmal, G. Minton, and A.J. Saifullah. 2010. Marine Mammals in Malaysia—Diversity, Threats, Conservation and Management. Specialist Paper for the National Ocean Policy of Malaysia.
Prime Minister’s Department. 2004. Integrated Coastal Zone Management Policy: Coastal Zone Environmental Report. Putrajaya: Economic Planning Unit, Prime Minister’s Department.
Same Energy, More Power106 References106
______. 2010. Economic Transformation Program: A Roadmap for Malaysia. Putrajaya: Performance Management and Delivery Unit, Prime Minister’s Department.
Rahman, R.A. and S. Surif. 1993. Metal Finishing Wastewater: Characteristics and Minimization. In B.G. Yeoh, M.N. Ramli, and K.W.P. Hiew. 1999. Marine Turtle Management, Conservation and Protection Programme in Malaysia. Report of the SEAFDEC–ASEAN Regional Workshop on Sea Turtle Conservation and Management. July. Kuala Terengganu, Malaysia.
Ranjith, M.W., N. De Silva, R.A. Rahman, S. Mustafa, and A.S. Cabanban. 1999. Ekspedisi Galaxea ’98. Universiti Malaysia Sabah.
Razmahwata, M.R. 2005. The Malaysian Oil and Gas Industry: An Overview. Jurutera. pp. 5–9. Selangor: Dimention Publishing Sdn Bhd.
ReefCheck Malaysia. 2009. Save Our Reefs: Treasures of Malaysia. Kuala Lumpur.
______. 2010a. Introduction: Why are Coral Reefs Important? In ReefCheck Malaysia Annual Report 2010. pp. 4–6. Kuala Lumpur.
______. 2010b. Annual Survey Report 2010. Kuala Lumpur.
Sabah Department of Fisheries. 2008. http://www.fishdept.sabah.gov.my/
Sabah Economic Development and Investment Authority. Build High-Margin Services Sector in Tourism and Logistics. In Sabah Development Corridor Blueprint, 2008–2025. Kota Kinabalu, Sabah.
Sabah Forestry Department. 2010. 2010 Annual Forestry Report. Kota Kinabulu.
______. 2010. Annual Report 2010: Mangrove Forest Management and Restoration, Sabah. Kota Kinabalu.
Seminoff, J.A. 2004. Chelonia mydas. Cited in IUCN 2010.IUCN Red List of Threatened Species. Version 2010.3. www.iucnredlist.org (accessed 20 October 2010).
Semporna Island Project. Resource Use Report Part 2: Mariculture. http://www.sempornaislandsproject.com/pages/publications/Resource%20Use%20Report%20pts%202%20-%205.pdf
Siow, K.T. and E.O. Moll. 1982. Status and Conservation of Estuarine and Sea Turtle in West Malaysian Waters. In K.A. Bjorndal, eds. Biology and Conservation of Sea Turtles Proceedings of the World Conference on Sea Turtle Conservation. Washington, DC: Smithsonian Institution Press.
Siwar, C., M.M. Alam, M.W. Murad, and A.Q. Al-amin. 2009. A review of the linkages between climate change, agricultural sustainability and poverty in Malaysia. International Review of Business Research Papers 5(6):309–321.
Southeast Asian Fisheries Development Centre (SEAFDEC). 2010. Fishery Governance Fact Sheets. http://www.fao.org/fishery/rfb/seafdec/en (accessed 18 March 2012).
Spait, M. 2001. Marine Park Management: Issues and Challenges. 6th SITE Research Seminar, 13–14 September 2001. Sabah Parks, Sabah.
Spergel, B. and M. Moye. 2004. Financing Marine Conservation: A Menu of Options. Washington, DC: WWF Center for Conservation Finance.
Causes of Underinvestment and Persistent Energy Inefficiency 107 References 107
Status of Coral Reefs in Southeast Asia. 2004. http://www.icriforum.org/sites/default/files/scr2004v1-all.pdf
Stehli, F.G. and J.W. Wells. 1971. Diversity and age patterns in hermatypic corals. Systematic Zoology 20:115–126.
Stobutzki, I.C., G.T. Silvestre, A. Abu Talib, A. Krongprom, M. Supongpan, P. Khemakorn, N. Armada, and L.R. Garces. 2006. Decline of Demersal Coastal Fisheries Resources in Three Developing Asian Countries. Fisheries Research. 78. pp. 130–142.
Sulu–Celebes Sea Sustainable Fisheries Management Project (SCS SFM). 2009. Request for CEO Endorsement/Approval, The GEF Trust Fund. http://www.thegef.org/gef/sites/thegef.org/files/repository/9-3-09%20GEFID%203524%20Regional%20-%20for%20web%20posting.pdf
Tan, K.H. 2005. Protection and Management of Mangroves in Malaysia: Meeting the Challenges. MIMA Bulletin. 12(2). pp. 6–10.
Tan, K.H. and H.P. Jurgenne. 2006. Conservation and Management of Mangroves in Southeast Asia. Proceedings of the International Conference and Exhibition on Mangroves and Indian and Western Pacific Oceans. Kuala Lumpur: Maritime Institute of Malaysia.
Terengganu Development Institute (TDI). 2006. Terengganu Coastal and Islands Study: Progress Report 1—Chapter 2: What is Terengganu Made of? Terengganu, Malaysia.
The Katoomba Group and United Nations Environment Programme. 2008. Payments for Ecosystem Services: Getting Started—A Primer, Forest Trends. Nairobi.
The Royal Society. 2007. Ocean Acidification Due to Increasing Atmospheric Carbon Dioxide. London. http://royalsociety.org/uploadedFiles/Royal_Society_Content/policy/publications/2005/9634.pdf
The Star Online. 2009. All round effort to protect turtles. 22 October. http://www.thestar.com.my/Story/?file=%2F2009%2F10%2F22%2Fsouthneast%2F4933254&sec=southneast
Timmers, M.A., K.R. Andrews, C.E. Bird, M.J. deMaintenton, R.E. Brainard, and R.J. Toonen. 2010. Widespread Dispersal of the Crown-of-Thorns Sea Star, Acanthaster planci, across the Hawaiian Archipelago and Johnston Atoll. Journal of Marine Biology. pp. 1–10.
Tisen, O.B. and J. Bali. 2000. Current Status of Marine Turtle Conservation Programmes in Sarawak, Malaysia. In A. Mosier, A. Foley, and B. Brost, eds. Proceedings of the Twentieth Annual Symposium on Sea Turtle Biology and Conservation, 2000. 29 February–4 March. Orlando, Florida: National Oceanic and Atmospheric Administration.
TRAFFIC Southeast Asia. 2009. Survey of Marine Turtle Egg Consumption and Trade in Malaysia. Petaling Jaya, Malaysia: TRAFFIC Southeast Asia for WWF-Malaysia.
Tse, P.K. 2011. Malaysia. In 2009 Minerals Yearbook. United States Geological Survey. http://minerals.usgs.gov/minerals/pubs/country/2011/myb3-2011-my.pdf
Tun, K., M.C. Loke, A. Cabanban, S.T. Vo, Philreefs, T. Yeemin, Suharsono, K. Sour, and D. Lane. 2004. Status of Coral Reefs, Coral Reef Monitoring and Management in Southeast Asia. In Status of Corals Reefs of the World 2004. pp. 235–275.
Tun, K., M.C. Loke, S.T. Vo, T. Yeemin, N. Phongsuwan, A.Y. Amri, N. Ho, K. Sour, N.V. Long, C. Nanola, D. Lane, and Y. Tuti. 2008. Status of Coral Reefs in Southeast Asia. In Status of Corals Reefs of the World 2008. pp. 131–144.
Same Energy, More Power108 References108
United Nations Development Programme. 2005. Malaysia: Achieving the Millennium Development Goals: Successes and Challenges. Kuala Lumpur: United Nations Development Programme Team.
______. 2010. Economics of Climate Change, Malaysia. http://www.undp.org.my/page.php?pid=163&action=preview&menu=main
United Nations Economic and Social Commission for Asia and the Pacific. 2000. Country Report of Malaysia. http://www.unescap.org/ttdw/Publications/TFS_pubs/Pub_2217/pub_2217_Malaysia.pdf
United Nations Environment Programme. 2008. National Reports on Seagrass. UNEP/GEF/SCS Technical Publication No. 12.
______. 2010. Assessment of Capacity Gaps and Needs of South-East Asia Countries in Addressing Impacts, Vulnerability and Adaptation to Climate Variability and Climate Change. Regional Climate Change Adaptation Knowledge Platform for Asia. Bangkok, Thailand.
______. 2011. Scoping Assessment on Climate Change Adaptation in Malaysia. Regional Climate Change Adaptation Knowledge Platform for Asia. Bangkok, Thailand.
United Nations Framework Convention on Climate Change (UNFCCC). 2011. Second National Communication to the UNFCCC: Malaysia, Ministry of Natural Resources and Environment, Putrajaya, Malaysia. http://unfccc.int/files/national_reports/non-annex_i_natcom/submitted_natcom/application/pdf/malaysia_snc.pdf
Valavi, H., A. Savari, V. Yavari, P. Kochanian, A. Safahieh, and O. Sedighi. 2010. Coral Reefs Anthropogenic Impact Bio-indicators in the Northern Part of the Persian Gulf. Journal of Fisheries and Aquatic Science. 5(2). pp. 70–81.
van Egmond, H.P. and H.J. van den Top. 1991. Worldwide Regulations for Marine Phycotoxins. In Proceedings of the Symposium on Marine Biotoxins, 30–31 January 1991. Centre National d’Etudes Vétérinaires et Alimentaires, Maisons-Alfort, France.
Veron, J.E.N. 2008. A Reef in Time.The Great Barrier Reef from Beginning to the End. London: Belknap Press of Harvard University Press.
Wang, S.F., D.L. Tang, F.L. He, et al. 2008. Hydrobiologia. v. 596. Springer International Publishing
Wong, P.P. 1991. Coastal Tourism in Southeast Asia. Education Series. 8. Manila: Association of Southeast Asian Nations/United States Coastal Resources Management Project.
Wong, I. 2011. Malaysia Latest Signatory to Conservation of Marine Turtles. The Borneo Post Online, Sabah. http://www.theborneopost.com/2011/09/25/malaysia-latest-signatory-to-conservation-of-marine-turtles/
Wood, A.K., N. Muhammad, C.S. Mahmood, Z. Ahmad,N.A.W. Shazili, A.T. Law, and R. Yaakob. 1993. Corer Sampling and the Use of Neutron Activating Analysis in Evaluating Pollution at the Juru Waterway, Penang. J. Sains Nuklear Malaysia. 11(2). pp. 105–128.
Wood, A.K., Z. Ahmad, N.A.W. Shazili, R. Yaakob, and R. Carpenter. 1997. Geochemistry of Sediments in Johor Straits between Malaysia and Singapore. Continental Shelf Research. 17(10). pp. 1,207–1,228.
Causes of Underinvestment and Persistent Energy Inefficiency 109 References 109
Wood, E.M. 2001. Collection of Coral Reef Fish for Aquaria: Global Trade, Conservation Issues and Management Strategies. London: Marine Conservation Society.
Workshop on Regional Cooperation to Address Direct Capture of Sea Turtles, 2009. Kuala Terengganu, Malaysia. June. http://www.ioseaturtles.org/feature_detail.php?id=288
Wu, R.S.S. 1995. The environmental impact of marine fish culture: Towards a sustainable future. Marine Pollution Bulletin 31: 159–166.
Yap, K.S., W.A.W. Hassan, F. Tangang, L. Juneng, M.K. Sammathuria, and K. Subramaniam. 2012. Climate Change Scenarios in Malaysia. Akademi Sains Malaysia Science Journal. 5(2).
Yeap, E.B. 1993. Tin and Gold Mineralisation in Peninsular Malaysia and their Relationships to the Tectonic Development. Journal of Southeast Asian Earth Sciences. 8. pp. 329–348.
Yeo, B.H. 1998. The Recreational Benefits of Coral Reefs: A Case Study of Pulau Payar Marine Park, Kedah, Malaysia. http://www.worldfishcenter.org/Pubs/coral_reef/pdf/section2-7.pdf
Yeoh, K.S., S.M. Chee, Z. Phang, A. Isa, M. Mohamed Idris, eds. 1993. Waste Management in Malaysia; Current Status and Prospect for Bioremediation. Kuala Lumpur: Ministry of Science, Technology and Innovation, Malaysia.
Yusuf, Y., Y.A. Affendi, B.H. Tajuddin, C. Lee, M.H. Idris, B. Mustapa, F.R. Rosman, and C.M. Lau. 2009. Marine Habitat Resources Study of Batuan Tengah (Middle Rocks), Johor, Malaysia. (Draft)
Zakaria, S. and A.J. Shaaban. 2007. Impact of Climate Change on Malaysia Water Resources. National Seminar on Socio-Economic Impact of Extreme Weather and Climate Change, organized by the Ministry of Science, Technology and Innovation. 21–22 June 2007. Putrajaya, Malaysia.
State of the Coral Triangle: Malaysia
Malaysia has made a firm commitment to sustainable management and conservation of its coastal and marine resources, helping formulate and implement the Sulu–Sulawesi Marine Ecoregion Initiative and the Coral Triangle Initiative. Rapid economic growth, uncontrolled tourism development, unregulated fishing, and unsustainable use of marine resources have depleted the country’s fish stocks, lost nearly 36% of its mangrove forests, and increased the number of endangered species. Despite impressive national economic gains, Malaysia’s fishers remain poor. This report assesses Malaysia’s coastal ecosystems and summarizes the country’s plans in (i) rehabilitating marine protected areas, (ii) protecting threatened and endangered species, (iii) adapting to the negative impacts of climate change, and (iv) responding to the need for financially sustainable, community-based initiatives.
About the Asian Development Bank
ADB’s vision is an Asia and Pacific region free of poverty. Its mission is to help its developing member countries reduce poverty and improve the quality of life of their people. Despite the region’s many successes, it remains home to approximately two-thirds of the world’s poor: 1.6 billion people who live on less than $2 a day, with 733 million struggling on less than $1.25 a day. ADB is committed to reducing poverty through inclusive economic growth, environmentally sustainable growth, and regional integration.
Based in Manila, ADB is owned by 67 members, including 48 from the region. Its main instruments for helping its developing member countries are policy dialogue, loans, equity investments, guarantees, grants, and technical assistance.
Asian Development Bank6 ADB Avenue, Mandaluyong City1550 Metro Manila, Philippineswww.adb.org
Printed on recycled paper
STATE OF THE CORAL TRIANGLE:Malaysia
Printed in the Philippines