state of the bangladesh economy - united...
TRANSCRIPT

State of the Bangladesh Economy Early Signals of FY2005
(First Reading)
A paper prepared under the programme Independent Review of Bangladesh’s Development (IRBD)
implemented by the Centre for Policy Dialogue (CPD)
January 15, 2005
B A N G L A D E S H CENTRE FOR POLICY DIALOGUE (CPD)
a c i v i l s o c i e t y t h i n k - t a n k House 40C, Road 11, Dhanmondi R/A, Dhaka-1209
Tel: 9141734, 9141703, 9145090; Fax: 8130951 E-mail: [email protected]; Website: www.cpd-bangladesh.org

CPD: IRBD FY05 (First Interim) ii
Credit
Dr. Debapriya Bhattacharya, Executive Director, Centre for Policy Dialogue (CPD) was in overall charge of preparing this report. Drafts on various sections were prepared by Professor Mustafizur Rahman, Research Director, CPD (External Sector and MFA Phase-out), Dr. Ananya Raihan, Research Fellow, CPD (Banking Sector and Exchange Rate), Dr. Uttam Kumar Deb, Research Fellow, CPD (Agriculture Situation; Food Security; and PRSP), Dr. Fahmida Khatun, Research Fellow, CPD (Assessment of Flood 2004), Dr. Khondaker Golam Moazzem, Research Fellow, CPD (Investment Scenario in the Private Sector), and Mr. M. Syeed Ahamed, Senior Research Associate, CPD (Macroeconomic Trends). Database development and analysis were carried out by Mr. Mabroor Mahmood, Senior Research Associate (Banking Sector), Mr. Noor Mohammad Wasi Uddin, Research Associate, CPD (Macroeconomic Trends), Mr. Wasel Bin Shadat, Research Associate, CPD (Flood Assessment), Mr. Kazi Mahmudur Rahman, Research Associate, CPD (Investment Scenario), Mr. Syed
Saifuddin Hossain, Research Associate, CPD (Flood Assessment), Mr. Md. Masum Billah, System Analyst, CPD (Agriculture Situation and Food Security), Mr. Asif Anwar, Programme Associate, CPD (Flood Assessment), Ms. Farhana Rahman, Programme Associate, CPD (Banking Sector and Exchange Rate), Mr. Narayan Chandra Das, Programme Associate, CPD (Agriculture Situation and Food Security), Mr. Shubhasish Barua, Programme Associate, CPD (Exchange Rate and Investment).

CPD: IRBD FY05 (First Interim) iii
Expert Group Meeting on
CPD-IRBD 2005 (Interim)
As part of the CPD-IRBD tradition, CPD organised an Expert Group Consultation Meetings on
January 12, 2005 at the CPD Dialogue Room. The First Interim Report on the State of the
Bangladesh Economy: Early Signals of FY2005 was shared at this in-house meeting with a
distinguished group of policymakers and professionals with direct exposure to macroeconomic
policy crafting in the country. Professor Rehman Sobhan, Chairman, CPD chaired the session.
CPD-IRBD Research Team acknowledges the participants for sharing their views and comments
on the draft report. However, CPD is solely responsible for the observations and analysis made in
this paper.
A list of the participants of the meeting is provided below in alphabetical order:
Dr Q K Ahmad President, Bangladesh Unnayan Parishad (BUP) Dr. Quazi Mesbahuddin Ahmed Member (GED), Planning Commission Professor Amirul Islam Chowdhury Former Vice Chancellor, Jahangirnagar University and Former Chairman, Sonali Bank Dr. Mirza Azizul Islam Chairman, Securities and Exchange Commission Mr. M. Hafizuddin Khan Former Finance Advisor to the Caretaker Government and
Chairman, Public Expenditure Review Commission Professor Wahiduddin Mahmud Former Finance Advisor to the Caretaker Government and Professor, Economics Department, University of Dhaka
Dr. A.K.M. Masihur Rahman Former Secretary, ERD, Ministry of Finance Mr. Mustafizur Rahman Former Chairman, Revenue Reform Commission and
Director, Far-East Finance and Investment Dr. Quazi Shahabuddin Director General, Bangladesh Institute of
Development Studies (BIDS)
Mr. M. Syeduzzaman Former Finance Minister and Chairman, Bank Asia
CPD: IRBD FY05 (First Interim) iv
Acronyms
ADB - Asian Development Bank
ADP - Annual Development Programme
BB - Bangladesh Bank
BBS - Bangladesh Bureau of Statistics
BOI - Board of Investment
BTTB - Bangladesh Telegraph and Telephone Board
CDBL - Central Depository Bangladesh Limited
CPI - Consumer Price Index
EPZ - Export Processing Zone
FCB - Foreign Commercial Bank
FDI - Foreign Direct Investment
FFW - Food for Work
Forex - Foreign Exchange
GDP - Gross Domestic Product
GNI - Gross National Income
GOB - Government of Bangladesh
GSP - Generalized System of Preferences
HYV - High Yielding Variety
ICMA - Institute of Cost and Management Accountants
IMF - International Monetary Fund
IPO - Initial Public Offering
IPRSP - Interim Poverty Reduction Strategy Paper
LC - Letter of Credit
MFA - Multi Fibre arrangement
MGD - Millennium Development Goal
MOFDM- Ministry of Food and Disaster Management
MTMF - Medium Term Macroeconomic Framework
NCB - Nationalized Commercial Bank

CPD: IRBD FY05 (First Interim) v
NER - Nominal Exchange Rate
NGO - Government of Bangladesh
NSD - National Savings Deposit
OMS - Open Market Sale
PCB - Private Commercial Bank
PRSP - Poverty Reduction Strategy Paper
REER - Real Effective Exchange Rate RTA - Regional Trading Agreement
SEC - Securities and Exchange Commission
SME - Small and Medium Enterprise
VAT - Value Added Tax
VGD - Vulnerable Group Development
VGF - Vulnerable Group Feeding

CPD: IRBD FY05 (First Interim) vi
Table of Content
I. INTRODUCTION 1
PART A II. GROWTH, SAVINGS AND INVESTMENT 3
2.1 Economic Growth Trend Decelerates? 3 2.2 Sources of Growth – Service Sector Dominated 5 2.3 Per-capita Income 6 2.4 Inadequate Savings-Investment to Accelerate Growth 7
III. STATE OF THE FISCAL SECTOR 12
3.1 Revenue Receipts 12 3.2 Public Expenditure 15
IV. STATE OF THE MONETARY SECTOR 19
4.1 Domestic Credit Expansion 19 4.2 Government Borrowing and Public Debt 21 4.3 Agricultural Credit 23 4.4 Industrial Credit 24 4.5 Price and Wage Inflation 26
V. STATE OF THE REAL SECTOR 32
5.1 Agricultural Production 32 5.2 Industrial Production 34 5.3 Foreign Investment 36 5.4 Capital Market 39
VI. STATE OF THE EXTERNAL SECTOR 43 6.1 Export Likely to Survive the Phasing out of MFA 43 6.2 Import Sees Robust Growth Especially in Investment Items 48 6.3 Opening and Settlement of Import LCs 50 6.4 Balance of Payments Regimented 53 6.5 Flow of Remittance Continuing Escalation 55 6.6 Forex Reserves Continues to Swell 57 6.7 Foreign Aid Failed to Supplement Growth Instruments 59

CPD: IRBD FY05 (First Interim) vii
PART B VII. ASSESSMENT OF FLOOD 2004 63
7.1 Background 63 7.2 Damage Assessment 64 7.3 Relief and Rehabilitation 66 7.4 CPD’s Recommendations and GOB Initiatives 67
VIII. MFA PHASE-OUT: EARLY INDICATIONS AND CHALLENGES AHEAD IN FY2005 73
8.1 So Far So Good! 73 8.2 Post-MFA Scenario Will be Different 75
8.3 Designing an Appropriate Strategy 77
IX. INVESTMENT SCENARIO IN THE PRIVATE SECTOR 80 9.1.1 Major Advances to a Limited Number of Large and
Medium Industries 80 9.1.2 Sluggish Trend of Investment in Capital Market 83
9.2 Slow Rise of Industrial Consumption of Energy 84 9.3 More Promises of FDIs 85 9.4 Investment in the Interim Period—Concentration in a Limited Number of Large and Medium Industries 86
X. NCBs REFORM: WHERE DOES IT STANDS 88 10.1 Reform Agenda 88 10.2 Reform Process 91 10.3 Consequences 95
XI. PRICES OF ESSENTIAL COMMODITIES, INCREASE IN DIESEL PRICE AND FOOD SECURITY 102 11.1 Price Surge of Essential Commodities 102 11.2 Trends in Import of Foodgrains 106 11.3 Monga in Northern Districts 108 11.4 Increase in Diesel Price 111 11.5 Implications for Food Security 112
XII. INFLUENCE OF EXCHANGE RATE MOVEMENTS ON EXPORT
PERFORMANCE OF BANGLADESH 113 12.1 Exchange Rate Behaviour: Is there Any Significant Change Since Floating Mechanism? 113 12.2 Export Performance of Bangladesh: Does Exchange Rate Matter? 116 XIII. PRSP AND IPRSP: A COMPARISON OF MEDIUM TERM
MACROECONOMIC FRAMEWORK 119 13.1 Targets for Economic Growth and Money Supply 119 13.2 Government Revenue and Public Expenditure 121 13.3 Balance of Payments 122 13.4 Conclusion 124
XIV. CONCLUDING BALANCE SHEET 124

CPD: IRBD FY05 (First Interim) viii
LIST OF TABLES
Table 1: Savings/Investment Scenario FY04-FY05
Table 2: Comparison of Inflation in India, Pakistan and Bangladesh
Table 3: Summary of CPD’s Damage Estimates
Table 4: Comparison of Preliminary Damage Estimates
Table 5: Comparison of CPD’s Recommendations and GOB Implementation
Table 6: Advances Classified by Economic Purposes (Major Manufacturing and Service Sectors)
Table 7: Capital Machinery and Industrial Raw Materials Imported for Manufacturing and Service Industries
Table 8: Initial Public Offering (IPO) for July-November, FY2004 and FY2005
Table 9: Industrial Consumption of GAS and Electricity
Table 10: Prospective FDIs in Bangladesh by Selected Countries
Table 11: State-Owned Bank Assets as a Percentage of Total Bank Assets
Table 12: Scenario of Manpower Restructuring, Data as of June, 2004
Table 13: Import of Rice (Aid/Commercial/Private) in Bangladesh, 2001/02-2004/05
Table 14: Targets for Economic Growth in IPRSP and PRSP
Table 15: Targets for Money Supply (Percent Change in Money and Credit) in IPRSP and PRSP
Table 16: Targets for Government Revenue and Public Expenditure as Percent of GDP in IPRSP and PRSP
Table 17: Targets for Balance of Payments in IPRSP and PRSP
Annex Table 1: State-Ownership vs. Banking Performance in Selected Countries
Annex Table 2: Comparatives Picture of Commercial Banks’ Performance
LIST OF FIGURES
Figure 1: Trend in GDP Growths
Figure 2: Periodic Linear Growth Rates of GDP
Figure 3: GDP Growth of Selected South Asian Countries
Figure 4: Incremental Growth of Sectors ofGDP: FY91-04
Figure 5: Savings as Percent of GDP during FY91-FY04
Figure 6: Investment as Percent of GDP during FY91-FY04

CPD: IRBD FY05 (First Interim) ix
Figure 7: Savings-Investment Gap as Percent of GDP
Figure 8: Revenue-GDP Ratio in Bangladesh
Figure 9: Revenue-GDp Ratio in Bangladesh (Linear and Average)
Figure 10: Revenue Earnings During FY91-FY05
Figure 11: VAT vs Income Tax During FY91-FY05
Figure 12: Taka Release and Expenditure of ADP During the 1st Quarter of FY02-FY05
Figure 13: Target ADP and Actual Implementation During FY02-FY05 (1st Quarter)
Figure 14: Performance of Major Ministries (in terms of ADP Allocation)
Figure 15: Domestic Credit Expansion During July-October FY01 to FY05
Figure 16: Growths in Domestic Credit During July-October FY01 to FY05
Figure 17: Private Sector Share in Domestic Credit During Jul-Oct FY01 to FY05
Figure 18: Growth of Net Government Borrowing During July-October FY05 (point-to-point)
Figure 19: Sale and Repayment of NSD Certificate
Figure 20: Growths in Agricultural Credit Expansion During July-October FY05
Figure 21: Term Loan for the FY04 and FY05
Figure 22: Working Capital for the FY04 and FY05
Figure 23: Inflation (moving Average)
Figure 24: Food Inflation (Point to Point)
Figure 25: Wage Inflation (Point to Point)
Figure 26: Comparison among India, Pakistan and Bangladesh
Figure 27: Inflation During the Flood Year 1998
Figure 28: Growths of Major Industries During July to October of FY04 and FY05
Figure 29: Quantum Index of Production during FY03-05 (1988-89=100)
Figure 30: Foreign Investment During FY00-FY04
Figure 31: Foreign Investment During July-September of FY04-05
Figure 32: FDI Flow: Survey and Banking Data
Figure 33: Sectoral Composition of Registered FDI in FY04
Figure 34: Entry of IPOs in the Capital Market (Monthly Statistics)
Figure 35: Structure of Exports during July-October FY04-05

CPD: IRBD FY05 (First Interim) x
Figure 36: Sectoral Growth of Exports during July-October FY05
Figure 37: Monthly Dynamics of Export Earnings During FY01-05 (Jul-Oct)
Figure 38: Decomposition of Export Growth for July-October FY05
Figure 39: Export and Import during FY91-FY04
Figure 40: Imports and Sectoral Growth during the First Quarter of FY01-05
Figure 41: Sectoral Growth of Imports during the First Quarter of FY05 Figure 42: Settlement of LCs during July to November of FY04 and FY05
Figure 43: Fresh Opening of LCs during July to November of FY04 and FY05
Figure 44: Growth Rates of Opening and Settlement of LCs FY05 over FY04 (July to November)
Figure 45: Balance of Payments FY97 to FY04
Figure 46: Balance of Payment Scenario During Jul-Sep in FY04-05
Figure 47: Flow of Remittances During Jul-Dec in FY01-FY05
Figure 48: Monthly Trend in the Flow of Remittances During FY04-FY05 Figure 49: Remittances and Foreign Exchanges Reserve: FY91 to FY04
Figure 50: Foreign Exchange Reserves and Equivalent Months of Import
Figure 51: Decomposition of Sources of Import Financing
Figure 52: Flow of Foreign Aid in Bangladesh During FY90-04
Figure 53: Flow of Foreign Aid During July to October of FY04-05
Figure 54: Declining Foreign Aid in the Context of Stagnated Domestic Savings
Figure 55: Global Export of Knit and Woven RMG and their Growth
Figure 56: Bangladesh’s Export of Apparels (Jul-Oct): FY05 vs FY04
Figure 57: Changes in Market Share (Assets) of Commercial Banks in Bangladesh
Figure 58: Incremental Share of Market by Commercial Banks, 1996:2004
Figure 59: Comparative Geographical Distribution of Branches of Commercial Banks
Figure 60: Average Wholesale Price of Coarse Rice in Bangladesh: FY01-FY05
Figure 61: Comparison of Domestic Prices of Rice with Import Partly Price: FY00-FY05
Figure 62: Rice Prices and Quantity of Private Rice Imports in Bangladesh, 1999-2004 Figure 63: Distribution of Foodgrains through FFW and VGD: 1998/89-2004/05
Figure 64: Depreciation of Some Selected Currencies, Base Period June 2000

CPD: IRBD FY05 (First Interim) xi
Figure 65: Comparative Movement of Euro-USD Cross Rate in Bangladesh and Global Euro-USD Rates, Monthly Average
Figure 66: Movement of EURO-USD Global Exchange Rate and EURO-USD Cross Rate, November 2004 – January 10, 2005
Figure 67: Depreciation of Some Selected Currencies, Base Period June 2000 LIST OF BOXES Box 1: An Enquiry in Factors Influencing Inflation
Box 2: A Balance Sheet of Bangladesh Economy Box 3: Major Findings of the Thematic Issues
I. INTRODUCTION
The first reading of the Independent Review of Bangladesh’s Economy for 2004-05
(FY05) essentially covers the first six months (July-December 2004) of the fiscal year.
The review, drawing on official data, has been presented in two analytical components.
The first component (Part A) provides a macro-economic overview focussing on the
following four major areas.
(i) Growth, Saving and Investment (ii) Monetary Sector (iii) Real Economy (iv) External Sector
Recognising the relative stability prevailing in the macro-economic situation, the review
highlights some sources of its fragility. It raises the question whether the macro-
economic stability of Bangladesh has been rewarded with adequate growth payoff. The
review underscores the negative implications of the creeping rise in consumer price index
in the backdrop of perceptible credit expansion in both manufacturing and agricultural
sector. In the real economy, shortfall in foodgrain production remains the major concern,
while capital market has been attracting increased liquidity. The external sector balance is
experiencing consolidation, notwithstanding the total phase-out of the apparel quota.
The second component (Part B) of the review addresses a select set of issues which
would underpin the final outcomes of FY04. These issues are the following:
(i) Consequences of Flood 2004
(ii) Impact of MFA Phase-out
(iii) Trends in Industrial Investment
(iv) NCB Reforms
(v) Exchange Rate Movement
(vi) Price Rise of Essentials
(vii) Finalisation of PRSP
CPD: IRBD FY05 (First Interim) 1

CPD: IRBD FY05 (First Interim) 2
PART A

CPD: IRBD FY05 (First Interim) 3
II. GROWTH, SAVINGS AND INVESTMENT
2.1 Economic Growth Momentum Decelerates?
Following a decline of the GDP growth rate to 4.2 percent in FY02, the national economy
repositioned itself in a five percent plus growth trajectory during the subsequent two
years (FY03 and FY04). The economy posted a growth of 5.5 percent in FY04 in line
with the I-PRSP target; however such marginal improvement in economic growth rate
compares unfavourably with the record figure of 5.9 percent achieved in FY00.
The recently finalised national PRSP provides a set of growth targets which has revised
downward the figure for FY05 from 6.0 percent to 5.5 percent. PRSP has fixed the GDP
growth targets at 6.0 percent and 6.5 percent for FY06 and FY07 respectively.
Figure 1
Trend in GDP Growths
Source: Computed from Finance Division (2004c) and ERD (2003) Note: * PRSP Targets.
It is known that the Bangladesh economy has been experiencing five percent plus growth
rate during the past few years. However, when compared with the trend growth rates of
1990s, one can notice a deceleration of national growth rates. The GDP grew at faster
rate during the 1990s (4.6 percent linear growth) in comparison to 1980s (3.6 percent
linear growth). Within 1990s, the growth momentum was even higher during the second
half of the decade in comparison to the first half. The linear growth rate of GDP during

CPD: IRBD FY05 (First Interim) 4
the period of FY91-95 was 3.95 percent, while during the next five year (FY96-00) it
grew at even a faster rate of 4.79 percent. However, taking into account the PRSP target
growth of FY05 (5.5 percent), the economy during the FY01-05 is programmed at a
linear growth rate of 4.88 percent, indicating a stagnation in its second derivative.
Figure 2 Periodic Linear Growth Rates of GDP
0
1
2
3
4
5
6
FY81-85 FY86-90 FY91-95 FY96-00 FY01-05*
perc
ent
Note: * GDP growth for FY05 is based on PRSP Target.
Figure 3 GDP Growth Rate of Selected South Asian Countries
1.8
6.5
4.4
5.8
4.0
8.1
-1.4
7
5.3
4.4
5.5 5.56.4 6.5
6.5
-2.0
0.0
2.0
4.0
6.0
8.0
10.0
FY01 FY02 FY03 FY04 FY05
GD
P gr
owth
(per
cent
)
Pakistan
Sri Lanka
Bangladesh
India

CPD: IRBD FY05 (First Interim) 5
At the same time, when compared with the major countries in the South Asia region, the
growth scenario looks moderate for Bangladesh. The GDP growth rates of India (8.1
percent), Pakistan (6.4 percent) and Sri Lanka (6.5 percent) have been higher in FY04
than that of Bangladesh (5.5 percent). The GDP growth target for FY05 also appears to
be restrained when compared with other South Asian countries as India, Pakistan and Sri
Lanka have targeted growth targets for FY05 at 6.5 percent, 6.5 percent and 7 percent
respectively. During the first quarter of FY05, India has already achieved a 7.4 percent
growth.
2.2 Sources of Growth – Service Sector Dominated
The contribution of the real economic sectors to incremental growth has declined to 32.97
percent in FY04 from 34.40 percent in FY03. The annual growth of the real economic
sector stagnated at 4.60 percent during the last two fiscal years (FY03-04). This is largely
because of decline in the incremental growth of agriculture sector, which went from
13.30 percent in FY03 to 11.00 percent in FY04. The incremental growth of the service
sector has increased to 51.02 percent in FY04 from 49.87 percent in FY03 (see figure 4).
Figure 4
Incremental Growth of Sectors of GDP: FY91-04
-10.00
0.00
10.00
20.00
30.00
40.00
50.00
60.00
70.00
FY91
FY92
FY93
FY94
FY95
FY96
FY97
FY98
FY99
FY00
FY01
FY02
FY03
FY04
Agriculture Industry Service
Source: Computed from CPD (2004)

CPD: IRBD FY05 (First Interim) 6
The on-going structural transformation of the Bangladesh economy is characterised by
falling share of the agriculture sector with marginal increase of the manufacturing in the
backdrop of increasing contribution of the service sector. The share of service sector has
increased to 61.27 percent in FY04 from 60.95 percent in FY03. The real economic
sector accounted for 39.00 percent of the GDP in FY03, which has decreased to 38.70
percent in FY04. A decade back, the said proportion was 42.00 percent. This suggests
that in spite of improved growth, the evolution of the Bangladesh economy remains
biased against modern, industrial transformation, having concomitant implications for
sustained growth and equitable income distribution.
2.3 Per-capita Income
The per capita GDP and GNI scenario are gradually improving after a decline in FY02. In
FY03 the per capita GDP and GNI was recorded to be US$389 and US$411 respectively.
In FY04 the corresponding figures are US$421 and US$444 respectively. The annual
growth is of 8.23 percent for per capita GDP and 8.03 percent for per capita GNI in terms
of US dollars. Once we adjust these figures by the extent of devaluation of US Dollar, the
per capita GDP growth comes down to 5.3 percent.
It is well known that poverty trends are influenced by the changes in inequality. Income
inequality at the national level has increased from 25.9 percent in 1991-92 to 30.6 percent
in 2000. During the same period, urban inequality was rising at a higher pace- from 30.7
percent in 1991-92 to 36.8 percent in 2000, than rural inequality- from 24.3 percent in
1991-92 to 27.1 percent in 2000 (BBS, 2003).
Between 1995-96 and 2000, national income attributable to the poorest 10 percent of the
population declined further from the miniscule proportion of 2.24 percent to 1.84 percent.
Conversely, the control on the national income by the richest 10 percent of the population
increased from 34.68 percent to 40.72 percent (ibid). In other words, the income
differential between the poorest and the richest increased from 35.7 times to 53.4 times
during the second half of 1990s. The sources of rising inequality are linked with the
uneven spread of economic and social opportunities, unequal distribution of assets

CPD: IRBD FY05 (First Interim) 7
especially in respect of human capital and financial capital, growing disparity between
urban and rural areas as well as between developed and underdeveloped areas.
The IRBD2003 opined that the incremental growth does not automatically benefit the
poor in Bangladesh (Bhattacharya, 2004). In this context and also in connection with the
completion of the initial year of the I-PRSP, we have not been provided with any
assessment on the poverty situation. There is no evidence which suggests that this trend
has been reversed during the last couple of years. Absence of such an assessment also
fails us to benchmark our programmes regarding MDGs.
2.4 Inadequate Savings-Investment to Accelerate Growth
The deceleration of Bangladesh’s national growth can be substantiated by the stagnated
savings-investment scenario. Recent growth models1 predicts that higher savings and the
related increase in capital accumulation can result in a permanent increase in growth rates
as savings determine the national capacity to invest and thus to produce, which in turn
affect the economic growth potential. On the contrary, low saving rates have been cited
as one of the most serious constraints to sustainable economic growth.
In this context, Bangladesh’s savings-investment scenario is showing a rather stagnant
trend during last few years. Domestic savings has increased marginally to 18.27 percent
of the GDP in FY04 from 18.21 percent in FY03. The share of national savings to GDP
has also showed signs of stagnation in FY04 at 24.49 percent of GDP against 24.45
percent in FY03. Though the national savings rate projected in the I-PRSP document for
FY04 (23.3 percent) was achieved (thanks to our NRBs for their remittances), the
projected domestic savings rate for FY04 (19.0 percent) was not achieved (see table 1).
1 Notion supported by the empirical works of Romer (1986), Lucas (1988), Barro (1991), De Long and Summers (1991).

CPD: IRBD FY05 (First Interim) 8
TABLE 1
SAVINGS/INVESTMENT SCENARIO FY04-FY05
FY04 IPRSP Actual
Deviation from IPRSP
I-PRSP FY05
Gross Domestic Savings 19.20 18.27 - 0.93 20.00 Gross National Savings 24.30 24.49 + 0.19 25.20 Gross Investment 25.40 23.58 - 1.82 27.00
(24.20 in PRSP)
Private 18.70 17.47 - 1.23 19.90 Public 6.70 6.12 -0.58 7.10
Source: Computed from Finance Division (2004c) and ERD (2003)
On the other hand, during the last five years (FY00-FY04), the gross investment ratio has
increased by only 0.50 percent of the GDP. For example, the ratio was 23.02 percent in
FY00; whilst it crawled only up to 23.58 percent in FY04. Increasing investment
continues to remain one of the core challenges of Bangladesh’s macro-economy. In
FY04, the country recorded the lowest public investment ratio of the last 14 years, 6.12
percent. The sectors left behind by public investment were not adequately picked up by
private investment. Private investment as a share of GDP increased marginally from
17.21 percent in FY03 to 17.47 percent in FY04. In this context, the new PRSP has
stepped back from forecasting any savings target for the next fiscal year. The only target
available is for gross investment which is set at 24.20 percent of GDP. This is far below
the target of IPRSP which was set at 27.0 percent and does not hold the aim to overcome
the existing investment stagnation soon.

CPD: IRBD FY05 (First Interim) 9
0
5
10
15
20
25
30
FY91
FY92
FY93
FY94
FY95
FY96
FY97
FY98
FY99
FY00
FY01
FY02
FY03
FY04
FY05
*
FY06
*
as p
erce
nt o
f GDP
Gross National Savings
Gross Domestic Savings
0
5
10
15
20
25
30
35
FY91
FY92
FY93
FY94
FY95
FY96
FY97
FY98
FY99
FY00
FY01
FY02
FY03
FY04
FY05
*
FY06
*
FY07
*
as p
erce
nt o
f GDP
Public Investment
Private Investment
Gross Investment
Figure 5
Savings as percent of GDP during FY 91-FY04
Note: * Targets for FY05 and FY06 are based on I-PRSP
Figure 6 Investment as percent of GDP during FY 91-FY04
Note: * Gross Investment target for FY05-FY07 is based on PRSP.
The breakdown of investment target (private and public) for FY05-FY06 is based on I-PRSP.

CPD: IRBD FY05 (First Interim) 10
Paradoxically, Bangladesh continues to remain an under-invested country, while its
national savings rate (24.49 percent) supposes its gross investment rate (23.58 percent).
After the late 1990s, when the savings and investment were almost equal, Bangladesh
experienced a net resource gap during FY01 (-0.77 percent) and FY02 (-0.72 percent).
Then the idle resource (i.e., excess savings as regard to investment as a ratio of GDP)
started climbing up.
Figure 7 Savings-Investment Gap as percent of GDP
-1
-0.5
0
0.5
1
1.5
2
2.5
3
FY91
FY92
FY93
FY94
FY95
FY96
FY97
FY98
FY99
FY00
FY01
FY02
FY03
FY04
The idle resource stood at 1.0 percent in FY03 and then with a marginal decline stood at
0.9 percent in FY04 as both investment and savings increased (or rather remained idle)
by the same factor. We are failing to convert all our savings into investment as we
continue to borrow from foreign sources.
Bangladesh needs to pay special attention to encourage savings and to create
opportunities for investment. In the context of low bank and NSD interest rates,
government needs to encourage savings by increasing variety of savings products, e.g.
promotion of other form of savings such as life insurance, provident funds, mutual funds,
investment in the stock market etc.

CPD: IRBD FY05 (First Interim) 11
At the same time, opportunities to invest this savings also needed to be broadened.
Savings is not an unconditional panacea for growth. Coherent and consistent long-term
policy to encourage investment in a stable socio-political and economic environment is a
prerequisite for this growth and development. The absorptive capacity, which is in many
ways constrained by the institutional bottlenecks and lack of profitable investment
opportunities, is also important for a transitional economy like Bangladesh. Otherwise
this excess liquidity of savings will end up with obvious consumption or even flight of
capital!2
In this context it can be mentioned that Bangladesh has experienced a major shift in her
consumption pattern during the last four fiscal years. While in the private sector the
consumption as percent of GDP has decreased from 77.5 percent in FY01 to 76.3 percent
in FY04, the propensity to consume has increased in the public sector, from 4.5 percent in
FY01 to 5.4 percent in FY04 (as percent of GDP).
2 CPD-GCR survey reveals that overseas investment by the entrepreneur of this investment-starved country is increasingly becoming a reality, while NRBs are not investing in Bangladesh as much as we want them to.

CPD: IRBD FY05 (First Interim) 12
0
2
4
6
8
10
12
14
FY91
FY92
FY93
FY94
FY95
FY96
FY97
FY98
FY99
FY00
FY01
FY02
FY03
FY04
FY05
*
FY06
*
FY07
*
Tax-
GDP
Rat
io (p
erce
nt)
III. STATE OF THE FISCAL SECTOR 3.1 Revenue Receipts Inefficient and inadequate revenue mobilisation has been a major weakness for
Bangladesh’s fiscal sector. The historically low revenue-GDP ratio of Bangladesh
experienced a marginal upsurge during the FY00-FY04, when the revenue-GDP ratio
increased from 9.0 percent in FY00 to 10.8 percent in FY04. The periodic average of
revenue-GDP ratio increased from 8.45 percent in FY91-95 to 10.20 percent in FY01-04
percent. According to the PRSP target the revenue-GDP ratio will decline to 10.7 percent
in FY05. The sluggish trend in revenue collection during the first four months of FY05
substantiates this decline in revenue-GDP ratio.
Figure 8
Revenue-GDP Ratio in Bangladesh
The PRSP has set a very defensive set of targets for revenue-GDP ratio for FY06 (11.2
percent) and FY07 (11.7 percent), which is still low when compared with other South
Asian countries. This low tax-to-GDP ratio indicates the inefficiency of Bangladesh’s tax
system in financing public services and redistributing income3.
3 Assuming that increases in a country's tax-to-GDP ratio often indicate a greater provision of tax-financed services and/or a greater redistributive role of the tax system.

CPD: IRBD FY05 (First Interim) 13
0
2
4
6
8
10
12
FY91-95 FY96-00 FY01-04 FY05-07*
Reve
nue-
GDP
ratio
(per
cent
)
Revenue-GDP Ratio (linear)
Revenue-GDP Ratio (period average)
Figure 9 Revenue-GDP Ratio in Bangladesh (Linear and Average)
Note: * Figures for FY05-07 are based on PRSP target
Latest available figure shows a modest revenue growth by the National Board of Revenue
(NBR) as it registered a 9.52 percent growth during the first four months of FY05 over
the corresponding figure of the previous fiscal year. During this period (July-October)
tax as percent of GDP has increased slightly, from 2.24 percent in FY04 to 2.26 percent
in FY05. During the July-October period of FY05, total import related revenue has
increased by about 6.46 percent while total internal trade related revenue registered a
robust 12.06 percent growth. Though import related supplementary duty showed a
marginal negative growth (-0.17 percent), supplementary duty at the local level registered
a moderate 10.43 percent growth during the period under reporting. Among others, VAT
(local), VAT (import) and income tax increased by about 13.94 percent, 12.52 percent
and 16.72 percent respectively. The encouraging point to be noted that during this July-
October period, the share of direct tax (income tax) has increased from 14.24 percent in
FY04 to 15.17 percent in FY05. However this share of direct tax is still appallingly low
and there is an urgent need for a shift in the composition of revenues away from tax on
goods and services towards direct taxes on income and profit. It is to be noted that the
NBR component covers more then three quarter of the total revenue income and the

CPD: IRBD FY05 (First Interim) 14
0
5000
10000
15000
20000
25000
30000
35000
40000
45000
FY91
FY92
FY93
FY94
FY95
FY96
FY97
FY98
FY99
FY00
FY01
FY02
FY03
FY04
FY05
*
Reve
nue
Earn
ings
(cro
re T
k)
0
5
10
15
20
25
Ann
ual G
row
th (p
erce
nt)
Non-Tax RevenueTax RevenueAnnual Growth
0.0
0.5
1.0
1.5
2.0
2.5
3.0
3.5
FY91
FY92
FY93
FY94
FY95
FY96
FY97
FY98
FY99
FY00
FY01
FY02
FY03
FY04
FY05
*
perc
ent o
f GDP
VAT as percent of GDPTrend Line
overall growth observed in the revenue is mainly the contribution of this NBR part, while
other parts (non-NBR tax and non-tax) of revenue sources remains stagnant.
Figure 10
Revenue Earnings During FY91-FY05
Note: * Target for FY05
Figure 11 VAT vs Income Tax During FY91-FY05
Note: * Target for FY05

CPD: IRBD FY05 (First Interim) 15
In the context of a declining trend in public investment and stagnated savings-investment
scenario at the national level, the major challenge remains for Bangladesh’s fiscal policy
is to strengthen the effort to mobilise domestic resources to generate a larger share of
resources for investment. Reformation of the tax management and providing right
incentives to stimulate domestic savings is essential to achieve this goal.
3.2 Public Expenditure
Annual Development Programme
The size of the Annual Development Programme (ADP) for FY05 has been fixed at Tk
22000 crores, which is 15.78 percent higher than that the revised ADP of FY04 and about
30.31 higher than the actual implemented ADP of FY04. While only 83 percent of the
original size of the ADP i.e. 89 percent of the revised size was implemented during the
FY04, questions were raised regarding rationale of fixing such an ambitious target.
However, CPD in its post-budget reflection pointed out that this so-called ambitious ADP
target needs to be seen from the perspective that Bangladesh remains an under invested
economy and as such a large ADP target is worth chasing for. Thus, implementation of a
fuller ADP became the major challenge, than targeting a bigger ADP. The second aspect,
which needs to be underscored in this respect, is that the issue of quality is no less
important than the question of size of the ADP.
The ADP for FY05 took some steps decrease the number of projects, which has been
slashed down from 1163 in FY04 to 869 in FY05 including about 150 new projects.
CPD: IRBD FY05 (First Interim) 16
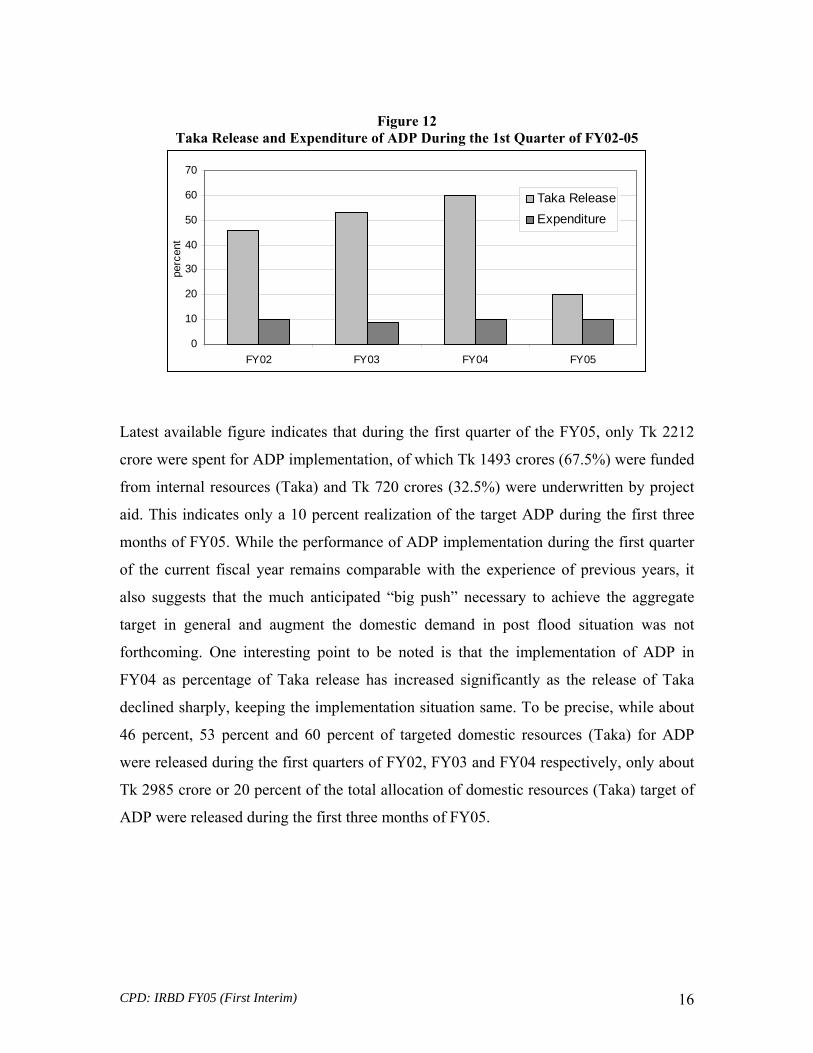
Figure 12
Taka Release and Expenditure of ADP During the 1st Quarter of FY02-05
0
10
20
30
40
50
60
70
FY02 FY03 FY04 FY05
perc
ent
Taka ReleaseExpenditure
Latest available figure indicates that during the first quarter of the FY05, only Tk 2212
crore were spent for ADP implementation, of which Tk 1493 crores (67.5%) were funded
from internal resources (Taka) and Tk 720 crores (32.5%) were underwritten by project
aid. This indicates only a 10 percent realization of the target ADP during the first three
months of FY05. While the performance of ADP implementation during the first quarter
of the current fiscal year remains comparable with the experience of previous years, it
also suggests that the much anticipated “big push” necessary to achieve the aggregate
target in general and augment the domestic demand in post flood situation was not
forthcoming. One interesting point to be noted is that the implementation of ADP in
FY04 as percentage of Taka release has increased significantly as the release of Taka
declined sharply, keeping the implementation situation same. To be precise, while about
46 percent, 53 percent and 60 percent of targeted domestic resources (Taka) for ADP
were released during the first quarters of FY02, FY03 and FY04 respectively, only about
Tk 2985 crore or 20 percent of the total allocation of domestic resources (Taka) target of
ADP were released during the first three months of FY05.

CPD: IRBD FY05 (First Interim) 17
0
2
4
6
8
10
12
14
16
18
20
Pow er Division Education LocalGovernment
Communication Health and FamilyWelfare
perc
ent
Figure 13
Target ADP and Actual Implementation During FY02-05 (1st Quarter)
0
5000
10000
15000
20000
25000
FY02 FY03 FY04 FY05
cror
e Tk Actual During 1st Quarter (P.A.)
Actual During 1st Quarter (Taka)Target ADP for the Full Fiscal
A closer look at the ADP implementation reveals that among the ministries/divisions
which received the highest allocation in the target ADP, the Ministry of Health and
Family Welfare implemented the least spending, only 2 percent of its allocation during
the first quarter of the FY05. Others performed moderately during this period: Power
Division 15 percent, M/O Education 15 percent, Local Government Division 18 percent
and M/O Communication 10 percent.
Figure 14 Performance of Major Ministries (in terms of ADP Allocation)
CPD: IRBD FY05 (First Interim) 18
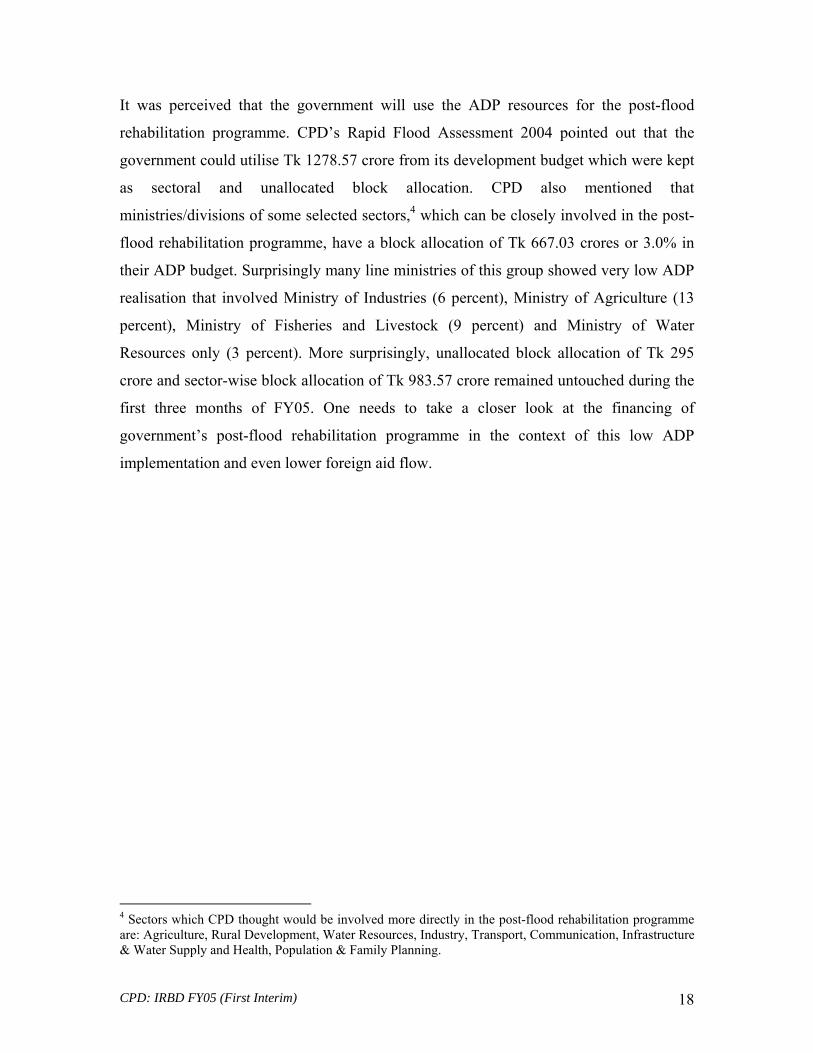
It was perceived that the government will use the ADP resources for the post-flood
rehabilitation programme. CPD’s Rapid Flood Assessment 2004 pointed out that the
government could utilise Tk 1278.57 crore from its development budget which were kept
as sectoral and unallocated block allocation. CPD also mentioned that
ministries/divisions of some selected sectors,4 which can be closely involved in the post-
flood rehabilitation programme, have a block allocation of Tk 667.03 crores or 3.0% in
their ADP budget. Surprisingly many line ministries of this group showed very low ADP
realisation that involved Ministry of Industries (6 percent), Ministry of Agriculture (13
percent), Ministry of Fisheries and Livestock (9 percent) and Ministry of Water
Resources only (3 percent). More surprisingly, unallocated block allocation of Tk 295
crore and sector-wise block allocation of Tk 983.57 crore remained untouched during the
first three months of FY05. One needs to take a closer look at the financing of
government’s post-flood rehabilitation programme in the context of this low ADP
implementation and even lower foreign aid flow.
4 Sectors which CPD thought would be involved more directly in the post-flood rehabilitation programme are: Agriculture, Rural Development, Water Resources, Industry, Transport, Communication, Infrastructure & Water Supply and Health, Population & Family Planning.

CPD: IRBD FY05 (First Interim) 19
IV. STATE OF THE MONETARY SECTOR 4.1 Domestic Credit Expansion
The outstanding amount of domestic credit at the end of October 2004 stood at Tk
129183.00 crore of which Tk 99057 crores was in the private sector and rest percent in
the public sector. Total domestic credit during the first four months of the current fiscal
year registered a perceptible 15 percent growth over its matching figure for FY04.
Government’s expansionary approach following the Flood 2004 was reflected by this
upward trend in domestic credit expansion.
But it needs to be pointed out that though borrowing in the public sector increased on a
point to point basis by 3486.50 crores (i.e. by 13.09 percent) in October 2004 against the
decline of Tk.1005.30 crores (i.e. (-) 3.64 percent) during the comparable period of the
preceding year (2002); the high growth rate largely resulted from an increase of Tk.
1140.30 crores (i.e. 14.87 percent) in credit to the “Other Public Sector”. Net credit
expansion to government sector was 12.37 percent more than that of the matching figure
of the previous year.
Figure 15 Domestic Credit Expansion During Jul-Oct FY01 to FY05
0
20000
40000
60000
80000
100000
120000
140000
2001 2002 2003 2004
Tk in
Cro
re
Government Other Public Private Sector

CPD: IRBD FY05 (First Interim) 20
The 15 percent growth of private sector during the first four months of FY05 seems quite
low, when compared with the growth rate of 22 percent during the same period of
previous year. It may be noted that the correlation of credit growths between public and
private sector often appears to be negative5. When government borrows excessively from
the banking sector, it usually squeezes banks’ private sector lending capacity. As shown
in figure 16, growth of credit expansion in the private sector increased from 14.80 percent
in October 2002 to 22.23 percent in October 2003, while the growth of credit expansion
in the government sector declined from 0.40 percent to (-) 6.70 percent during the same
period. As the economy observed a high growth in the public sector (government 12.37
percent, and other public 14.87 percent) in October 2004, the growth in the private sector
declined to 15 percent.
Figure 16 Growths in Domestic Credit During Jul-Oct FY01 to FY05
-10.00
-5.00
0.00
5.00
10.00
15.00
20.00
25.00
30.00
2001 2002 2003 2004
perc
ent
Government Other Public Private Total
However, excess liquidity in the banks provides enough room for government sector
borrowing to expand without crowding out the share of private sector. As seen during the
first four months of FY05, credit to private sector increased both in terms of absolute
volume and in terms of share corroborating the expansionary approach of the government
after the post-flood situation. 5 For example, on a point-to-point basis, growths during the first four months of FY01 to FY04 indicate a negative correlation of -0.4 percent.

CPD: IRBD FY05 (First Interim) 21
Figure 17
Private Sector Share in Domestic Credit During Jul-Oct FY01 to FY05
64.00
66.00
68.00
70.00
72.00
74.00
76.00
78.00
2001 2002 2003 2004
perc
ent
Share of private investment marginally increased from 76.29 percent during October
2003 to 76.68 percent during October 2004. This is quite high when compared to the
average share of 72 percent as was observed during the past five years.
4.2 Government Borrowing and Public Debt During the first four months of FY05, the government borrowing experienced a major
shift as regard to its source by way of moving away from non-bank sources to banking
sources. This process has been underpinned by a drastic fall in net the sale of National
Savings Deposits (NSD). Total public borrowing during the July-October period of FY05
stood at Tk 22150.77 crore registering a growth rate of about 7 percent over the
corresponding period of the previous fiscal year. Share of government borrowing from
the non-bank sources during this period decreased from 8.35 percent in FY04 to 3.77
percent in FY05. While net borrowing from the banking sector increased by about 12.37
percent, net borrowing of government from the non-bank sources decreased by (-) 51.72
percent during the period under report.

CPD: IRBD FY05 (First Interim) 22
-60.00
-50.00
-40.00
-30.00
-20.00
-10.00
0.00
10.00
20.00
Borrowing from Bank Borrowing from Non-Bank
Total GovernmentBorrowing
perc
ent
Figure 18 Growth of Net Government Borrowing During Jul-Oct FY05
(point-to-point)
Government borrowing through sale of NSD certificates during the first four months of
FY05 stood at Tk 3291.46 crore registering a (-) 6.50 percent negative growth, while the
repayment of principal increased by 37.15 percent, registering a (-) 51.72 percent
negative growth in the net sale. This decline in the sale of savings certificate is a response
to the government’s decision of lowering the interest rate of NSD certificates to reduce
the cost of borrowing and to encourage people to invest in the economy. The recent
upward movements in the capital market can be correlated with the declining trend of
NSD sale. Though the second aim of the government was somewhat achieved, the
lowering of interest rate however backfired with a sharp decline in NSD sale, putting the
government at a risk to face financing crisis to fulfil the budget deficit with borrowing. In
that case, the government will have to increase its borrowing from the banking sector,
which will then create a negative impact on the private sector investment by squeezing
the private sector’s share of borrowing from the bank.

CPD: IRBD FY05 (First Interim) 23
0
500
1000
1500
2000
2500
3000
3500
4000
Jul-Oct FY04 Jul-Oct FY05
Cror
e Tk
Sal
e
Net Sale
Repayment
Figure 19 Sale and Repayment of NSD Certificate
In the context of this dilemma, recently the government has taken some decisions to
increase the sale of NSD certificates with the same lowered interest rate. The government
has increased the limit of investment in NSD certificates, for single owner from Tk 20
lakh to Tk 25 lakh and in dual name, from Tk 40 lakh to Tk 50 lakh, which is equally
applicable for re-investment. Besides one can also reinvest his/her interest with the
principal. The commission of banks and post-offices has also been increased from Tk 20
to 5 percent for each transaction to encourage their selling effort.
4.3 Agricultural Credit
It was expected that the post-flood rehabilitation programme of the government will be
reflected by an increase in the agricultural credit. However agricultural credit expansion
during the first four months of FY05 shows a mixed picture with improved disbursement
rate which remains low in terms of target achievement.
Credit disbursement to the agricultural sector stood at Tk 1154.78 crore at the end of
October 2004 which is about 58 percent higher than the disbursement of the matching
period of the previous year. However this extraordinarily high growth rate can be
explained by its lower benchmark during the previous year. During the first four months
of FY04 only Tk 729.53 core were disbursed as against Tk 850.60 crore of recovery. This
out-flowed an amount of Tk 121 crore from the rural economy.

CPD: IRBD FY05 (First Interim) 24
-200.00
0.00
200.00
400.00
600.00
800.00
1000.00
1200.00
1400.00
Disbursement Recovery Netf low
taka
in c
rore
Jul-Oct FY04 Jul-Oct FY05
Figure 20 Growths in Agricultural Credit Expansion During Jul-Oct FY05
In this context, a moderately high credit expansion during the agricultural sector could
take a breath following the devastating flood. However, notwithstanding the agricultural
credit growth of FY03, the post-flood disbursement of agricultural credit during the FY05
falls short of the target as only 20.85 percent of the total target (Tk 5537.9 crore) was
disbursed during the first four months of FY05. It may be recalled that CPD in its Flood
2004 report suggested for disbursement of Tk. 5000 crore as agricultural credit in FY05. 4.4 Industrial Credit
In the backdrop of the slowdown in growth of industrial term loans in the recent years
(since FY01), the disbursement record for FY04 was quite impressive – Tk. 6619.60
crores, i.e. 67.08 percent growth. After a recovery of Tk 4954.24 crores in FY04, the net
flow to the sector is Tk. 1304.97 crores which compares favourably with the outflow of
(-) Tk. 40.90 crores during the comparable period in FY03.
The expansionary trends in the disbursements of industrial term loan continued in the
first quarter of FY05 (61.5 per cent growth). But in the absence of the data on recovery of
the loans, it is hard to get a complete picture of the term loan situations.

CPD: IRBD FY05 (First Interim) 25
However, one interesting feature is that loan disbursement by NCBs declined by 60
percent, though the loan sanctioned was 257 per cent higher than the first quarter of the
FY04. Loan disbursement from PCB (domestic) shows a growth rate of 154 per cent,
which has also emerged decisively as the largest contributor (almost 65 per cent) to total
industrial loan disbursement. Figure 21
Term Loan for the FY04 and FY05
0.00
1000.00
2000.00
3000.00
4000.00
5000.00
6000.00
7000.00
FY04 (July-Sep.) FY05 (July-Sep.)
Cro
re T
k
NBFI
PCB(F)
PCB(D)
DFI
NCB
Figure 22
Working Capital for the FY04 and FY05
0.00
500.00
1000.00
1500.00
2000.00
2500.00
FY04 (July-Sep.) FY05 (July-Sep.)
Cro
re T
k
NBFI
PCB(F)
PCB(D)
DFI
NCB

CPD: IRBD FY05 (First Interim) 26
The disbursement of working capital grew at 46 per cent in FY05 (July-Sept). Similar to
the term loan, PCB (domestic) has the largest share (almost 65 per cent) in total
disbursement of working capital.
4.5 Price and Wage Inflation 4.5.1 Trend in Inflation
The rising trend in inflation is another concerning issue of the last few months. The
general inflation in October 2004 rose to 7.92 on point-to-point basis while inflation in
October 2003 was 6.16 per cent. Three major features of the recent rise in the price level
is: (i) inflation is higher in the rural areas, (ii) food inflation is higher in both rural and
urban areas; and (iii) non-food inflation showing a declining trend since October 2002.
The 12-month moving average inflation rate also shows an increasing trend, reaching as
high as 6.21 per cent in October 2004. The major factor behind this trend is the increase
in food price, which increased to 7.57 per cent (10.46 per cent on point to point basis).
However, the weakening of Taka against dollar and the rising import prices also added
fuel to the rising trend of inflation.
Figure 23
Inflation (Moving Average)
0.00
1.00
2.00
3.00
4.00
5.00
6.00
7.00
8.00
Jul-0
1
Sep-
01
Nov
-01
Jan-
02
Mar
-02
May
-02
Jul-0
2
Sep-
02
Nov
-02
Jan-
03
Mar
-03
May
-03
Jul-0
3
Sep-
03
Nov
-03
Jan-
04
Mar
-04
May
-04
Jul-0
4
Sep-
04
Per
cen
t
General Food Non Food

CPD: IRBD FY05 (First Interim) 27
4.5.2 Trend in Food Inflation
The recent flood may be the most influencing factor in the rise in the food price, although
the upturn started back in January, 2003. The food inflation in FY04 was 6.64 per cent
(on point to point basis), the food inflation then started accelerating and on October 2004,
it reached 10.46 per cent (on point to point basis), a record high since FY99.
Figure 24
Food Inflation (Point to Point)
-2.00
0.00
2.00
4.00
6.00
8.00
10.00
12.00
Jul-0
0
Oct
-00
Jan-
01
Apr-
01
Jul-0
1
Oct
-01
Jan-
02
Apr-
02
Jul-0
2
Oct
-02
Jan-
03
Apr-
03
Jul-0
3
Oct
-03
Jan-
04
Apr-
04
Jul-0
4
Oct
-04
Per
cen
t
National Rural Urban
4.5.3 Wage Inflation
The general wage index grew by 5.38 per cent in October 2004, on a point to point basis.
The general wage inflation in October 2002 and 2003 was 11.25 and 6.83 per cent,
respectively. The crucial point here was that CPI inflation is increasing on the one hand
while the wage index was falling on the other hand in FY04. However, wage inflation in
FY04 was 3.93 per cent and since then it started increasing. Agricultural wage index also
started increasing since July 2004, following a decreasing trend over the previous 12
months.

CPD: IRBD FY05 (First Interim) 28
Figure 25
Wage Inflation (Point to Point)
0.00
2.00
4.00
6.00
8.00
10.00
12.00
14.00
16.00
18.00Ja
n-02
Mar
-02
May
-02
Jul-0
2
Sep
-02
Nov
-02
Jan-
03
Mar
-03
May
-03
Jul-0
3
Sep
-03
Nov
-03
Jan-
04
Mar
-04
May
-04
Jul-0
4
Sep
-04
Per c
ent
General Manufacturing Construction Agriculture Fishery
4.5.4 Inflation Trend in South Asia
Inflation in India (on a point to point basis) in July 2004 was 6.16 per cent, which was
inclined by an increase of the oil price in the international market. WPI inflation reached
at 8.3 per cent in August 2004; and then gradually decreased to 7.1 per cent in October
2004. The CPI inflation in Pakistan was also quite high, but it shows a declining trend in
contrast to Bangladesh.
TABLE 2
COMPARISON OF INFLATION IN INDIA, PAKISTAN AND BANGLADESH
Bangladesh (CPI) India (WPI) Pakistan (CPI) Jul-04 5.6 6.2 9.3
Aug-04 5.5 8.3 9.2 Sep-04 7.4 7.8 9.0 Oct-04 7.9 7.1 8.7

CPD: IRBD FY05 (First Interim) 29
Figure 26
Comparison among India, Pakistan & Bangladesh
3.0
4.0
5.0
6.0
7.0
8.0
9.0
10.0
Jul-04 Aug-04 Sep-04 Oct-04
Bangladesh (CPI) India (WPI) Pakistan (CPI)
4.5.5 Experience with 1998 Flood: (Base FY1986=100)
The post flood trends of the 1998 show that inflation rose to as high as 12 per cent in
December 1998, then decreased gradually. Experts are predicting similar trends in
inflation after the recent flood. Moreover, the increase in the price of oil, diesel and
kerosene in December 2004 may increase the rate of inflation further.

CPD: IRBD FY05 (First Interim) 30
Figure 27
Inflation During the Flood Year 1998
0.00
2.00
4.00
6.00
8.00
10.00
12.00
14.00Ju
l-96
Oct
-96
Jan-
97
Apr
-97
Jul-9
7
Oct
-97
Jan-
98
Apr
'98
July
'98
Oct
'98
Jan'
99
Apr
'99
July
'99
Oct
-99
Jan-
00
Apr
-00
Per
cen
t
Moving Average Point to Point
4.5.6 Projection on Food Inflation
Preliminary estimates suggest that production of Aman rice in FY05 will be 10 per cent
less than the last year. Per unit production cost of Boro rice will go up due to increased
cost of diesel and there is apprehension that Boro production will be adversely affected
due to increase in diesel price (see section 11.4 for details). International price of
foodgrains is on the rise and is expected to increase further in the coming months due to
low production prospect of rice in Thailand, Vietnam and India caused by abnormal
dryness (see section 11.1 for details).
Therefore, it is most likely that inflation in food prices may continue until the harvest of
Boro rice in April-May.

CPD: IRBD FY05 (First Interim) 31
Box 1 An Enquiry into Factors Influencing Inflation: Inflation, as measured by changes in CPI, increased sharply between FY98-99, but this trend was reversed in FY00. Inflation started climbing again on FY02 and in FY04 it reached 5.8 per cent, the highest since FY99. Data on some of the factors likely to have influenced the inflationary process in Bangladesh is reported below:
Factors Influencing Inflation
Inflation Rate (End of
Period)
Budget Deficit (as % of GDP)
Exchange Rate Depreciation (%)
Real GDP Growth (%)
Broad Money Growth
FY97 4.0 2.0 -4.4 5.4 10.8FY98 8.7 2.1 -5.7 5.2 10.2FY99 7.1 3.2 -4.5 4.9 12.8FY00 2.8 4.5 -4.9 5.9 18.6FY01 1.9 4.1 -10.5 5.3 16.6FY02 2.8 3.7 -1.6 4.4 13.1FY03 4.4 3.4 0.0 5.3 15.6FY04 5.8 3.4 na 5.5 13.8
The significant decline in the inflation rate since FY98 reflects the impacts of tight monetary policies and contractionary fiscal policies of the previous year, as the budget deficit as % of GDP was only 2.0 per cent in FY97. The government and the central bank pursued expansionary monetary and fiscal policies in the late 90s and early 2000s. As a result, the inflation started increasing but with lagged response. Moreover, a large depreciation of the exchange rate by 10.5 per cent in FY01 along with monetary and fiscal expansion contributed toward an upward trend in inflation, started in FY02. The budget deficit as per cent of GDP shows a declining trend since FY00, from 4.5 per cent in FY00 to 3.4 per cent in FY04. On the other hand, the growth rate of broad money supply averaged 15.5 per cent in the last 5 years. This indicates preference toward the monetary policies over the fiscal policies by the government. The correlation between inflation and budget deficit as % of GDP for the same period and one lagged period is -0.6 and -0.7, respectively. On the other hand, the correlation between inflation and budget deficit as % of GDP for 2 and 3 lagged periods is -0.2 and 0.1, respectively. However, the correlation between inflation and budget deficit as % of GDP for 4 and 5 lagged periods is 0.3 and 0.3, respectively. This implies that fiscal policies take at least 2 periods to affect inflation. The correlation between inflation and 3 and 4 period lagged money supply growth is 0.8 and 0.2, respectively. The correlation between inflation and the same, 1 and 2 period lagged money supply growth is negative, which contradicts the theory.

CPD: IRBD FY05 (First Interim) 32
V. STATE OF THE REAL SECTOR 5.1 Agricultural Production Crop
Foodgrain production in FY04 recorded the highest production in the history of
Bangladesh since independence. According to the final estimates of the BBS, actual
foodgrain production in FY04 was 27.44 million metric tons (Aus: 1.83 million metric
tons, Aman: 11.52 million metric tons, Boro: 12.84 million metric tons, and wheat: 1.25
million metric tons) which was 2.80 percent higher than that of FY03. In FY04, total rice
production increased by 3.98 percent (compared to FY03), while wheat production
decreased by 16.85%. It may be mentioned here that wheat production has been gradually
decreasing since 1999/00. Thus, it appears that increase in total foodgrain production in
recent years is mainly due to the increase in rice production.
The operational target for foodgrain production in FY05 has been set at 30.0 million
metric tons which is 9.32 percent higher than actual production in FY04. Initial estimates
show that harvested area under Aus rice has declined from 1.2 million ha in FY04 to 1.0
million ha in FY05, while production of Aus rice has declined from 1.83 million tons to
1.45 million tons. Decrease in Aus production was mainly due to the damage caused by
July-August flood in 46 districts and also because of decrease in area under Aus rice.
Achieved area under transplanted Aman rice (after damage by July-August flood in 46
districts and excessive rain and flash flood in September in 24 districts) is 4.88 million ha
which was 3.44% less than last year. On the other hand, achieved area under broadcast
Aman was 0.42 million ha (33.15% less than FY04). According to the Directorate of
Agricultural Extension (DAE), 35.0 percent of the transplanted Aman area was under
local variety and 65.0 percent area was under HYVs. Most importantly, rice plants had
limited time for tillering and vegetative growth which might have effected plant densities
and thereby, number of plants per hectare in many districts. Though we had floods and
excessive rains in 2004 in most of the areas of Bangladesh but one district (Nilphamari)
experienced drought. It is well known that yield potential of local varieties is much lower
than that of HYVs.

CPD: IRBD FY05 (First Interim) 33
Therefore, all these factors (decrease in Aman area, dominance of local varieties, lower
number of effective tillers per unit area in many districts and drought) would have a
negative effect on the production level. Harvesting of Aman rice is almost over.
However, the respective agencies would require some time to come up with the
production estimates of Aman. There is apprehension among experts that Aman
production in FY05 might be about 10 percent less than that of FY04. This implies that
the government must have to take extra efforts for increased production in Boro season
by ensuring delivery of seed, fertilizer and irrigation fuels.
This year farmers have taken extra effort to increase vegetable production by observing
high prices of vegetables during August-October. Increased effort of farmers had
increased production and supply of vegetables since November which helped to reduce
price. However, farmers’ success in increased vegetables production has been penalizing
them in a very harsh way. In many areas farmers are not able to sell their vegetables even
at their cost of marketing.
Livestock
Production of eggs in FY04 was 4.780 billions which was slightly higher than FY03
(4.777 billion). Total meat production increased from 0.83 million tons in FY03 to 0.91
million tons in FY04 (9.64 percent increase). Milk production has increased from 1.82
million tons in FY03 to 1.99 million tons in FY04 (9.34 percent increase). July-August
flood and excessive rain in September has severely affected the livestock sector. A total
of 293,301 poultry birds, 1649 cattles, and 4546 goats and sheep were killed by the flood.
After the natural disaster of this enormous scale it was a great concern of outbreak
diseases of poultry and cattle. No epidemic of diseases has so far been reported. Hence,
it is expected that this year’s production of different livestock products would be good.

CPD: IRBD FY05 (First Interim) 34
Fisheries
Total fisheries production has increased from 2004 thousand metric tons in FY03 to 2126
thousand tonnes in FY04 (6.09 percent increase). Contribution of inland open water
(capture), inland open water (culture) and marine fisheries was 36.41, 41.63 and 21.97
percent, respectively. Flood 2004 had devastating impact on fish farms. According to the
Ministry of Livestock and Fisheries, flood has damaged shrimp, fish and fingerlings in 43
districts of Bangladesh amounting Tk. 9907.4 million. The government has taken
initiatives to rehabilitate farmers with a total budget of Tk 206.86 million.
We may conclude by saying that production prospect of foodgrains in FY05 is bleak. It is
widely speculated that aman production would be around 10 percent less than that of last
year (FY04) while aus production was 0.38 million tonnes less (21% less) than last year’s
production. Therefore, extra efforts need to be taken for increased production of Boro
rice. Crop sector may have slow growth in this year, but livestock and fisheries sub-
sectors may register medium growth.
5.2 Industrial Production The country observed a moderate recovery in the industrial sector during the first four
months of the FY05 after the devastating flood that the economy experienced at the
beginning of the FY05. The weighted growth of major industries which accounts for
about 68.18 percent of the whole manufacturing sector experienced a moderate 3.87
percent growth during the July-October period of FY05 over the corresponding figure of
the previous fiscal year. Yarn, cloth and garments showed 18.44 percent, 26.75 percent
and 17.37 percent growth supporting the high growth performance in the export in this
sectors. Among others, sector which showed modest to high growth during this period
includes: fertilizer (13.97 percent), MS rod (5.93 percent), cement (12.27 percent) and
drugs and pharmaceuticals (10.19 percent). However, jute textile, paper and petroleum
products showed negative growths during this period registering (-) 8.12 percent, (-)19.53
percent and (-) 4.91 percent negative growth respectively.

CPD: IRBD FY05 (First Interim) 35
-30
-20
-10
0
10
20
30
40
50
Jute
Tex
tile
Gar
men
ts
Ferti
lizer
Cem
ent
Ciga
rette
s
Drug
s &
Phar
mac
eutic
als
Salt
Soap
&de
terg
entG
row
th (p
erce
nt)
FY04 (Jul-Oct)FY05 (Jul-Oct)
0
50
100
150
200
250
300
350
July
Aug Sep
Oct
Nov
Dec
Jan
Feb
Mar
Apr
May
June
2002-032003-042004-05
Figure 28
Growths of Major Industries During July to October of FY04 and FY05
Figure 29
Quantum Index of Production during FY03-05 (1988-89=100)
The quantum index of production shows a robust 8.58 percent growth during the first
four months of the FY05 when compared with the 3.52 percent of growth during the
FY04 over the corresponding period f the previous fiscal year. This growth is even more
encouraging keeping in mind that the economy started with a flood during the FY05.
CPD: IRBD FY05 (First Interim) 36
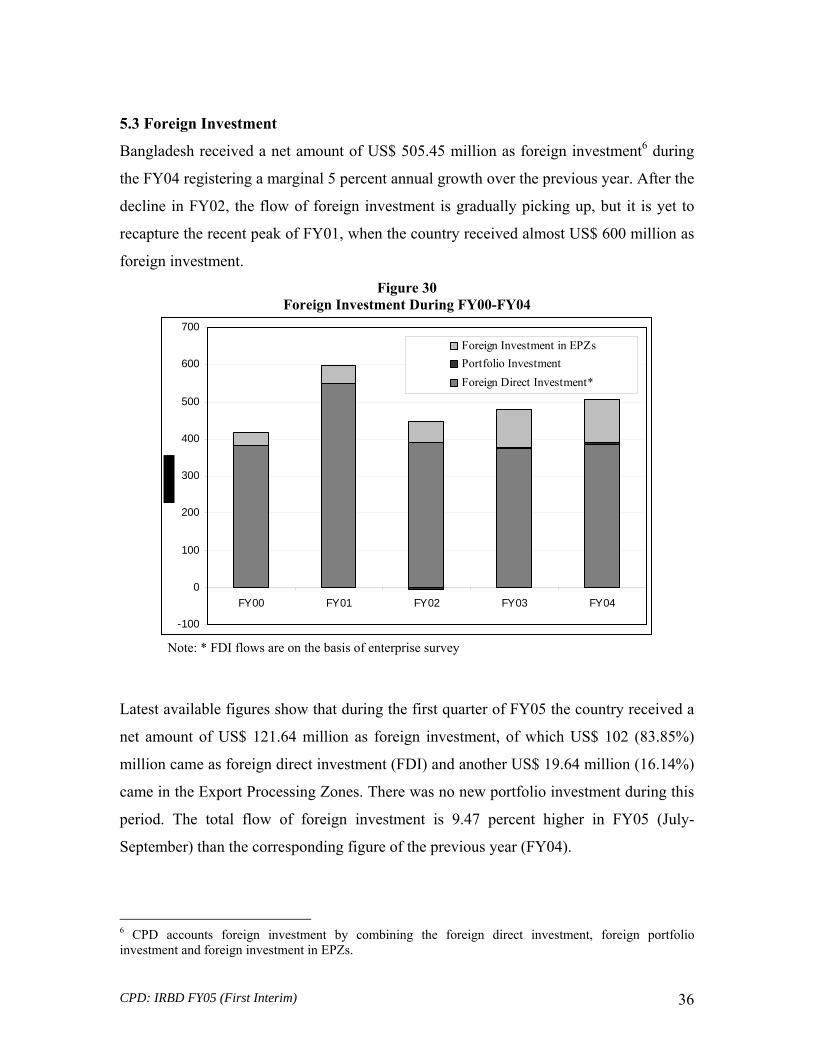
5.3 Foreign Investment
Bangladesh received a net amount of US$ 505.45 million as foreign investment6 during
the FY04 registering a marginal 5 percent annual growth over the previous year. After the
decline in FY02, the flow of foreign investment is gradually picking up, but it is yet to
recapture the recent peak of FY01, when the country received almost US$ 600 million as
foreign investment.
Figure 30 Foreign Investment During FY00-FY04
-100
0
100
200
300
400
500
600
700
FY00 FY01 FY02 FY03 FY04
Foreign Investment in EPZsPortfolio InvestmentForeign Direct Investment*
Note: * FDI flows are on the basis of enterprise survey
Latest available figures show that during the first quarter of FY05 the country received a
net amount of US$ 121.64 million as foreign investment, of which US$ 102 (83.85%)
million came as foreign direct investment (FDI) and another US$ 19.64 million (16.14%)
came in the Export Processing Zones. There was no new portfolio investment during this
period. The total flow of foreign investment is 9.47 percent higher in FY05 (July-
September) than the corresponding figure of the previous year (FY04).
6 CPD accounts foreign investment by combining the foreign direct investment, foreign portfolio investment and foreign investment in EPZs.

CPD: IRBD FY05 (First Interim) 37
Figure 31 Foreign Investment During July-September of FY04-05
0
20
40
60
80
100
120
140
FY04 (Jul-Sep) FY05 (Jul-Sep)
Foreign Investment inEPZs
Portfolio Investment
Foreign DirectInvestment*
Note: * FDI flows are on the basis of enterprise survey
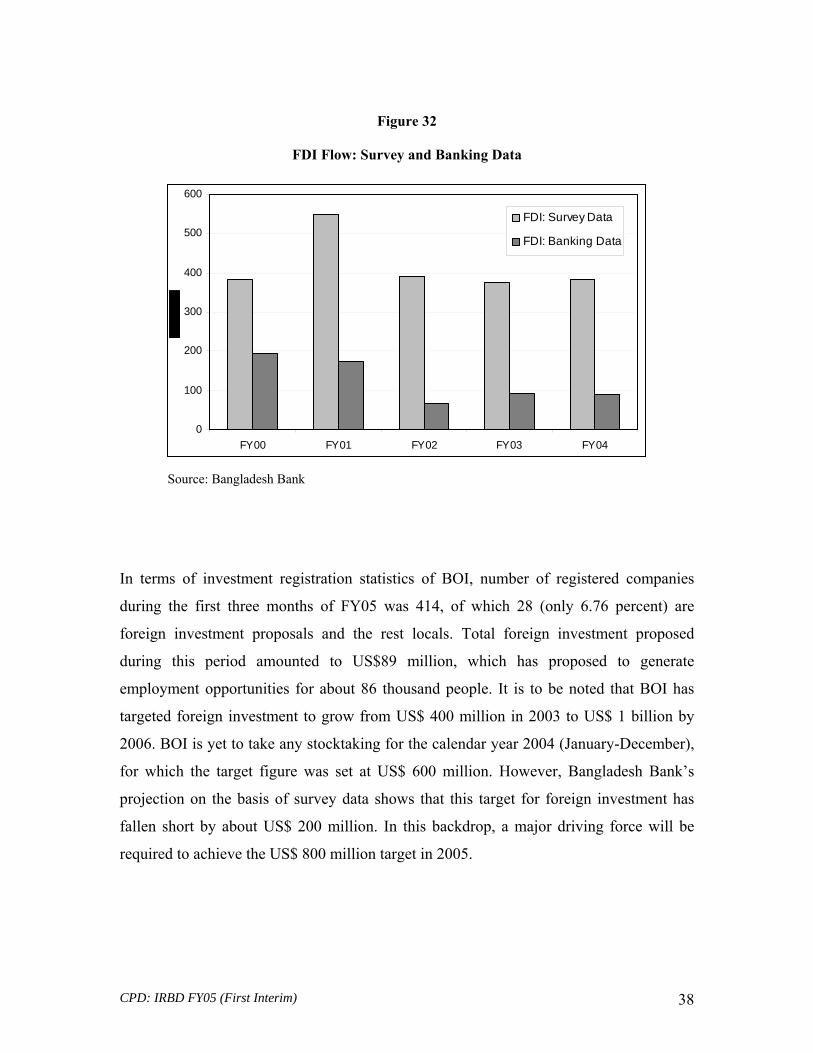
However, following detection of the huge discrepancy between the Bangladesh Bank and
BOI’s foreign investment data, recently the Bangladesh Bank, with the support of IMF,
has taken the initiative to incorporate survey data (instead of banking data) to account the
foreign investment flow. Since the banking data gives only a very partial coverage as
reinvested earnings are excluded altogether, intra-company loans are under-reported and
non-cash equity flow (e.g. equity contribution in the form of machinery and equipments)
are not identified from the trade returns and it remains substantially under-covered.
Following figure shows the difference between survey data and banking data during the
previous five years. Still there are remain some divergence between the FDI survey data
of Bangladesh Bank and BOI.
CPD: IRBD FY05 (First Interim) 38
Figure 32
FDI Flow: Survey and Banking Data
0
100
200
300
400
500
600
FY00 FY01 FY02 FY03 FY04
FDI: Survey Data
FDI: Banking Data
Source: Bangladesh Bank
In terms of investment registration statistics of BOI, number of registered companies
during the first three months of FY05 was 414, of which 28 (only 6.76 percent) are
foreign investment proposals and the rest locals. Total foreign investment proposed
during this period amounted to US$89 million, which has proposed to generate
employment opportunities for about 86 thousand people. It is to be noted that BOI has
targeted foreign investment to grow from US$ 400 million in 2003 to US$ 1 billion by
2006. BOI is yet to take any stocktaking for the calendar year 2004 (January-December),
for which the target figure was set at US$ 600 million. However, Bangladesh Bank’s
projection on the basis of survey data shows that this target for foreign investment has
fallen short by about US$ 200 million. In this backdrop, a major driving force will be
required to achieve the US$ 800 million target in 2005.

CPD: IRBD FY05 (First Interim) 39
Figure 33
Sectoral Composition of Registered FDI in FY04
Textile16%
Services62%
Chemical7%
Agro-based6%
Misc0%
Engineering1%
Food and allied3%
Leather and rubber
3%
Printing and publication
2%
Source: Board of Investment.
The sectoral decomposition of FDI flow of FY04 revels that the majority of the FDI in
Bangladesh comes to the services sector which accumulates about 62 percent of the total
FDI flow, which is followed by the textile (16 percent), chemical (7 percent) and agro-
based industries (6 percent) sector. However sectors like infrastructure, engineering and
leather remains under-invested.
5.4 Capital Market The dynamics of capital market in Bangladesh is such that it does not reflect the real
macroeconomic performance of the country. However certain aspects of investment
scenario can be observed from the movements in the capital market. Since the 1996
incident, the capital market experienced a deliberately slow but steady recovery that
continued throughout the FY04. Several new IPOs came into the market and a bullish
trend was observed from the mid-November of FY04, which gathered momentum in the
early part of December recording a 1015.97 general index for the first time after 1996.

CPD: IRBD FY05 (First Interim) 40
0
1
2
3
4
5
During the first half of FY05 a spectacular upsurge in all share price index was observed
both in Dhaka Stock Exchange (DSE) and Chittagong Stock Exchange (CSE). The
general index of DSE increased from 967.88 in December 2003 to 1971.31 in December
2004 registering a thousand-point increase in one year. This was however contributed
mostly by the category-A companies as DSE 20 index also registered a 930.46 point
increase during the same period (from 1228.20 in December 2003 to 2158.66 in
December 2004). CSE also followed the suit as the CSE general and CSE 30 index went
up to as high as 3597.70 and 3463.76 at the end of December 2004.
Figure 34 Entry of IPOs in the Capital Market (Monthly Statistics)
On the contrary, the issuance of IPO has gone down dramatically since no new IPO
entered into the market in between November 2003 and July 2004 (see figure 34). This is
a worrying concern as following the simple law of demand-supply theory; the rate of over
subscription has gone up.
There is a substantial amount of liquid money in the hands of common people and at the
household level, other than that of in the banking system of Bangladesh. In view of the
fact that the income potentials from sources like bank and NSD certificates have gone
down due to lowering of the interest rates, a number of small and medium investors are
now coming into the capital markets with their investible surplus. Following the boom
and burst of the Capital Balloon in 1996, several initiatives taken by the Securities and

CPD: IRBD FY05 (First Interim) 41
Exchange Commission7 (SEC) also contributed to this over subscription of IPOs.
However, very recently some new IPOs have entered into the market8 and several others
are on the pipeline9.
IPOs these days are mainly coming from the banking and financial sectors and not from
the real sector (after the Lafarge Surma Cement in November 2003). No IPOs from
telecommunication services was observed. A number of non-bank financial institutions
have applied and are coming to the market soon. In general, banking financial institutions
performed better in security market, out of 29 enlisted banking and non-banking financial
institutions, 21 are of ‘A’ category, whose price earning ratios are mostly near about 10.
It seems that private commercial banks have performed well under prudent laws and
regulations and better supervision of Bangladesh Bank, introducing new products with
traditional one, such as government treasury bills, prize bonds, shares of public limited
companies, treasury dealings both in local and foreign currency, automation tools such as
ATM, SWIFT, extended consumer credit scheme, merchant banking, credit card
operation and Islamic banking.
However IPOs from the real sectors also needed to be encouraged. Major reason for
profit making companies for not entering in the capital market can be the absence of
managerial expertise to expand their business further. Some also fears to loose their
family ownership from the company if they go to the share market. Besides it also induce
them to have more accountability and transparency in terms of profit making.
This scarcity of IPOs can also be linked with the ever increasing all share price index.
Since the buying of new IPOs is becoming increasingly expensive (for higher price) and
difficult (for lower IPO entry); investors are now trying to make profit from selling and
buying second-hand shares. Besides, the dividend and profit they are provided for these
7 Such initiatives includes abolition of curb market, introduction of Automated Trading System, Central Depository System (CDS), and overall technological changes. 8 Exim Bank Ltd, Mercantile Insurance Company Ltd and ICB AMCL Islamic Mutual Fund entered int o the market during the October-December 2004 period. 9 Agrani Insurance Company Ltd, Global Insurance Ltd and Premier Bank Ltd are scheduled to come in to the capital market during the January-February 2005 period.
CPD: IRBD FY05 (First Interim) 42
hard earned shares are not adequate and thus everyone is buying and offloading their
shares at a higher price to make profit, which is resulting this phoney increase in share
price index. It does not relate to the performance of the share offering companies nor
does it shows the overall macroeconomic trend of the country.10
As a consequence, if new IPOs do not come in the market to absorb this high demand and
necessary market corrections in this regard are not seen, this spurious surge in the capital
market will soon fall down. The capital market during the first two weeks of 2005 has
already shown some indications to it. The DSE General Index took a massive 133.13-
point drop on January 11, 2005 while the CSE All Share Price Index registered a 206.24-
point fall on the same day. Though the stocks revived on the next day, these ups and
downs are likely to persist for the next couple of weeks. Though some investors claimed
it as the result of SEC’s decision to suspend credit-extending facility by brokers to their
clients to control excess liquidity in the market, it is also true that only buying and selling
of share certificate cannot sustain this bullish trend. Along with the telecommunication
and other private sector companies, government blue chips should also be encouraged to
come into the market.
10 However, since the new IPOs are coming from the CDBL system and there is no curb market, at least this increase is not coming from any fake share certificates as it was observed in 1996. Besides, the major upraise in share price index are seen mainly on high value companies (DSE20 and CSE 30) who are giving 10 percent dividend to their share holders.

CPD: IRBD FY05 (First Interim) 43
VI. STATE OF THE EXTERNAL SECTOR
Bangladesh’s external sector experienced some degree of resurgence during FY2003 and
FY2004 following the dismal performance experienced in FY2001 when a decline in
export (-7.4 percent) coupled with low remittances flow resulted in low forex reserves
and unstable balance of payments that in the end also restrained growth of import. The
good performance of the external sector visible in FY2004, when exports posted a growth
of 16.1 percent, has now been sustained in the first few months of FY2005. As a matter
of fact, both exports and imports are showing robust growth as FY2005 crosses its half
way mark while the balance of payments appears to be comfortable. Increased surplus in
the current account balance is also observed, thanks to high growth of remittances which
has also boosted the foreign exchange reserves which has crossed the US$ 3 billion mark
in December 2004 for the first time since 1995.
6.1 Export Likely to Survive the Phasing out of MFA
Export sector’s robust performance in FY2005 is all the more remarkable since this
particular year coincides with the full and final phase-out of the MFA quotas. Although
quota was phased out on January 1, 2005 the order for the winter-spring season had
started to come in early FY2005 (September – November, 2004) and it does credit to
Bangladesh’s producers that the country has continued to remain on the radar screen of
buyers. Exports show a highly encouraging growth of 19.04 percent over the first four
months of FY05 when compared to the matching figure of FY04. Thus, export earnings
during the July-October period of FY2004 increased from $2415.35 million compared to
$2875.31 million over the corresponding period of FY05. As shown in figure 35, export
earnings from woven garments has increased by 14.7 percent, from US$ 1119.31 million
to US$ 1283.86 million during the first four months of FY05, whilst knitwear showed a
phenomenal growth of 40.4 percent. Export of knitwear increased from US$ 696.21
million to US$ 977.45 million during this period. All the more remarkable since knitwear
exports had increased by 29.9 percent in FY2004, and the sector suffered some damage,
particularly in Narayanganj area, because of the Floods in July-August, 2004. Export
earnings from other manufactured goods such as leather (6.1 percent), chemical products

CPD: IRBD FY05 (First Interim) 44
(15.0 percent) and handicrafts (15.8 percent) also experienced modest to high growth
rates. Jute’s downward spiral could not be halted, with export of jute goods remaining
stagnant with only a 0.2 percent growth. However other than tea which posted a modest
4.5 percent growth, export earnings from all other principal primary commodities
including raw jute and frozen foods have declined sharply by (-) 45.9 percent and (-) 32.0
percent during the period under analysis. This does not augur good as far as export
diversification is concerned.
Figure 35
Structure of Exports during July-October FY04-05
0
200
400
600
800
1000
1200
1400
Raw
Jut
e
Tea
Leat
her
Froz
enFo
ods
Jute
goo
ds
Han
dicr
afts
Wov
enw
ear
Kni
twea
r
Che
mic
al
Oth
ers
mln
US$
Export Jul-Oct FY04 Export Jul-Oct FY05
Thus, although there has been a negative growth of (-) 20.4 percent for export of primary
commodities during the first four months of FY05, manufactured commodities registered
a high growth of 22.6 percent.

CPD: IRBD FY05 (First Interim) 45
-60.00
-50.00
-40.00
-30.00
-20.00
-10.00
0.00
10.00
20.00
30.00
40.00
50.00
Raw
Jut
e
Tea
Leat
her
Froz
enFo
ods
Jute
goo
ds
Han
dicr
afts
Wov
enw
ear
Kni
twea
r
Che
mic
al
Oth
ers
Figure 36 Sectoral Growths of Exports during July-October FY05
Monthly dynamics of export earnings reveals that there was positive growth in each
month during the first four months of FY05 when July, August, September and October
export registered 28.0 percent, 24.6 percent, 11.4 percent and 9.2 percent growth rates
respectively on a point to point basis over the previous fiscal year. However, the growth
rates have declined secularly over which has been captured in Figure 36. It is too early to
make projection on these early declining trends. As Figure 37 shows, growth of export
earnings generally tends to slow down from their peak in July-August. However, there
appears to be a need to closely monitor the movement of the curves over the coming
months of FY2005.

CPD: IRBD FY05 (First Interim) 46
Figure 37 Monthly Dynamics of Export Earnings During FY01-05 (Jul-Oct)
FY01
FY02
FY04FY05
FY03
0
100
200
300
400
500
600
700
800
900
1000
July August September October
However, a decomposition of export growth presents a mixed picture. Most of the growth
in export earnings has been sustained through increase in volume. On the other hand, the
export price index shows no significant rise in the average prices of Bangladesh’s export
goods in the global market. As figure 38 shows, during the July-October months of FY05
about 81 percent of the export growth was accounted for by a rise in export volume as
against only 19 percent that was accounted for by rise in the average prices: export
quantum index has risen by 15.5 percent whilst export price index has posted a rise of
only 3.6 percent. As would be expected this trend is mostly explained by movements of
volumes and prices of manufactured commodities which accounts for more than 90
percent of Bangladesh’s total export. However, as can be seen from Figure 39 price of
primary commodities has shown some sign of moving up during the first four months,
although export volumes have gone down significantly.

CPD: IRBD FY05 (First Interim) 47
Figure 38
Decomposition of Export Growth for July-October FY05
-40
-30
-20
-10
0
10
20
30
Tota
l Exp
ort
Prim
ary
Com
mod
ities
Mfg
.C
omm
oditi
es
perc
ent
Export (Price Index) Export (Volume Index)
Volume index of manufactured goods rose by 19.6 percent while the price index rose
only by 3 percent during the period under analysis, however primary commodities
experienced a rise of 13.7 percent in its price index, though the overall growth was
negative (-20.4 percent) since volume index declined by about (-) 34.2 percent.
The above trend once again reinforces the need for Bangladesh to put special emphasis
on local value addition and export diversification if she wants to confront the
deteriorating terms of trade emanating from the global market place.

CPD: IRBD FY05 (First Interim) 48
Figure 39 Export and Import during FY91-FY04
0
2000
4000
6000
8000
10000
12000
FY91
FY92
FY93
FY94
FY95
FY96
FY97
FY98
FY99
FY00
FY01
FY02
FY03
FY04
mill
ion
US
$
Total Export
Total Imports
6.2. Import Sees Robust Growth Especially in Investment Items Bangladesh has been experiencing a steady growth in its import since the time of market
deregulation in the 1990s. Though there was a negative growth of import in FY02, the
economy experienced remarkable recovery in the subsequent fiscal years. The early
signal of FY05 also shows a continuation of that restoration process (see figure 40).
Figure 40 Imports and Sectoral Growth during the First Quarter of FY01-05
0
500
1000
1500
2000
2500
3000
3500
FY01 FY02 FY03 FY04 FY05-10
-5
0
5
10
15
20
25
30
35 Oil Seeds
Others Incl EPZ
Capital Goods
Iron and Steel
Textile andArticles ThereofEdible Oil
Milk and DairyProductsFood Grain
Growth

CPD: IRBD FY05 (First Interim) 49
Imports to Bangladesh during the first quarter of FY05 registered a significant growth of
about 25.2 percent compared to the corresponding period of FY04. When imports by
EPZs are included, growth of import stands insignificantly higher at 25.5 percent. It is to
be noted that import growth was mostly accounted for by growth of imports of non-food
items while imports of food grains declined by (-) 39.5 percent during this period.
Consequently, the share of food grains in total import also declined from about 6 percent
in FY04 to less than 3 percent during the first quarter of FY05. If imports of rice and
wheat are excluded, the growth rate of import during this period stands at 29.7 percent.
Figure 41 provides the sector-wise imports and growth of some selected commodities
during the first quarter of FY04 and FY05.
Figure 41
Sectoral Growth of Imports during the First Quarter of 05
-60.00
-40.00
-20.00
0.00
20.00
40.00
60.00
80.00
100.00
Food
Gra
ins
Milk
& C
ream
Oil S
eeds
Edi
ble
Oil
Cru
de P
etro
leum
Che
mic
als
Fer
tilize
r
Raw
Cot
ton
Yar
n
Tex
tile a
nd a
rticl
es T
here
of
Iro
n an
d st
eel
Cap
ital G
oods
Impo
rts o
f EPZ
Oth
ers
perc
ent
Import of textile and garments related inputs such as raw cotton (30.6 percent), yarn (12.6
percent) and textile and related articles (27.9 percent) registered an impressive growth
during the period under analysis, supporting the high export performance of knitwear and
woven garments in recent months.
CPD: IRBD FY05 (First Interim) 50
Whilst pharmaceuticals showed a negative import growth of (-) 27.3 percent, all major
commodities other than food grains experienced modest to high growth rates during the
first three months of FY05. Among others, iron and steel, capital goods and imports by
EPZ registered notable growth rates of 31.1 percent, 28.1 percent and 29.9 percent
respectively.
Notwithstanding some concern that Bangladesh’s development growth is largely
dominated by the service sector, and the contribution of the real sector is declining, the
high growth in imports of raw materials and capital machineries is a positive
development which is expected to have favourable impact on investment and growth in
real economy.
6.3 Opening and Settlement of Import LCs
Growth of import during the early months of FY05 is also substantiated by the data on
fresh opening and settlements of import letter of credits (LCs). During the July to
November period of FY05, LCs worth about US$ 4944.41 million were settled,
registering a growth of 15.6 percent during the first five months of FY05 over the
corresponding period of the previous fiscal year. In line with the actual import data,
import of food grains in terms of settlement of LCs also declined by about (-) 4.6 percent
during the period under reporting. LC settlement on account of imports of consumer
goods however increased by 19.0 percent. When imports of food grains are excluded,
settlement of import LCs shows a 15.3 percent rise during the period under reporting.
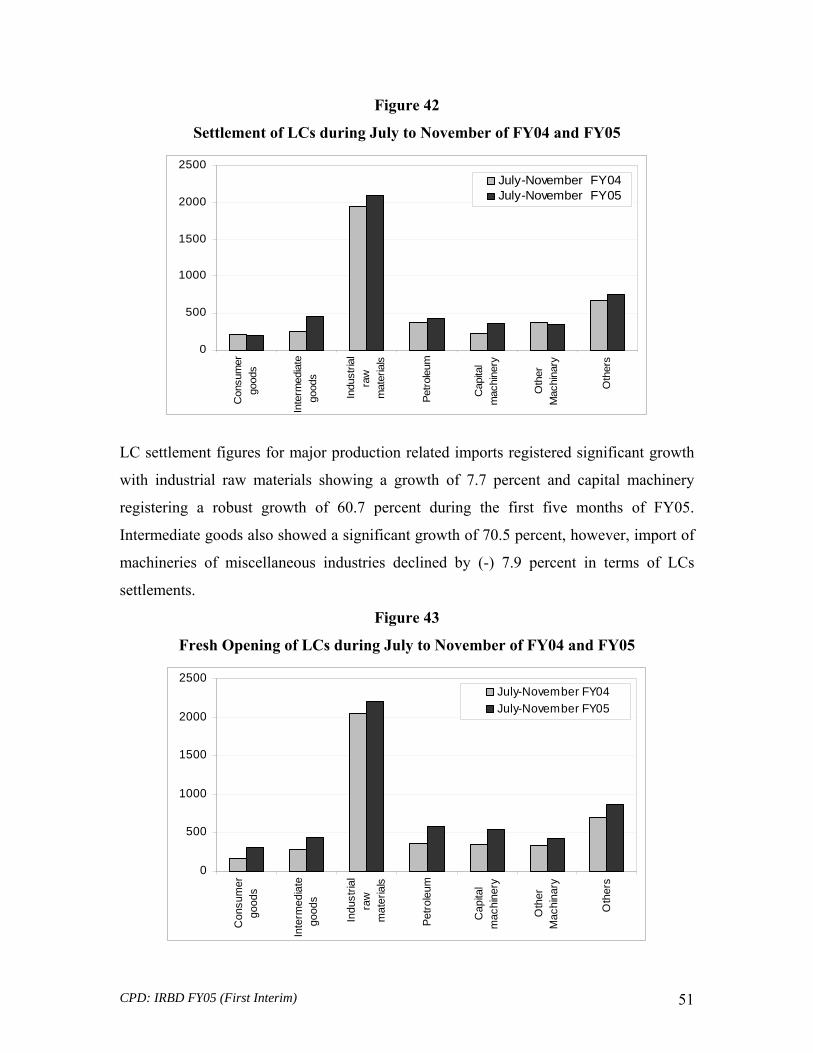
CPD: IRBD FY05 (First Interim) 51
Figure 42
Settlement of LCs during July to November of FY04 and FY05
0
500
1000
1500
2000
2500
Con
sum
ergo
ods
Inte
rmed
iate
good
s
Indu
stria
lra
wm
ater
ials
Petro
leum
Cap
ital
mac
hine
ry
Oth
erM
achi
nary
Oth
ers
July-November FY04July-November FY05
LC settlement figures for major production related imports registered significant growth
with industrial raw materials showing a growth of 7.7 percent and capital machinery
registering a robust growth of 60.7 percent during the first five months of FY05.
Intermediate goods also showed a significant growth of 70.5 percent, however, import of
machineries of miscellaneous industries declined by (-) 7.9 percent in terms of LCs
settlements.
Figure 43
Fresh Opening of LCs during July to November of FY04 and FY05
0
500
1000
1500
2000
2500
Con
sum
ergo
ods
Inte
rmed
iate
good
s
Indu
stria
lra
wm
ater
ials
Petro
leum
Cap
ital
mac
hine
ry
Oth
erM
achi
nary
Oth
ers
July-November FY04July-November FY05

CPD: IRBD FY05 (First Interim) 52
The observed growing trend in import is likely to persist in the subsequent months as LCs
worth US$ 5764.53 million has been opened by the importers during the first five months
of FY05, registering an impressive 26.5 percent growth over the corresponding period of
the previous fiscal year. After a negative trend in growth, both in terms of actual import
and LC settlement, import of food grains has registered a significant positive growth of
83.9 percent in terms of LC opening; which has contributed to the considerable growth of
45.7 percent for consumer goods imports during the same period. Evidently, the impact
of flood 2004 has caught on with Bangladesh’s import figures.
Figure 44
Growth Rates of Opening and Settlement of LCs FY05 over FY04 (July to November)
-20
0
20
40
60
80
100
Consumergoods
Intermediategoods
Industrial rawmaterials
Petroleum Capitalmachinery
OtherMachinary
Others
perc
ent
Grow th of Opening of L/CsGrow th of Settlement of L/Cs
Import of industrial items such as industrial raw materials (7.6 percent), petroleum and
petroleum products (59.8 percent), capital machinery (56.5 percent) and machinery of
miscellaneous industries (27.4) have also demonstrated impressive growth in terms of LC
opening during the July-November period of FY05.
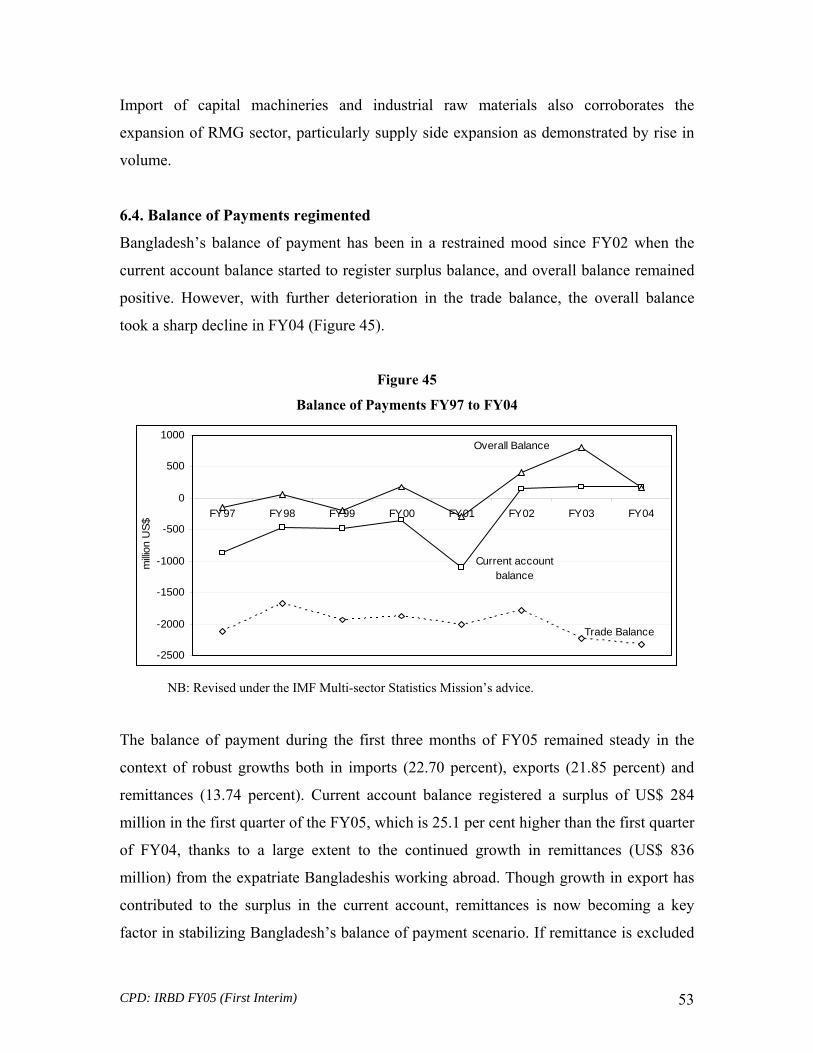
CPD: IRBD FY05 (First Interim) 53
Import of capital machineries and industrial raw materials also corroborates the
expansion of RMG sector, particularly supply side expansion as demonstrated by rise in
volume.
6.4. Balance of Payments regimented
Bangladesh’s balance of payment has been in a restrained mood since FY02 when the
current account balance started to register surplus balance, and overall balance remained
positive. However, with further deterioration in the trade balance, the overall balance
took a sharp decline in FY04 (Figure 45).
Figure 45
Balance of Payments FY97 to FY04
Trade Balance
Current account balance
Overall Balance
-2500
-2000
-1500
-1000
-500
0
500
1000
FY97 FY98 FY99 FY00 FY01 FY02 FY03 FY04
milli
on U
S$
NB: Revised under the IMF Multi-sector Statistics Mission’s advice.
The balance of payment during the first three months of FY05 remained steady in the
context of robust growths both in imports (22.70 percent), exports (21.85 percent) and
remittances (13.74 percent). Current account balance registered a surplus of US$ 284
million in the first quarter of the FY05, which is 25.1 per cent higher than the first quarter
of FY04, thanks to a large extent to the continued growth in remittances (US$ 836
million) from the expatriate Bangladeshis working abroad. Though growth in export has
contributed to the surplus in the current account, remittances is now becoming a key
factor in stabilizing Bangladesh’s balance of payment scenario. If remittance is excluded

CPD: IRBD FY05 (First Interim) 54
(which is about 37 percent of the total export earnings) the current account balance
during this period would decline to a deficit figure of (-) US$ 552 million.
Figure 46
Balance of Payment Scenario During Jul-Sep in FY04-05
-600
-400
-200
0
200
400
600
800
1000
1200
TradeBalance
Services(net)
Income (net) Currentt ransfers
Currentaccountbalance
Capitalaccount (net)
Financialaccount
Error andommissions
OverallBalance
ReserveAssets
FY04 (Jul-Sep)FY05 (Jul-Sep)
Deficit in the trade balance increased by about 27.9 percent during the first quarter of
FY05 compared to the corresponding figure of pervious year. However, there was some
decrease in the deficit of trade in services. The net service balance during the July-
September period stood at (-) US$ 158 million in FY05, which is about 18 percent less
than the service deficit of FY04 (US$ -192 million). The surplus of the current account
balance was diluted somewhat by a fall (by about 13.62 percent) in the net earnings. The
current transfers registered a robust growth of about 15 percent, contributing to the above
mentioned current account surplus.
Balance of the financial account during the first quarter of the fiscal year showed
encouraging signs rising from US$49 million in FY04 to US$ 268 million. Though
foreign direct investment showed a marginal 6.3 percent growth, a nagging concern is
that a substantial part of this came in the form of medium and long term loans and not in
the form of investment.

CPD: IRBD FY05 (First Interim) 55
6.5 Flow of Remittance Continuing Escalation
As was mentioned earlier, the flow of worker’s remittance sent by the expatriate
Bangladeshis has now become a significant contributor to the total forex earnings and
current account balance of the country. During the first half of FY05, remittance has
registered a robust 14.2 percent growth compared to the 8.0 percent growth posted during
the same period of FY04 over the corresponding period of the previous fiscal year. An
amount of US$ 1801.36 million was remitted through the official channel during the
July-December period of FY05, as against US$ 1578.06 million during the corresponding
period of FY04.
Figure 47
Flow of Remittances During Jul-December in FY01-FY05
0
200
400
600
800
1000
1200
1400
1600
1800
2000
FY01 FY02 FY03 FY04 FY05
milli
on U
S$
0
5
10
15
20
25
30
35
perc
ent
Remittances (July-December) Growth (Point-to-Point)

CPD: IRBD FY05 (First Interim) 56
Figure 48
Monthly Trend in the Flow of Remittances During FY04-FY05
0
50
100
150
200
250
300
350
400
Jul
Aug
Sep Oct
Nov
Dec
milli
on U
S$
0
5
10
15
20
25
30
35
perc
ent
FY04 FY05 Growth (point-to-point)
Remittance observed growth in every month during the first half of FY05 and in
December the monthly growth (on a point to point basis) reached up to 31 percent. The
growth of remittance was slightly higher during the second quarter of FY05 (14.4
percent) than the first quarter (13.8 percent) of the same year.
It is to be noted that in recent years the role of remittance in the payments of import and
in restocking the foreign exchange reserve has increased significantly. However,
remittance as percentage of export has decreased from 43.2 percent during July-October
period FY04 to 39.3 percent during the corresponding period of FY05, in the face of
relatively higher growth of export of goods (19.1 percent). Nonetheless, after the
moderate growth rates visible in the 1990s, remittance experienced robust growth rates
from FY02 and during the July-December period of FY03, this growth rate was as high
as 31 percent. Thus, the relatively moderate growth of remittance during the first six
months of FY05 is not a surprise taking into account the high benchmark during the
previous years.
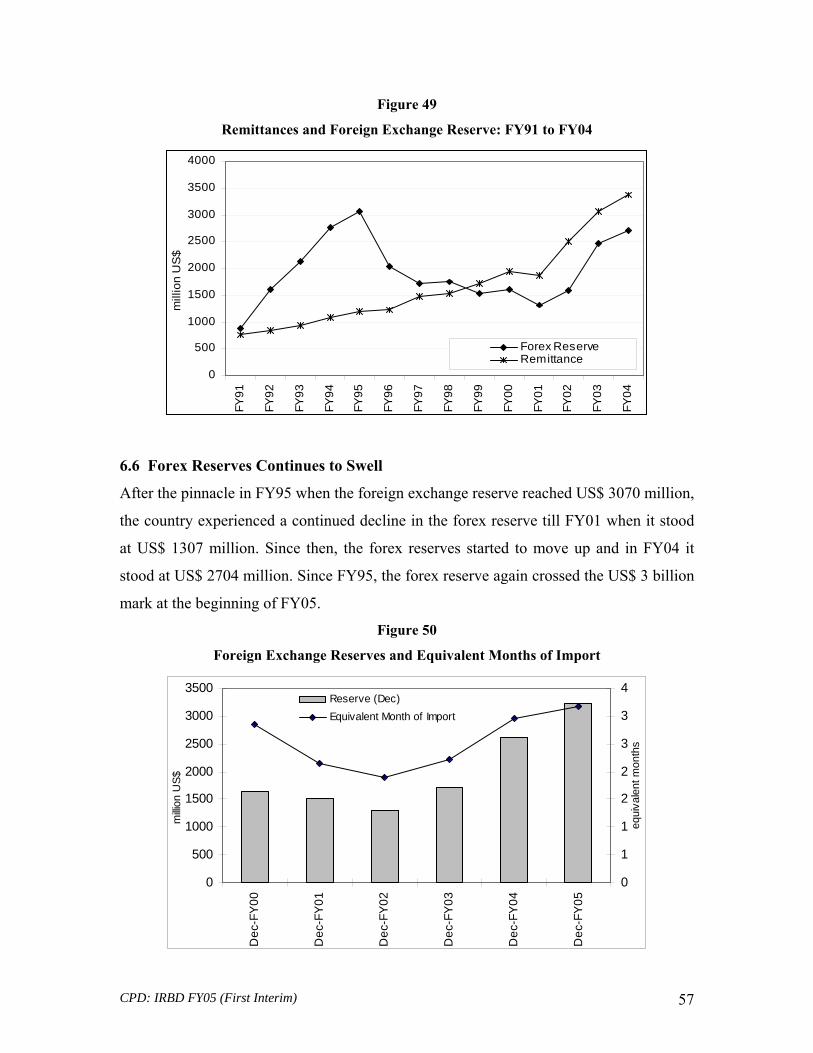
CPD: IRBD FY05 (First Interim) 57
Figure 49
Remittances and Foreign Exchange Reserve: FY91 to FY04
0
500
1000
1500
2000
2500
3000
3500
4000
FY91
FY92
FY93
FY94
FY95
FY96
FY97
FY98
FY99
FY00
FY01
FY02
FY03
FY04
mill
ion
US
$
Forex ReserveRemittance
6.6 Forex Reserves Continues to Swell
After the pinnacle in FY95 when the foreign exchange reserve reached US$ 3070 million,
the country experienced a continued decline in the forex reserve till FY01 when it stood
at US$ 1307 million. Since then, the forex reserves started to move up and in FY04 it
stood at US$ 2704 million. Since FY95, the forex reserve again crossed the US$ 3 billion
mark at the beginning of FY05.
Figure 50
Foreign Exchange Reserves and Equivalent Months of Import
0
500
1000
1500
2000
2500
3000
3500
Dec
-FY
00
Dec
-FY
01
Dec
-FY
02
Dec
-FY
03
Dec
-FY
04
Dec
-FY
05
milli
on U
S$
0
1
1
2
2
3
3
4
equi
vale
nt m
onth
s
Reserve (Dec)Equivalent Month of Import

CPD: IRBD FY05 (First Interim) 58
Forex reserve at the end of December 2004 stood at US$ 3222.57 million, which is about
23 percent higher than the corresponding figure of previous year. So Bangladesh has
started the new calendar year 2005 with a forex reserves that is equivalent to slightly
higher than three months of import. Both remittance and export played significant role in
achieving this target. However, an equally higher growth of import (25.5 percent) during
this period has kept the reserve at a modest level in terms of the equivalent months of
import. In spite of the recent upturn in the reserves, given that imports are rising, the
current growth momentum in reserves may not be sustained in the coming months.
Figure 51
Decomposition of Sources of Import Financing+
0%
20%
40%
60%
80%
100%
FY00 FY01 FY02 FY03 FY04 FY04 (Jul-Sep)
FY05 (Jul-Sep)
Worker'sRemittances Export Earnings Services Other*
Note: + Assuming the share of different sources of forex reserves equal to the share of
import financing.
* Others include current transfers other than remittances, foreign capital and
income from abroad)

CPD: IRBD FY05 (First Interim) 59
A decomposition of import financing11 shows that the share of export earnings in import
payment is increasing, while the share of remittance is showing a negative growth during
last couple of years. Share of export has increased from around 59 percent in FY03 to
around 66 percent during the first quarter of FY05. Conversely, the share of remittances
has decreased from around 28 percent in FY03 to around 24 percent during the first three
months of FY05. Bangladesh will need to put special emphasis to increase its foreign
reserve from multiple sources.
6.7 Foreign Aid Failed to Supplement Growth Instruments
The declining trend of foreign aid disbursement deteriorated further in FY04 when it
came down to US$ 954 million from that of US$ 1577 million in FY03; registering a (-)
39.5 percent negative growth. Paradoxically, in the context of weak capacity to utilise
this lowering trend of aid commitment, Bangladesh is experiencing a ballooning aid
pipeline (approaching US$ 7.0 billion). During FY04, only 82 percent of the total project
aid was utilized in the ADP, while for the first quarter of FY05, this ratio is only 10
percent. Besides, the discrepancy between the commitment and disbursement is
increasing systematically.
Figure 52
Flow of Foreign Aid in Bangladesh During FY90-04
0
500
1000
1500
2000
2500
3000
FY90
FY91
FY92
FY93
FY94
FY95
FY96
FY97
FY98
FY99
FY00
FY01
FY02
FY03
FY04
milli
on U
S$
Commitment Disbursement Linear (Disbursement)
11 Assuming the share of different sources of forex reserves equal to the share of import financing.

CPD: IRBD FY05 (First Interim) 60
Latest available statistics for the first four months of FY05 shows that the flow of foreign
aid has increased both in terms of commitment and disbursement. Commitment of
foreign aid during the July-October period of FY05 stood at US$ 354.0 million, when the
corresponding figure for FY04 was US$ 136.6 million. Disbursement of foreign aid was
even higher that stood at US$ 575.0 million during this period, while the matching figure
for the previous fiscal year was US$ 209.2 million. Though the disbursement of foreign
aid was about 2.7 fold when compared to the corresponding figure of the previous fiscal
year, this was largely due to the lower benchmark of FY04.
However the dynamics of aid disbursement during the first four months of FY05 is rather
disturbing, as there is no food and commodity aid during this period and in the total
volume of project aid, the ever increasing share of loan is even higher this time, more
than 98.3 percent: foreign loan US$ 565.0 million and foreign grant US$ 10.0 million.
Figure 53
Flow of Foreign Aid During July to October of FY04-05
0
100
200
300
400
500
600
700
FY04 (Jul-Oct) FY05 (Jul-Oct)
milli
on U
S$
Commitment Disbursement
In the context of the scarcity of savings and investment, foreign aid plays a very
insignificant role to stimulate growth in Bangladesh as it does not adequately supplement
to the savings and investment. It is argued that to achieve a given growth rate, adequate
savings for investment and sufficient foreign exchange to buy the capital goods necessary
for development is essential. According to some theoretical models, if a country is
deficient in either area, then foreign aid can fill the gap either by providing foreign saving

CPD: IRBD FY05 (First Interim) 61
to supplement inadequate domestic saving or by providing the necessary foreign
exchange to buy the goods and services in the international market that the country
requires for development but cannot produce on its own.12
Figure 54
Declining Foreign Aid in the Context of Stagnated Domestic Savings
0
5
10
15
20
25
30
perc
ent
DomesticSavings aspercent ofGDP
ODA aspercent ofGDP
NationalSavings aspercent ofGDP
However, as shown by the above figure, when the domestic savings of the country
declined or stagnated, the flow of foreign aid also declined and remained as a marginal
proportion of GDP. Since foreign aid does not add significantly to total national saving
and rather shows a diminishing trend, it is not likely to promote growth in Bangladesh
(on the contrary, several studies have established a negative relationship between the
domestic savings and foreign aid in Bangladesh13). Even the possibility is; this limited
amount of foreign aid also goes to consumption and not to investment14.
12 H.B. Chenery and A.M. Strout, "Foreign Assistance and Economic Development," American Economic Review, vol. 56 (September 1966), pp. 679-733. 13 Supported by the pioneering works of Sobhan and Islam (1988), Rahman and Rahman (1982) and also by the recent study of Razzaque and Ahmed (2000). Studies have found that by making resource relatively easily available, external flows allowed for a relaxation in saving effort by the governments and encouraged an increase in consumption. Consequently, external flows may particularly impede public saving, and also, private savings (Ahmed and Ahmed, 2002). Griffin and Enos (1970) termed this relationship as the ‘fungibility of aid’. 14 However this is a common scenario in many of the developing countries as was found in the works of Peter Boone (.1996. "Politics and the Effectiveness of Foreign Aid," European Economic Review, vol. 40, pp. 289-329).

CPD: IRBD FY05 (First Interim) 62
PART B

CPD: IRBD FY05 (First Interim) 63
VII. ASSESSMENT OF FLOOD 2004
7.1 Background
Flood 2004 has been one of the most severe floods in the recent history of Bangladesh
since the last major flood in 1998. In view of the severity of Flood 2004, and its possible
impact on the economy and implications for policies to be pursued in terms of post flood
rehabilitation, CPD undertook a study in July-August 2004 on Rapid Assessment of Flood
2004 under its IRBD programme.
As the flood continued through August and there was heavy rainfall in early September
some of the areas of the country CPD continued to work on updating the findings of the
study including the damage estimates, and also has put under scrutiny developments as
regards implementation of the government’s rehabilitation programme.
In order to carry out the study, CPD has adopted the following methodology: i. Generation of information from primary sources; ii. Collection of information from secondary and unpublished sources; and iii. Validation of the information and study findings through dialogues with policy
makers, experts and knowledgeable persons.
Primary information was collated from field surveys. Secondary sources of information
included: (i) media (both print and electronic); (ii) government ministries and agencies;
and (iii) private sectors and trade bodies.
In order to generate primary information from flood affected areas, CPD sent three teams,
each consisting of two CPD researchers, to a number of flood-hit areas. CPD teams
visited eleven Upazillas in nine districts of the country.
To discuss and validate an earlier draft of the findings, CPD held an in-house dialogue on
9 August 2004 with a number of high level policymakers working with the government,
top level former bureaucrats, NGO leaders, experts and academics. CPD received
important insights and information from this dialogue. The report was also shared with
the print and electronic media through a press briefing on 12 August 2004 in order to
disseminate the findings of CPD’s rapid assessment and recommendations which

CPD: IRBD FY05 (First Interim) 64
emerged from the study and dialogues with stakeholders. CPD also shared the findings
and recommendations of the flood assessment study with the government.
In the second phase CPD members made reconnaissance field level visits in some of the
areas which were visited by CPD members in August 2004 during the flood. In order to
understand the coping mechanism of the flood victims and post-flood rehabilitation
activities CPD sent a team of two members to two districts in November 2004.
Secondary information on updated damage estimates and post flood rehabilitation
programmes were collected from government ministries and agencies. Information were
also collected on damages caused to various sectors of the economy due to torrential rain
in August.
On the basis of the updated information collected from various official sources CPD has
estimated the damages due to Flood 2004 and damages due to heavy rain. The second
phase of the study also compares CPD’s policy recommendations provided in CPD’s
initial Rapid Assessment of Flood 2004 with the GOB implementation policies.
7.2 Damage Assessment
Updated Damage Estimates: CPD’s preliminary (up to 4 August 2004) estimates of
damage due to Flood 2004 was to the tune of Tk. 11,418.6 crore or US$ 1.93 bln with an
anticipation of ranging to Tk. 15,000 (US$2.5 billion) after the final assessment. The
CPD study on assessment of Flood 2004 covers five major affected sectors for estimating
the total damage caused by the flood. These broad sectors are: (1) Agriculture, (2)
Infrastructure, (3) Industry, (4) Education, and (5) Health. Table 3 presents both the
preliminary and updated damage estimates which show that CPD’s updated damage
estimate due to Flood 2004 stands at about Tk. 11,760 crore (US$ 1.99 bln). This is about
Tk 341 crore more than CPD’s earlier estimate. Ten districts were affected due to heavy
rainfall that followed Flood 2004. If the impact of heavy rainfall is accounted for, the
damage for the agricultural sector (crop and fisheries) stands at Tk. 1733.8 crore (US$
0.29 bln). Consequently, CPD’s final damage estimates due to flood and rain increases to

CPD: IRBD FY05 (First Interim) 65
about Tk.13,493.8 crore or US 2.29 bln. This is about 4.05 percent of total GDP for the
FY2004. In formation on the impact of rainfall on other sections was not available. Apart
from the infrastructure and residential sectors all estimates of damage due to flood has
remained unchanged in CPD’s reestimate.
TABLE 3 SUMMARY OF CPD’S DAMAGE ESTIMATES
Preliminary Damage Estimate Updated Damage Estimate
Amount (Tk. Crore)
Share (%) of Total Damage
Amount (Tk. Crore)
Share (%) of Total
Damage
Damage from Heavy Rainfall
(Tk.Crore)
Sector
1 2 3 4 5
Total Damage due to Flood and Rain (Tk.
Crore)
Agriculture 2920.0 25.6 2920.0 24.8 1733.8 Infrastructure 3867.0 33.9 4017.6 34.2 Residential 3706.0 32.5 3896.8 33.1 Industry 531.7 4.7 531.7 4.5 Education 345.4 3.0 345.4 2.9 Health 48.5 0.4 48.5 0.4 Aggregate 11418.6
(US$1.93 bln) 100.0 11760.0
(US$1.99 bln) 100.0 1733.8
(US$0.29 bln) 13,493.8
(US$2.29 bln) Public Sector 4303.0 37.7 4453.6 37.9 Private Sector 7115.6 62.3 7306.4 62.1 GDP (2003-04) 332567.0 332567.0 Damage as % of GDP
3.4 3.5 4.05
Note: 1. Agriculture sector includes crops, fisheries and livestock. Infrastructure sector includes roads, bridges
and culverts, railways, embankments, irrigation canals. 2. Income loss due to flood is not considered. Private sector Industry data is partial. 3. Damage in agriculture sector due to heavy rainfall includes the crop and fisheries sectors. Memo: 1. Estimated Damage of 1998 flood was 4.7% of the GDP of 1998-99 (Chowdhury, Islam and
Bhattacharya 1998) 2. The upper bound of the initial CPD damage estimates was predicted to be Tk. 15,000 crore (4.5% of
GDP) Comparison of Damage Estimates: CPD’s preliminary assessment was the first one of its
kind to come up with a damage estimate of Flood 2004 with the application of a scientific
methodology. Following CPD’s study a number of attempts have been made by other
organisations to estimate the damages incurred due to flood such as the joint assessment
by the Asian Development Bank and World Bank and the Institute of Cost Management
Accountant (ICMA). The UN mission in Bangladesh and the GOB had also quoted some
damage estimates. Except the ADB-World Bank assessment all the other estimates are
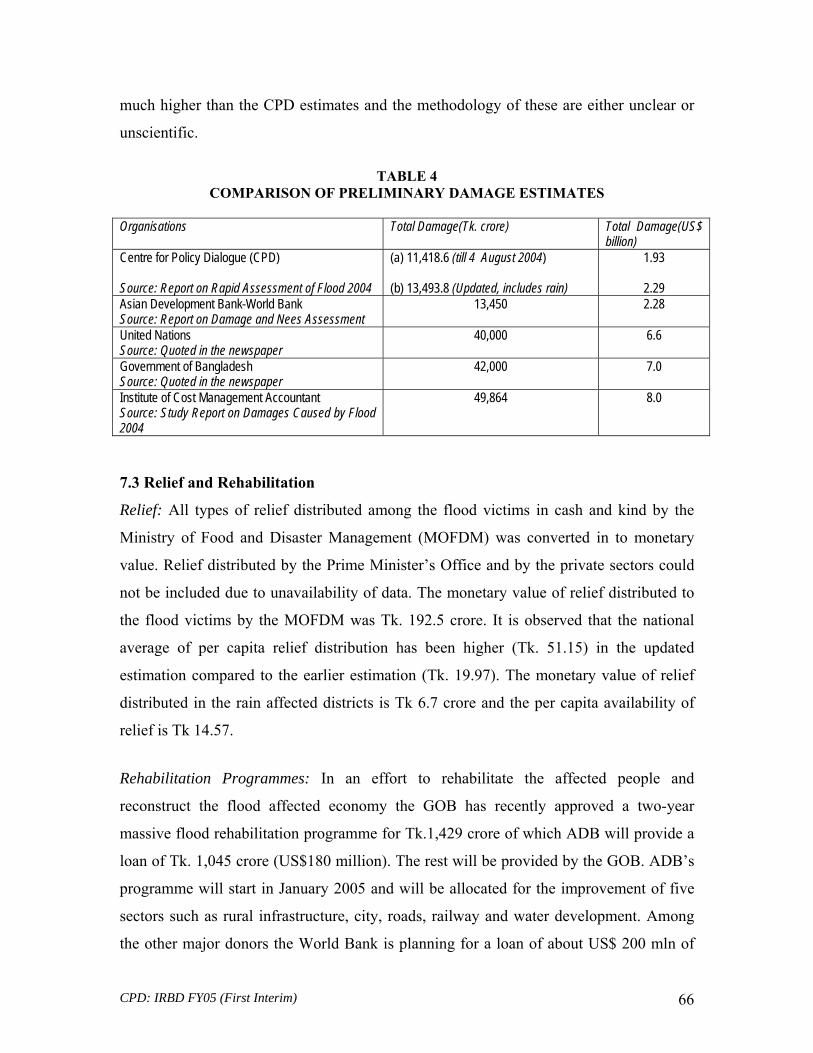
CPD: IRBD FY05 (First Interim) 66
much higher than the CPD estimates and the methodology of these are either unclear or
unscientific.
TABLE 4
COMPARISON OF PRELIMINARY DAMAGE ESTIMATES
Organisations
Total Damage(Tk. crore) Total Damage(US$ billion)
Centre for Policy Dialogue (CPD) Source: Report on Rapid Assessment of Flood 2004
(a) 11,418.6 (till 4 August 2004) (b) 13,493.8 (Updated, includes rain)
1.93
2.29 Asian Development Bank-World Bank Source: Report on Damage and Nees Assessment
13,450 2.28
United Nations Source: Quoted in the newspaper
40,000 6.6
Government of Bangladesh Source: Quoted in the newspaper
42,000 7.0
Institute of Cost Management Accountant Source: Study Report on Damages Caused by Flood 2004
49,864 8.0
7.3 Relief and Rehabilitation
Relief: All types of relief distributed among the flood victims in cash and kind by the
Ministry of Food and Disaster Management (MOFDM) was converted in to monetary
value. Relief distributed by the Prime Minister’s Office and by the private sectors could
not be included due to unavailability of data. The monetary value of relief distributed to
the flood victims by the MOFDM was Tk. 192.5 crore. It is observed that the national
average of per capita relief distribution has been higher (Tk. 51.15) in the updated
estimation compared to the earlier estimation (Tk. 19.97). The monetary value of relief
distributed in the rain affected districts is Tk 6.7 crore and the per capita availability of
relief is Tk 14.57.
Rehabilitation Programmes: In an effort to rehabilitate the affected people and
reconstruct the flood affected economy the GOB has recently approved a two-year
massive flood rehabilitation programme for Tk.1,429 crore of which ADB will provide a
loan of Tk. 1,045 crore (US$180 million). The rest will be provided by the GOB. ADB’s
programme will start in January 2005 and will be allocated for the improvement of five
sectors such as rural infrastructure, city, roads, railway and water development. Among
the other major donors the World Bank is planning for a loan of about US$ 200 mln of

CPD: IRBD FY05 (First Interim) 67
which US$ 40 mln is new assistance and US$ 160 mln is old money which remained
unutilised and will be cancelled if not utilised. The UN flash appeal for US$ 210 mln to
help the flood victims for six months could generate about US$ 42 mln till October 2004
Insights from the Filed on Rehabilitation: CPD team visited Dhunat and Sirajganj Sadar
upazillas of Bogra and Sirajganj districts respectively during the second round of
information collection. The team found that the reconstruction of road and bridges has
not started as yet though the preparation to call for tenders is almost complete. The
schools and colleges which have started to operate after the flood also need to be
renovated. Small dams have been reconstructed by the local people. The rehabilitation
programme for the agriculture sector which included distribution of seed for ropa aman,
boro, wheat, maize, lintels, mustard, chilli, fingerlings for fisheries and cash to buy goat
and poultry has been appreciated by the people. NGOs undertook similar programmes. In
Dhunat upazilla 16,000 VGF cards were distributed till date for an amount of 160 metric
tonnes of rice. A few houses were built with the support of the government and NGOs.
About 80-100 houses were built in Dhunat with the help of a non-resident Bangladeshi.
The presence of NGOs in Sirajganj is less compared to Dhunat.
7.4 CPD’s Recommendations and GOB Initiatives
In its preliminary report CPD presented a policy package for addressing the post flood
situation during the fiscal year 2004-05 which was derived from revisiting the experience
of the earlier flood, taking note of the macroeconomic parameters and performance of the
real economy, and reviewing the emerging trend of the global economic environment.
This policy package included both short-term measures (August-October 2004, i.e. till
aman is harvested) to deal with relief activities and medium-term measures August 2004-
June 2005 i.e. till end of the fiscal year) to address rehabilitation and reconstruction
programmes. CPD’s policy package were related to macroeconomic framework, public
finance, credit expansion and inflation, external sector, real economy (agriculture,
industry, infrastructure), safety net, government micro-credit and utilisation of foreign
aid. During the last few months GOB has undertaken various programmes for relief and
rehabilitation many of which are in line with CPD’s recommendations. However, many
more are yet to be undertaken to address the flood affected people and areas.

CPD: IRBD FY05 (First Interim) 68
CPD recommended for an expansionary macroeconomic framework which essentially
include increased public expenditure (investment) and greater flow of credit (both
industrial and agricultural) to the private sector. CPD recommended that at least Tk.
5,000 crore has to be disbursed as agricultural credit and recovery may be suspended till
harvesting of aman crop while a special programme for boro crop has to be undertaken as
well. The government has decided to disburse Tk. 5,537.91 crore during FY2004-05
through nationalised commercial banks and specialised banks. NCBs and specialised
banks disbursed Tk. 1,154.78 crore during July-October 2004, which was 58 per cent
higher than that of the same period during the last fiscal year.
CPD’s report clearly stated that domestic resources can, by and large, finance the
reconstruction work. Available information suggests that the government mostly relied
on its own budgetary resources. CPD also recommended that within the public
expenditure portfolio, activities and projects related to rehabilitation and reconstruction
should get priority. The government has taken the decision to reallocate 10 percent of the
ADP for rehabilitation and reconstruction activities, which is about Tk. 2,200 crore.
Though it is too early to make any assessment as regards the utilisation of the block
allocations kept in the ADP, such allocations remained unutilised till September 2004.
CPD recommended that there should be a plan beyond aman season and provision for
seed, fertiliser and irrigation during aman and boro seasons at free of cost to the marginal
farmers. CPD report added that in view of the rise in global price of oil and upward
revision of domestic prices of gas and electricity, the government should consider an
adhoc relief for farmers using diesel operated irrigation. The government has decided to
provide seeds free of cost and fertiliser at reduced rates to the farmers through a
scheduled subsidy amounting to Tk. 271 crore. However, the government has not
considered the suggestion regarding the price of diesel for irrigation. Instead, it has
increased the price of diesel from Tk. 20 to Tk. 23 per litre since December 2004. The
decision to hike the price of diesel will have adverse impact on boro production since
boro relies heavily on irrigation and 83 percent irrigation is done through diesel operated
engines in Bangladesh. This will, in turn, raise the price of rice and have a negative

CPD: IRBD FY05 (First Interim) 69
impact on the availability of food. It may be noted that the total import of food grains
(rice and wheat) by the government and the private sector during July-December 2004
was 1,550 thousand mt compared to 1,851 thousand mt during the same period in the
previous year (FY04). In other words, the total food import in FY05 is 16.3 per cent less
than that of the last fiscal year (FY04). The decrease in import can be attributed mainly to
higher and rising international prices of food grains which are expected to increase
further in the coming months. This is due to lower production prospect of rice in
Thailand, Vietnam and India as a result of abnormal drought. The government should
review the decision of increase in diesel price to ensure food security.
CPD’s policy package suggested the following measures for export oriented industries:
(i) provision of cash compensation scheme and expeditious steps towards timely release
of funds under CCS initiative; (ii) support air cargo shipment of exportables including
RMG, charter cargo planes, if needed; and (iii) advise banks for deferment of loan
recovery for 3-6 months from export-oriented units which have been affected. The
government has increased the CCS support to agricultural and agro-processing goods
from 25 percent to 30 per cent, and has taken an initiative to release Tk. 150 crore for the
knit sector from the CCS fund. The government has also decided for deferment of bank
loan recovery from the affected export oriented units.
In order to ensure food availability and food security of marginal families, repair,
reconstruction and maintenance of flood damaged rural roads through FFW programme
have always been useful. CPD recommended that the amount of food grains to be
distributed through non-priced channels such as VGD, VGF, FFW, TR and GR should be
increased from the planned level of 744 thousand tonnes. The short-term rehabilitation
programmes of the government of Bangladesh included creation of a Disaster Risk
Mitigation Fund of Tk. 75 crore (US$ 12.7 mln) for families with a monthly income of
less than Tk. 3,500, allocation of Tk. 170 crore (US$ 28.5 mln) and 195 thousand mt of
food grains for FFW, and operation of TR programme for repairing and reconstruction of
schools and basic infrastructures. The government also declared that it would feed 40 mln
people till December 2004 under the VGF programme. An analysis of the distribution of
food grains through public food grains distribution system (PFDS) reveals that the

CPD: IRBD FY05 (First Interim) 70
distribution of food grains through FFW and VGD was lower in July-December 2004
(101 thousand mt) than that of July–December 1998 (366 thousand mt) following Flood
1998. This needs to be corrected. The amount of food grains distributed through non-
priced channels during July-December 2004 was 511 thousand mt and the government
has a plan to distribute another 353 thousand mt during January-June 2005. Total
distribution of the priced and non-priced food grains through the PFDS during July-
December 2004 was 637 thousand mt against 631 thousand mt in July-December 1998.
As regards foreign aid, CPD’s policy package stated that the government should take
initiative to receive food aid as much as possible for keeping the safety net programmes
including VGD and VGF. CPD report added that although the government has recently
received a budgetary support of about US$200 mln from the World Bank under the
Development Support Credit II, it will be worthwhile to negotiate expeditiously for a
quick-disbursing budgetary-cum-BOP support of another US$200 mln. The CPD report
suggested that project aid, with its low off-take record, can only be entertained for
dealing with medium to long-term problems related to flood. In an effort to rehabilitate
the affected people and reconstruct the flood affected economy, the government has
recently approved a two-year massive flood rehabilitation programme of Tk.1,429 crore
of which ADB is expected to provide a loan of Tk. 1,045 crore (US$ 180 mln). The rest
will be provided by the government of Bangladesh. ADB’s programme is scheduled to
start in January 2005 and will allocate money for the improvement of five sectors
including rural infrastructure, city, roads, railways and water development. Among the
other major donors the World Bank is planning to provide a loan of about US$ 200 mln
out of which US$ 40 mln will come as new assistance and US$ 160 mln from earlier
earmarked assistance which remained unutilised and would have otherwise been
cancelled. The UN Flash Appeal for US$ 210 mln to help the flood victims for six
months could generate about US$ 42 mln till October 2004.
The following Table presents a comparison of CPD’s recommendations and GOB
initiatives and implementation policy as regards addressing the post-flood economic
situation.

CPD: IRBD FY05 (First Interim) 71
TABLE 5
COMPARISON OF CPD’S RECOMMENDATIONS AND GOB IMPLEMENTATION Areas of Intervention
CPD’s Recommendations GOB Initiative and Implementation Policy Timeline of Implementation
Reconstruction and Rehabilitation
* Activities and projects for rehabilitation and reconstruction should get priority * Domestic resource can, by and large, finance the reconstruction work
* GOB will reallocate 10 percent of ADP (Tk. 2,200 crore) for rehabilitation and reconstruction.
* Block allocation in the ADP unutilised till September 2004
ADP Implementation * Implementation of foreign aided projects should not be disturbed * A moratorium should be imposed on all domestically financed new projects for FY 2005 which are yet to incur expenditures * Projects for implementation of PRSP should be protected * Size of ADP may be revised if non-debt creating resources are available
* Implementation of low-priority development projects will be staggered and may even be carried over to the next fiscal year to make funds available for rehabilitation and reconstruction
Revenue and Fiscal Deficit
* GOB may negotiate with IMF and WB regarding relaxation of the cap on domestic borrowing if there is shortfall in the revenue collection and fiscal deficit
Inflation * Monitor the rise of inflation carefully, resort to Open Market Sale (OMS), if necessary
* Rising food prices due to poor harvest of aman results in high inflation * OMS to be started soon
* Towards the end of January 2005
Exports * Support for air cargo shipment of exportables * Timely release of funds under Cash Compensation Scheme (CCS) * Deferment of bank loan recovery for 3-6 months from affected export oriented units
* Allocation of Tk. 150 crore from Cash Compensation Scheme (CCS) * Bank loan recovery for the affected export oriented units deferred
Imports * Imports of CI sheet and cement may be facilitated * Import of food grains needs to be facilitated
* During October foodgrain imports were 108 thousand metric tonnes higher than that of the same period in 2003
Agriculture * Seed, fertilizer and irrigation for aman and boro crop at * Government provided farmers with seed free of cost

CPD: IRBD FY05 (First Interim) 72
free of cost to the marginal farmers * At least Tk.5,000 crore has to be disbursed and recovery may be suspended till harvesting of aman crop and a special programme for boro crop * Funds to the SMEs, particularly those without fixed assets as collateral * Increase flow of funds to NGOs through PKSF, NGO Foundation and commercial banks
and fertiliser at reduced rates * Agriculture sector will get Tk 271 crores as subsidy * Nationalised commercial banks and specialized banks disbursed Tk. 1,154.78 crore during July-October 2004 . This is 58% higher than during the same period in last fiscal year * GOB targets to disburse Tk. 5,537.91 crore during FY 2004-05 through NCBs and specialised banks
* 20% of the targeted loans disbursed during July-October 2004
Industry * No new financing facility but improve the efficiency of the existing units * Financial support to SMEs * Cash incentives to export oriented industries
Infrastructure * Prioritise rehabilitation over reconstruction * Reallocation of ADP for repairing and reconstruction * Loans at low interest rate for purchasing house building materials
* Rehabilitation and reconstruction have started * Operation of TR programme for repairing and reconstruction of schools and basic infrastructures
* Being implemented
Safety Net * Increase the amount of food grains in VGD, VGF, FFW and TR, and monitor properly * Full utilization of special funds * Expansion of micro-credit though the NGOs
* Creation of a disaster mitigation fund of Tk. 75 crore * Allocation of Tk. 170 crore and 195,000 mt of food for FFW * 40 mln people will be fed till December under VGF programme
Being implemented
Foreign Aid * GOB may receive food aid as much as possible for safety net programmes * Negotiate for quick disbursement of budgetary-cum-BOP support from the WB
* Received from ADB and World Bank ADB’s programme scheduled to start in January 2005
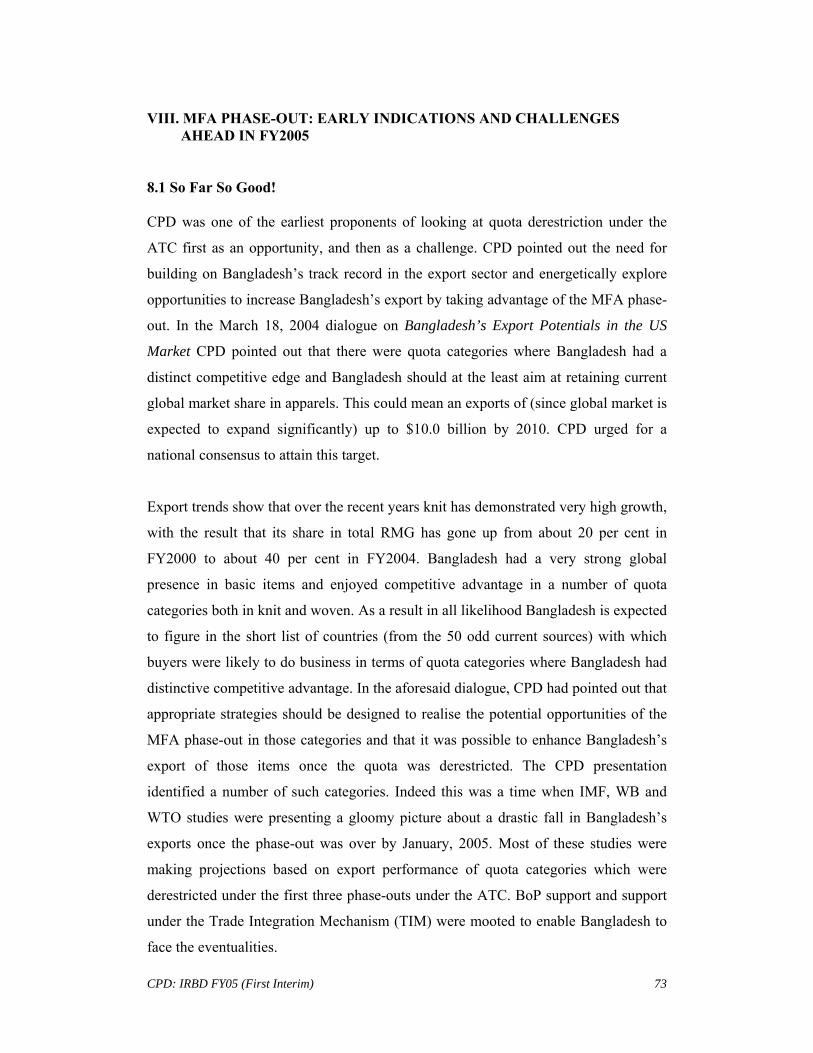
CPD: IRBD FY05 (First Interim)
73
VIII. MFA PHASE-OUT: EARLY INDICATIONS AND CHALLENGES AHEAD IN FY2005
8.1 So Far So Good! CPD was one of the earliest proponents of looking at quota derestriction under the
ATC first as an opportunity, and then as a challenge. CPD pointed out the need for
building on Bangladesh’s track record in the export sector and energetically explore
opportunities to increase Bangladesh’s export by taking advantage of the MFA phase-
out. In the March 18, 2004 dialogue on Bangladesh’s Export Potentials in the US
Market CPD pointed out that there were quota categories where Bangladesh had a
distinct competitive edge and Bangladesh should at the least aim at retaining current
global market share in apparels. This could mean an exports of (since global market is
expected to expand significantly) up to $10.0 billion by 2010. CPD urged for a
national consensus to attain this target.
Export trends show that over the recent years knit has demonstrated very high growth,
with the result that its share in total RMG has gone up from about 20 per cent in
FY2000 to about 40 per cent in FY2004. Bangladesh had a very strong global
presence in basic items and enjoyed competitive advantage in a number of quota
categories both in knit and woven. As a result in all likelihood Bangladesh is expected
to figure in the short list of countries (from the 50 odd current sources) with which
buyers were likely to do business in terms of quota categories where Bangladesh had
distinctive competitive advantage. In the aforesaid dialogue, CPD had pointed out that
appropriate strategies should be designed to realise the potential opportunities of the
MFA phase-out in those categories and that it was possible to enhance Bangladesh’s
export of those items once the quota was derestricted. The CPD presentation
identified a number of such categories. Indeed this was a time when IMF, WB and
WTO studies were presenting a gloomy picture about a drastic fall in Bangladesh’s
exports once the phase-out was over by January, 2005. Most of these studies were
making projections based on export performance of quota categories which were
derestricted under the first three phase-outs under the ATC. BoP support and support
under the Trade Integration Mechanism (TIM) were mooted to enable Bangladesh to
face the eventualities.
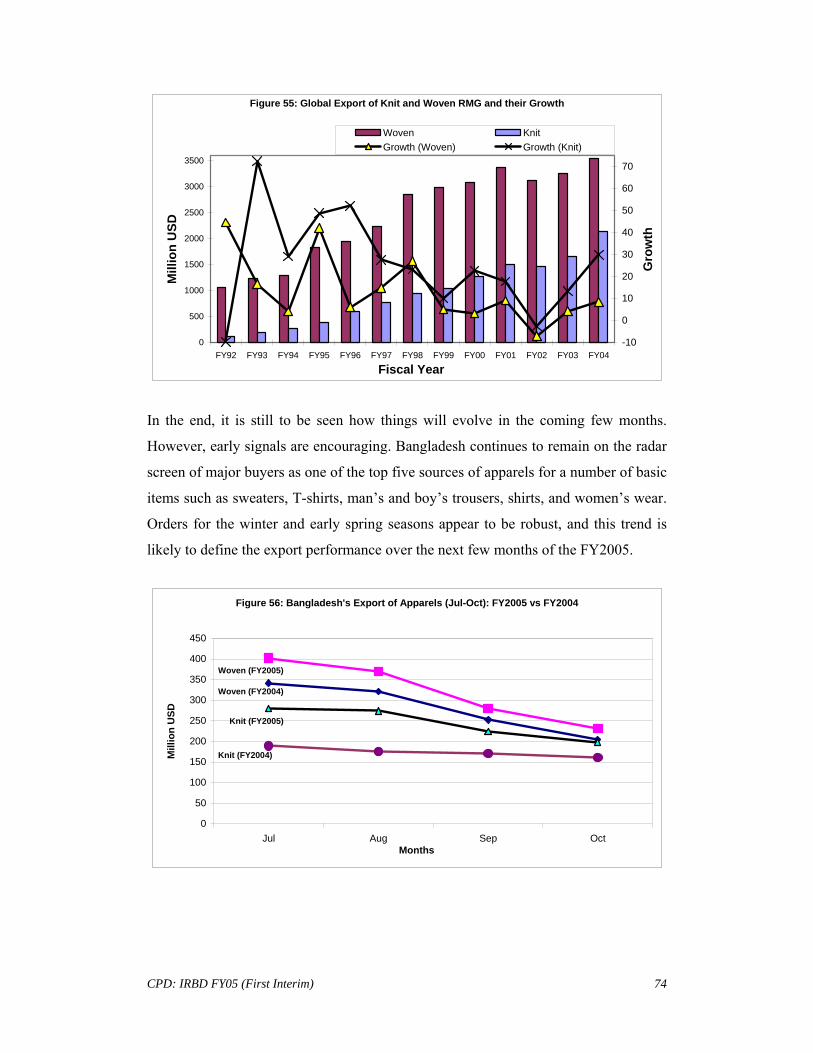
CPD: IRBD FY05 (First Interim)
74
Figure 55: Global Export of Knit and Woven RMG and their Growth
0
500
1000
1500
2000
2500
3000
3500
FY92 FY93 FY94 FY95 FY96 FY97 FY98 FY99 FY00 FY01 FY02 FY03 FY04
Fiscal Year
Mill
ion
USD
-10
0
10
20
30
40
50
60
70
Gro
wth
Woven KnitGrowth (Woven) Growth (Knit)
In the end, it is still to be seen how things will evolve in the coming few months.
However, early signals are encouraging. Bangladesh continues to remain on the radar
screen of major buyers as one of the top five sources of apparels for a number of basic
items such as sweaters, T-shirts, man’s and boy’s trousers, shirts, and women’s wear.
Orders for the winter and early spring seasons appear to be robust, and this trend is
likely to define the export performance over the next few months of the FY2005.
Figure 56: Bangladesh's Export of Apparels (Jul-Oct): FY2005 vs FY2004
0
50
100
150
200
250
300
350
400
450
Jul Aug Sep OctMonths
Mill
ion
USD
Knit (FY2004)
Knit (FY2005)
Woven (FY2005)
Woven (FY2004)

CPD: IRBD FY05 (First Interim)
75
Recent trends show that exports during July-October period of FY2005 was 24.6 per
cent higher compared to the matched period of FY2004, with knit demonstrating a
phenomenal growth of 40.4 per cent and woven a robust growth of 14.7 per cent.
What is of interest is that although export of apparels to the US market has gone down
by 25.9 per cent over the last three years (between FY2001 and FY2004), according
to OTEXA data export from Bangladesh has indeed gone up by 11.9 per cent during
the first four months of FY2005 compared to FY2004. However, an indepth analysis
of the recent performance in the US market shows that export of particular items has
varied – CPD analysis reveals that export of some items have increased between 35 –
400 per cent whilst export of some others decreased by 5–15 per cent. It is important
to identify the winners, and take measures to increase their market share.
8.2 Post-MFA Scenario Will be Different CPD has earlier pointed out that quota phase-out was only one of several factors
which is likely to have an impact on performance of Bangladesh’s e-o RMG sector.
Future global trade in apparels will also depend on other important factors including
China’s accession to the WTO, reduced lead time, erosion of quota-premium
following the quota phase-out, implication of various RTAs and market access
initiatives involving major buying countries, further lowering of MFN tariffs with
consequent erosion of preferential margins, and increasing use of e-commerce in
apparels trade and business. Bangladesh will need to take due note of these emerging
factors.
The challenge of the quota phase-out should be taken with due importance.
Bangladesh’s export of quota categories derestricted in the US market under second
and third phases has come down from $372.10 million in 2001 to $225.49 million in
2003, a fall of 39.40 per cent. In the EU Bangladesh’s exports of derestricted items
over the three phases have come down from $201.85 million to $124.26 million
between 2000 and 2003, a fall of 42.5 per cent. However, it will not be wise to
extrapolate these trends to make simplistic projections, particularly in view of the fact
that quota phase-out was back loaded and under the first three phases only 18.23 per
cent (2001) and 8.18 per cent (2000) of Bangladesh’s respective exports to the US and
CPD: IRBD FY05 (First Interim)
76
EU markets were derestricted. A number of scenarios may be possible depending on
the type of homework Bangladesh is able to do.
Any major shift in global sourcing of apparels will call for large-scale restructuring
and capacity building in countries which will potentially stand to win. Major
competitors such as China, India and Pakistan, with strong backward linkage in
textiles, will require some time to complete their restructuring. Already there are signs
of major investments in the textile/apparels sectors in these countries. These ongoing
restructuring will take some time to make its impact visible in the market place.
Besides much will depend on the ability of Bangladesh’s entrepreneurs to offer lower
prices, in the face of stiff competition from the competing countries. In the recent
past, these entrepreneurs have been able to sustain this pressure, perhaps at the cost of
lower profits, since average price of apparels has gone down by about 15 per cent
over the last few years. There is a need to capture the ongoing restructuring in the
RMG sector and also the ongoing strengthening of the backward linkage industry in
order to fully understand the capacity of Bangladesh’s RMG sector to continue to
show robust performance in the post-MFA apparels market.
No doubt, many of the smaller RMG units in Bangladesh, which have mainly relied
on subcontracts, do not have the capacity to ensure compliance with the various
norms and standards required by the buyers and are not being able to make
productivity gains, will have difficulty to compete in the emerging market. Many of
the smaller firms are likely to face closure and the workers to face layoffs. On the
other hand, many of the larger firms are looking at the quota-free regime as an
opportunity to expand their market presence in the EU, and also in the USA. Thus,
there may be a situation where Bangladesh expands (or at least retains it market share)
but with fewer firms operating in the sector, and with a reduced workforce.
Production of larger volumes by bigger firms may not be able to offset the number of
workers who will lose their jobs; majority of those are likely to be women. In view of
this probable scenario, Bangladesh needs to design appropriate measures for these
workers. CPD has argued for a contingency fund for retraining and redeployment of
such worker’s. Any large scale unemployment in the sector will have serious
consequences in terms of income, poverty and employment. The GOB employers and
CPD: IRBD FY05 (First Interim)
77
other stakeholders should get together to design appropriate measures to address this
possibility.
It also needs to be appreciated that Bangladeshi entrepreneurs will need to pay
increasingly more attention to such issues as minimum wage, working hours, safety
and other indicators of decent labour in their factories. Tomorrow’s apparels market
is likely to become more sensitive to these issues and any negligence on these
accounts will be penalised in terms of market access. The GOB should also setup and
implement strict guidelines with respect to worker’s rights and claim to decent
livelihood in the apparel sector.
It is true that product specific safeguard measures (till 2008) and textile safeguard
measures (till 2013) in China’s accession protocol could offer some relief to
competitors such as Bangladesh. USA has already applied sanctions on Chinese
exports to USA by limiting export of four categories of textiles/apparels (by imposing
cap of 7 per cent on growth). Requests have been made for another 10 categories,
which incidentally include a number of important export items from Bangladesh. EU
has also recently excluded China from the GSP beneficiary list on account of China’s
exceeding the threshold limit of 12 per cent of market share. However, it will not be
wise to overplay the importance of these developments. It may be noted here that
major retailers and importers in the USA have started to question the sanctions, and
has filed law suits challenging such measures by the US Department of Commerce.
8.3 Designing an Appropriate Strategy The Post-MFA Implementation Team set up by the GOB has identified six core areas
for training and skills upgradation: (i) Productivity Management, (ii) Quality
Management, (iii) Compliance Norms, (iv) Merchandising, (v) Marketing, and (vi)
Inventory Management. GOB estimates show that these activities will require an
amount equivalent to $40.0 million. However, till now availability of funds to carry
out such activities have been rather low. There is an urgent need to mobilise domestic
resources and also trade related technical assistance (TRTA) from development
partners in support of these programmes.

CPD: IRBD FY05 (First Interim)
78
The GOB has recently taken a number of steps to address the concerns of the e-o
RMG industry of the country. These include reduced number of steps in terms of
clearance at Chittagong Customs from 56 to 12, and from 48 to 6 at Dhaka Container
Port, change in insurance charges, revised schedule of down payment for loan by
RMG entrepreneurs, and elimination of VAT on selected items of expenditure.
However, a proactive policy, both at global and domestic levels will be required if
opportunities are to be realised, and challenges are to be addressed adequately.
At the Global Level Bangladesh should continue to press for zero-tariff access to the
US market (about $306.0 mln worth of tariff is imposed in USA annually on import of
apparels from Bangladesh). A CPD modelling exercise indicates that such a zero-
tariff access is likely to substantively enhance Bangladesh’s competitive strength in
US market and increase exports by about $1.0 billion or 50 per cent. It is to be noted
in this context that zero-tariff access to the Canadian market in 2001 has helped
Bangladesh to increase her apparels export from $97.9 mln in 2002 to $256.4 mln in
2004, a growth of about 161.9 per cent in two years.
Bangladesh will also need to focus on getting on with the required homework in terms
of reducing the lead time, moving up the value chain ensuring standards-compliance,
investing in technological upgradation and productivity improvement in the RMG
production, and putting in place product and process modification capacities and
markets.
In view of this, there is a need to take some concrete steps to address the emerging
challenges. Some of these, based on CPD analyses, are:
Identify the items that are demonstrating competitive strength and go for
capacity building in those particular areas;
Create a Textile-RMG technology upgradation fund to help process and
product upgradation and modification;
Invest in skill development through public-private partnership. In this regard
Vocational Training Institutes could be linked to the needs of the RMG sector;

CPD: IRBD FY05 (First Interim)
79
It appears that it will be a good idea to put on hold the earlier planned phase-
out of the support under the cash compensation scheme (currently at 10 per
cent);
There is a need to reduce import duties/taxes on textile/RMG spares, dyes,
chemicals and sizing materials;
There is a need to address the request of RMG entrepreneurs to allow import
of fabrics on duty-free basis, particularly and on priority basis for fabrics
(synthetic) that are not produced in Bangladesh (the textile sector’s interest
could be safeguarded through joint monitoring of the facility);
Support the RMG units in putting in place initiatives to ensure decent wage
and worker’s rights, and meet health and safety concerns;
Help introduce a “Compliance Sticker” (ISO-9000, ISO-14000);
Help develop clusters and provide common facilities to RMG units through
policy support (water affluent facilities, training, R&D, Fashion and Design);
Make funds available to the RMG/textile producers at globally competitive
price, particularly in view of increasing buyer pressure on producers to
manage the production chain;
Facilitate establishment of forward linkage activities through B to B web
portals, direct marketing channels (till now the buyers have come to the
doorsteps of Bangladesh’s producers; in the markets of future Bangladesh’s
producers will have to increasingly reach out to the buyers);
Give priority to promotion of investment (both local and FDI) in products with
emerging opportunities (athletic wear, synthetic fibre, 100 per cent polyester).
Prepare a contingency plan in view of exit of firms to help workers retain and
search for jobs (GOB-BGMEA partnership should be developed to this end).

CPD: IRBD FY05 (First Interim)
80
IX. INVESTMENT SCENARIO IN THE PRIVATE SECTOR
9.1.1 Major Advances to a Limited Number of Large and Medium Industries
There has been a significant rise observed in sanction and disbursement of term loan in the first quarter of FY2005 as compared with that of FY2004 (about 115.53% and 61.57% respectively), as well as in working capital financing (64% and 46% respectively). Based on the latest quarterly update (30 June 2004) on sectoral composition of term loan and working capital financing, as shown in Table 6, it is found that large and medium scale manufacturing industries have accounted one-third of total advances, and have been gradually accumulated especially by cotton, and textile industries such as in spinning, weaving, dyeing, printing etc. and also to some extent by iron and steel, drugs and pharmaceuticals, cement and asbestos, plastic and plastic products. Most of these industries have potentials to be globally competitive under the changing scenario of world trade including MFA phase out, duty-free access to some developed countries, and special concession for LDCs etc. Nonetheless, lending rate for industrial credit is still very high, which increases the overall cost and would reduce the competitiveness of these industries. It is found that even local market based industries will be gradually limited to some large scale manufacturing units, which have competitive advantage both with local small scale producers as well as imported products. As a result, less competitive industries and less efficient manufacturing units will be sufferer, unless they can develop their competitive edge in terms of local and/or global markets.
Investment in service sector has mainly concentrated in large scale activities such as
construction, transport and communications, storage, trade etc. targeting the rising
demand for various services especially housing, transport, medical treatment &
consumer goods by a section of urban people who earned relatively more through
engaged in operational activities in industrial and service sectors. Country’s growing
telecommunication industry, which has gradually expanded in semi-urban areas as
well, has received very insignificant amount of advances from local banks; instead
this industry is developed through FDIs, sometimes under joint-venture.
However, a much needed investment required for the improvement of infrastructure
especially power and fuel industries in order to meet the growing demand for energy
in industrial and commercial activities is not met up either by local or foreign
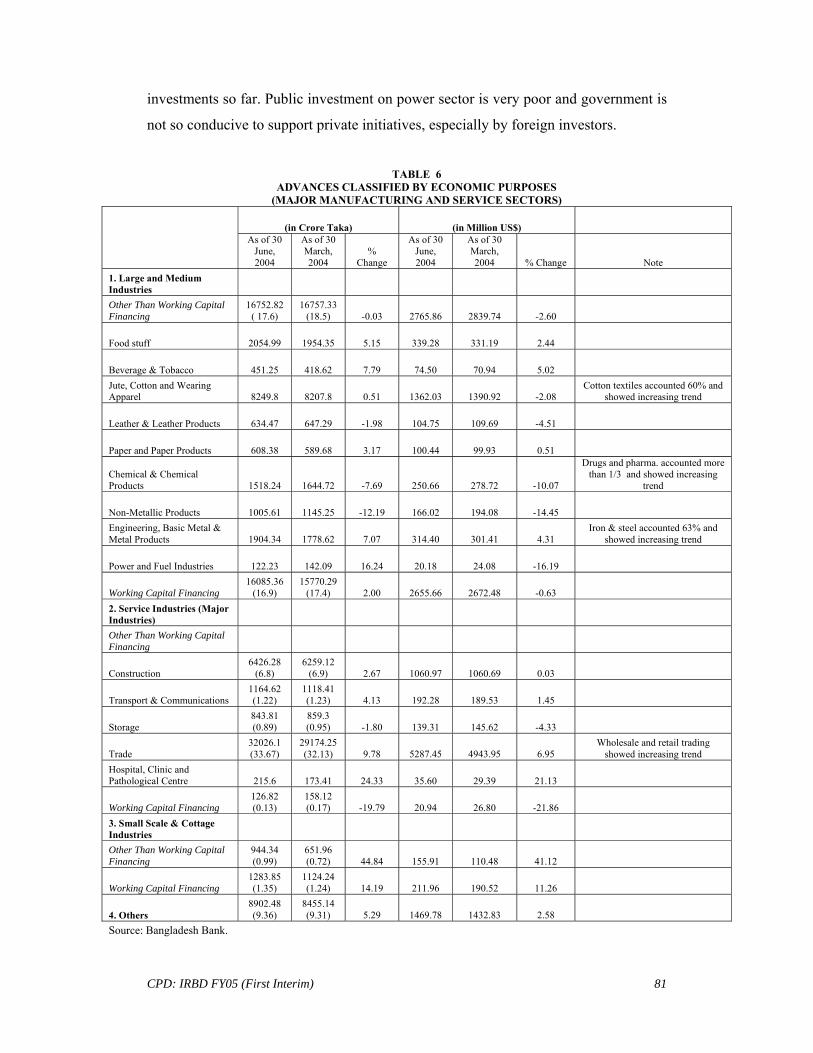
CPD: IRBD FY05 (First Interim)
81
investments so far. Public investment on power sector is very poor and government is
not so conducive to support private initiatives, especially by foreign investors.
TABLE 6
ADVANCES CLASSIFIED BY ECONOMIC PURPOSES (MAJOR MANUFACTURING AND SERVICE SECTORS)
(in Crore Taka) (in Million US$)
As of 30 June, 2004
As of 30 March, 2004
% Change
As of 30 June, 2004
As of 30 March, 2004 % Change Note
1. Large and Medium Industries Other Than Working Capital Financing
16752.82 ( 17.6)
16757.33 (18.5) -0.03 2765.86 2839.74 -2.60
Food stuff 2054.99 1954.35 5.15 339.28 331.19 2.44
Beverage & Tobacco 451.25 418.62 7.79 74.50 70.94 5.02 Jute, Cotton and Wearing Apparel 8249.8 8207.8 0.51 1362.03 1390.92 -2.08
Cotton textiles accounted 60% and showed increasing trend
Leather & Leather Products 634.47 647.29 -1.98 104.75 109.69 -4.51
Paper and Paper Products 608.38 589.68 3.17 100.44 99.93 0.51
Chemical & Chemical Products 1518.24 1644.72 -7.69 250.66 278.72 -10.07
Drugs and pharma. accounted more than 1/3 and showed increasing
trend
Non-Metallic Products 1005.61 1145.25 -12.19 166.02 194.08 -14.45 Engineering, Basic Metal & Metal Products 1904.34 1778.62 7.07 314.40 301.41 4.31
Iron & steel accounted 63% and showed increasing trend
Power and Fuel Industries 122.23 142.09 16.24 20.18 24.08 -16.19
Working Capital Financing 16085.36
(16.9) 15770.29
(17.4) 2.00 2655.66 2672.48 -0.63 2. Service Industries (Major Industries) Other Than Working Capital Financing
Construction 6426.28
(6.8) 6259.12
(6.9) 2.67 1060.97 1060.69 0.03
Transport & Communications 1164.62 (1.22)
1118.41 (1.23) 4.13 192.28 189.53 1.45
Storage 843.81 (0.89)
859.3 (0.95) -1.80 139.31 145.62 -4.33
Trade 32026.1 (33.67)
29174.25 (32.13) 9.78 5287.45 4943.95 6.95
Wholesale and retail trading showed increasing trend
Hospital, Clinic and Pathological Centre 215.6 173.41 24.33 35.60 29.39 21.13
Working Capital Financing 126.82 (0.13)
158.12 (0.17) -19.79 20.94 26.80 -21.86
3. Small Scale & Cottage Industries Other Than Working Capital Financing
944.34 (0.99)
651.96 (0.72) 44.84 155.91 110.48 41.12
Working Capital Financing 1283.85 (1.35)
1124.24 (1.24) 14.19 211.96 190.52 11.26
4. Others 8902.48 (9.36)
8455.14 (9.31) 5.29 1469.78 1432.83 2.58
Source: Bangladesh Bank.
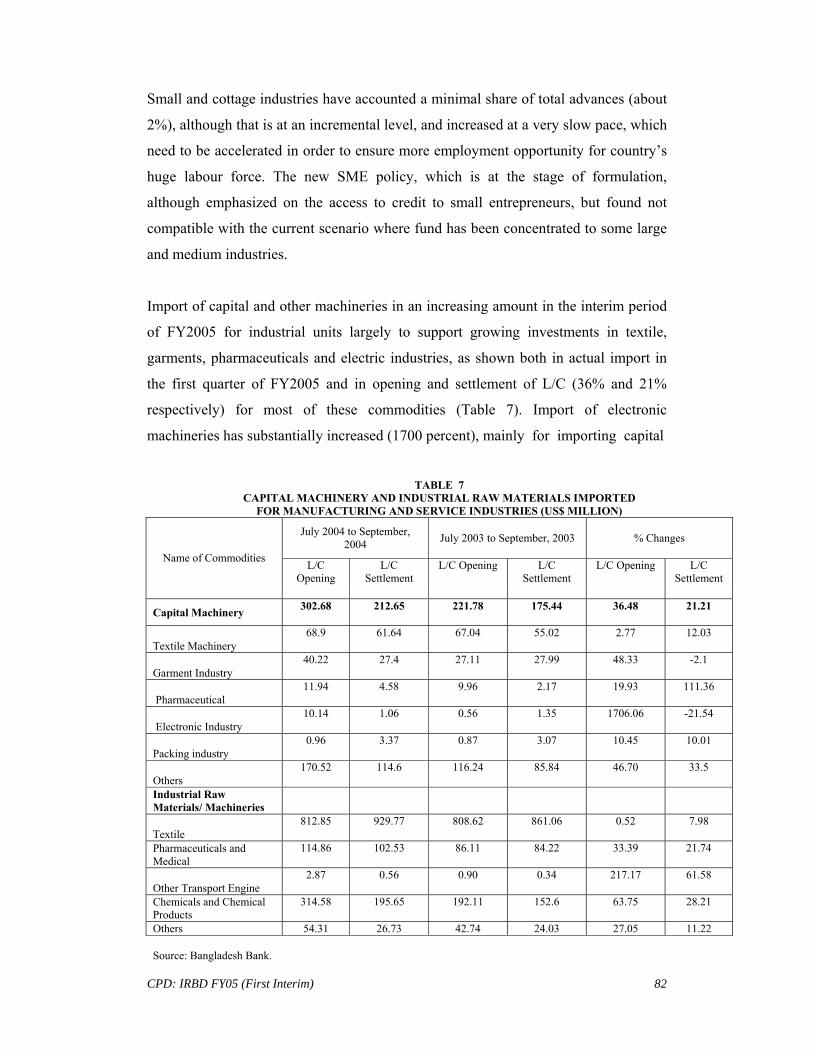
CPD: IRBD FY05 (First Interim)
82
Small and cottage industries have accounted a minimal share of total advances (about
2%), although that is at an incremental level, and increased at a very slow pace, which
need to be accelerated in order to ensure more employment opportunity for country’s
huge labour force. The new SME policy, which is at the stage of formulation,
although emphasized on the access to credit to small entrepreneurs, but found not
compatible with the current scenario where fund has been concentrated to some large
and medium industries.
Import of capital and other machineries in an increasing amount in the interim period
of FY2005 for industrial units largely to support growing investments in textile,
garments, pharmaceuticals and electric industries, as shown both in actual import in
the first quarter of FY2005 and in opening and settlement of L/C (36% and 21%
respectively) for most of these commodities (Table 7). Import of electronic
machineries has substantially increased (1700 percent), mainly for importing capital
TABLE 7
CAPITAL MACHINERY AND INDUSTRIAL RAW MATERIALS IMPORTED FOR MANUFACTURING AND SERVICE INDUSTRIES (US$ MILLION)
July 2004 to September, 2004 July 2003 to September, 2003 % Changes
Name of Commodities L/C Opening
L/C Settlement
L/C Opening L/C Settlement
L/C Opening L/C Settlement
Capital Machinery 302.68 212.65 221.78 175.44 36.48 21.21
Textile Machinery 68.9 61.64 67.04 55.02 2.77 12.03
Garment Industry 40.22 27.4 27.11 27.99 48.33 -2.1
Pharmaceutical 11.94 4.58 9.96 2.17 19.93 111.36
Electronic Industry 10.14 1.06 0.56 1.35 1706.06 -21.54
Packing industry 0.96 3.37 0.87 3.07 10.45 10.01
Others 170.52 114.6 116.24 85.84 46.70 33.5
Industrial Raw Materials/ Machineries
Textile 812.85 929.77 808.62 861.06 0.52 7.98
Pharmaceuticals and Medical
114.86 102.53 86.11 84.22 33.39 21.74
Other Transport Engine 2.87 0.56 0.90 0.34 217.17 61.58
Chemicals and Chemical Products
314.58 195.65 192.11 152.6 63.75 28.21
Others 54.31 26.73 42.74 24.03 27.05 11.22
Source: Bangladesh Bank.

CPD: IRBD FY05 (First Interim)
83
machineries for telecommunication industries; a large part of it is used for importing
mobile sets.15 Besides import of large amount of industrial raw materials such as raw
cotton, synthetic and mixed yarn, cotton yarn, textiles fabrics, chemical and chemical
products etc. are largely attributed to the expanding textile, and fertilizer industries,
while intermediate goods such as clinker, lime stone, C.I. Sheet, B.P. Sheet, scrap
vessels, iron & steel scrap are also targeted for other large and medium industries.
9.1.2 Sluggish Trend of Investment in Capital Market
The huge investment required for country’s fast growth in industrial sector is rather
failed to achieve through equity financing as number of new companies floating
capital is very low, and even deteriorated in the current fiscal year as compared with
the previous year. While in FY 2004, a total of 10 IPOs were launched in July-
October, 2003, with a total issued capital of Tk.10 billion and public offering of Tk. 2
billion, the corresponding figures in the FY 2005 is very poor with having only 4 new
IPOs, issued capital of Tk. 0.87 billion and public offering of Tk. 0.473 billion, which
shows a decline of more than 90% in the current year. Major share of these new and
existing equity financing are attributed with bank and non-bank financial institutions,
which earned huge profit and provide dividend as well, through applying high lending
rate and low deposit rate of interest. The total amount of oversubscription during the
stated period of FY 2004 was 2100%, which sharply doubled during the
corresponding period of FY2005 to about 4332%, implying less opportunity in the
equity market for small investors, who did not find depositing in the banks lucrative
any more. TABLE 8
INITIAL PUBLIC OFFERING (IPO) FOR JULY-NOVEMBER, FY2004 AND FY2005 Months
(July-November) Issued
Capital (Tk.) Public
Offer (Tk.) Public
Subs (Tk.) Public Subs.
Over/Under(Tk.)
IPO-2003 10,616,907,500 2,082,920,000 30,707,892,185 29,196,367,185
IPO-2004 877,750,000 (777,750,000)
473,875,000 (403,875,000)
- (5,662,377,000)
- (5,258,502,000)
% change -91.75 -77.25 - - Note: Figures in parentheses show data of all IPOs except one which has some data unavailable. Source: DSE
15 According to Mobile Phone Importers’ Association, about 80% of the mobile telephone set has been imported through smuggling, which could otherwise rise existing figure of import content of electronic items.

CPD: IRBD FY05 (First Interim)
84
However, SEC’s various measures such as introduction of Central Depository System
(CDS) from January, 2004, as well as government’s supportive measures of reduction
of advance income tax on profits of government bonds to 20% (earlier 25-45%),
reduction of income tax of textile and jute industries to 15% (earlier 20-37.5%),
reduction of duty on most raw materials, essential machinery, spare parts, reduction of
capital gain tax of stocks and shares of foreign/joint ventures companies to 10%,
increasing income tax exempt from Tk.90,000 to Tk.1,00,000 could not encourage
new companies to invest through capital market. SEC may alternatively encourage
large FDIs or prospective new FDIs to float at least a part of their share in the equity
market to expand the base as well as create confidence to other companies. It seems
that various measures would not encourage private owned companies to participate in
equity market due to the fear of loosing the control over the company in case it
becomes a public limited nature instead companies enjoy almost all those supports
through debt market participation.
9.2 Slow Rise in Industrial Consumption of Energy
It is found that Industrial sector as a whole consumed 11-12% of total gas supply,
while power generation plants and fertilizer factories consumed two-thirds of total
supply (46% and 20% respectively). According to Table 9, in July, 2004 consumption
of gas used for industrial purposes including fertilizer production has increased about
2% (335.81 MMCM) as compared with the corresponding period of 2003 (326.293
MMCM) and further increased by 13% in August, 2004. However, gradual increase in
demand for gas for industrial units could not be accommodated through existing
production and supply of gas. Moreover, proposed FDIs have been attracted mainly
on gas based industries, such as power, steel, fertilizer, ceramic etc., which may not
receive the required amount of gas supply unless gas production is not
TABLE 9 INDUSTRIAL CONSUMPTION OF GAS AND ELECTRICITY
2004 2003 Change
Industrial
Consumption July August July August July August
Gross 335.81 376.027 326.293 332.9 2.92 12.95
Gas Fertilizer
only 218.038 233.752 222.989 225.764 -2.22 3.54
Electricity Gross 181.98 195.78 185.88 182.85 -2.1 7.07
Source: BPDB and Petro Bangla

CPD: IRBD FY05 (First Interim)
85
increased immediately. Besides, a rising demand of gas for CNG-conversion of
transports (2MMCM in July-August, FY 2004to 6-8 MMCM in the corresponding
period of FY 2005) although at a small scale at present (less than 10 MMCM) but
may increase substantially in future, and therefore requires much gas supply.
On the other hand, a rise in consumption of electricity observed in August, 2004 (7%)
might increase further more if sufficient electricity supply could be ensured, which
currently suffers for outdated power plants, poor gas supply and need much
investment for improvement of power infrastructure either through public or private,
other wise many prospective investments both from local as well as from abroad
would be in vein due to lack of developed infrastructure.
9.3 More Promises of FDIs
A moderate increase in actual FDIs in the interim period of FY 2005 and large rise of
registration of FDIs in different manufacturing and service related industries indicates
country’s growing competitiveness in a number of large and medium industries.
According to Table 10, recent FDIs are targeting country’s prospective opportunities
in energy and textile industries, along with chemical and fertilizer, pharmaceuticals,
infrastructure, financial sector and telecommunication, which may partially meet the
required investments in some demanding sectors where local investors are not ready
to invest.
India’s Tata group expressed a formal interest to invest a total of US$2 billion in steel
industry (2.4 million ton), 1,000-megawatt power generation project and in a fertilizer
TABLE 10 PROSPECTIVE FDIs IN BANGLADESH BY SELECTED COUNTRIES
Country Chemical
and fertilizer
Pharma- ceutical Steel Finan-
cial Energy Infras-tructure RMG Tex-
tile Lea-ther
Cera- mics ICT
Agro- proce-ssing
Others
India √ √ √
Taiwan √ √
France √ √ √ √ √ √
Pakistan √ √ √
Turkey √ √ √ √
UAE √ √
Malaysia √ √ √ √ √ √ √ √ √ √ √
Note: Others include sectors in which only one country promises to invest, these are telecom, jute, tea, transport and hotel and tourism. Source: BOI, various issues of daily newspapers.
CPD: IRBD FY05 (First Interim)
86
factory. Such an investment mainly targets local and foreign markets accessed under
various provisions of WTO for LDCs. Requiring a gas supply of about 200 MMCF
per day in the initial stage and 350 MMCF at the time of full operation, country’s
existing production of gas will not be sufficient to meet such a huge demand unless
further exploration and improvement of distribution system are ensured. Using coal of
Boropukuria may suffice for this private sector based power plant, but may hamper
government’s own power plant project based on the same source. Fixing price for gas
at an acceptable level to both parties would be another important point of departure,
where there is no uniform price level currently used for supplying gas to different
industries.
Lafarge Surma Limited, an associated company of Lafarge of France, invested in
producing cement with a total of US$240 million ($10 million collected from local
capital market) for a plant of dry process cement, mainly to supply high quality
cement in local market as well as in neighbouring states of India and China. As like
Lafarge Surma, India’s Tata group may collect a part of the huge capital (US$2
billion) required for power, fertilizer or steel mill plants from the local equity market,
which may increase not only capitalization, increase confidence of the market to other
local or foreign investors as well.
Orascom Telecom Holding, an Egyptian based Company, recently has taken over
Sheba Telecom at a cost of US$50 million dollars in cash and US$10 million in
financial debt and intends to further invest US$250 million to widen its coverage.
Besides, Teletalk, a public venture of BTTB, invested US$120 billion started its
mobile telecommunication providing subscription of US$0.50 million. However, the
growing telecom sector in Bangladesh as well as in neighbouring countries may open
new opportunities for manufacturing/assembling mobile phone sets, instead of
importing as it now occurs both in legal and illegal process at a huge cost.
9.4 Investment in the Interim Period—Concentration in a Limited Number of Large and Medium Industries
As discussed earlier, gross domestic capital formation is rather stagnated about 23%
for last four years, and performance private sector is not improved so much. In the
interim period of FY2005, investment in manufacturing and service sectors have

CPD: IRBD FY05 (First Interim)
87
shown some mixed signals, in one hand debt financing in the industrial sector has
increased significantly; on the other hand equity financing has suffered a lot. Actual
FDIs are not so much, although lots of promises observed from various countries.
It is observed that investment in manufacturing and service sectors through debt financing has been concentrated in a limited number of large and medium scale industries, especially in textile and garments, iron and steel, drugs and pharmaceuticals, cement and asbestos. The same trend observed in case of FDIs, including telecommunication, energy and gas etc. It seems that formal launching of MFA phase out has been created opportunities especially in textile sector through improving country’s competitive advantage, while country’s duty free access in European and Canadian market has opened opportunities not only in textile but in other products, especially pharmaceuticals, ceramics, agro-processing etc. Nonetheless, country’s special access in developed and developing countries especially under S&DT has widened the horizon of export potentials, which has been tried to exploit by new FDIs, mainly in fertilizer, steel, ceramics etc. Implementation of these FDIs from trade surplus countries (in respect of Bangladesh) and to re-export to the home country may help to improve country’s BOP position.
However, concentration in a limited number of industrial activities (both of labour and capital intensive) would in other way reduce the scope of investment in small and cottage industries upon which a large number of labourers are lived on and may have long term negative impact on income and employment as well. More threatening is that a large part of investment has been diverted to import of consumer goods, mainly of food stuffs, for which local substitutes produced by small industries has lost their market share and ultimately these industries will close down.
It was earlier thought that consecutive floods in 2004 from late July to early September, which caused loss of assets to many industrial units (about Tk. 531.7 crore as per CPD estimate), especially garment industries would affect investment in the interim period of FY 2005. Since loss of capital machineries and raw materials were not so huge in amount, it implies that new increasing investment through debt financing in the current fiscal year is not for compensating capital losses, but for extending capital assets further instead, which would ultimately increase country’s industrial production and export as well. But this amount of investment will not sufficient enough to hammer the growth potential that drives the economy towards out of poverty in near future.

CPD: IRBD FY05 (First Interim)
88
X. NCBs REFORM: WHERE DOES IT STANDS
The improvement of the health of the financial sector of Bangladesh is a matter of
continuous concern of all stakeholders in Bangladesh. The prevailing dysfunctional
financial system which is inhibiting investment growth in the country has prompted
the government to put the financial sector at the top of the economic reform agenda.
Thus, reforms in the financial sector are attempted in three major areas: (i)
strengthening oversight functions of the central bank, (ii) improving corporate
governance in the private sector, and (iii) restructuring of the Nationalised
Commercial Banks (NCBs). During the last couple of years, some progress has been
made in the first two areas, while reforms in the NCBs currently stand at a crossroads.
It is anticipated that before the next national election only NCBs reform will come out
with some concrete outcome.
10.1 Reform Agenda
The reform of NCBs is being addressed under the World Bank’s Enterprise Growth
and Bank Modernisation project of the World Bank and PRGF of the IMF. The
second objective of the World Bank’s Enterprise growth and Bank Modernisation
project is to help Bangladesh implement its banking sector reform programme aimed
at achieving a competitive private banking system by a staged withdrawal through
corporatisation leading to divestment of a substantial shareholding in Rupali, Agrani
and Janata, and to divestment of a minority shareholding in Sonali. The total cost of
the World Bank project is $ 480 million. Of this, the government will provide $142
million, the British Department for International Development $88 million, and the
World Bank's International Development Association $250 million as interest-free
loan. The credit carries a 0.75 percent service charge and has 40 years to maturity
with a 10-year grace period. The loan was approved in June 2004.
Initially, Rupali Bank has been set for divestment which will take place in 2005. For
other three banks, an aggressive reform agenda will be implemented within January
2007, targeted towards stopping imprudent lending and overall improvement of
operational efficiency. The fate of these three banks as regards divestment will be
decided subsequently, although in the reform documents it has been clearly mentioned

CPD: IRBD FY05 (First Interim)
89
about the final resolution of Sonali, Agrani and Janata Bank, which one can interpret
as divestment. As a whole, the divestment process of Rupali Bank will be a test case
of other three NCBs.
In this context, while many agree with the rationale for reforms in the NCBs, but a
huge dose of scepticism pervade the process, outcome and consequences of the
envisaged reforms.
Outcome of the Reform
The outcome of the reform will vary depending on the process of the NCBs reform.
There would be three possible outcome related to different process:
Process Outcome 1 Improve the financial health of
the bank with new style of management and manpower restructuring, introducing IT for back office and front office, cleaning up the loan portfolio with proper injection of capital and keep the bank in the hand of the government
The priority sector lending and access to banking services across the countries will not be jeopardised
The haemorrhaging of financial resources will be stopped
Investment climate will be improved
2 Improve financial health of the bank with the above mentioned reform measures and transfer a part of the equity to investors through IPOs
The priority sector lending and access to banking services across the countries will not be jeopardised
Operational efficiency will be relatively better than in the first outcome
The private sector absorption capacity will be tackled through a gradual process of off-loading the share
The haemorrhaging of financial resources will be stopped
Investment climate will be improved 3 Improve financial health of the
bank with the above mentioned reform measures and auction out the bank
The operational efficiency might be improved but the access to banking services will be reduced
It is not clear whether the private sector will be capable to absorb huge volume of business within a short period of time
The dominance of large private sector banks may induce collusive behaviour in the market which is anti-competitive and against the philosophy of the reform
The haemorrhaging of financial resources will be stopped
Investment climate will be improved In all the three scenarios the reform measures will facilitate the main goals of the
reform, i.e., stooping the financial haemorrhage of the NCBs, improving the
operational efficiency, and improving the investment climate. Thus, the choice of
process would be important. As the first two phases of reforms in Agrani, Janat and
Sonali do not include the plan for ultimate resolution through divestment, it is

CPD: IRBD FY05 (First Interim)
90
expected that no pre-conceived decision on privatisation will not taken during this
reform period.
Is Public Ownership Bad?
The basic premise of the NCB reform is that the government ownership is bad and
due to the government ownership the NCBs cannot function well. This is the basic
point of discomfort to the stakeholders. The global regional experience shows that the
implications of ownership do not have clear cut reflection on the performance.
Till date more than 40 per cent of the population live in countries where sate-owned
banks hold the majority of the assets of the banking system. From the global data one
can also identify that the government ownership tends to be greater in poorer
countries and that is quite natural [see Table 11]16. In India, where both public and
private sector co-exist, a large chunk of it is owned by the former. In poor countries
the government has to play a role which ensures addressing the market failure
problems and channelling the scare resources to the priority sectors. As the country
moves up along the poverty spiral the dependence on the government proliferation
decreases. The process of proliferation of the private sector takes place through
market mechanism which is operationalised through the provision of operations of
privately owned commercial banks. TABLE 11
STATE-OWNED BANK ASSETS AS A PERCENTAGE OF TOTAL BANK ASSETS
Country 1980 1990 2000 India 91 91 801 Indonesia … 55 572 Korea 25 21 30 Philippines 37 7 12 Thailand Na 13 31 Argentina Na 363 30 Brazil 33 64 432 Chile 23 19 12 Colombia 27 45 132 Mexico 0 100 0 Peru 65 55 3 Hungary … 81 92 Czech Republic … 873 28 Poland … 804 23 Israel … … 452 South Africa … 53 21 Source: Asian Banking: Emerging developments in growth, Structure and Efficiency, p. 4.
16 However, there are a number of countries there is no state-ownership in the banking sector. A few such countries are Hong Kong, Singapore, Malaysia, and Saudi Arabia.

CPD: IRBD FY05 (First Interim)
91
State Ownership and Banking Performance The empirical analysis does not show any strong evidence of better performance by
private sector dominant banking sectors [see Annex Table 1]. Although state
ownership is high in India, Indonesia and Korea performance in these countries in the
terms of return on asset (ROA) is no less than in the USA, Canada, Japan and the UK,
where state dominance is nil or minimum. In the Philippines the share of state owned
banks’ asset is only 12 per cent of total assets the ROA was in a range of 0.4-0.7.
According to Moody’s Ranking on Financial Strength India’s ranking (27.5) is high
compared to Indonesia (5.4), Philippines (20.4), and Japan (12.9). The ranking also
shows that there is no secular trend in state ownership and financial strength. In case
of NPA, the empirical evidence also does not give a clear picture from which one can
conclude that state-ownership was the reason for higher NPA. It is to be mentioned
that in general the NPA is low in developed countries.
10.2. Reform Process Market Force and Market Share Battle As the main objective of the reform is to reduce the dominance of the NCBs in the
market and bring more competition in the sector it is always better if it happens in a
gradual manner. Looking into the market share of NCBs in Bangladesh one can find
that the dominance of the NCBs has been reducing throughout the last one decade
[see Figure 56]. The figure shows that over the last 8 years the market share of NCBs
came down to 40.50 per cent (2004) from 56 per cent (1996). The market share of
PCBs has been equalised with the share of NCBs by 2004. The reduction of market
share took place in a natural way, by expansion of banking market and relatively rapid
growth of private banking. The banking market grew to Tk. 1636.96 billion in terms
of assts in 200417 from Tk. 591.59 billion (1996). As the size of the market is
increasing, the majority volume of the incremental market of Tk. 1045.38 billion (Tk.
641.62 billion) is being captured by private banks. PCBs and FCBs have together
taken under control 61.38 per cent of the incremental market, whereas NCBs received
only 31.73 per cent [see Figure 57]. This is a sign of vibrant growth of private sector
banking. In this scenario it is not understandable why a forceful resolution of NCBs
17 Provisional figure up to June 2004.
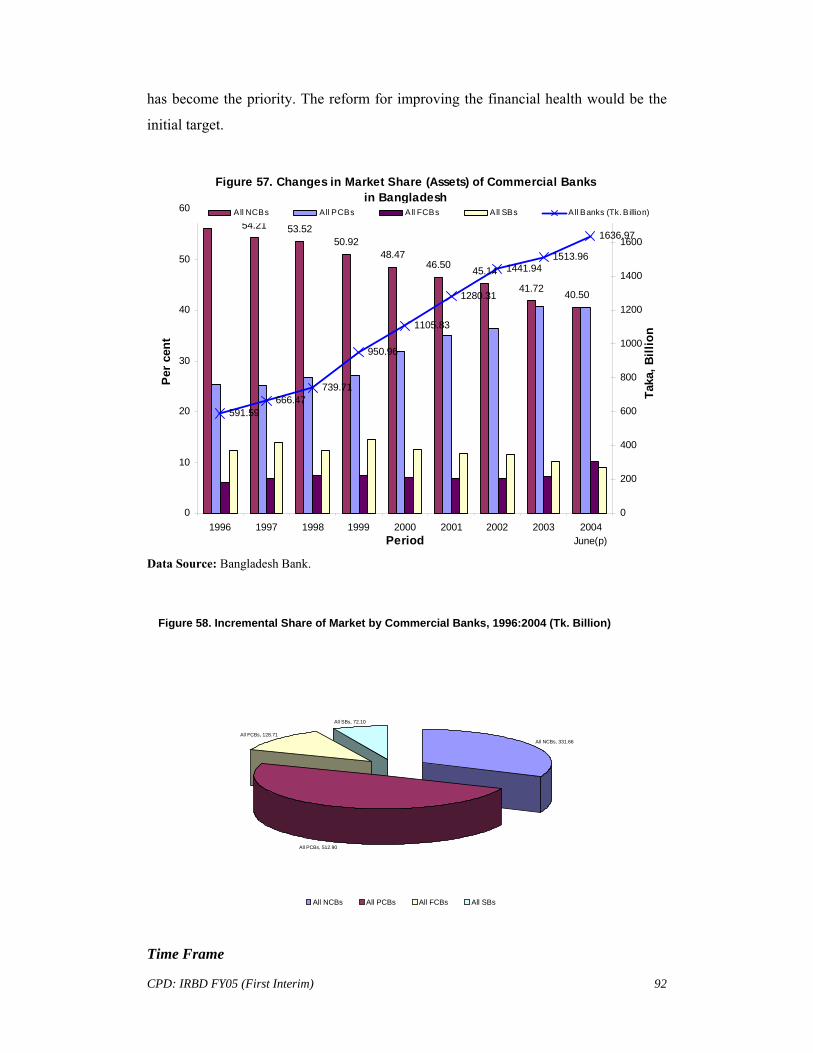
CPD: IRBD FY05 (First Interim)
92
has become the priority. The reform for improving the financial health would be the
initial target.
Figure 57. Changes in Market Share (Assets) of Commercial Banks in Bangladesh
56.0054.21 53.52
50.9248.47
46.50 45.14
41.72 40.50
591.59666.47
739.71
950.96
1105.83
1280.31
1441.941513.96
1636.97
0
10
20
30
40
50
60
1996 1997 1998 1999 2000 2001 2002 2003 2004June(p)Period
Per c
ent
0
200
400
600
800
1000
1200
1400
1600
1800
Taka
, Bill
ion
All NCBs All PCBs All FCBs All SBs All Banks (Tk. B illion)
Data Source: Bangladesh Bank.
Time Frame
Figure 58. Incremental Share of Market by Commercial Banks, 1996:2004 (Tk. Billion)
All NCBs, 331.66
All PCBs, 512.90
All FCBs, 128.71
All SBs, 72.10
All NCBs All PCBs All FCBs All SBs

CPD: IRBD FY05 (First Interim)
93
In case of Agrani, Janata and Sonali Bank three external management teams are to be
appointed. According to the original schedule the management team for the Agrani
Bank ought to start work in January of 2004 and submit the implementation plan for a
31-month second phase within end-June 2004. However, the team started their
activities only in October, 2004. According to the work plan, a report on asset and
liabilities was to be produced within December 2004, but the report is yet to be
completed.
For Janata Bank the activities under the interim memorandum of understanding were
to be completed by end-September 2004 without an output of new memorandum of
understanding for implementation of comprehensive reform agenda in the bank.
Similar is true of Sonali Bank.
As a whole, the activities which are entrusted to the consultants are mammoth and the
time frame is not realistic. Given the possible resistance from the internal
management and staffs it would be further difficult for them to work. As a result the
reform process will be definitely delayed.
Changing the Head and Keeping the Body The CEO and the team of advisors are entrusted to cover the following functional
areas: credit, risk management, human resources and training, MIS and IT,
accounting, internal audit, treasury, branch management. The idea of changing the
head without dealing with the body is bound to fail. All the functional areas
mentioned above are the resultant of functioning of the bank at the branch level. Other
than treasury, all the functional components need comprehensive overhauling. In the
diagnostics it was mentioned that human resource issues include low morale, poor pay
scales, weak skills and counter productive union oriented activities. If this is the case
the change only at the top management will not produce desired result.
Surgery only at Head Office level? It has been designed that a local accounting team will assist the NCBs to carry out the
improvements of the accounting capability of banks. It is not clear whether such
assistance will confine only to the head office level or to the branch office level.

CPD: IRBD FY05 (First Interim)
94
Without streamlining of the accounting procedure at the branch level the surgery at
the head office level will not be effective.
Mandate and Accountability Mismatch It is also provisioned that the advisors and the accounting team do not have any
executive authority within the NCBs, but the CEO will give effect to their
recommendations through his executive authority. This provision has a two-fold
problem. One, the advice without accountability will not bring desirable result, when
action with accountability (by the employees) could not do so. The problem of
asymmetric information will make the recommendations made by the consultants
ineffective. On the other hand, bringing consultants into the core management is not
possible due to the structural limitations. It was probably the only case of involvement
of management team in a financial institution by the World Bank and the IMF. So far
the World Bank is also critical of the external management team and questioned its
effectiveness in many developing countries’ SOE reform programme. Non-
cooperation from the employees and moral hazard created by distorted compensation
package for the external management teams would create more problems.
Transfer of Knowledge: Is It Feasible? In the terms of references it is mentioned that the management team will desirably
take steps to transfer their knowledge to NCBs, so that on completion of the
engagement, the local management of NCBs is in a better position to manage its
business without needing to seek additional external expertise. The experience of
FSRP shows that such transfer is not efficient for not believing the underlying
philosophy of changes by the bank management at all levels.
Human Resources: Bone of Contention It is quite obvious that whether the NCBs will be denationalized or not, restructuring
of human resources is an essential element of reform. The detailed activities of the
advisory teams contain two key components in this regard. During the first five
months the following activities inter alia, are included for implementation by the
advisory body:
a. Develop understanding on union issues

CPD: IRBD FY05 (First Interim)
95
b. Assess mechanisms for retrenchment and severance support.
The longer term management plan includes activities like review of staff levels,
development of retrenchment plan and severance scheme. However, it is not clear
whether the human resource restructuring plan includes issues of fresh recruitment.
Under the reform programme a revised organization structure will be devised.
Although it is a very sensitive task in the current political context, without
restructuring the human resources it would not be possible to improve the financial
health of the NCBs. Thus, the design of retrenchment plan and severance scheme
should take care of livelihood issues of the retrenched employees.
According to the current schedule the developed retrenchment plan will be
implemented during the tenure of new government in 2007. On the one hand, this
timing bears lesser political risk as the newly elected government will face fewer
difficulties. On the other hand, pre-election pledge might jeopardize the
implementation of this plan.
10.3. Consequences Ownership vs. Financial Crisis Any sort of forceful reduction of presence of the government results in further
jeopardy in the banking sector as well as in the real sector. The experience of
privatisation in Mexico (early 1990s) and in Chile (late 1970s) shows that abrupt and
premature privatisation can be dangerous, so too can be strategy of hanging on to state
ownership. In some Asian economies such as Korea and Thailand, state ownership
declined in the early 1980s, but owing to serious problems in the banking sector in the
aftermath of the economic crises in the late 1990s, the share of state owned banking
once again surged. In Latin America wide swings are evident, between high to low
state ownership, owing to the vast changes in the state of the economy and banks and
the degree of state intervention required to overcome crisis [Asian Banking, 2004].
Manpower Restructuring One of the major objectives of the NCBs reform is to rationalise the manpower of the
banks. This is undoubtedly a necessary but sensitive task. In developing a
retrenchment plan it is important to differentiate the existing manpower according to
CPD: IRBD FY05 (First Interim)
96
the criteria of learning potential, likewise the split of bad bank and good bank in terms
of quality of asset.
The issue of over-staffing of the NCBs can be interpreted differently. Four scenarios
can be designed. According to one, where we take average staff size is the criterion
for retrenchment (which is 17.35 per branch), for Rupali and Agrani the average
number of staffs per branch is lower than the sector average (10.98 and 14.18
respectively). For other two NCBs the average is higher than the sector average but
lower than the average of PCBs and FCBs. Considering the sector average the
manpower in Sonali Bank and Janata Bank, thus, should be reduced by 3987 and 1574
respectively. On the other hand, Rupali Bank and Agrani Bank will require additional
manpower. This assumption is valid if the number of branches will not be reduced
under the reform. In case of reduction of number of branches the manpower curtail
size will increase. According to the second scenario (considering the number of
employees per branch for the PCBs as ideal), all NCBs have shortage of manpower.
In that case, if the number of branches is not reduced, additional 13790 staffs will be
required.
One can argue that the size of the employees should be considered in line with the
volume of business. Thus, the third scenario (according to the criteria of volume of
business [total of deposit and asset]) hints that total 18105 will be required to retrench
in the NCBs to achieve the level of business volume at the level of sector average. On
the other hand, if we consider the average business volume of the PCBs (fourth
scenario), then the total number of retrenched number of staffs will be increased to
25458, which is 43.48 per cent of total number of current staffs at the NCBs ( see
Table 12). One should take note that, these are all linear estimation. In reality, one
should consider case by case. But it is clear that manpower retrenchment is a real
issue, with or without divestment of the NCBs. The government will have to have
strong political will to go for such tough decision.
Access to Banking Services and Reduction of Size of banking System Among the rural branches 90 per cent of them are run by NCBs or SBs. Only 10 per
cent share belongs to the PCBs (se Figure 58). Further more, this 10 per cent is a
result of flexible definition of the rural branch. As the resource flow takes place from

CPD: IRBD FY05 (First Interim)
97
rural to urban areas, reduction of access to banking services due to the
denationalisation will have severe implications for the overall function of the banking
sector.
Figure 59: Comparative Geographical Distribution of Branches of Commercial Banks
12431104
34150
2145
384
0
1168
3388
1488
34
1318
0
500
1000
1500
2000
2500
3000
3500
4000
NCBs PCBs FCBs SBsTypes of Banks
Num
ber o
f Bra
nch
Urban Rural Total
Primarily, it will affect the rural economic activities. Secondly, the reduced flow of
financial resources will create pressure on the liquidity of the banking sector. Finally,
the size of the banking sector might be reduced in the short run. As the bank branch
rationalisation will be a necessary step, the change in definition might act as a remedy
to the problem. The ratio of urban-rural branches for the private banks may also be
changed so that more rural branches can be opened by the private banks.

CPD: IRBD FY05 (First Interim)
98
TABLE 12 SCENARIO OF MANPOWER RESTRUCTURING, DATA AS OF JUNE 2004
Number of branch
Branch Share in the
sector Number of
staffs Staff
Share in the Sector
Staff per branch
Reduction requirement
(Sector average) Scenario 1
Reduction requirement
(PCB standard) Scenario 2
Total business
(Tk. Crore)
Volume of business per
Staff
Reduction Requirement (volume of
business Sector average criteria)
Scenario 3
percentage of reduction
(VOB Sector Average)
reduction of manpower (volume of
business, PCB standard)
Scenario 4
percentage of reduction (VOB PCB Standard)
Sonali 1185 19 24547 23 20.7 -3987 708.46 51913 2.1 7363.3 30.0 10488 42.7
Rupali 493 7.9 5412 5 11 3142 5095.1 12875 2.4 1150.2 21.3 1925 35.6
Janata 845 14 16235 15 19.2 -1574 1774.2 30732 1.9 6062.5 37.3 7912 48.7
Agrani 871 14 12350 11 14.2 2762 6213.3 26650 2.2 3528.5 28.6 5133 41.6
All SBs 1318 21 16420 15 12.5 6448 11670 21836 1.3 9192.1 56.0 10506 64.0
All PCBs 1497 24 31905 29 21.3 -5931 0 117808 3.7 -7091 -22.2 0 0.0
All FCBs 32 0.5 1502 1.4 46.9 -947 -820 25575 17 -6964 -463.6 -5424 -361.1
All NCBs 3395 54 58544 54 17.2 361 13812 122169 2.1 18105 30.9 25458 43.5
All NCBs+SBs 4713 75 74964 69 15.9 6809 25482 80909 1.1 27297 36.4 35964 48.0
All Banks 6246 100 108371 100 17.4 0 24748 327394 3 0 19705 18.2

CPD: IRBD FY05 (First Interim)
99
Why NCBs? Although NCBs have become target of the reform, one can question why to target NCBs only?
Because, the situation in specialised banks is no way better than NCBs, rather worse than NCBs
in many areas [see Annex Table 2]. As NCBs have broader mandate which is difficult to replace
by the private commercial banks, the reform process, particularly the privatisation or liquidation
could be started with in the SBs.
New Licenses and Strategy of Unbundling
There is no doubt that some new banks will emerge within next two year in the private sector. As
a strategy for channelling fresh investment into the banking sector it may be thought whether it is
possible to divide the big NCBs into smaller parts and divested. The option of strategic
partnership with foreign financial institution may be also on the table for consideration.
The final Question: Is the Ownership Main Problem? The collusion between business and politics, interference of the government into the NCBs
operations, corruption are the main reasons which have bred inefficiencies in the banking sector.
Until we can stop these problems, no reform will be effective. Rather the half-hearted reform
will send wrong signal to the market and players which will increase burden of bad quality
assets.
The conditionality-based reform, which is also against the philosophy of PRSP and PRGF, has
little chance to succeed. Rather we need indigenous reform in the financial sector. Although the
Banking Reform Committee (BRC) proposed many pragmatic policy options, those were
sidelined and the current reform programmes have been taken over by the government. As the
reform process will touch many sensitive areas, the success of this reform will need strong
government will. A transparent process is needed to be designed so that speculations can not
jeopardise it. There is also need for designing a set of monitorable landmarks which would be
useful for making progress. In conclusion, there is no doubt that reforms in the banking sector is
necessary, but the process and outcome should be designed in a sequential manner and without
prejudice to new ownership form.

CPD: IRBD FY05 (First Interim)
100
ANNEX TABLE 1 STATE-OWNERSHIP VS. BANKING PERFORMANCE IN SELECTED COUNTRIES
State Ownership ROA NPA Banking crises
Country 1980 1990 2000 2000 2001 2002 2000 2001 2002 -
India 91 91 80 0.7 0.6 0.8 12.8 11.4 10.4 -
Indonesia … 55 57 0.1 0.8 1.8 18.8 12.1 10.6 1997-
Korea 25 21 30 -0.6 0.8 0.8 8.1 4.9 3.8 1997-
Philippines 37 7 12 0.4 0.4 0.7 15.1 17.3 16.4 1998-
Thailand Na 13 31 -1.6 -0.2 0.7 17.7 10.5 10.4 1997-
USA … … … 0.9 0.6 0.7 1.2 1.5 1.6 1984-91
Canada … … … 0.7 0.6 0.5 1.2 1.5 1.6 -
Japan … … … 0.2 0 -0.4 6.6 7.4 8.9 -
United Kingdom … … … 0.9 0.6 0.7 2.5 2.5 … -
Argentina Na 363 30 … … … … … … 1995
Brazil 33 64 43 … … … … … … 1995-
Chile 23 19 12 … … … … … … 1978-83
Colombia 27 45 13 … … … … … … -
Mexico 0 100 0 … … … … … … 1995-1997
Peru 65 55 3 … … … … … … -
Hungary … 81 92 … … … … … … -
Czech Republic … 87 28 … … … … … … -
Poland … 80 23 … … … … … … -
Israel … … 45 … … … … … … -
South Africa … 53 21 … … … … … … -
Sources:
IMF, World Economic Outlook, May 1998; JP Morgan, Asian Financial Markets, 28 April 2000; World Bank, Economic Prospect and Developing Countries, table 3.6. Asian Banking, January 2004.

CPD: IRBD FY05 (First Interim)
101
ANNEX TABLE 2 COMPARATIVE PICTURE OF COMMERCIAL & SPECIALISED BANKS' PERFORMANCE
Banks Classified Advances (%) ROE ROA Net Profit (Tk. Crore)
All Banks 21.51% 10.74% 0.79% 582.56 All NCBs 29.81% 4.34% 0.11% 74.14
Sonali 35.65% -3.38% -0.08% -22.18
Rupali 20.83% 2.46% 0.09% 6.21
Janata 23.41% 17.53% 0.50% 82.11
Agrani 20.83% 2.42% 0.05% 8.01
All PCBs 11.26% 22.39% 1.41% 352.45
All FCBs 0.01 20.58% 1.93% 199.28
All SBs 47.24% -4.36% -0.31% -43.31
RAKUB 47.61% 2.27%* 0.16%* 8.51
BASIC 2.99% 17.64%* 1.43%* 32.08
BSRS 64.34%* 3.17%** 0.56%** 8.62
BSB 65.57% 10.47% 0.70% 8.62
BKB 48.39% -13.39% -0.59% -139.21
*Data of 2003 **Data of 2002

CPD: IRBD FY05 (First Interim)
102
XI. PRICES OF ESSENTIAL COMMODITIES, INCREASE IN DIESEL PRICE AND FOOD SECURITY
11.1 Price Surge of Essential Commodities
Rice: Wholesale Price Usually in July, the Aus crop is harvested. Thereafter, the price of rice generally declines in
August and September, and then again increases to some extent in October and November prior
to the harvest of Aman rice. This period of potential scarcity is traditionally known as Mora
Kartik. After the harvest of the Aman crop, rice prices generally decline and continue to be low
up to March and then again rise slightly before the harvest of Boro rice in April-May. At the
beginning of FY2004/05 (i.e., July 2004) the price of coarse rice was slightly higher than the
previous year's price. In July 2004, the national average wholesale price of coarse rice was Tk.
13,440 per tonne, compared to Tk. 12,980 per tonne in July 2003 (Figure 60). Instead of the
traditional pattern of decline, price of rice increased further in August 2004 mainly due to flood.
Consistent rise in price of rice was observed in subsequent months. In first week of January
2005, the price of rice increased all time high (i.e., Tk. 17,500 per tonne). This consistent
increase was due to expectation of a poor harvest of Aman rice due to flood of end-July to mid-
August and excessive rainfall in September. The increase in domestic price of rice has occurred
in a time when rice price has been showing an upward trend in the international market from
beginning of the 2004.
For import purposes one needs to compare average wholesale price of Bangladesh with the
import parity price of the exporting countries such as Thailand, India, and Vietnam. Import
parity price is obtained after adding transportation and insurance cost with that of the wholesale
price in the originating countries. A comparison of Bangladesh’s (Dhaka) monthly wholesale
price with the import parity price of New Delhi (India), and Bangkok (Thailand) is presented in
Figure 60. It is clearly evident from Figure 61 that generally Bangladesh’s price is higher than
the import parity price of India and Thailand. Therefore, Bangladesh's private sector in the past
has imported rice even when Bangladesh had produced sufficient quantities. However,
Bangladesh’s wholesale price of rice during April-August 2004 was lower than import parity
price of both India and Thailand. In this case we have compared the price of 5 percent broken
parboiled coarse rice. Bangladesh’s rice price is higher than the import parity price of India but is

CPD: IRBD FY05 (First Interim)
103
still less than that of Thailand (See Figure 61). Therefore, getting rice from international market
at a cheaper rate will be difficult.
Figure 60 Average Wholesale Price of Coarse Rice in Bangladesh: FY01-FY05
1344013740
14690
15260
15940
16850
17500
11000
12000
13000
14000
15000
16000
17000
18000
Jul Aug Sep Oct Nov Dec Jan Feb Mar Apr May Jun
Pric
e (T
k/to
n)
2000/01 2002/03 2003/04 2004/05

CPD: IRBD FY05 (First Interim)
104
Figure 61
Comparison of Domestic Prices of rice with Import Parity Price: FY00-FY05
180.00
200.00
220.00
240.00
260.00
280.00
300.00
320.00
Jul'99
Dec'99
May'00
Oct'00
Mar'01
Aug'01
Jan'0
2
June
'02
Nov'02
Apr'03
Sep'03
Feb'0
4
July'0
4
Dec'04
(3wk)
Import Parity (ex:Bangkok) Import parity (ex: Delhi) Bangladesh: Wholesale Price
An analysis of private sector import with import parity price of rice with Bangkok and Delhi
revealed that whenever domestic price in Bangladesh is more than the import parity price then
the private import of rice increases (Figure 62). It may be noted that currently there is no
restriction on import and export of rice by private sector of Bangladesh. Traders are free to
import or export rice. Their actions are driven by the profit concerns (difference between
international and domestic price). According to the US Department of Agriculture, export prices
for most grades of Thailand’s milled white rice have increased by $22-$27 per tonne since early
November, as a result of higher prices for Thailand’s intervention purchases, abnormal dryness
in the region, and generally tight exportable supplies across much of Asia. Vietnam’s prices have
increased over the past months as well due to a lack of supplies until after the harvest of its
winter-spring crop in February and March. It is also clearly evident from Figure 61 that getting
the same quality rice (5 percent broken parboiled) traditionally imported by Bangladesh from
Thailand would be difficult.
Production forecasts indicate that rice production would be much less than that of last year due to
abnormal dryness. India also experienced drought in many sates of the country implying a poor
production prospect of monsoon rice. Therefore, international price of rice may go further up in

CPD: IRBD FY05 (First Interim)
105
the coming months. Policy makers must have to take this real world reality for designing policies
which effect production and rice trade. Considering the global situation, Bangladesh must have
to ensure increased production of Boro at a lower cost to ensure food security and arrest the
rising food prices.
Figure 62. Rice Prices and Quantity of Private Rice Imports in Bangladesh, 1999-2004
0.00
50.00
100.00
150.00
200.00
250.00
300.00
350.00
Pric
e ($
/ton)
0
50000
100000
150000
200000
250000
300000
Impo
rts (m
etric
tons
)
Import Parity (ex:Bangkok) Import parity (ex: Delhi)Bangladesh: Wholesale Price Private Sector Imports (Rice)
Sugar Price: Wholesale price of sugar has increased from Tk 27.50 per kilo (US$0.47) in
July’03 to Tk 30.89 in July’04. Comparison of the wholesale price of sugar in India (Delhi) and
Bangladesh (Dhaka) indicates that wholesale price of sugar in Bangladesh (Tk 30.89 per kg or
US$ 0.51) during July ’04 was much higher than that of India (Rs 15.59 per kg or US$ 0.35). It
may be noted that per kg wholesale price of sugar in Dhaka in November ’04 was Tk. 31.27

CPD: IRBD FY05 (First Interim)
106
(US$0.52) while it was Rs. 16.10 (US$ 0.36) in Delhi. An analysis of price difference between
Dhaka and Delhi remained more or less stable in FY05 (July-November) while it had shown a
fluctuating trend in FY04. It may be recalled that the government in FY05 budget had reduced
supplementary duty (SD) from 40 percent to 15 percent and eliminated VAT at manufacturing
stage. However, there was no decrease in sugar price in the market. Thus, it appears that
consumers could not receive the benefits from decrease in SD for sugar import.
Soyabean Oil Price: Bangladesh imports crude soyabean oil and the refined oil is marketed by
the domestic companies. Price of soyabean oil is consistently increasing. The wholesale price of
soyabean oil in Bangladesh increased from Tk 39.90 per litre in July 2003 to Tk 49.20 per litre in
July 2004 which has decreased to Tk 45.90 per litre in December 2004. An analysis of
differences between the crude oil price of soyabean in the international market and refined oil
price in the domestic market indicates that the gap is increasing. In other words, the price of
soyabean oil in Bangladesh has been increasing at a faster rate than in international market.
Vegetable Prices: This year farmers have taken extra effort to increase vegetable production by
observing high prices of vegetables during August-October. Increased effort of farmers had
increased production and supply of vegetables since November which helped to reduce price.
However, farmers’ success in increased vegetables production has been penalizing them in a
very harsh way. In many areas farmers are not able to sell their vegetables even at their cost of
marketing.
11.2 Trends in Import of Foodgrains
Imports of foodgrains into Bangladesh are sustained from two sources: food aid and commercial
imports. The food aid is given by developed countries to assist Bangladesh in improving its food
security. In 2003/04, only 4 thousand tonnes of rice was received by the government as food aid
(Table 13). All the commercial imports of rice since 1999/00 came through private sector
acquisition. Highest level of rice import (3.06 million tonnes) was in 1998/99 (worst flood
affected year). Second highest import (1.56 million tonnes) was in 2002/03 (a normal production
year). Very high amount of rice import in 2002/03 was mainly due to low tariff rate in
Bangladesh and also because of high export subsidy provided by the Indian government during
CPD: IRBD FY05 (First Interim)
107
that time. India was exporting rice at half of their economic cost. Increase in administered price
of rice in India in October 2003 and a good harvest of rice (all time high) in 2003/04 has resulted
decrease in total rice import to 0.8 million tonnes.
During July-December 2004, private sector imported 507 thousand tonnes of rice against an
import of 525 thousand tonnes during the comparable months of FY2003/04. Imports were from
India, Myanmar and Thailand. After the excessive rain of September, production prospect of
Aman rice is lower than last year and rice price showed an increasing trend in the market. In
response to that there has been an increase in import of rice by private sector since October ’04.
Rice import (as food aid) by the government during July-December ’04 was 13 thousand metric
tonnes. Government did not make any commercial import of rice during this period.
In case of wheat, total import in FY04 (1998 thousand metric tonnes) was 17.15 percent higher
than that of FY03. As mentioned earlier, wheat production has been gradually declining since
1999/00 and wheat production in FY04 decreased by 16.85 percent, compared to the previous
year’s production. During July-December ’04, private sector imported 835 thousand metric
tonnes of wheat against 1070 thousand metric tonnes in the previous year. During July-
December ’04, the government imported 195 thousand metric tonnes of wheat (185 thousand
metric tonnes as food aid and 10 thousand metric tonnes as commercial import). It may be noted
that government wheat import during the comparable months of the last fiscal year (FY2003/04)
was 256 thousand metric tonnes (228 thousand metric tonnes as food aid and 28 thousand metric
tonnes as commercial import). Thus, total import of foodgrains (rice and wheat) by government
and private sector during July-December ’04 was 1550 thousand metric tonnes against 1851
thousand metric tonnes in comparable months of the previous year (FY2003/04). In other words,
total food import in FY2004/05 is 16.3 percent less than last fiscal year (FY2003/04).
TABLE 13 IMPORT OF RICE (AID/COMMERCIAL/PRIVATE) IN BANGLADESH, 2001/02-2004/05
(in ’000 metric tonnes)
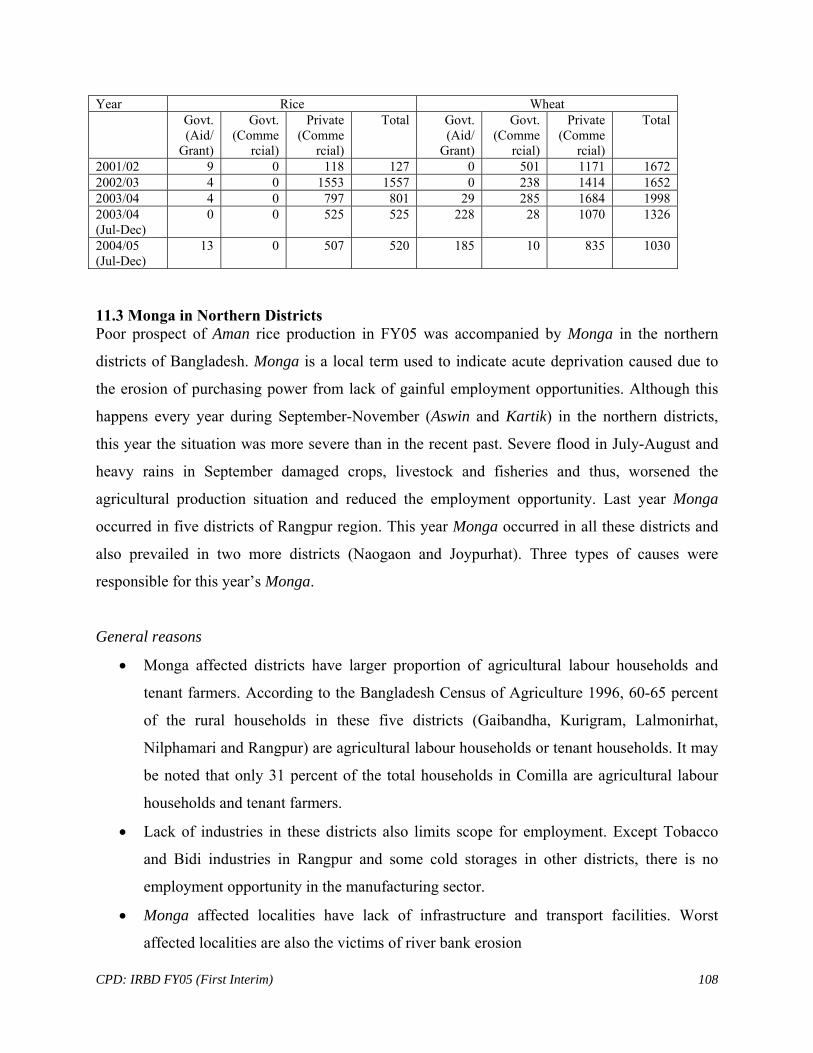
CPD: IRBD FY05 (First Interim)
108
Year Rice Wheat Govt.
(Aid/ Grant)
Govt. (Comme
rcial)
Private (Comme
rcial)
Total Govt. (Aid/
Grant)
Govt. (Comme
rcial)
Private (Comme
rcial)
Total
2001/02 9 0 118 127 0 501 1171 1672 2002/03 4 0 1553 1557 0 238 1414 1652 2003/04 4 0 797 801 29 285 1684 1998 2003/04 (Jul-Dec)
0 0 525 525 228 28 1070 1326
2004/05 (Jul-Dec)
13 0 507 520 185 10 835 1030
11.3 Monga in Northern Districts Poor prospect of Aman rice production in FY05 was accompanied by Monga in the northern
districts of Bangladesh. Monga is a local term used to indicate acute deprivation caused due to
the erosion of purchasing power from lack of gainful employment opportunities. Although this
happens every year during September-November (Aswin and Kartik) in the northern districts,
this year the situation was more severe than in the recent past. Severe flood in July-August and
heavy rains in September damaged crops, livestock and fisheries and thus, worsened the
agricultural production situation and reduced the employment opportunity. Last year Monga
occurred in five districts of Rangpur region. This year Monga occurred in all these districts and
also prevailed in two more districts (Naogaon and Joypurhat). Three types of causes were
responsible for this year’s Monga.
General reasons
• Monga affected districts have larger proportion of agricultural labour households and
tenant farmers. According to the Bangladesh Census of Agriculture 1996, 60-65 percent
of the rural households in these five districts (Gaibandha, Kurigram, Lalmonirhat,
Nilphamari and Rangpur) are agricultural labour households or tenant households. It may
be noted that only 31 percent of the total households in Comilla are agricultural labour
households and tenant farmers.
• Lack of industries in these districts also limits scope for employment. Except Tobacco
and Bidi industries in Rangpur and some cold storages in other districts, there is no
employment opportunity in the manufacturing sector.
• Monga affected localities have lack of infrastructure and transport facilities. Worst
affected localities are also the victims of river bank erosion

CPD: IRBD FY05 (First Interim)
109
Incremental reasons
• Three times floods damaged a part of the Aman rice and Rabi crops.
• Due to the borrowing from local money lenders (Mahajans) money at high interest rates
(140 to 180 percent) a larger part of the harvest go to the repayment of loan.
• In some areas NGOs realized loan installments ignoring the hardships of the people
Accentuating reasons
• Relief activities of the government covered only a tiny part of the population in these
areas.
• One way of creating employment and increasing access of poor people to foodgrains is
through non-priced distribution of food. Food for works (FFW) and vulnerable group
development (VGD) are two major programmes which are expected to cater this need.
Many experts believe that distribution of food through such programmes increases
availability of food in rural areas and better access of poor people to food. An analysis of
distribution of foodgrains through PFDS revealed that distribution of foodgrain through
FFW and VGD was lower in FY04 and FY05 than that of FY99 and FY01 (Figure 63).
Coping with Monga
• Government disbursed VGF cards among the poor and introduced Open Market Sale
(OMS). Rajshahi Krishi Unnayan Bank (RAKUB) has lunched collateral free loan under
the ‘Zero Poverty Loan Scheme’ with 6 percent interest rate for day laboures and landless
people. However disbursement of relief was better this year due to the inclusion of Army
in management of disbursement.
• Forward sale of their labour at reduced wages—Tk 20-25 per day with food or Tk 35-40
per day without food. This may be compared with the potential wage rate of Tk 35-40
with food and Tk 55-60 without food during the crop harvest and planting season
• Temporary migration of labourers during the pre-harvest lean period. Labourers go to the
districts like Dhaka, Chittagong and Sylhet for seasonal employment opportunity
• In some areas farmers sold their harvests in advance at lower price about 175 to 200 per
mound.
• Many families sell their livestock at lower price to cope with Monga situation

CPD: IRBD FY05 (First Interim)
110
• Eating of banana thors and kachu-ghechu which is not naturally eaten even by poor
people during the normal period.
Figure 63. Distribution of Foodgrains through FFW and VGD: 1998/99-2004/05
0
50000
100000
150000
200000
250000
July August September October November December January February March April May June
Months
tons
1998/99 2000/01 2003/04 2004/05
Efforts to help the Monga victims
Many organisations and individuals tried to help the victims of Monga this year. It may be
recalled that during the last year’s (2003) Monga, NGOs and civil society organisations were
hesitant to participate probably due to the denial of the government at the initial days.
Monga is definitely an unhealthy sign for the rural community in Bangladesh. Very little has so
far been done to help the people in extreme distress in northern districts. Solution of the Monga
problem lies in creation of employment opportunities in these districts. Some opportunities for
employment creation may be through crop diversification, embroidery and other non-farm
works, food for works, special programmes for the development of char area. A recent
publication (The Food Security Atlas of Bangladesh 2004) by the United Nations World Food
Programme and the Government of Bangladesh has successfully delineated union level poverty
map (probability of high level of extreme poverty). This map may be used for efficient use and
targeting of safety net programmes such as food for work, food for education, vulnerable group
feeding (VGF), vulnerable group development (VGD), etc. Unions experiencing higher intensity

CPD: IRBD FY05 (First Interim)
111
of poverty should be targetted for greater intensity of efforts. Another implication is that
strengthening special and targeted employment programmes for the vulnerable poor should get
priority in the unions with high incidence of poverty.
11.4 Increase in Diesel Price
In December 2004, Government has increased price of diesel from Tk. 20 to Tk. 23. Diesel is an
essential commodity for irrigation and operation of power tiller (for land preparation) and for
transport services. Total amount of diesel sold in FY04 was 2.00 million metric tonnes against
1.82 million metric tonnes in FY03. That is, use of diesel has increased by 10.43 percent in
FY04. Usually, more than 60 percent of the diesel is sold during the Rabi season (December-
May). Potential demand for diesel during December’04-April’05 has been estimated as 1.1
million metric tonnes. Thus, the government decision will generate about Tk 600 crore in FY05
and about Tk 330 crore during the Rabi season from selling of diesel. However, this decision
might have serious negative impact on the Bangladesh economy particularly on the rising price
level due to unavoidable increase in transportation cost, and increased irrigation and land
preparation costs for Boro rice cultivation.
Boro rice is an irrigated crop and without irrigation one cannot grow Boro rice. According to the
Census of Minor Irrigation 2000, 83 percent of the total irrigated area in Bangladesh is irrigated
through electricity operated engines while 17 percent of the total irrigated area is irrigated
through electricity operated engines (MoA, 2002). Currently, power tillers are used to a large
extent for land preparation which is also dependent on diesel. Thus, production activity and Boro
production depend largely on availability and price of diesel. This is the necessary condition
since Boro rice can not be grown without irrigation. Sufficient condition for Boro rice production
is availability of fertilizer and quality seed at affordable prices. It is well known that Bangladesh
has experienced a structural shift in food production at the end of the 20th century. Rice
production has shifted from a largely weather influenced Aman crop to an irrigated Boro crop,
which is much more sensitive to the quality of public policy and governance than the vagaries of
nature. In recent years, wheat production has been consistently declining. In 2003/04, wheat
production was 16.85 percent less than previous year’s production. Therefore, food production

CPD: IRBD FY05 (First Interim)
112
largely depends on the production of Boro rice. Policy makers in no way can be reluctant in
taking appropriate policy actions.
11.5 Implications for Food Security Price of essential commodities particularly rice is very high in FY05, compared to other years.
Domestic prices of foodgrains (rice and wheat) are consistently increasing in subsequent months
of FY05. International prices of rice are also increasing and expected to increase further in the
coming months due to lower production prospect of rice in Thailand, Vietnam and India as a
result of abnormal dryness this year. An analysis of Bangladesh’s wholesale price with the
import parity price of rice from Thailand, Vietnam and India revealed that Bangladesh’s price is
lower than that of Thailand and Vietnam and slightly higher than import parity price of India.
Therefore, large import of quality rice from the world market at a cheaper price may not be
possible. Total import of foodgarins during July-December 2004 was lower than the
corresponding months of the previous year (FY04). Production of Aus and Aman rice in
Bangladesh in FY05 is much lower than last year due to end-July to mid-August flood and
excessive rainfall in September.
Considering these realities, the government must have to encourage increased production of
Boro rice to ensure food production and food security in the country. In this context, government
decision of increasing diesel price from Tk 20 to Tk 23 in December 2004 will adversely affect
Boro rice production and, thereby, food security of the country. It may be noted that Boro rice
contributes about 50 percent of the total rice production in the country and Boro rice cannot be
grown without irrigation. Currently, 83 percent of the irrigation is done through the diesel
operated irrigation engines. Farmers also depend on diesel operated power tillers for land
preparation for Boro rice cultivation. Therefore, government must review the decision of
increase in diesel price. To minimize the loss of the Bangladesh Petroleum Corporation (BPC)
and maintain low price of petroleum products particularly of diesel the government may consider
reduction of import tariffs for such products.
XII. EXCHANGE RATE SITUATION
CPD: IRBD FY05 (First Interim)
113
12.1. Exchange Rate Behaviour: Is there Any Significant Change Since Floating Mechanism?
In May 2003 the government announced the full free floating of exchange rate in Bangladesh. It
was a historic move towards application of market mechanism in macroeconomic management.
It was anticipated that the shift from a managed floating system to free floating will have an
impact on the foreign exchange market and market distortion prevailed in the exchange rate
would be corrected.. Earlier Bangladesh Bank calculated regularly real effective exchange rate
(REER) using a basket pegging formula with USD as a lead currency. Based on the REER and
other macroeconomic considerations Bangladesh Bank announced a buying and selling rate for
the foreign exchange dealers. The lower and higher limits of buying and selling rates were
mandatory for the dealers. Since the announcement of switching to the free floating system there
is no limit in buying and selling rates to be practiced by the foreign exchange dealers. However,
Bangladesh Bank continues to calculate the REER to monitor the market trends for necessary
intervention.
The exchange rate data analysis does not show any evidence of market correction which ought to
take place after May 2003. In figure 63 nominal effective exchange of USD and EURO does not
show any sign of market correction. Furthermore, the movement of exchange rate of Taka
against USD and EURO are almost in perfect tandem with the movement of EURO and USD in
the international market [Figure 65]. The estimation of NEER and REER based on the monthly
average exchange rate data in Bangladesh and Reuters system and CPI data from the IFS shows
that Taka is still appreciated. The real effective exchange rate of Taka against USD and Euro are
both above 100 and both are still appreciated by 11.06 per cent and 14.69 per cent respectively
[see Figure 64].
The appreciation of major currencies is difficult to explain. One possible explanation may be the
overwhelming control of the market is in the hands of four NCBs. Other PCBs also generally
follow the rate announced by the NCBs. As the USD was weak in the international market even
before the floating exchange rate system, the correction was not forced by the market. It is also
thought that improvement in foreign exchange reserve also facilitated the stable situation. The
demand for foreign currencies in Bangladesh is generally inelastic, which is caused by the

CPD: IRBD FY05 (First Interim)
114
secular trend in import payments and under-developed foreign exchange market. The
determinant factor is the Euro-Dollar rate in the international inter-bank market. Sometimes
temporary surge in demand creates temporary deviation. As a result since May 2003 the rate of
USD was stable except for some temporary surge and Taka fell against Euro according to the
global movement of these two currencies.
Figure 64
Movement of NER and REER for USD and EURO
55
60
65
70
75
80
Jul.
2002
Au
g. 2
002
Se
p. 2
002
O
ct. 2
002
N
ov. 2
002
D
ec. 2
002
Ja
n. 2
003
Fe
b. 2
003
M
ar. 2
003
Ap
r. 20
03
May
. 200
3
Jun.
200
3
Jul.
2003
Au
g. 2
003
Se
p. 2
003
O
ct. 2
003
N
ov. 2
003
D
ec. 2
003
Ja
n. 2
004
Fe
b. 2
004
M
ar. 2
004
Ap
r. 20
04
May
. 200
4
Jun.
200
4
Jul.2
004
Aug.
2004
Sep.
2004
period
NE
R, U
SD
and
EU
RO
100
102
104
106
108
110
112
114
116
RE
ER
, US
D a
nd E
UR
O
NER USD NER EURO REER USD REER EURO

CPD: IRBD FY05 (First Interim)
115
Figure 65 Comparative Movement of Euro-USD Cross Rate in Bangladesh and Global Euro-USD Rates,
Monthly Average
0.800
0.850
0.900
0.950
1.000
1.050
1.100
1.150
1.200
1.250
1.300
Jul.
2000
Oct
. 200
0
Jan.
200
1
Apr
. 200
1
Jul.
2001
Oct
. 200
1
Jan.
200
2
Apr
. 200
2
Jul.
2002
Oct
. 200
2
Jan.
200
3
Apr
. 200
3
Jul.
2003
Oct
. 200
3
Jan.
200
4
Apr
. 200
4
Jul.2
004
Peiord
US
d pe
r Eur
o
EURO-USD Global Euro-Usd cross rate
The hypothesis of dominance of NCBs during first two weeks of January 2005 became explicit
when PCBs traded USD at a rate which was Taka 2-3 higher than the rate offered by the NCBs.
Only the PCBs responded this time to the turn around of USD in the international market and to
temporary surge of demand for USD. On the other hand the response of the NCBs was slow
which causes such peculiar situation. Figure 65 also shows that the recent rise in the price of
USD was caused by the turn around of the USD in the international market and impact of
temporary surge in demand is also obvious. It might happen that this time the market will absorb
the rise in the USD price and a partial correction of appreciation may sustain.
As the market is yet to respond to the free floating system the true test of managing a floating
exchange rate system is still ahead. According to the Commerzbank Research (2004) the Euro-
Dollar rate will start to reverse in May-June 2005 and will reach 1.28 or less. Having a positive
forecast of the economic growth in the Europe the rate might be improved in favour of USD
further. It would be interesting to observe whether the impact of such exchange rate behavour in
the global market could be ignored by Bangladeshi inter-bank market.

CPD: IRBD FY05 (First Interim)
116
Bangladesh Bank may exercise some market intervention to cause devaluation of USD against
Taka which might create some positive impact on the export of Bangladeshi products to the US
market. This exercise could be useful during the first two quarters of FY2005. Although it would
not be required by the Bangladesh Bank if a market shift takes place in the upcoming period as a
result correction of expectation in China by the buyers.
Figure 66. Movement of EURO-USD Global Exchnage Rate and EURO-USD Cross Rate, November 2004 - Janaury 10, 2005
1.2200
1.2400
1.2600
1.2800
1.3000
1.3200
1.3400
1.3600
1.3800
11/1
/200
4
11/8
/200
4
11/1
5/20
04
11/2
2/20
04
11/2
9/20
04
12/6
/200
4
12/1
3/20
04
12/2
0/20
04
12/2
7/20
04
1/3/
2005
1/10
/200
5
Date
USD
per
EU
RO
EURO-USD Global Rate
EURO-USD Cross Rate
12.2 Export Performance of Bangladesh: Does Exchange Rate Matter? During the last three years Bangladesh’s export to EU has increased at a faster pace compared to
the previous period (22.38 per cent in FY 2004). On the other hand, the export in the US market
was on the decline (-4.56 per cent in FY 2004). The relatively open market policy of the EU for
the LDCs under the GSP schemes and the EU-EBA and greater demand for knitwear products in
which Bangladeshi producers are more competitive were perceived as major reasons for export
growth in the EU. On the other hand, the exclusion of Bangladesh from US preferential

CPD: IRBD FY05 (First Interim)
117
treatment for LDCs was perceived as the main reason for the decline of export from Bangladesh.
Many also argue that export growth in the EU market was because of improvement in
productivity and lead-time. However, productivity and lead-time arguments and preferential
market access can not fully explain such phenomenon. Economists argue that exchange rate
movement has also played an important role in this context.
As regards the implications of exchange rate movement there are two opinions. According to
one, a conscious government policy of significant devaluation of Taka against EURO has made
Bangladeshi exports more competitive in the Euro-denominated market. On the other hand, USD
was kept in line more or less with linear devaluation; as a result export to US market has not
benefited much and was left to the market mechanism considering other implications. One can
also substantiate this argument by comparing the devaluation of Taka against Euro and
devaluation of Taka against USD. Since July 2000 Taka was depreciated against Euro by 68.4
per cent. On the other hand Taka against USD was depreciated only by 29.2 per cent [see Figure
67]18.
The second opinion suggests that it was not the policy of conscious deeper devaluation of Taka
against Euro, rather global devaluation of USD has added extra premium in the competitiveness
of Bangladeshi products to the EU market. The movement of cross rate of Euro-USD (the rate
derived from the exchange rate of Taka against USD and Taka against EURO in the Bangladesh
inter-bank FOREX market) and inter-bank exchange rate of EURO against USD in the global
market [see Figure 65] shows that since July 2000 the cross rate of EURO-USD was moving
along the global EURO-USD inter-bank exchange rate, with a few exceptions. Figure 65 shows
no significant difference between these two rates which confirms that Bangladesh Bank’s
intervention, if any, did not impact on ‘apparently deeper depreciation’ of Taka against Euro. An
econometric exercise was performed at the CPD to capture the impact of exchange rate change
and volatility on export performance of Bangladesh. The model was run through unit-root test of
the variables, co-integration and error correction process (Raihan 2005). The exercise shows that
devaluation of Taka against EURO played a clear positive role in terms of export gain in the EU 18 The period July 2000 as taken as the base period for several reasons. Firstly, it is two years before of reverse relationship of USD against Euro. Thus, the period before the reverse relationship and after the reverse relationship are more or equal. The July 2000 period is also before the Bangladesh government’s official announcement of shifting the exchange rate mechanism from managed floating (basket-pegging) to free floating.

CPD: IRBD FY05 (First Interim)
118
market. During the period in question, one percent devaluation generated 1.25 per cent growth in
export in the EU market.
One may question how Bangladesh’s export in the US market has increased in recent months
despite the abovementioned EURO-USD exchange rate trend. This turn around of Bangladeshi
export to the US may have taken place for other reasons like sanctions on China, correction of
earlier pessimism etc.
Figure 67. Depreciation of Some Selected Currencies, Base Period June 2000
-20
-10
0
10
20
30
40
50
60
70
80
Jul.
2000
Sep
. 200
0
Nov
. 200
0
Jan.
200
1
Mar
. 200
1
May
. 200
1
Jul.
2001
Sep
. 200
1
Nov
. 200
1
Jan.
200
2
Mar
. 200
2
May
. 200
2
Jul.
2002
Sep
. 200
2
Nov
. 200
2
Jan.
200
3
Mar
. 200
3
May
. 200
3
Jul.
2003
Sep
. 200
3
Nov
. 200
3
Jan.
200
4
Mar
. 200
4
May
. 200
4
Jul.2
004
Sep
.200
4
Period, Month
Perc
ent c
hang
e
EURO-USD USD-Tk EURO-Tk
In conclusion, two important trends have been identified. Firstly, Bangladeshi taka is still
appreciated against major currencies despite the official announcement of adopting free floating
exchanger ate mechanism. Secondly, Bangladeshi exports in EU market received extra exchange
rate premium and exports to EU increased due to interalia, this exchange rate premium. The
extra exchange rate premium was received due to secular fall of USD against the EURO in the
global inter-bank foreign exchange market.

CPD: IRBD FY05 (First Interim)
119
XIII. PRSP AND IPRSP: A COMPARISON OF MEDIUM TERM MACROECONOMIC FRAMEWORK
The PRSP has specified a Medium Term Macroeconomic Framework (MTMF) to facilitate the
implementation of the poverty reduction strategy. Here, we have compared the MTMF adopted
in the Interim PRSP (IPRSP) and PRSP.
13.1 Targets for Economic Growth and Money Supply In the IPRSP, real GDP growth was targeted as 6.0 percent in FY05, 6.5 percent in FY06 and 6.5
percent in FY07 (Table 14). In PRSP, targeted GDP growth is 5.5 percent in FY05, 6.0 percent
in FY06 and 6.5 percent in FY07. It may be noted that economists argue that for faster poverty
reduction in Bangladesh, we must aim for double digit growth. Thus, it seems that GDP targets
are much below the need of the country and have further been lowered down than the PRSP
targets.
Targets for mobilising domestic investment are not sufficiently ambitious enough. In case of CPI
inflation targets have been raised. IPRSP targeted that inflation would be within the range of 4
percent per annum but the PRSP targeted for 6.5 percent inflation in FY05, 5.5 percent in FY06
and 5.0 percent in FY07. Actual inflation in the benchmark year (FY03) was 4.4 percent.
Available information suggests that during the early months of FY05 (July – October) CPI
inflation rate was 6.61 percent which is much higher than the actual in the beginning of this
century (1.94 percent in FY01) and even higher than already very high target (6.5 percent) in
FY05. Increase in general price level effects the real income by eroding purchasing power of the
individual and negatively effects the poverty situation. Therefore, setting the higher inflation
target is surely a negative signal to the poverty reduction commitment revealed through the
PRSP.
Targets for private sector credit and broad money (M2) supply has been set upward in the PRSP
than in the IPRSP (Table 15).

CPD: IRBD FY05 (First Interim)
120
TABLE 14 TARGETS FOR ECONOMIC GROWTH IN IPRSP AND PRSP
Indicator Year IPRSP PRSP Real GDP Growth (%) FY03 (Actual) 5.3 FY04 (Estimate) 5.5 FY05 6.0 5.5 FY06 6.5 6.0 FY07 6.5 6.5 Gross Domestic Investment (percent of GDP)
FY03 (Actual) 23.43
FY04 (Estimate) 24.20 FY05 24.20 FY06 26.40 FY07 28.60 Nominal GDP (in Billion Taka) FY03 (Actual) 3005.8 FY04 (Estimate) 3245.0 FY05 3636 3628.9 FY06 4023 4038.9 FY07 4450 4495.9 CPI Inflation (annual average) FY03 (Actual) 4.4 FY04 (Estimate) 5.8 FY05 4.0 6.5 FY06 4.0 5.5 FY07 4.0 5.0
TABLE 15 TARGETS FOR MONEY SUPPLY (PERCENT CHANGE IN MONEY
AND CREDIT) IN IPRSP AND PRSP Indicator Year IPRSP PRSP Private Sector Credit FY03 (Actual) 12.6 FY04 (Estimate) 12.0 FY05 11.8 14.5 FY06 11.6 15.0 FY07 11.7 15.2 Broad Money (M2) FY03 (Actual) 15.6 FY04 (Estimate) 14.1 FY05 12.8 14.0 FY06 11.9 13.8 FY07 11.8 13.5

CPD: IRBD FY05 (First Interim)
121
13.2 Government Revenue and Public Expenditure Targets for revenue collection as well as for public expenditure have been lowered down. In
IPRSP, targets for total revenue collection in FY05, FY06 and FY07 were set as 11.3, 11.9 and
12.2 percent of the GDP (Table 16). On the other hand, in the PRSP, targets for total revenue
collection in FY05, FY06 and FY07 were set as 10.7, 11.2 and 11.7 percent of the GDP. In case
of total public expenditure, IPRSP projected a target of 16.1, 16.4 and 16.4 percent of GDP in
FY04, FY05 and FY06, respectively. In PRSP, corresponding figures are 15.4, 15.8 and 16.2
percent only.
TABLE 16 TARGETS FOR GOVERNMENT REVENUE AND PUBLIC EXPENDITURE
AS PERCENT OF GDP IN IPRSP AND PRSP Indicator Year IPRSP PRSP TOTAL REVENUE FY03 (Actual) 10.3 FY04 (Estimate) 10.2 FY05 11.3 10.7 FY06 11.9 11.2 FY07 12.2 11.7 Tax FY03 (Actual) 8.3 FY04 (Estimate) 8.2 FY05 9.2 8.7 FY06 9.7 9.1 FY07 10.0 9.6 Non-Tax FY03 (Actual) 2.0 FY04 (Estimate) 2.0 FY05 2.1 2.0 FY06 2.1 2.1 FY07 2.2 2.1 TOTAL EXPENDITURE FY03 (Actual) 13.7 FY04 (Estimate) 13.4 FY05 16.1 15.4 FY06 16.4 15.8 FY07 16.4 16.2 Current Expenditure FY03 (Actual) 8.1 FY04 (Estimate) 8.0 FY05 8.4 8.2 FY06 8.4 8.4 FY07 8.5 8.7 Of which: Interest Payments FY03 (Actual) 1.9 FY04 (Estimate) 1.7 FY05 2.0 1.8 FY06 2.0 1.7 FY07 2.0 1.7 Annual Development Programme FY03 (Actual) 5.4

CPD: IRBD FY05 (First Interim)
122
Indicator Year IPRSP PRSP FY04 (Estimate) 5.2 FY05 6.5 6.2 FY06 6.9 6.4 FY07 7.0 6.7 Others FY03 (Actual) 0.2 FY04 (Estimate) 0.2 FY05 0.6 1.0 FY06 0.6 1.0 FY07 0.6 0.8 OVERALL BALANCE FY03 (Actual) -3.4 FY04 (Estimate) -3.2 FY05 -4.7 -4.7 FY06 -4.5 -4.6 FY07 -4.2 -4.5 FINANCING (NET) Domestic Borrowing FY03 (Actual) 1.3 FY04 (Estimate) 2.1 FY05 1.9 1.9 FY06 1.9 1.9 FY07 1.9 1.9 External Loans and Grants FY03 (Actual) 2.1 FY04 (Estimate) 1.1 FY05 2.8 2.8 FY06 2.6 2.7 FY07 2.3 2.6 TOTAL GOVERNMENT DEBT FY03 (Actual) 51.0 FY04 (Estimate) 48.3 FY05 48.4 47.9 FY06 47.6 46.3 FY07 46.5 45.3 13.3 Balance of Payments A comparison of projected Balance of Payments in IPRSP and PRSP revealed a lower export
growth and higher import growth is projected in the PRSP. IPRSP projected export growth by
9.0 percent in FY05, 9.0 percent in FY06, and 9.1 percent in FY07 (Table 17). However, the
PRSP projected export growth in FY05, FY06 and FY07 is 8.0, 6.0 and 7.0 percent, respectively.
In case of imports, IPRSP projected a growth rate of 6.3, 6.4 and 5.2 percent in FY05, FY06 and
FY07, respectively. On the other hand, PRSP projected an import growth of 14.5, 9.0 and 9.5
percent in FY05, FY06 and FY07, respectively.

CPD: IRBD FY05 (First Interim)
123
IPRSP aimed for gross official reserve to meet up the import demands of 3.0 months in FY05,
3.2 months in FY06 and 3.3 months in FY07, respectively. The PRSP aimed for a gross official
reserve which can meet up the demands for 2.9 months only.
TABLE 17
TARGETS FOR BALANCE OF PAYMENTS IN IPRSP AND PRSP Indicator Year IPRSP PRSP Exports, f.o.b. (millions of US Dollar) FY03 (Actual) 6492.0 FY04 (Estimate) 7521.0 FY05 7217 8122.0 FY06 7869 8609.0 FY07 8587 9212.0 Exports (percent change) FY03 (Actual) 9.5 FY04 (Estimate) 15.8 FY05 9.0 8.0 FY06 9.0 6.0 FY07 9.1 7.0 Imports, c.i.f. (millions of US Dollar) FY03 (Actual) 8707.0 FY04 (Estimate) 9898.0 FY05 11267.0 FY06 12281.0 FY07 13447.0 Imports (percent change) FY03 (Actual) 8.7 FY04 (Estimate) 9.9 FY05 6.3 14.5 FY06 6.4 9.0 FY07 5.2 9.5 Remittances FY03 (Actual) 3062.0 FY04 (Estimate) 3371.0 FY05 3621.0 FY06 3782.0 FY07 3936.0 CURRENT ACCOUNT BALANCE FY03 (Actual) 328 FY04 (Estimate) -25 FY05 -622 FY06 -835 FY07 -779 Gross Official Reserve (million US dollar) FY03 (Actual) 2471.0 FY04 (Estimate) 2714.0 FY05 2937 3200.0 FY06 3314 3450.0 FY07 3587 3750.0 Gross Official Reserve in Months of Imports FY03 (Actual) 2471.0 FY04 (Estimate) 2714.0 FY05 3.0 2.9 FY06 3.2 2.9 FY07 3.3 2.9

CPD: IRBD FY05 (First Interim)
124
13.4 Conclusion Our comparative analysis of the Medium Term Macroeconomic Framework (MTMF) mentioned
in the IPRSP and PRSP clearly revealed that PRSP is less ambitious than the IPRSP in almost all
respect. Neither the IPRSP nor the PRSP aimed high enough to cater the need of the country’s
demand in terms of volume of economic growth, export growth and to increase the real income
level. In brief, the PRSP is neither commensurate with our realities nor reflect our aspiration.
XIV. CONCLUDING BALANCE SHEET
The foregoing analysis of the major macro-economic trends and development in the real
economy suggest that the overall state of the Bangladesh economy remained steady during the
first half of the fiscal year 2004-05. During the first half of FY05, the economy was positioned
between the twin shocks of Floods 2004 and total phase-out of the MFA. As of date the economy
has recovered reasonably well from the flood related devastations though any adverse
consequences of full quota removal is yet to show up.
The economy may very well achieve the scaled downed GDP growth target of 5.5 percent.
However, Bangladesh’s current growth performance needs to be viewed in a comparative
framework. There are signals that the growth momentum has slowed down during the last five
years (FY00-04). It is currently lagging behind among its South Asian neighbours in terms of
GDP growth performance.
This implies that, notwithstanding the macro-economic stability has improved during the last
couple of years, the growth payoff had not been adequate. It is now well established that macro-
economic stability is a necessary condition, but not a sufficient condition for better economic
growth. Admittedly, complementary reforms to improve the micro-conditions for economic
growth acquire critical importance in this respect. Thus, it is suggested that the apparent macro-
economic stability suffers from both fragility and credibility gap.
The major source of the fragility emanates from the stagnating investment scenario of the
country. As has been mentioned that the apparently buoyant proxy indictors of investment (e.g.

CPD: IRBD FY05 (First Interim)
125
term loan disbursement and import of capital machinery) take a new meaning when we observe
the stagnating national investment rate. It is now being further contended that the failure to
deliver an augmented package of public investment projects remains as the root cause of the
aggregate investment stagnation. The private investment rate continues to remain subdued as it is
deprived of the crowding in effect of a vigorous investment programme.
Systematic inability to implement an enlarged ADP is the primary cause of the prevailing
investment deficit. One may identify a range of issue to explain the low implementation rate of
ADP, but it seems that the major problem is contracting these usually lumpy projects to suitable
companies. This process has often been afflicted by uncertainty leading to long gestation period
as well as characterised by inadequate transparency resulting in cost escalation. One may cite a
long list of big projects which did not get materialised during the recent past in this regard.
The lack of predictability and inadequate transparency in economic transactions in the public
sector have had concomitant negative impact on the private sector investment.
The second source of weakness underlying the growth payoff situation comes from the
credibility gap emanating slow progress in market facilitating reforms. These basically relate to
the improvement of governance in public infrastructural facilities and utilities, regulatory
framework for capital and debt market, contract enforcement through judicial process,
transparency in public expenditure etc.
Apart from the issues of slowdown of the growth momentum, the other aspect of the growth
scenario relates to its inequitable distribution. It is held that some of the current sources of
growth are supposed to be pro-poor, e.g. crop sector and export-oriented manufacturing.
However, some other sources of the current growth are more dominant and income inequaliser –
foreign remittances and rural non-farm activities.
Although poverty data are not available for recent years, all proxy indicators suggest that income
disparity is accentuating in the country. Such a situation is underwritten not only by the structure
and nature of GDP growth, but also other macro-economic trends — e.g. food price rise,

CPD: IRBD FY05 (First Interim)
126
shortfall in public investment, faster growth of VAT in comparison to direct taxes, inadequate
credit flow to rural areas.
What is disturbing is that the mid-term macro-economic framework has settled for a less
ambitious targets admitting these realities and not positioning itself for addressing the national
aspirations. The MTMF remains seriously flawed as it followed the IMF projection of export
collapse in Bangladesh following the MFA phase-out.
During the first half of the FY05, major strength was observed in domestic credit, industrial
credit, capital market, export, import, remittance and forex reserve. On the other hand, major
weakness was witnessed by domestic savings, public investment, agricultural credit, price
inflation (food), agricultural output and foreign aid. In between, areas that remained indifferent
include growth, revenue receipts, fiscal deficit, government borrowing, industrial product, FDI
and BoP. However five major concerns for the economy during the next six months would be the
food price inflation, Boro production, ADP implementation, utilisation of foreign aid and IPOs in
capital market.

CPD: IRBD FY05 (First Interim)
127
CPD-IRBD 2005 (First Reading)
January 12, 2005
Box 2 A Balance Sheet of Bangladesh Economy
Indicator Fiscal Year 2000-2003 Fiscal Year 2004 Early Signal of Fiscal Year 2005 GDP growth Hovering around 5.5% mark, 4.4% in FY02 5.5%, in line with the IPRSP target but
slowdown in the growth momentum; compares unfavourably with the record figure of 5.9% in FY00; moderate compared to South Asian countries
Revised downwards from 6.0% to 5.5% in national PRSP
Savings-Investment Scenario
Stagnating savings-investment scenario Failed to achieve the IPRSP target; major concern is domestic savings and public investment
Targets to be hardly achieved; investment deficit syndrome
Revenue Receipts Revenue receipt in line of the target, increased to 10.4% of GDP in FY03 from 8.5% of FY00
14% higher than last year, still failed to achieve target; low tax-GDP; Inefficient tax system in financing public services and redistribution of income
16.6% targeted growth over the revised budget of last year; 9.5% growth in NBR tax collection in July-Oct FY05 over the matching months of last year
Public Expenditure Around 14%-15% of GDP throughout the period 12.3% growth over last year Attempts to budget restructuring a. Revenue
Expenditure b. ADP
Revenue expenditure in line with target, even exceeded in some cases ADP implementation never achieved target
Only 89% of the revised and 83% of the original target of ADP was actually implemented
15.8% higher than revised ADP of FY04 and 30.3% higher than the actual implementation of FY04; 10% realisation of the target ADP in the first quarter: implementation is a major challenges of this year’s ambitious target
Fiscal Deficit Fiscal deficit as % of GDP is decreasing; foreign financing is also decreasing
Deficit as % of GDP increased to 4.2 per cent, from 3.5 per cent of FY03; share of foreign resources in deficit financing decreased further
Targeted fiscal deficit is 4.3% of GDP; foreign financing is expected to increase. Fiscal deficit may fall due to ADP shortfall
Domestic Credit Expansion
Slow down in domestic credit expansion, Fiscal consolidation
Private sector credit grew faster at 16.2 per cent; overall growth is 15 per cent
15% growth in October 2004, on point to point basis; increasing trend in growth since August 2004, share of private growth is 15.6%
Government Borrowings & Public Debt
Government borrowing both from banking and non-bank sector increased with the exception of FY03; Debt outstanding as % of GDP crossed the 50 per cent mark
Government borrowing from the banking sector increased while non-bank borrowing decreased; debt outstanding as % of GDP came down to 48.2 per cent
The lowering of interest rate backfired with a drastic fall in sale if NSD certificate; shift from non-bank resources to borrowing from banking sector during July-October FY05
Agricultural Credit Actual disbursement is lower than the targeted figure; recovery shows an increasing trend
Disbursement fell short of target by 8%; recovery performance which was improving since FY01, suddenly declined in FY04
Post-flood disbursement of agricultural credit falls short of the target as only 20.85% of the total target was disbursed

CPD: IRBD FY05 (First Interim)
128
Indicator Fiscal Year 2000-2003 Fiscal Year 2004 Early Signal of Fiscal Year 2005 during the first four months of FY05
Industrial Credit Slowdown in growth of industrial loans since FY01 Term loan disbursement shows an impressive growth of 67%; net flow to the sector is 1.3 billion taka
Expansionary trend in term loan disbursement continued in the first quarter of FY05; no recovery data available; PCB (L) consolidate as the major supplier.
Loan classification Loan default situation shows no improvement; classified loan as % of total shows an increasing trend
Classified loan as % of total outstanding decreased to 21.5 per cent; 82% of the classified loan is categorised as bad/loss
No data available
Price & Wage Inflation
Appreciably low inflation rate, higher rural inflation Still moderate, but upward trend Increased food price coupled with weakening of Taka against Dollar and rising import price led to high inflation rate in October 2004. Low production of Aman and increase of diesel price will tend to raise inflation until the harvest of Boro production in April-May.
Agricultural output Agricultural sector demonstrated varying performance; food grain production was highest in FY01 (until that time) but declined in FY02 for the first time since FY96. Food grain production increased in FY03.
Foodgrain production recorded highest production (27.4 million metric tons) since independence; rice production increased by almost 4% but wheat production decreased by 16.8%. Thus, increase in Aman and Boro rice production was behind the record production of foodgrains
Target set at 30 million metric tons which is 9.3% higher than actual production of last year; Aus production failed to achieve target; decrease in Aman area, dominance of local varieties and drought would have a negative effect on Aman production; Food import decreased by 16% during July-December of FY05 over the matching figure of FY04
Industrial Production Expanded at a slightly lower than average rate (6.0 percent). Growth deceleration observed in FY02 that marginally recovered in FY03.
Restrained expansion continued. However still a lacklustre growth as it rests on a very narrow base.
Moderate recovery during the first four months of the FY05 after the devastating flood. However production of export related items shows higher growths.
Foreign Investment Systematic decline observed that ended up with a (-) 26.24% negative growth in FY02. Investment in FY03 stagnated with a marginal growth (8.98%).
Inadequate recovery effort with only 2.4 percent growth in FDI and 5.0 percent growth in total foreign investment. Portfolio investment increased on a faster pace.
During the first quarter, FDI observes marginal growth (6.25 percent) on a moderate benchmark. Growth in EZP (29.89%) attributed to the overall 9.5 percent growth as no portfolio investment came during this time.
Capital Market Capital market experienced a slow but steady recovery since the 1996 incident
Resurgence continues. New IPOs came into the market. Bullish trend observed from mid-November which gathered momentum in the early part of December recording a 1015.97 general index for the first time after 1996
Spectacular upsurge in all share price index and in over subscription of IPOs. However this is mostly due to the absence of new IPO and loss of income potentials emanating from lowering interest rates. If new IPOs do not come, this will drop down quickly.
Export Recovery in FY2003 following previous year’s deceleration
Continuing upward trend but uncertainty as regards MFA phase out.
Phenomenal growth of knit, robust growth of woven; withstands pressure emerging

CPD: IRBD FY05 (First Interim)
129
Indicator Fiscal Year 2000-2003 Fiscal Year 2004 Early Signal of Fiscal Year 2005 from quota derestriction.
Import Following negative growth in FY2002 import picked up in FY2003
Import momentum has continued in FY2004. Import of Capital goods and textile related articles pick up with respective share of 25% and 21%.
25% increase in imports, L/C openings promise high growth in FY2005. Food grain import decreases by almost 40 per cent, production related imports pick-up; oil price hike also causes rise in import.
Remittances After some deceleration in FY2001, remittance started to rise sharply in FY2002 and continued to rise in FY2003. Emerges as a major forex source.
Growth rate slowed but still high at 10.1%; government policies start to give dividend.
14.2% growth in first six months; if trend continues flow will cross $ 3.5 billion mark in FY2005.
Foreign Aid After a decline over three years, foreign aid disbursement picked up in FY2003, to reach $1577 million.
Aid disbursement falls sharply to reach $954 million (a drop of 40%); problems with project aid disbursement continue.
Aid disbursement situation worsening. Increasing gap between commitment and disbursement; only 10% aid disbursed in the first quarter.
Foreign Exchange Reserve
Forex reserves started to rise thanks mainly to higher export and remittance
Reserves at the end of the year stood at 2.7 billion US$. Record high since FY95
On January 04, reserves stood at $3.26 billion, crossing the 1995 high mark ($3.07 billion), providing a cushion for about 3 months of imports.
Balance of Payments After a negative overall balance in FY2001 (-281 million US$), the balance was positive in FY2002 ($408 million) and further improved in FY2003 to reach $815 million.
Trade balance deteriorated, but current account balance improved due to high growth of remittances.
Higher imports led to increase in deficit in trade balance; however, higher current transfers contributed to a rise in current account balance by about 25% in the first quarter ($284 millions).

CPD: IRBD FY05 (First Interim)
130
Box 3
Major Findings of the Thematic Issues ASSESSMENT OF FLOOD 2004
• CPD’s preliminary (up to 4 August 2004) estimate of damage due to Flood 2004 was to the tune of Tk. 11,418.6 crore or US$ 1.93 billion with an anticipation of ranging to Tk. 15,000 (US$2.54 billion) after the final assessment.
• CPD’s updated damage estimate due to Flood 2004 stands at about Tk. 11,760 or US$ 1.99 billion - about Tk 341 crore more than CPD’s preliminary estimate
• Damage due to heavy rainfall stands at Tk. 1733.8 crore or US$ 0.29 billion for the agricultural sector (crop and fisheries).
• CPD’s final damage estimates due to Flood and Rain is Tk.13,493.8 crore or US$ 2.29 billion.
• Domestic resources can, by and large, finance the reconstruction work. • Block allocation in the ADP till September 2004 unutilised. • GOB has approved a two-year massive flood rehabilitation programme for in
collaboration with ADB. • Field visits by CPD Team in November 2004 show that reconstruction of roads
and bridges has not started as yet; the preparation to call for tenders is almost complete.
• GOB programmes are in line with CPD recommended policy package. Many remain to be implemented.
• Rising food prices due to poor harvest of aman crop following the flood has resulted in high inflation.
• MFA PHASE-OUT
• Recent trends show that exports during July-October period of FY2005 was 24.6 per cent higher compared to the matched period of FY2004, with knit demonstrating a phenomenal growth of 40.4 per cent.
• Major challenges are related with China’s accession to the WTO, reduced lead time, erosion of quota-premium following the quota phase-out, implication of various RTAs and market access initiatives involving major buying countries, further lowering of MFN tariffs with consequent erosion of preferential margins, and increasing use of e-commerce in apparels trade and business.
• The ongoing restructuring (especially sourcing) will take some time to make its impact visible in the market place.
• There may be a situation where Bangladesh expands but with fewer firms operating in the sector, and with a reduced workforce.
• Some positive developments (related to China and Safeguard measures), may play favourably, but will not be wise for Bangladesh to overplay.
• The GOB has recently taken a number of steps including reduced number of steps in customs clearance, revised schedule of down payment for repayment of loan and elimination of VAT on selected items of expenditure.
• In view of this, following steps need to be taken: a) identify the competitive items and go for capacity building; b) create a Textile-RMG technology

CPD: IRBD FY05 (First Interim)
131
upgradation fund; c) invest in skill development through public-private partnership; d) reduce import duties/taxes on textile/RMG related machineries and raw materials; e) allow import of fabrics on duty-free basis, f) facilitate establishment of forward linkage activities through B to B web portals; g) need appropriate measures for redundant workers, many of them are women.
INVESTMENT SCENARIO IN THE PRIVATE SECTOR
• Investment in manufacturing and service sectors through debt financing increased to some extent, but has been concentrated only in a limited number of large and medium scale industries. Sluggish trend of investment in capital market.
• Major investment goes to textile and garments, iron and steel, drugs and pharmaceuticals, cement and asbestos.
• Country’s growing competitive advantage in the world market through MFA phase out, duty free access, special concession under SD&T makes it a better place for local and foreign investment.
• Increasing concentration would in other way reduce the scope of investment in small and cottage industries which will affect income and employment in the long run.
NCBs REFORM
• NCBs reform is necessary but the process, outcome and consequences should be further analysed. For three NCBs, the possible form of future ownership should be also open at this juncture.
• The success of the NCBs reform will depend on strong political will of the government. Because the problem of NCBs did not stem only from poor management of assets and liabilities, rather is associated with interference of the government into their operations and collusion of politics and business.
• As the financial deepening is taking place and financial market is expanding the dominance of state-owned banks is decreasing, which took place in a natural way. Thus, forceful divestment may not be required.
• The time frame for reform is very ambitious-- the initial schedule is already in jeopardy and the second phase of the reform will be more difficult.
• Since, all the functional areas under reform are the resultant of functioning of the bank at the branch level, the change only at the top management will not produce desired result.
• Restructuring the human resource including retrenchment is of urgent necessity, which would not be possible unless government have strong political will.
• Any reform of branch restructuring will reduce the access to banking services to the rural people as well as reduce resource mobilization through banking channel and investment from rural areas.
• It is really doubtful that private banks will be able to absorb the assets and liabilities of the NCBs with reduced branch networks
PRICES OF ESSENTIAL COMMODITIES AND FOOD SECURITY
• Price of essential commodities particularly rice is very high in FY05, compared to other years.
• Due to increasing rice prices in international market, large import of quality rice from world market at a cheaper price may not be possible. Total import of food grains during July-December 2004 was 16 percent lower than the corresponding months of the previous year (FY04).
• Production of Aus and Aman rice in Bangladesh in FY05 is much lower than last

CPD: IRBD FY05 (First Interim)
132
year due to end-July to mid-August flood and excessive rainfall in September. • Government must have to encourage increased production of Boro rice to ensure
food production and food security in the country. But the decision of increasing diesel price will adversely affect Boro rice production and, thereby, food security of the country.
EXCHANGE RATE MOVEMENTS
• The floating exchange rate mechanism could not remove market distortion yet in Bangladesh.
• The estimation of NER and REER shows that Taka is still appreciated by 11.06 per cent and 14.69 per cent against USD and EURO respectively.
• The possible factors are: a) overwhelming control of the market in the hands of four NCBs, b) weak USD in the international market; c) Inelastic demand for foreign currencies due to secular demand for import payments, d) improvement in foreign exchange reserve.
During the last three years Bangladesh’s export to EU has increased at a faster pace compared to the previous period, where devaluation of Taka against EURO and global devaluation of USD impacted positively.
PRSP AND IPRSP: A COMPARISON
• Although double digit growth of GDP is required, targets in IPRSP are much below and have further been lowered down in the PRSP.
• Targets for mobilizing domestic investment are not sufficiently ambitious enough. Therefore, setting the higher inflation target is surely a negative signal to the poverty reduction commitment revealed through the PRSP.
• Targets for revenue collection as well as for public expenditure have been lowered down.
• Projected Balance of Payments shows a lower export growth and higher import growth.
• Neither the IPRSP nor the PRSP aimed high enough to cater the need of the country’s demand in terms of volume of economic growth, export growth and to increase the real income level.
• The PRSP neither commensurate with our realities nor reflects our aspiration.