state of reliability 2016 - nerc analysis dl/2016_sor_report...nerc | state of reliability | may...
TRANSCRIPT

NERC | Report Title | Report Date I
State of Reliability 2016 May 2016

NERC | State of Reliability | May 2016 ii
Table of Contents
Preface ....................................................................................................................................................................... iii
Executive Summary ................................................................................................................................................... iv
Chapter 1 – Key Findings and Recommendations ......................................................................................................1
Chapter 2 – 2015 Reliability Highlights.......................................................................................................................5
Chapter 3 – Severity Risk Assessment and Availability Data Systems ........................................................................9
Chapter 4 – Reliability Indicator Trends .................................................................................................................. 22
Chapter 5 – Enforcement Metrics for Risk and Reliability Impact .......................................................................... 49
Chapter 6 – Event Analysis ...................................................................................................................................... 56
Chapter 7 – BES Security Metrics ............................................................................................................................ 63
Chapter 8 – Actions to Address Recommendations in Prior State of Reliability Reports ....................................... 69
Appendix A – Statistical Analysis of SRI Assessment ............................................................................................... 74
Appendix B – Statistical Analysis of Transmission Data .......................................................................................... 82
Appendix C – Analysis of Generation Data ............................................................................................................ 115
Appendix D – Analysis of Demand Response Data ................................................................................................ 123
Appendix E – Reliability Indicator Trends .............................................................................................................. 135
Appendix F – Event Analysis Discussion ................................................................................................................ 170
Appendix G – Abbreviations Used in This Report .................................................................................................. 178
Appendix H – Contributions .................................................................................................................................. 180

NERC | State of Reliability | May 2016 iii
Preface
The North American Electric Reliability Corporation (NERC) is a not-for-profit international regulatory authority whose mission is to assure the reliability of the bulk power system (BPS) in North America. NERC develops and enforces Reliability Standards; annually assesses seasonal and long‐term reliability; monitors the BPS through system awareness; and educates, trains, and certifies industry personnel. NERC’s area of responsibility spans the continental United States, Canada, and the northern portion of Baja California, Mexico. NERC is the Electric Reliability Organization (ERO) for North America, subject to oversight by the Federal Energy Regulatory Commission (FERC) and governmental authorities in Canada. NERC’s jurisdiction includes users, owners, and operators of the BPS, which serves more than 334 million people. The North American BPS is divided into eight Regional Entity (RE) boundaries, as shown in the map and corresponding table below.
The Regional boundaries in this map are approximate. The highlighted area between SPP and SERC denotes overlap as some load-serving entities participate in one Region while associated transmission owners/operators participate in another.
FRCC Florida Reliability Coordinating Council
MRO Midwest Reliability Organization
NPCC Northeast Power Coordinating Council
RF ReliabilityFirst
SERC SERC Reliability Corporation
SPP RE Southwest Power Pool Regional Entity
Texas RE Texas Reliability Entity
WECC Western Electricity Coordinating Council

NERC | State of Reliability | May 2016 iv
Executive Summary
NERC, as the ERO, is tasked with the mission of assuring the reliability of the North American BPS. This is done in a variety of ways, including through independent assessments like this State of Reliability 2016. This report focuses on the reliability performance of the BPS over the past year, identifies and quantifies risk and key areas for improvement, and highlights ongoing work by industry to improve reliability and resiliency. This report summarizes the results from ongoing activities to assure reliability across multiple horizons, including reliability assessments and system performance analyses. Analysis of system performance data enables NERC to identify risks to reliability, set priorities, and determine the effectiveness of mitigation efforts developed to control risks to reliability. Analysis of system performance data and trends are translated into key findings and recommendations as feedback into risk assessment and mitigation activities, standards development, and other process improvements. System Performance Assessment
NERC continues to measure ongoing system performance to identify emerging risks, prioritize mitigation activities, and assess the effectiveness of risk control activities. NERC conducts a number of activities focused on addressing risks to reliability that are based on early analysis of system performance data. For example, NERC initiated risk mitigation efforts to improve frequency response (one of the essential reliability services (ERSs)), misoperation rates of protection systems, and performance of generating plants during extremely cold temperatures. Further, NERC initiated reliability assurance activities, such as identifying good utility practices to ensure that there are no discrepancies between design and actual transmission facility ratings, assessing registered entity restoration and recovery plans, and improving readiness for physical and cybersecurity. Along with data provided by industry through the information data systems for transmission, demand response, generation, and protection systems, NERC also gathers event information that is voluntarily provided by industry on events, categorized by their relative severity. The detailed event analyses have resulted in greater understanding of root causes of protection system misoperations and substation equipment failures. Risk mitigation activities are also initiated by NERC, such as meetings with registered entities, webinars, and workshops to highlight key reliability risks and mitigation activities. For example, based on the analysis of events, two major workshops took place, the Improving Human Performance on the Grid workshop and the NERC Monitoring and Situation Awareness workshop. As these risk control activities are put in place, progress will be measured toward their mitigation impacts. NERC gathers trend enforcement data using metrics that measure risk and reliability impacts. Two metrics were developed towards this objective: 1) the risk metric, which is the quarterly count of violations determined to have posed a serious risk to the BPS, and 2) the impact metric, which is a quarterly count of the number of non-compliances with observed reliability impact, regardless of the risk assessment. Together, the metrics demonstrate that risk and impact to the BPS from violations appear to be decreasing and are better controlled. NERC continues to monitor these trends on a quarterly basis and report such to the Board of Trustees Compliance Committee. Adequate Level of Reliability Maintained The State of Reliability 2016 conclusions, drawn from available data compiled through December 2015, found that the BPS provided an Adequate Level of Reliability (ALR)1 for the year. The ALR is the state the design, planning, and operation of the BPS achieves when the ALR reliability performance objectives are met. The objectives include
1 Definition of “Adequate Level of Reliability,” http://www.nerc.com/pa/Stand/Resources/Documents/Adequate_Level_of_Reliability_Definition_(Informational_Filing).pdf

Executive Summary
NERC | State of Reliability | May 2016 v
stable BPS frequency and voltage within predefined ranges and no instability, uncontrolled separation, cascading loss of elements (e.g., transmission lines or transformers), or voltage collapse. Significant findings include:
Instances of protection system misoperations have decreased: Over the past year, the industry focused on the instantaneous ground overcurrent function and improving relay system commissioning tests. The relay misoperation rate decreased from 10.4 percent in 2014 to 9.4 percent in 2015.
BPS resiliency to severe weather improved: In terms of avoided generation outages and as suggested by better BPS performance, winter reliability and resiliency improved. This is partially due to the emphasis on seasonal preparation activities.
Human error has decreased: Transmission line outages caused by human error were significantly reduced to 0.028 outages per circuit in 2015, versus 0.039 in 2014, and 0.047 in 2013. This indicates that continued focus on human performance training and education are effective.
There were no Category 4 or 5 events in 2015: There were fewer total events of Category 2 or higher in 2015, no Category 4 or 5 events, and only one Category 3. A review of system disturbances resulted in the publishing of 16 lessons learned that shared actionable information with the industry, improving BPS reliability.
No load loss due to reported cybersecurity events: In 2015, there were no reported cybersecurity incidents that resulted in loss of load. There was one physical security incident that resulted in a loss of approximately 20 MW of load.
Frequency and voltage remained stable: The BPS has demonstrated generally stable frequency response performance from 2012–2015, but this is below historic levels for some interconnections. Changes in the BPS resource mix could have reliability implications for ERSs that include frequency support.
Steady-state and dynamic modeling improvements: The improved understanding of the grid is moving the industry toward more accurate simulations, including better potential to assess blackout risk2. Progress will continue as efforts move into successive phases for 2016.
The goal of the State of Reliability 2016 report is to quantify risk and performance, highlight areas for improvement, and reinforce and measure success in controlling risks to reliability. As documented in this report, NERC’s Performance Analysis staff’s ongoing work with the Performance Analysis Subcommittee (PAS) provides the foundation for risk assessments.
2 http://www.nerc.com/comm/PC/System%20Analysis%20and%20Modeling%20Subcommittee%20SAMS%20201/Case%20Metrics%20Phase%20I%20Report%20-%20FINAL%20-%2011-20-15.pdf

NERC | State of Reliability | May 2016 1
Chapter 1 – Key Findings and Recommendations
Key Finding 1: Protection System Misoperations Decline; Top Causes Remain Unchanged There was a statistically significant decline in protection system misoperations. Additionally, due to a decrease in the number of events initiated by misoperations, there was an improvement in 2015 in the relative transmission outage severity risk. Automatic ac circuit outage frequency for outages initiated by failed protection system equipment also showed a statistically significant improvement in 2015. While the overall misoperations number has declined, the three largest causes of misoperations remain in 2015: incorrect settings/logic/design errors, relay failure/malfunctions, and communication failures. The instantaneous ground overcurrent protection function accounted for 11 misoperations in 2014 that caused events, and these events were able to be analyzed due to voluntary entity reporting. That number was reduced to six event-related misoperations in 2015. Similarly, one Region experienced a statistical improvement in relay misoperations from 2013–2014 and maintained this level of improvement through 2015. This was supported by Regional efforts that primarily targeted a reduction of communication failures. While protection system operations improved in 2015, misoperations continue to be one of the largest contributors to transmission outage severity and should remain an area of focus. Recommendation Results indicate that targeting the top three causes of misoperations should remain an effective mitigation strategy. NERC should, in collaboration with industry, improve knowledge of risk scenarios by focusing education on the instantaneous ground overcurrent protection function and on improving relay system commissioning tests.
Key Finding 2: BPS Resiliency to Severe Weather Improved In terms of avoided generation outages, as suggested by better BPS performance, winter reliability and resiliency improved. This is partially due to the emphasis on seasonal preparation activities. Performance outcomes were determined using the severity risk index (SRI), which is a measure of stress to the BPS in any day resulting from generation loss, transmission loss, or load loss components. During no day in 2015 did the daily SRI make the top-ten most severe list of days between 2008 and 2015. This is despite the extreme winter weather conditions in 2015 in parts of the Eastern Interconnection that rivaled the polar vortex of 2014, which contributed to two days in the list. Improvements in the 2015 SRI demonstrate that industry preparedness has a positive influence on BPS resiliency. Given that weather impacts are often regional in nature, a more granular analysis of SRI may prove beneficial. Recommendation NERC should consider performing daily SRI calculations on a regional basis to investigate the feasibility of correlating performance with regional weather data.
Key Finding 3: Human Error Has Decreased Transmission line outage frequency caused by human error was statistically significantly reduced to 0.028 outages per circuit in 2015, versus 0.039 in 2014, and 0.047 in 2013. Despite these improvements, human error remains a major contributor to transmission outage severity and will remain an area of focus. Recommendation NERC should provide focus on human performance training and education through conferences and workshops that increase knowledge of possible risk scenarios.
Key Finding 4: Overall Reduction in Qualifying Events The event analysis (EA) process assigns qualifying events into one of five categories based on their impact to the BPS, with Category 5 being the most severe. There were no Category 4 or 5 events in 2015 and only one Category

Chapter 1 – Key Findings and Recommendations
NERC | State of Reliability | May 2016 2
3. Overall, there was a reduction in total events assigned a Category 2 or higher. The majority of contributing causes by major category continue to show equipment/materials as the primary cause. System disturbance reports, submitted voluntarily by industry, resulted in 16 lessons learned being published. Sharing actionable information assists industry in making more informed decisions. The improvements seen in event severity suggest that developing and publishing lessons learned can have a positive impact on BPS reliability. Recommendation Through the efforts of the Event Analysis Subcommittee (EAS) and participation of registered entities, NERC should continue to develop and publish lessons learned from qualifying system events.
Key Finding 5: Modeling Improvements Led to Improved Blackout Risk Assessments Industry currently is leveraging the rapid deployment of synchrophasor technology for individual power plant dynamic model verification. Similarly, BPS model validation is helping to ensure case fidelity, a measure of how well a model’s simulation matches actual system response to a given event. These improvements follow the successful development of a composite load model for more accurate dynamic studies of phenomena, such as fault-induced delayed voltage recovery, wherein large concentrations of primarily low inertia residential air-conditioning load can stall and cause local or wide-area voltage collapse. Cumulative modeling improvements and the increased understanding of load and generator characteristics and responses are moving industry toward a more accurate assessment of blackout risk and other threats. System models must continue to improve in order for accurate simulations to be developed that help to properly identify and mitigate potential risks to reliability in both the operational and planning time horizons. As the resource mix and load composition changes, system models must continue to evolve to support pathways for operational and planning reliability. Recommendation NERC should provide leadership in collaborative efforts to improve system model validation, particularly dynamic models, including the use of synchrophasor and other advanced technology.
Key Finding 6: Essential Reliability Services Trend is Stable; Faces Potential Challenges The prospect of a changing resource mix presents a potential challenge to ERSs, in particular frequency and voltage support. The Essential Reliability Services Task Force (ERSTF) recommended two new measures that are moving toward implementation.3 The first, Frequency Response at Interconnection Level, comprises a comprehensive set of frequency response measures at relevant time frames. The second, Reactive Capability on the System, measures static (also called steady-state) and dynamic reactive reserve capability at critical load levels such as at peak, shoulder, and light loads. The latter is aimed at ensuring continued adequate voltage support. Stable frequency is a key ALR performance outcome. Frequency response is essential in supporting frequency during disturbances that result in large frequency deviations or during system restoration efforts. The BPS has demonstrated generally stable frequency response performance from 2012–2015, but this is below historic levels for at least some interconnections, as discussed in Chapter 4. Further, changes in the BPS resource mix could have reliability implications for ERSs that include frequency support. The interconnection frequency response obligation (IFRO) is intended to be the minimum amount of frequency response that must be maintained by an interconnection and is reviewed and determined annually in the Frequency Response Annual Analysis. The Eastern Interconnection, Western Interconnection, and Québec Interconnection experienced no frequency events with measured frequency response below their IFRO. The ERCOT Interconnection experienced one frequency event with measured frequency response slightly below their
3 http://www.nerc.com/comm/Other/essntlrlbltysrvcstskfrcDL/ERSTF%20Framework%20Report%20-%20Final.pdf
Chapter 1 – Key Findings and Recommendations
NERC | State of Reliability | May 2016 3
IFRO, but load resource reserves that are under contract to trip on low frequency more than adequately supplemented the shortfall in frequency response during this event. During the 2012–2015 operating years, the Eastern Interconnection frequency response showed a statistically significant increasing trend although the interconnection continues to exhibit frequency response withdrawal characteristics.4 The delayed recovery increases the risk that a subsequent contingency could occur from a lower starting frequency during that period. The ERCOT Interconnection frequency response also showed a statistically significant increase in the 2012–2015 operating years. The Québec Interconnection frequency response experienced a slight statistically significant decline. The Western Interconnection frequency response time trend was neither statistically increasing nor decreasing. Additional concerns exist relative to BPS voltage support. One concern involves the expected increase in reliance on high-tech devices, such as the latest generation of static VAR compensators (SVCs) and flexible alternating current transmission systems (FACTS) to provide BPS voltage support. These serve as dedicated reactive generators, supplying no real power (to do work), but sufficient reactive power to support stable BPS voltage and ensure that no voltage collapse occurs. They will likely replace the reactive power component (currently supporting BPS voltage) of conventional generators being retired. As highlighted by the ERSTF Framework Report5 and other industry research, rotating machinery known as synchronous condensers are being used at a greater rate to provide these services in addition to the electronic reactive power generators. These not only generate reactive power for voltage support like their electronic counterparts, but can supply inertia and short-circuit fault current vital to support continued BPS reliability. The State of Reliability 2016 report leverages BPS reliability history including not only analyses of the equipment availability databases, but also latent data from past event analysis results. While these devices are technically sound, their BPS penetration is still quite limited versus what might be needed in the near future requiring more study of their performance. The ERO has initiated discussions with its committees and industry experts on how long electronic and rotating devices should remain tied to the BPS to support voltage needs in cases of dramatic voltage deviations. Recommendation The ERO should lead efforts to monitor the impacts of resource mix changes with concentration on the following:
ERS measures for frequency and voltage support that have been developed and adopted
Methods to increase the population and capability of resources providing frequency response, especially under the scenario that conventional generation continues to be replaced with variable energy resources
Reliability of reactive power generators, such as SVCs, FACTS devices, and synchronous condensers when applied to replace the voltage support function of retiring conventional generators, such as low-voltage ride-through
Protection for these devices, as well as compatibility and coordination with other BPS protection and controls
Key Finding 7: No Load Loss Due to Cybersecurity Events The year-over-year increase in global cybersecurity incidents relative to global cybersecurity vulnerabilities indicates that vulnerabilities are increasingly being successfully exploited and reinforces the need for
4 Withdrawal of primary frequency response is an undesirable characteristic associated with certain generator control systems that negate the primary frequency response prematurely. 5 http://www.nerc.com/comm/Other/essntlrlbltysrvcstskfrcDL/ERSTF%20Framework%20Report%20-%20Final.pdf
Chapter 1 – Key Findings and Recommendations
NERC | State of Reliability | May 2016 4
organizations to continue to enhance their cybersecurity capabilities. Despite the increasing risks of the cyber environment, in 2015 there were no reported cybersecurity incidents that resulted in loss of load. There was one physical attack that resulted in a loss of approximately 20 MW of load. NERC continues to monitor industry’s implementation of the new iteration of approved Critical Infrastructure Protection (CIP) Reliability Standards. Industry received lessons learned and transition guidance that included training, outreach, and workshops. To date, three grid security exercises (GridEx) have been conducted to develop, assess, and continually improve coordination, communication, and emergency response actions relative to cyber or physical attack. The GridEx III report6 reviewed findings from the scenario to measure attainment of exercise goals, and includes feedback from GridEx III participants. Cyber security is an area where past performance does not predict future risk and threats are increasing and becoming more serious over time. Recognizing the unique challenges associated with collecting security-related data, NERC will continue efforts to develop a comprehensive set of mature security metrics that are valuable to the industry and have a positive impact on BPS reliability. Recommendation NERC should actively maintain, create, and support collaborative efforts to strengthen situational awareness for cyber and physical security while providing timely and coordinated information to industry. In addition, industry should review its planning and operational practices to mitigate potential vulnerabilities to the BPS.
6 http://www.nerc.com/pa/CI/CIPOutreach/GridEX/NERC%20GridEx%20III%20Report.pdf

NERC | State of Reliability | May 2016 5
Chapter 2 – 2015 Reliability Highlights
This chapter provides highlights of 2015 ERO Enterprise efforts closely coordinated with the electric industry that impact BPS reliability and resiliency. These are actions and activities in addition to the performance data presented in the report that contribute to the analysis of the state of reliability.
Adequacy Assessments Annual Long-Term Reliability Assessments (LTRA) provide a forward-looking, independent perspective of the
projected reliability of the North American BPS.7 These assessments inform entities that construct future BPS facilities what will be needed to maintain or improve resource and transmission reliability. Winter and summer seasonal assessments are also performed. The following assessments were performed to address special BPS reliability issues:
Essential Reliability Services As the North American BPS integrates an increasing level of inverter-based generation (e.g., wind turbine and solar generation technology), BPS operational characteristics are changing. In addition, the BPS is experiencing integration of distributed energy resources and demand response programs. These changing characteristics represent a fundamental shift in the operation and planning of the power system with potential impacts to reliability in terms of essential services such as frequency, ramping, and voltage support. A concept paper8 was developed to inform regulators and industry of ERSs affected by the integration of renewable resources and retirements of baseload generating plants. A detailed framework report9 analyzed historical data and provided measures and results obtained from analysis. In addition, an abstract document was developed to inform industry, policy makers, and regulators about the essential services that may impact
reliability in the face of a changing resource mix. The abstract document was accompanied by interactive videos10 that conceptually explain frequency support, ramping, and voltage support.
Reliability Review of the Clean Power Plan In April 2015, NERC released the Potential Reliability Impacts of EPA’s Proposed Clean Power Plan (CPP) Phase I report. The report provided scenario analyses that identified potential resource adequacy and transmission requirements as a result of projected generation changes associated with the CPP. The report concluded a need for additional timing for implementation as well as a need for a reliability safety valve. On August 3, 2015, the EPA issued its final rule for the CPP,11 which extended the timing for initial implementation to 2022 from 2020 and also provided for a reliability safety valve. Both of these changes are positive developments regarding future system reliability during implementation of the CPP. NERC is continuing to develop analyses that can be used to identify reliability issues that must be addressed when implementing the CPP. The CPP is expected to promote large-scale changes to the resource mix that could have reliability implications for planning reserve margins, system voltage support, frequency response, and other issues that would need to be addressed. To minimize potential negative impacts to reliability from the CPP implementation, NERC has worked with industry stakeholders to provide reliability guidance for states to consider as they develop their CPP implementation plans.
7 http://www.nerc.com/pa/RAPA/ra/Reliability%20Assessments%20DL/2015LTRA%20-%20Final%20Report.pdf 8 http://www.nerc.com/comm/Other/essntlrlbltysrvcstskfrcDL/ERSTF Concept Paper.pdf 9 http://www.nerc.com/comm/Other/essntlrlbltysrvcstskfrcDL/ERSTF%20Framework%20Report%20-%20Final.pdf 10 https://vimeopro.com/nerclearning/erstf-1 11 http://www.epa.gov/sites/production/files/2015-08/documents/cpp-final-rule.pdf

Chapter 2 – 2015 Reliability Highlights
NERC | State of Reliability | May 2016 6
NERC has conducted a Phase II analysis around the CPP final rule. The assessment concludes that the CPP will accelerate the current shift away from coal-fired generation towards more natural gas and renewable resources. As a result, NERC recommends that system planners prepare for the requisite infrastructure that includes transmission and natural gas pipelines. As more intermittent and asynchronous resources are introduced to the BPS, NERC will continue to focus on ERSs, including the development of sufficiency guidelines. Additionally, NERC has created a task force focused on distributed energy resources (DERs). This task force will evaluate potential impacts that DERs could have on the BPS. NERC will build upon the CPP Phase II analysis by developing interconnection-wide studies for primary frequency response and voltage support.
Frequency Response Initiative The NERC Resources Subcommittee (RS) has been investigating a decline in overall primary frequency response in the Eastern and Western Interconnections. It was discovered that the primary frequency response provided by many interconnected generating units does not occur or is being prematurely withdrawn. The RS determined that some of the causes of the primary frequency response decline can be traced to: 1) incorrect generator governor dead-band settings exceeding the recommended range, and 2) plant or generator outer loop control logic prohibiting or prematurely withdrawing primary frequency response. On February 5, 2015, NERC issued an alert advisory highlighting the frequency decline and the causes of the lack of primary frequency response. On December 16, 2015, the NERC Operating Committee (OC) approved Reliability Guideline, Primary Frequency
Control.12 The guideline describes the causes of the decline in primary frequency response as well as recommended generator governor settings, which will improve reliability through better frequency response. In addition, the guideline provides methods for Balancing Authorities (BA) and Generator Operators (GOP) to assess individual generator performance.
Winter Preparedness and Performance Review In preparation for winter weather, generation facilities across North America indicated that they had reviewed or implemented recommendations from the February 2011 Southwest Cold Weather Event Lessons Learned13 as well as the Generator Winter Weather Readiness guideline.14 NERC continues to compare winter BPS performance with previous winter performance to identify cold weather risks to BPS reliability and identify and communicate additional lessons learned. The winter of 2015 was marked by cold temperatures similar to the winter of 2014, with the Eastern Interconnection experiencing the coldest temperatures during February 2015. Several areas set record winter peak demand the morning of February 20, 2015, that surpassed the all-time winter peak set the previous winter. The importance of adequate preparation for extreme weather events could be readily observed from the improved unit performance. Although new record winter peak demands were set during this time frame, no emergency demand response or any other capacity emergency actions were required. Overall, BPS generator performance during the 2015 cold weather events showed improved reliability performance over the winter of 2014. The improvement demonstrates the effectiveness of the preparations taken by stakeholders for extreme weather events.
Transmission Line Ratings When discrepancies between design and actual conditions result in incorrect facility ratings, system operators have inaccurate input for their situational awareness and system models do not accurately reflect system conditions. NERC distributed a Level 2 Alert in 2010 to address the issue of line ratings being consistent with as-
12 http://www.nerc.com/comm/OC/Reliability%20Guideline%20DL/Primary_Frequency_Control_final.pdf 13 http://www.nerc.com/pa/rrm/ea/Pages/February-2011-Southwest-Cold-Weather-Event.aspx 14 http://www.nerc.com/comm/OC/Reliability%20Guideline%20DL/Generating_Unit_Winter_Weather_Readiness_final.pdf

Chapter 2 – 2015 Reliability Highlights
NERC | State of Reliability | May 2016 7
built conditions. Following a review of the industry responses to this alert, a report was prepared in 2015 to document and share good utility practices with the industry. These practices focus on maintaining transmission rights-of-way (ROW) to ensure that line ratings continue to reflect as-built conditions, particularly after transmission construction or ROW-related changes are completed. Reliability is improved by ensuring system models have more accurate line ratings.
Restoration and Recovery Plan Joint Review FERC initiated a joint staff review, in partnership with the ERO Enterprise, to assess plans for restoration and recovery of the BPS following a widespread outage or blackout. The joint staff review team met with or conferred with a representative sample of entities to discuss their plans; share their experiences with recent restoration, response, and recovery exercises or drills; and observe a number of restoration training exercises. The report prepared by the team provides observations on the participants’ plans, assesses related Reliability Standards, and makes recommendations for potential enhancements to plans, related practices, and the provisions of certain Reliability Standards. Overall, the joint staff review team found that the participants have system restoration plans that are thorough and highly-detailed. They identified several opportunities for improving system restoration, cyber incident response, and recovery readiness through improvements to the clarity of certain Reliability Standard requirements. Additionally, the joint staff review team recommended that numerous beneficial practices employed by individual participants be shared with other entities responsible for system restoration, cybersecurity incident response, and recovery readiness. This review will enhance resiliency through sharing of good utility practices and clarification of certain Reliability Standard requirements.
Physical Security Beginning in January 2015, the Electric Information Sharing and Analysis Center (E-ISAC) established the Physical Security Analysis Team (PSAT). The PSAT plays an integral role in helping members identify, analyze, understand, and ultimately develop mitigation techniques and strategies for physical protection through the posting of physical security bulletins through the E-ISAC portal. One such physical security bulletin focused on unmanned aircraft systems. The PSAT also designed the “E-ISAC Physical Security Playbook.” This interactive, worst-case scenario table top exercise was created to help members identify potential threats, scenarios, and recovery methods that they may deal with on a daily basis. In March 2015, the E-ISAC PSAT formed the Physical Security Advisory Group (PSAG) consisting of industry, Department of Energy (DOE), and Department of Homeland Security (DHS) representatives as well as informed industry observers. The PSAG will assist the E-ISAC in the analysis of physical security threats. The PSAG will also provide seasoned expertise to advise the industry on threat mitigation strategies to enhance physical security and reliability. Through PSAG collaboration during 2015, a design basis threat (DBT) was developed for the electric sector and ratified with full member support in December 2015. This reference document is not intended to cover all the facility-specific threats and assets that may need to be considered (e.g., theft, personnel safety, workplace violence, exposure to dangerous chemicals, etc.), but rather to provide a guide/tool to be used by members at any level to help influence the risk assessment process and enhance physical security.

Chapter 2 – 2015 Reliability Highlights
NERC | State of Reliability | May 2016 8
Event Analysis The EAS review of qualified events placed each into one of five categories based on its impact to the BPS with Category 5 being the most severe. This review resulted in 16 published lessons learned in 2015. Each was either directly developed from a specific individual event or represented a combination of trends and information gathered from multiple smaller occurrences and disturbances. The well-publicized Washington, DC, event was a Category 2 but was rigorously analyzed with industry cooperation, and the public results were widely shared as one of the 16 lessons learned. Information gathered through the voluntary program supported two major workshops, including the fourth annual “Improving Human Performance on the Grid” in March and the “NERC Monitoring and Situation Awareness” workshop in September. The detailed analyses from entity events shared with NERC and subsequent summaries shared with the industry have resulted in a greater understanding of misoperations and substation equipment failures by the ERO Enterprise and stakeholders. This has allowed greater depth and focus for REs to provide industry insight to national trends.
Synchrophasor Technology Initiatives In 2015, NERC formed the Synchronized Measurement Subcommittee (SMS), which is serving as an industry expert forum for the use and advancement of synchrophasor technology in the industry for both real-time applications and offline engineering tools. The SMS has, in particular, taken the lead on power plant model verification (PPMV) and analysis of inter-area oscillations in each of the NERC interconnections. PPMV enables disturbance-based model verification for power plant models, such as excitation system and turbine-governor models, and can act as an alternative approach to reverification of these models for MOD-026 and MOD-027. The SMS is working on a reliability guideline on this topic to be published in 2016. Oscillation analysis will seek to characterize the inter-area oscillatory modes in the interconnections using time-synchronized phasor measurement data. The goal is to identify the modal characteristics, including the frequency, damping ratio, and mode shape over many operating conditions. NERC is working with the Reliability Coordinators (RC) and Regions to collect the data using Section 800 Data Requests for a special reliability assessment. Bulk Electric System Definition and BESnet An ERO Enterprise software application, the BES Notification and Exceptions Tool (BESnet), is used by entities to notify their RE about changes in the status of BES facilities or to request inclusion or exclusion of an element from the BES, as outlined in Appendix 5C of the NERC Rules of Procedure.15 Accurate identification of all elements and facilities necessary for the reliable planning and operation of the interconnected BPS will focus standards compliance to enhance reliability.
15 http://www.nerc.com/FilingsOrders/us/RuleOfProcedureDL/Appendix_5C_ProcForReqAndRecExFromAppOfNERCDefBES_20140701.pdf

NERC | State of Reliability | May 2016 9
Chapter 3 – Severity Risk Assessment and Availability Data
Systems
Overview of Severity Risk Analysis Observations The 2015 daily SRI has shown improved performance from the 2014 SRI as expressed by the mean and stand deviation. For each component of the SRI, the following observations can be made:
Generation Component: The generation loss component of the SRI indicates 2011 was the benchmark year for the generation fleet; however, this time period pre-dates the mandatory generation reporting requirements so it is inconclusive whether that year should be the measure against which subsequent years should be compared.
Transmission Component: With regard to the transmission component of the SRI, a statistically significant improvement has been observed as measured by mean and standard deviation between the two three-year periods of 2010–2012 and 2013–2015.
Load Loss Component: The load loss component of SRI exhibits a non-statistically significant trend with the mean remaining at an improved level, complemented by a reduction in the variation on a daily basis, as measured by the standard deviation.
Background to the Calculation Since the inception of the State of Reliability Report, the industry has developed a metric, named SRI,16 which serves to measure the effect of BPS performance on a daily basis. The metric is a composite, weighting transmission system forced outages for voltages 200 kV+, generation system unplanned outages, and distribution load lost as a result of events upstream of the distribution system. Each of these components is weighted at a level recommended by the OC and Planning Committee (PC),17 dating back to the 2011 time frame. Generation capacity lost is divided by the total generation fleet for the year being evaluated and factored at 10 percent of the SRI score. Transmission line outages are weighted with an assumed average capacity based upon their voltage level and the daily outages divided by the total inventory’s average capacity and factored at 30 percent of the SRI score. Load lost due to performance upstream of the distribution system is calculated based upon outage frequency for the day, which is divided by system peak loading, and is factored at 60 percent of the SRI score. The weightings were made with the recognition that the most critical test of the BPS is whether end-use customer loads are being served, thus emphasis of this component was placed very high. Additionally, it was recognized that transmission system performance was a key linkage to delivering energy to customers, so it was also weighted substantially. The generation component was weighted more lightly. This daily data is then presented in several different ways to demonstrate performance throughout the year, performance of the best and poorest days within the year, and the contributions of each of the components of the SRI throughout the year. Interpreting the Yearly Descending SRI Curve The SRI descending curve shown in Figure 3.1 demonstrates several components that are valuable for analysis. First, the left side of the graph, where the system has been substantially stressed, should be compared against prior years’ high-stress days. The slope of the central part of the graph reveals year-to-year changes in fundamental resilience of the system to routine operating conditions. The right section of the curve may also
16 Severity Risk Index, http://www.nerc.com/comm/PC/Performance%20Analysis%20Subcommittee%20PAS%202013/SRI%20Enhancement%20Whitepaper.pdf 17 http://www.nerc.com/docs/pc/rmwg/SRI_Equation_Refinement_May6_2011.pdf

Chapter 3 – Severity Risk Assessment and Availability Data Systems
NERC | State of Reliability | May 2016 10
provide useful information about how many days with lower SRI scores occurred during any year compared to other years.
2015 Year in Review The chart shown in Figure 3.1 below demonstrates that the year’s highest impacting days did not significantly stress the BPS, indicating its resilience to the events during the year was high. The thumbnail inset further illustrates the moderate impacts measured during the year, where the worst days were better than prior year’s records. Further, based on prior years’ analysis of the SRI, a high-stress day18 has been determined to be a day where the day’s SRI score exceeded 5.0. During 2015, no days exceeded this benchmark value, thus even the more challenging days in the year demonstrated better resilience than in prior years. The central slope demonstrates solid and predictable but not stellar performance, since the slope is not significantly lower or angled from prior years (such as the central slope seen in 2013). The far right of the curve indicates that, for the best days of performance during 2015, there are a handful of good SRI scores (as indicated by the sharp angle downward).
Figure 3.1: NERC Annual Daily Severity Risk Index Sorted Descending
Table 3.1 identifies the top-10 SRI days during 2015 and denotes the generation, transmission, and load loss components for each of these days. It further identifies generally where the event was experienced and what sort of event it was. General observations include that the majority of the days were dominated by generation loss and were minimally driven by cold weather with half of the days occurring in the months of June and July. The PAS separately reviewed DOE OE-41719 reports to determine any reported event correlations to load losses calculated for the SRI and found correlation for all but three days. The highest daily SRI experienced in 2015 occurred on November 17 and was a single day out of a nine-day long storm in the northwest. The storm was severe enough that a major disaster declaration was issued by the Federal Emergency Management Administration (FEMA).20 The next highest day, June 30, had widespread and severe 18 High-stress days are when BPS performance, as measured by the SRI, has experienced noteworthy impacts to any or all of its components, specifically generation, transmission, or load components. Based on past analysis, the count of days that exceed five (on a scale of 0 to 1000) are often memorable and may provide Lessons Learned opportunities. If no days exceed five, the highest 10 days for the year are generally reviewed for their initiating causes. 19 https://www.oe.netl.doe.gov/oe417.aspx 20 https://www.fema.gov/disaster/4249
0.1
1
10
100
1000
SRI L
og
axis
2010 2011 2012 2013 2014 2015
11/17 Pacific Windstorm
6/30 Severe Weather
1/8 Severe Winter Weather
10/23 Severe Weather
7/18 Severe Weather
7/20 Severe Weather
6/23 Severe Weather
7/13 Severe Weather
7/30 Severe Weather
2/20 Severe Winter Weather
1
10
100Ten Highest Stress Days with 2015 Labeled

Chapter 3 – Severity Risk Assessment and Availability Data Systems
NERC | State of Reliability | May 2016 11
thunderstorms, lightning, and wind activity. While this weather was heavily observed in the west, thunderstorms were also experienced elsewhere across the continent. One of two cold-related extreme days was the third highest value, which occurred in the east, but was more heavily experienced in the southeast on January 8. In comparison to 2014’s cold weather events, which were of similar intensity, the SRI measured less than five, while in 2014 the measured values ranged from 3.8 to 11.1.
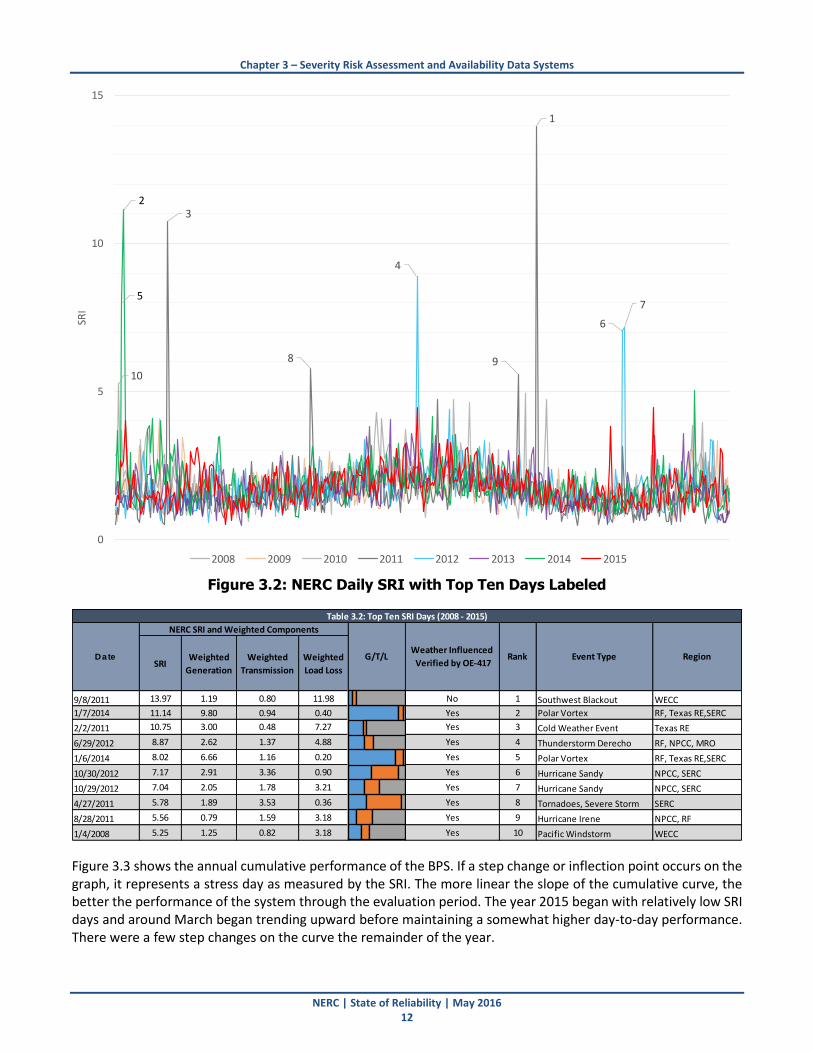
Figure 3.2 is a daily plot of the SRI score for 2015 (shown in red) and each of the prior year’s dating back to 2008. On a daily basis, a general normal range of performance exists. Days that were extreme can be detected by their significant deviation from that normal level. It is apparent that these extreme days happen throughout the year, although in 2015 more of them appeared to occur during the summer, as shown in Table 3.1. Figure 3.2 also identifies the historical highest SRI-scoring days from 2008–2015. The event rankings in Table 3.2 corresponds to the spike numbers in Figure 3.2. This graphic indicates that the BPS performance in 2015, as measured by the SRI, was stable. The days that were higher were not nearly as close to prior years, nor did they rank anywhere close to the top-10 performance.
Chapter 3 – Severity Risk Assessment and Availability Data Systems
NERC | State of Reliability | May 2016 12
Figure 3.2: NERC Daily SRI with Top Ten Days Labeled
Figure 3.3 shows the annual cumulative performance of the BPS. If a step change or inflection point occurs on the graph, it represents a stress day as measured by the SRI. The more linear the slope of the cumulative curve, the better the performance of the system through the evaluation period. The year 2015 began with relatively low SRI days and around March began trending upward before maintaining a somewhat higher day-to-day performance. There were a few step changes on the curve the remainder of the year.
10
3
8 9
1
4
6
75
2
0
5
10
15SR
I
2008 2009 2010 2011 2012 2013 2014 2015
SRIWeighted
Generation
Weighted
Transmission
Weighted
Load Loss
9/8/2011 13.97 1.19 0.80 11.98 No 1 Southwest Blackout WECC
1/7/2014 11.14 9.80 0.94 0.40 Yes 2 Polar Vortex RF, Texas RE,SERC
2/2/2011 10.75 3.00 0.48 7.27 Yes 3 Cold Weather Event Texas RE
6/29/2012 8.87 2.62 1.37 4.88 Yes 4 Thunderstorm Derecho RF, NPCC, MRO
1/6/2014 8.02 6.66 1.16 0.20 Yes 5 Polar Vortex RF, Texas RE,SERC
10/30/2012 7.17 2.91 3.36 0.90 Yes 6 Hurricane Sandy NPCC, SERC
10/29/2012 7.04 2.05 1.78 3.21 Yes 7 Hurricane Sandy NPCC, SERC
4/27/2011 5.78 1.89 3.53 0.36 Yes 8 Tornadoes, Severe Storm SERC
8/28/2011 5.56 0.79 1.59 3.18 Yes 9 Hurricane Irene NPCC, RF
1/4/2008 5.25 1.25 0.82 3.18 Yes 10 Pacific Windstorm WECC
Table 3.2: Top Ten SRI Days (2008 - 2015)
NERC SRI and Weighted Components
Date G/T/LWeather Influenced
Verified by OE-417Rank Event Type Region

Chapter 3 – Severity Risk Assessment and Availability Data Systems
NERC | State of Reliability | May 2016 13
Figure 3.3: BPS Cumulative SRI (2010–2015)
Figure 3.4 breaks down the 2015 cumulative performance by BPS segment. The components are generation, transmission, and load loss, in that order. In Figure 3.4, the load loss component shows day-to-day load-loss events. The transmission loss component improves at the beginning of August, indicated by the change in slope. The unplanned generation unavailability component is typically the largest contributor to cumulative SRI.

Chapter 3 – Severity Risk Assessment and Availability Data Systems
NERC | State of Reliability | May 2016 14
Figure 3.4: NERC Cumulative SRI by Component for 2015
Figure 3.5 provides the history of 365-days of rolling SRI accumulated performance, such that each data point represents the value compared to a single year’s BPS performance. The trend for performance over the time period demonstrates that the best performance has occurred toward the end of 2011 and the beginning of 2012. Since then, SRI performance elevated slightly and generally stayed at that level until the end of 2014, followed by the SRI falling through 2015.
Figure 3.5: 365-day Cumulative SRI 2008-2015

Chapter 3 – Severity Risk Assessment and Availability Data Systems
NERC | State of Reliability | May 2016 15
Figure 3.6 further demonstrates the 365-day rolling history, segmenting the performance by each component. The top chart shows generation loss, which elevated after 2011 and topped out during late 2014. Some improvement occurred during 2015, and this carried through into the composite performance shown in Figure 3.5. The transmission component indicates consistent performance through 2009, elevated SRI through 2010, followed by gradual improvements through the end of 2015. The load loss component indicates improvement through 2009, with 2011 and 2012 having several individual step-change days (large load loss events), followed by gradual but continual improvement.
Figure 3.6: 365-day Cumulative SRI 2008-2015 by Component
Chapter 3 – Severity Risk Assessment and Availability Data Systems
NERC | State of Reliability | May 2016 16
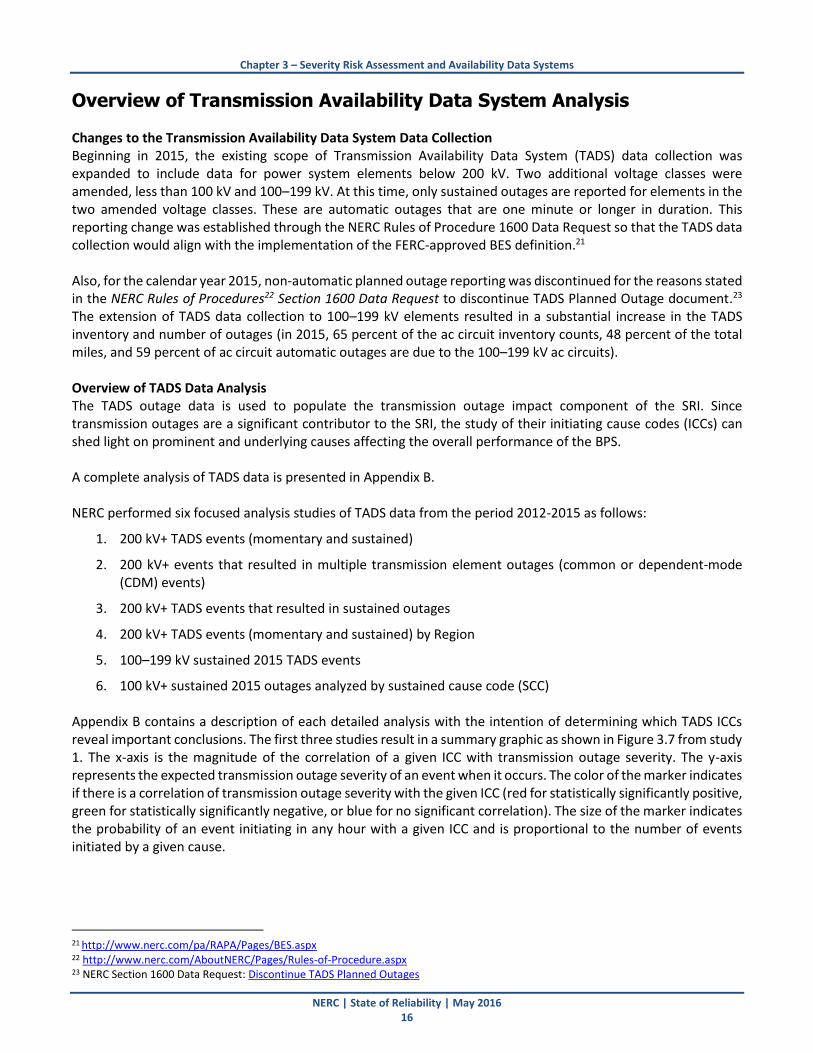
Overview of Transmission Availability Data System Analysis Changes to the Transmission Availability Data System Data Collection Beginning in 2015, the existing scope of Transmission Availability Data System (TADS) data collection was expanded to include data for power system elements below 200 kV. Two additional voltage classes were amended, less than 100 kV and 100–199 kV. At this time, only sustained outages are reported for elements in the two amended voltage classes. These are automatic outages that are one minute or longer in duration. This reporting change was established through the NERC Rules of Procedure 1600 Data Request so that the TADS data collection would align with the implementation of the FERC-approved BES definition.21 Also, for the calendar year 2015, non-automatic planned outage reporting was discontinued for the reasons stated in the NERC Rules of Procedures22 Section 1600 Data Request to discontinue TADS Planned Outage document.23 The extension of TADS data collection to 100–199 kV elements resulted in a substantial increase in the TADS inventory and number of outages (in 2015, 65 percent of the ac circuit inventory counts, 48 percent of the total miles, and 59 percent of ac circuit automatic outages are due to the 100–199 kV ac circuits). Overview of TADS Data Analysis The TADS outage data is used to populate the transmission outage impact component of the SRI. Since transmission outages are a significant contributor to the SRI, the study of their initiating cause codes (ICCs) can shed light on prominent and underlying causes affecting the overall performance of the BPS. A complete analysis of TADS data is presented in Appendix B. NERC performed six focused analysis studies of TADS data from the period 2012-2015 as follows:
1. 200 kV+ TADS events (momentary and sustained)
2. 200 kV+ events that resulted in multiple transmission element outages (common or dependent-mode (CDM) events)
3. 200 kV+ TADS events that resulted in sustained outages
4. 200 kV+ TADS events (momentary and sustained) by Region
5. 100–199 kV sustained 2015 TADS events
6. 100 kV+ sustained 2015 outages analyzed by sustained cause code (SCC) Appendix B contains a description of each detailed analysis with the intention of determining which TADS ICCs reveal important conclusions. The first three studies result in a summary graphic as shown in Figure 3.7 from study 1. The x-axis is the magnitude of the correlation of a given ICC with transmission outage severity. The y-axis represents the expected transmission outage severity of an event when it occurs. The color of the marker indicates if there is a correlation of transmission outage severity with the given ICC (red for statistically significantly positive, green for statistically significantly negative, or blue for no significant correlation). The size of the marker indicates the probability of an event initiating in any hour with a given ICC and is proportional to the number of events initiated by a given cause.
21 http://www.nerc.com/pa/RAPA/Pages/BES.aspx 22 http://www.nerc.com/AboutNERC/Pages/Rules-of-Procedure.aspx 23 NERC Section 1600 Data Request: Discontinue TADS Planned Outages

Chapter 3 – Severity Risk Assessment and Availability Data Systems
NERC | State of Reliability | May 2016 17
As seen in Figure 3.7:
The Misoperation ICC (which represents TADS ICCs Failed Protection System Equipment and Human Error associated with Misoperations) and the Failed AC Substation Equipment ICC both show a statistically significant positive correlation with transmission outage severity and show a higher relative transmission risk.
Power System Condition, while showing a positive correlation of transmission outage severity, has a lower relative transmission risk, based on the frequency of these TADS events and their expected transmission outage severity.
The largest marker corresponds to the ICC group, Lightning, which shows no significant correlation with transmission outage severity but shows a high relative transmission risk because of the high probability of events initiated by Lightning.
Next two largest ICC groups, Unknown and Weather excluding Lightning, have a statistically significant negative correlation with the transmission outage severity.
Figure 3.7: Risk Profile of the 2012–2015 TADS Events by ICC

Chapter 3 – Severity Risk Assessment and Availability Data Systems
NERC | State of Reliability | May 2016 18
Overview of Generating Availability Data System Analysis An analysis of Generating Availability Data System (GADS) data for calendar years 2012–2015 is presented in Appendix C. The GADS outage data is used to populate the generation outage impact component of the SRI. Generation outages are a significant contributor to the SRI and the study of their initiating causes can shed light on prominent and underlying causes affecting the overall performance of the BPS. An analysis of the age of the existing fleet shows:
There is an age bubble around 36–45 years old and that population is driven by coal and some gas units.
There is a significant age bubble around 11–19 years comprised almost exclusively of gas units. The data set shows a clear shift toward gas-fired unit additions with the overall age of that fleet across North America almost 10 years younger than the age of the coal-fired baseload plants that have been the backbone of power supply for many years. This is a trend that is projected to continue given current forecasts around the price and availability of natural gas as a power generation fuel as well as regulatory impacts. To understand generator performance, NERC reviewed the top-10 causes of unit forced outages for the summer and winter seasons, as well as the annual causes, for the 2012–2015 period. The analysis focused on the top causes measured in terms of MWh lost, so it captures both the amount of capacity during the outage and the duration of the outages.
Table 3.3: Total MWh Lost Due to Forced Outages by Season 2012–2015
NERC Total Annual MWh Summer MWh Winter MWh Spring/Fall MWh
2012 214,867,802 62,890,135 72,191,101 79,786,567
2013 651,511,562 129,920,201 363,617,775 157,973,586
2014 422,713,436 97,264,944 162,009,409 163,439,083
2015 450,958,972 129,703,616 204,677,109 116,578,248
As shown in Table 3.3, based on the four years of available data since GADS reporting became mandatory, the following observations can be made:
Between 2012 and 2013, the number of units with a mandatory reporting obligation increased by 39 percent. This increase in the number of units reporting is the primary reason for the increase in forced outage MW hours reported in 2012 and 2013.
Severe storms in the last quarter of 2012, such as Hurricane Sandy and the subsequent flooding, resulted in an increase in the forced outage MW hours reported for the winter24 of 2013 and to a lesser extent 2014.
For this analysis, the season of a forced outage is associated with the season in which the start date of the event was reported in that year; when an event continues into the next year, a new event record is created in January. This results in the event being categorized as occurring in the winter for the continuation event.
Between 2012 and 2014, the five-month shoulder period of Spring/Fall have higher forced outage MWh than the four-month summer period.
24 Winter includes the months of January, February and December. When analysis is performed on a calendar year basis, as for this report, these three months are included from the same calendar year. Summer includes May through September; all other months are categorized as Spring/Fall.

Chapter 3 – Severity Risk Assessment and Availability Data Systems
NERC | State of Reliability | May 2016 19
Analysis of the MWh lost due to forced outages related to weather indicates that while weather does cause major headlines, the overall effect on the fleet is minimal. MWh lost due to forced outages associated with weather represent six percent or less of annual MWh lost due to forced outages.
The top-ten forced outage causes represent one percent of forced outages reported, but account for between 30 percent and 41 percent of the annual MWh lost due to forced outages.

Chapter 3 – Severity Risk Assessment and Availability Data Systems
NERC | State of Reliability | May 2016 20
Overview of Demand Response Availability Data System Analysis An analysis of the Demand Response Availability Data System (DADS) data from 2013–2015 led to the following observations:
Over the 2013–2015 period, the total registered capacity of demand response increased slightly year-over-year in both the summer (2–10 percent) and winter (4 percent) reporting periods. The DADS Working Group believes this is consistent with demand response programs reaching a level of saturation, however, the working group will continue to monitor and report on trends of enrollment.
The realized demand reduction rate during the summers of 2014 and 2015 was well above 90 percent. Additionally, performance rates exceeded 90 percent during events in the winter periods. During the summer of 2013, several factors contributed to the performance rate of 82 percent, including extreme weather conditions and the deployment of the Voluntary and Emergency types of demand response, which typically perform at a much lower rate than other categories of demand response. There is no conclusive evidence that fatigue25 affected the performance of demand response in the summer of 2013.
The variability at which demand response is deployed may be a function of the demand response program’s design and not an indication of extensive reliability issues in a Region.
Figure 3.8: Demand Response Events by Month and Region, 2013-2015
Figure 3.8 shows demand response events to support reliability reported into DADS from January 2013 through September 2015, grouped by month for the three years of event data. The black diamond in each column indicates
25 Fatigue is a term used to describe the concept that the performance of demand response drops off substantially toward the end of an event when an event lasts for several hours or events are called over a number of consecutive days.

Chapter 3 – Severity Risk Assessment and Availability Data Systems
NERC | State of Reliability | May 2016 21
the number of calendar days in a month when demand response was deployed for a reliability event. The stacked bars show the number of days that demand response events occurred in each NERC Region. Note that in the SERC Region, demand response was deployed nearly every month during the analysis period, which was a function of a demand response program design. A complete analysis of the DADS data is presented in Appendix D.

NERC | State of Reliability | May 2016 22
Chapter 4 – Reliability Indicator Trends
Reliability Indicator Trends – Summary NERC Reliability Indicators tie the performance of the BPS to a set of Reliability Performance Objectives included in the approved 2012 ALR definition.26 These seven NERC Reliability Performance Objectives are mapped to the current reliability indicators, denoted as M-X, which are then evaluated to determine whether overall reliability is improving or worsening. Table 4.1 provides a summary of the trends over the past five years by providing a performance rating of improving, declining, no change, or inconclusive based on analysis of available data. When reviewing the reliability indicators it is important to note the following:
The PAS annually reviews the reliability indicators to identify gaps in performance or data collection. Over time, the PAS has implemented changes, added new indicators, and retired some indicators to keep the others relevant. An example of a recent change would be the alignment of M-12 through M-16 to the BES definition. Future developments may include the adoption of ERSTF measures, compliance metrics (provided in Chapter 5), or the BES security metrics (provided in Chapter 8).
Metrics are evaluated over different periods of time. This can be attributed to the period established with the approved metric definition. For example, M-4 Interconnection Frequency Response has a period defined as “1999 or when data is first available,” and M-12 has a time frame defined as “a rolling five-year average.”
Metrics may be defined to be NERC-wide, for a specific Region, or on interconnection-level basis.
The ALR defines the state of the BES to meet performance objectives. Reliability performance and trends of individual metrics should be evaluated within the context of the entire set of metrics.
It is important to retain the anonymity of individual reporting entities when compiling the data necessary to evaluate metric performance. Details presented in this report are aggregated to maintain the anonymity of individual reporting organizations.
Table 4.1: Metric Trends Metric Description Trend Rating
M-1 Planning Reserve Margin Sufficient in the short term, decreasing in
the long term but adequate
M-2 BPS Transmission-Related Events Resulting in Loss of Load (modified in early 2014)
Improving
M-3 System Voltage Performance (discontinued in 2014) Retired
M-4 Interconnection Frequency Response
Eastern Interconnection - Inconclusive
ERCOT Interconnection - Improving
Western Interconnection - Inconclusive
Québec Interconnection - Declining
M-5 Activation of Underfrequency Load Shedding (discontinued in 2014)
Retired
M-6 Average Percent Non-Recovery Disturbance Control Standard Events
Improving
26 Definition of “Adequate Level of Reliability,” http://www.nerc.com/comm/Other/Adequate%20Level%20of%20Reliability%20Task%20Force%20%20ALRTF%20DL/Final%20Documents%20Posted%20for%20Stakeholders%20and%20Board%20of%20Trustee%20Review/2013_03_26_ALR_Definition_clean.pdf

Chapter 4 – Reliability Indicator Trends
NERC | State of Reliability | May 2016 23
Table 4.1: Metric Trends Metric Description Trend Rating
M-7 Disturbance Control Events Greater than Most Severe Single Contingency
Improving
M-8 Interconnected Reliability Operating Limit/System Operating Limit (IROL/SOL) Exceedances (modified in 2013)
Eastern Interconnection - Improving ERCOT Interconnection - No Change
Western Interconnection - No Change
Québec Interconnection - Inconclusive
M-9 Correct Protection System Operations Improving
M-10 Transmission Constraint Mitigation Inconclusive
M-11 Energy Emergency Alerts (modified in 2013) Improving
M-12 Automatic AC Transmission Outages Initiated by Failed Protection System Equipment (modified in late 2014)
Circuits - Improving
Transformers - Improving
M-13 Automatic AC Transmission Outages Initiated by Human Error (modified in late 2014)
Circuits - Improving
Transformers - Improving
M-14 Automatic AC Transmission Outages Initiated by Failed AC Substation Equipment (modified in late 2014)
Circuits - No Change
Transformers - Improving
M-15 Automatic AC Transmission Outages Initiated by Failed AC Circuit Equipment (modified in late 2014; normalized by line length)
Inconclusive
M-16 Element Availability Percentage (APC) and Unavailability Percentage (modified in 2013)
Circuits - Improving
Transformers - Improving
M-1 Planning Reserve Margin This metric demonstrates the amount of generation capacity available to meet expected demand. It is a forward-looking or leading metric. This metric is reported in the annual LTRA27 and the Summer28 and Winter29 Assessments. The most recent LTRA, as shown in Figure 4.1, indicates that reserve margins are sufficient but are trending downward in many assessment areas. The most recent summer and winter assessment found that all of the assessment areas had sufficient resources to meet peak demand and that some areas have seen improved reserve margins over previous seasons. The performance trend is considered to be sufficient in the short term while decreasing, but adequate in the long term.
27 http://www.nerc.com/pa/RAPA/ra/Reliability%20Assessments%20DL/2015LTRA%20-%20Final%20Report.pdf 28 http://www.nerc.com/pa/RAPA/ra/Reliability%20Assessments%20DL/2015_Summer_Reliability_Assessment.pdf 29 http://www.nerc.com/pa/RAPA/ra/Reliability%20Assessments%20DL/2015-16%20WRA_Report_Final.pdf

Chapter 4 – Reliability Indicator Trends
NERC | State of Reliability | May 2016 24
Figure 4.1: M-1 Planning Reserve Margin
M-2 BPS Transmission-Related Events Resulting in Loss of Load This metric measures BPS transmission-related events resulting in the loss of load, excluding weather-related outages. Planners and operators can use this metric to validate their design and operating criteria by identifying the number of instances when load loss occurs. Consistent with the revised metric approved by the OC and PC in March 2014, an “event” is an unplanned disturbance that produces an abnormal system condition due to equipment failures/system operational actions (either intentional or unintentional) that result in the loss of firm system demands. This is identified by utilizing the subset of data provided in accordance with Reliability Standard EOP-004-2.30 The reporting criteria for such events beginning with data for events occurring in 2013 are outlined below:31
1. The loss of firm load for 15 minutes or more:
a. 300 MW or more for entities with previous year’s demand of 3,000 MW or more
b. 200 MW or more for all other entities
2. A BES emergency that requires manual firm load shedding of 100 MW or more
30 http://www.nerc.com/pa/Stand/Reliability%20Standards/EOP-004-2.pdf 31 http://www.nerc.com/comm/PC/Performance%20Analysis%20Subcommittee%20PAS%202013/ALR1-4_Revised.pdf

Chapter 4 – Reliability Indicator Trends
NERC | State of Reliability | May 2016 25
3. A BES emergency that resulted in automatic firm load shedding of 100 MW or more (via automatic undervoltage or underfrequency load shedding schemes, or special protection systems (SPSs)/remedial action schemes (RASs)
4. A transmission loss event with an unexpected loss within an entity’s area, contrary to design, of three or more BES elements caused by a common disturbance (excluding successful automatic reclosing) resulting in a firm load loss of 50 MW or more
This metric was reviewed by the PAS in 2013, and changes were made to make the criteria more consistent with the approved changes to the EOP-004-2 reporting criteria that pertain to transmission-related events that result in the loss of load. The criteria presented above were approved for implementation in the first quarter of 2014. Changes in the annual measurement between 2012 and 2013 therefore reflect the addition of criteria 4, which has been applied to the 2013 and 2014 data. For the first part of the analysis below, shown in Figures 4.2 and 4.3, historical data back to 2002 was used and the new criteria 4 was not included to allow trending of the other aspects of the metric over time. Figure 4.4 includes all of the criteria, so it was only evaluated for 2013–2015: the time period for which data collection associated with the new criteria was available. The performance trend is considered to be improving.
Assessment
Figure 4.2: M-2 BPS Transmission Related Events Resulting in Load Loss
(Excluding Criteria 4)
0
2
4
6
8
10
12
14
16
2002 2003 2004 2005 2006 2007 2008 2009 2010 2011 2012 2013 2014 2015
Even
ts

Chapter 4 – Reliability Indicator Trends
NERC | State of Reliability | May 2016 26
Figure 4.3: M-2 BPS Transmission-Related Events Resulting in Load Loss (Excluding Criteria 4)
Figure 4.3 shows the number of BPS transmission-related events that resulted in the loss of firm load from 2002–2015. On average, just under nine events were experienced per year. The top three years in terms of load loss are 2003, 2008, and 2011 due to the major loss-of-load events that occurred. In 2003 and 2011, one event accounted for over two-thirds of the total load loss, while in 2008, a single event accounted for over one-third of the total load loss. The amount of load loss in 2015 is below the median value of 4,260 MW of load loss over the 2002-2015 period. In addition, the load loss over the last four years is significantly below the median value. These are positive reliability indicators. Again, the data presented in Figures 4.2 and 4.3 reflects load lost for criteria 1, 2 and 3 of this metric, and excludes criteria 4.

Chapter 4 – Reliability Indicator Trends
NERC | State of Reliability | May 2016 27
Figure 4.4: Outage Duration vs. Events Figure 4.4 shows the number of events resulting in firm load loss of 50 MW or greater from 2013–2015 and the duration. The metric was modified in 2013 to include criteria 4 events. In addition to the two events with load loss identified in the previous two graphs, Figure 4.4 shows the number and duration of load loss events for transmission-related load loss events from 2013–2015 for an additional ten events that were included in the metric by the inclusion of criteria 4. Data indicates that there are generally more outages in the time periods less than three hours. For 2015, the largest number of load loss events were less than one hour in duration.
M-3 System Voltage Performance
Background This metric was retired from the monitored set of metrics in 2014.
Future Development Maintaining system voltage and adequate reactive control remains an important reliability performance objective that must be incorporated into the planning, design, and operation of the BES. Additionally, as described in Chapter 2 of this report, the ERSTF considered how changes to generation technology, integration of distributed energy resources and demand response programs affect BPS reliability and what ERSs such as system frequency response, ramping and voltage support are necessary for continued reliability operation. The ERSTF developed a framework report containing a set of voltage measures that may be the basis of voltage metrics going forward.

Chapter 4 – Reliability Indicator Trends
NERC | State of Reliability | May 2016 28
M-4 Interconnection Frequency Response This metric measures frequency response trends for each interconnection so that adequate frequency response is provided to arrest and stabilize frequency during large frequency events. The statistical trends discussed in this chapter for operating years 2012–2015 should be considered within the context of longer term trends analyzed and discussed in the Frequency Response Initiative Report from 2012.32
Figure 4.5: Eastern Interconnection Frequency Response Trend33 Figure 4.5 shows the decline in frequency response since 1994 for the Eastern Interconnection that was discussed in the 2012 Frequency Response Initiative Report with data and the short-term trend for the operating years 2012–2015 added. While there is insufficient data to show the same historic time trends for the Western, ERCOT, and Québec Interconnections, many of the issues that led to the decline in the Eastern Interconnection, such as incorrect governor deadband settings and plant or generator control logic, are likely to exist in other interconnections.
32 http://www.nerc.com/docs/pc/FRI_Report_10-30-12_Master_w-appendices.pdf 33 The source of the Frequency Response data from 1994–2009 displayed in Figure 4.5 is a report by J. Ingleson & E. Allen, “Tracking the Eastern Interconnection Frequency Governing Characteristic” that was presented at the 2010 IEEE PES. The source of the data from 2010 and 2011 are the daily automated reliability reports. The data for 1999, designated by *, was interpolated. Figure 4.5 also reflects a change in the method for calculation of frequency response in 2009 (See FRI Report p. 25).

Chapter 4 – Reliability Indicator Trends
NERC | State of Reliability | May 2016 29
Statistical Trends in Frequency Response by Interconnection NERC applies statistical tests to interconnection frequency response datasets. An operating year, for frequency event purposes, runs from December of the previous year through November of that year. For the 2012–2015 operating years, historical frequency response was statistically analyzed to evaluate performance trends by interconnection. An increasing trend over time indicates that frequency response is improving in that interconnection. The following are overall observations of recent trends for each interconnection.
Eastern Interconnection frequency response has shown a statistically significant34 increasing trend in the 2012–2015 operating years. In the 2015 operating year the mean frequency response decreased from the previous year but the decrease was neither statistically significant nor large enough to change the overall increasing short-term trend. The interconnection continues to exhibit frequency response withdrawal characteristics35 despite slight improvements since 2012.36 The delayed recovery increases the risk that a subsequent contingency could occur from a lower starting frequency during that period. For frequency events in the 2015 operating year, the lowest frequency nadir was within 428 mHz of the first step underfrequency load shed (UFLS) settings. The performance trend for the Eastern Interconnection is considered inconclusive due to these mixed results.
ERCOT Interconnection frequency response has shown a statistically significant increase in the 2012–2015 operating years. For frequency events in the 2015 operating year, the lowest frequency nadir was within 428 mHz of the first step UFLS settings. The performance trend for ERCOT is considered to be improving.
Québec Interconnection frequency response experienced a statistically significant decline in 2012–2015 operating years. In the 2015 operating year, mean frequency response increased but not statistically significantly and the increase was not large enough to change the overall decreasing trend for the interconnection’s frequency response. For frequency events in the 2015 operating year, the lowest frequency nadir was within 773 mHz of the first step UFLS settings. The performance trend for the Québec Interconnection is considered to be slightly declining.
The Western Interconnection frequency response time trend in the 2012–2015 operating years was neither statistically increasing nor decreasing. There were no statistically significant differences in the expected frequency response and variances by largely due to the small sample size for 2012. In the 2015 operating year, the mean frequency response increased but not statistically significantly. In the 2014 operating year, the Western Interconnection experienced a deliberate trip of 2806 MW of generation through a RAS to relieve stress on the transmission system; this resulted in a frequency decline that came within 171 MHz of the first step of UFLS relay settings. The minimum margin in 2015 was 345 mHz. The performance trend for the Western Interconnection is considered to be inconclusive.
NERC staff, in collaboration with the RS and Frequency Working Group, evaluated and modified the frequency event criteria used to select candidate frequency events for use in the M-4 metric in 2016. This will result in a larger sample of qualifying frequency events and further enhanced statistical analysis capabilities. The effort to improve the M-4 frequency response metric and data collection criteria is an ongoing effort. Further statistical significance tests were applied to interconnection frequency response datasets, with additional correlation analysis on time of year, load levels, and other attributes also conducted. These results and further statistical analysis can be found in Appendix E.
34 A statistical test is performed to determine if the time trend line is increasing or decreasing. A statistically significant trend means that the slope, positive or negative, is unlikely to have occurred by chance. The complete statistical analysis can be found in Appendix E. 35 Withdrawal of primary frequency response is an undesirable characteristic associated with certain generator control systems that negates primary frequency response prematurely. 36 See Appendix E Table E.1.

Chapter 4 – Reliability Indicator Trends
NERC | State of Reliability | May 2016 30
M-6 Average Percent Non-Recovery Disturbance Control Standard Event
Background This metric measures the ability of a BA or Reserve Sharing Group (RSG) to balance resources and demand following a reportable disturbance thereby returning the interconnection frequency to within defined limits. This could include the deployment of contingency reserves. The relative percent recovery of a BA’s or RSG’s area control error (ACE) for disturbances that are equal to or less than the most severe single contingency (MSSC) provides an indication of performance. NERC Reliability Standard BAL-002-137 requires that a BA or RSG evaluate performance for all reportable disturbances and report findings to NERC on a quarterly basis.
M-7 Disturbance Control Events Greater than Most Severe Single Contingency
Background This metric measures the ability of a BA or RSG to balance resources and demand following reportable disturbances that are greater than their MSSC. The results will help measure how much risk the system is exposed to during extreme contingencies and how often they occur. NERC Reliability Standard BAL-002-1 requires that a BA or RSG report all disturbance control standard (DCS) events and instances of non-recovery to NERC, including events greater than MSSC.
Assessment for M-6 and M-7 Figure 4.6 shows that the number of DCS-reportable events were lower in 2015 than in 2012, 2013, or 2014. Additionally, Table 4.2 shows that in 2015, there was only one DCS event for which there was less than 100 percent recovery within the recovery period. Based on the decline in the number of all events and the low number of events for which 100 percent recovery was not achieved, the performance trend for both M-6 and M-7 are considered to be improving.
Figure 4.6: M-6 & M-7 DCS Events
37 http://www.nerc.com/files/BAL-002-1.pdf
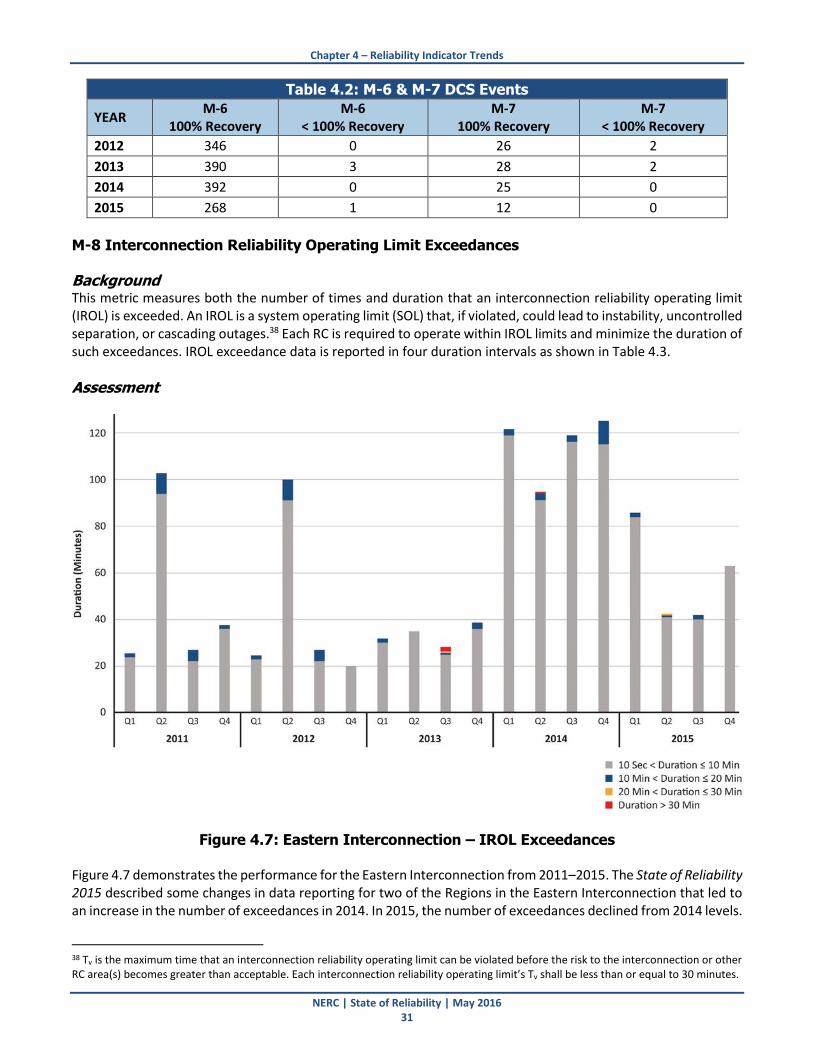
Chapter 4 – Reliability Indicator Trends
NERC | State of Reliability | May 2016 31
Table 4.2: M-6 & M-7 DCS Events
YEAR M-6
100% Recovery M-6
< 100% Recovery M-7
100% Recovery M-7
< 100% Recovery
2012 346 0 26 2
2013 390 3 28 2
2014 392 0 25 0
2015 268 1 12 0
M-8 Interconnection Reliability Operating Limit Exceedances Background This metric measures both the number of times and duration that an interconnection reliability operating limit (IROL) is exceeded. An IROL is a system operating limit (SOL) that, if violated, could lead to instability, uncontrolled separation, or cascading outages.38 Each RC is required to operate within IROL limits and minimize the duration of such exceedances. IROL exceedance data is reported in four duration intervals as shown in Table 4.3.
Assessment
Figure 4.7: Eastern Interconnection – IROL Exceedances Figure 4.7 demonstrates the performance for the Eastern Interconnection from 2011–2015. The State of Reliability 2015 described some changes in data reporting for two of the Regions in the Eastern Interconnection that led to an increase in the number of exceedances in 2014. In 2015, the number of exceedances declined from 2014 levels.
38 Tv is the maximum time that an interconnection reliability operating limit can be violated before the risk to the interconnection or other RC area(s) becomes greater than acceptable. Each interconnection reliability operating limit’s Tv shall be less than or equal to 30 minutes.

Chapter 4 – Reliability Indicator Trends
NERC | State of Reliability | May 2016 32
Figure 4.8: ERCOT Interconnection – IROL Exceedances Figure 4.8 demonstrates the performance for the ERCOT Interconnection from 2011–2015. The drop in IROL exceedances between the fourth quarter of 2012 and the first quarter of 2013 is attributed to the completion of a major transmission expansion project. The trend shows no change since the completion of that project.

Chapter 4 – Reliability Indicator Trends
NERC | State of Reliability | May 2016 33
Figure 4.9: Western Interconnection – SOL/IROL Exceedances Figure 4.9 demonstrates performance for the Western Interconnection from 2011–2015. The State of Reliability Report 2015 noted changes in data reporting for the Western Interconnection that led to the reporting of IROLs. Prior to 2014, only SOLs were reported. In 2015, no IROL exceedances were reported. Therefore there was no change in trend from 2014–2015.
M-9 Correct Protection System Operations Background The Correct Protection System Operations metric demonstrates the performance of protection systems (both generator and transmission) on the BPS. It is the ratio of correct protection system operations to total system protection system operations. In previous reports, protection system misoperations have been identified as a major area of concern. As a result, improvements to data collection that the Protection System Misoperations Task Force (PSMTF) and System Protection Control Subcommittee (SPCS) proposed were implemented. Both correct operations and misoperations are including in the reporting below.

Chapter 4 – Reliability Indicator Trends
NERC | State of Reliability | May 2016 34
Assessment Figure 4.10 shows the total correct operations rate for NERC through the first three reporting quarters of 2015.
Figure 4.10: Correct Protection System Operations Rate
Figure 4.11: Three-Year Misoperation Rate by Region (Q4 2012–Q3 2015) In Figure 4.11, blue bars show the rates that are statistically significantly higher than the total NERC rate, and black bars show the rates significantly lower than NERC’s rate. There is no statistically significant difference between FRCC and NERC misoperation rates for the three years combined, signified by a gray bar.

Chapter 4 – Reliability Indicator Trends
NERC | State of Reliability | May 2016 35
MRO and FRCC have very close three-year misoperation rates (11.220 percent and 11.209 percent, respectively). While the difference between MRO and NERC rates is statistically significant, the difference between FRCC and NERC rates is not. It can be explained by a larger population size for MRO (4198 MRO’s total operations vs. 1936 FRCC’s total operations) that provides greater statistical confidence despite virtually the same misoperation rate (p=0.01 vs. p=0.08). In Figures 4.11, 4.12, and 4.13, the misoperation rate for WECC cannot be calculated because the total number of operations is not available.
Year-Over-Year Changes by Region Changes from the first four quarters (Q4 2012–Q3 2013, Year 1) to the second four quarters (Q4 2013–Q3 2014, Year 2) to the third four quarters (Q4 2014–Q3 2015, Year 3) were studied to compare time periods with similar composition of seasons. The changes are shown in Figure 4.12.
Figure 4.12: Year-Over-Year Changes in Misoperation Rate by Region and NERC In Figure 4.12, Regions are listed alphabetically from left to right with the total misoperation rate for NERC on the far right. Red arrows indicate a statistically significant increase in misoperation rate between two years while green arrows show a statistically significant decrease in misoperation rate. Table 4.3 lists the Regional misoperation rates that are shown graphically in Figure 4.12.

Chapter 4 – Reliability Indicator Trends
NERC | State of Reliability | May 2016 36
Table 4.3: Year-Over-Year Changes in Misoperation Rate by Region and NERC
Region Year 1 (Q4 2012-Q3 2013)
Year 2 (Q4 2013-Q3 2014)
Year 3 (Q4 2014-Q3 2015)
FRCC 13.2% 11.6% 9.0%
MRO 11.0% 10.9% 11.8%
NPCC 7.6% 8.0% 6.3%
RF 11.5% 16.1% 13.3%
SERC 9.1% 8.8% 8.0%
SPP 14.2% 11.4% 11.6%
TRE 7.7% 8.3% 7.6%
NERC 10.1% 10.4% 9.4%
Figure 4.13: Year-Over-Year Changes in Misoperation Rate for Top 3 Causes by Region and NERC
In Figure 4.13, Regions are listed alphabetically from left to right with the total NERC rate on the far right. The combined misoperation rate of the top three causes of misoperations (incorrect settings/logic/design errors, relay failures/malfunctions, and communication failures) are shown for the three years. Red arrows indicate a
Chapter 4 – Reliability Indicator Trends
NERC | State of Reliability | May 2016 37
statistically significant increase in misoperation rate between two years, and green arrows show a statistically significant decrease in misoperation rate.
Actions to Address Misoperations NERC is revising a number of Reliability Standards that involve protection systems.39 To increase awareness and transparency, NERC will continue to conduct industry webinars40 on protection systems and document success stories on how entities achieve higher levels of protection system performance. The quarterly protection system misoperation trends of NERC and the Regional Entities can be viewed on NERC’s website.41 In addition, NERC and Regional staffs have analyzed the top-three protection system misoperation cause codes reported by the Regions and NERC through compliance with Reliability Standard PRC-004-2.1a to identify RE trends and provide guidance to protection system owners that experience a high number of misoperations.42 Incorrect setting/logic/design errors were found to be the largest source of misoperations in almost every Region. This supports focus on setting/logic/design controls, and REs are also pursuing targets specific to their own results.43 NERC and industry actions identified in the report are expected to result in a statistically significant reduction in the rate of misoperations due to these causes by yearend 2017. The ERO Enterprise determined from EA data, as well as from industry expertise, that a sustained focus on education regarding the instantaneous ground overcurrent protection function and on improving relay system commissioning tests were actionable and would have a significant effect. The relay ground function accounted for eleven misoperations in 2014, causing events that were analyzed due to voluntary entity reporting and cooperation. That was reduced to six event-related misoperations in 2015. Similarly, one Region experienced a statistical improvement in relay misoperations from 2013–2014, and maintained this performance through 2015. This performance followed Regional efforts that targeted a reduction of communication failures. Based on the statistically significant decline in the total misoperation rate, the performance trend for this metric is considered to be improving. Further statistical analysis can be found in Appendix E.
M-10 Transmission Constraint Mitigation Complete data for this metric is no longer collected. The metric measured the number of mitigation plans that included SPSs, RASs, and/or operating procedures developed to meet reliability criteria.
M-11 Energy Emergency Alerts Background To ensure that all RCs clearly understand potential and actual energy emergencies in the interconnection, NERC has established three levels of energy emergency alerts (EEA). This metric measures the duration and number of times EEAs of all levels are issued and when firm load is interrupted due to an EEA level 3 event. EEA trends may provide an indication of BPS capacity. This metric may also provide benefits to the industry when considering correlations between EEA events and planning reserve margins.
39 http://www.nerc.com/pa/Stand/Pages/Standards-Under-Development.aspx 40 http://www.nerc.com/files/misoperations_webinar_master_deck_final.pdf 41 http://www.nerc.com/pa/RAPA/ri/Pages/ProtectionSystemMisoperations.aspx 42 http://www.nerc.com/pa/RAPA/PA/Performance Analysis DL/NERC Staff Analysis of Reported Misoperations - Final.pdf 43 See Appendix E for summaries of Regional Entity actions to drive reductions in individual Region’s misoperations

Chapter 4 – Reliability Indicator Trends
NERC | State of Reliability | May 2016 38
When an EEA3 alert is issued, firm-load interruptions are imminent or in progress in accordance with EOP-002-3.1.44 The issuance of an EEA3 may be due to a lack of available generation capacity or when resources cannot be scheduled due to transmission constraints.
Assessment Table 4.4 shows the number of EEA3 events declared from 2006–2015. Only one EEA3 was declared in 2015, fewer than all previous years shown. Table 4.5 shows the number of all EEAs declared in 2015. In Figure 4.14, a graph is provided for 2013-2015, showing the duration and amount of load shed during an EEA, if any. For the one EEA3 declared, it lasted only 1.9 hours and only 200 MW of load was shed during the event. The performance trend for this metric is considered to be improving.
Table 4.4: 2015 Energy Emergency Alert 3
Region Number of Events
2006 2007 2008 2009 2010 2011 2012 2013 2014 2015
NERC 7 23 12 41 11 23 16 7 4 1
FRCC 0 0 0 0 0 0 0 1 2 0
MRO 0 0 0 0 0 0 0 0 0 0
NPCC 0 0 1 1 0 0 0 0 1 0
RF 0 3 1 0 2 0 1 0 0 0
SERC 4 14 2 3 4 2 7 0 1 0
SPP 1 5 3 35 4 15 6 2 0 0
TRE 0 0 0 0 0 1 1 0 0 0
WECC 2 1 5 2 1 5 1 4 0 1
Table 4.5: 2015 EEA Level by Region
Region EEA1 EEA2 EEA3 Total
FRCC 3 0 0 3
MRO 4 4 0 8
NPCC 2 0 0 2
RF 1 1 0 2
SERC 3 2 0 5
SPP 0 0 0 0
WECC 3 2 1 6
TRE 0 0 0 0
Grand Total 16 9 1 26
44 http://www.nerc.com/files/EOP-002-3_1.pdf

Chapter 4 – Reliability Indicator Trends
NERC | State of Reliability | May 2016 39
Figure 4.14: Firm Load Shed and Duration Associated with EEA3 Events by Year
M-12 Automatic AC Transmission Outages Initiated by Failed Protection System Background This metric was enhanced in 2014 and 2015 to be consistent with the collection of BES data in TADS. The definition of BES was changed to include some equipment to 100 kV.45 This metric was revised to include any BES ac transmission element outages that were initiated by the TADS ICC of Failed Protection System Equipment. This metric will use the TADS data and definition of Failed Protection System Equipment. Transmission elements in this metric include ac circuits and transformers, calculated as:
The continued normalized count (on a per circuit basis) of 200 kV+ ac transmission element outages (i.e., TADS momentary and sustained automatic outages) that were initiated by Failed Protection System Equipment
Beginning January 1, 2015 the normalized count (on a per circuit basis) of 100 kV+ ac transmission element outages (i.e., TADS sustained automatic outages) that were initiated by Failed Protection System Equipment
45 http://www.nerc.com/pa/RAPA/Pages/BES.aspx

Chapter 4 – Reliability Indicator Trends
NERC | State of Reliability | May 2016 40
Assessment Changes of M-12(i) by year are shown in Figures 4.15 and 4.16. Figure 4.15 presents the number of automatic outages per ac circuit of 200 kV+ for the time period 2011–2015.
Figure 4.15: Automatic AC Circuit Outages Initiated by Failed Protection System Equipment
The calculated annual outage frequencies per ac circuit were tested to identify significant year-to-year changes of the reliability metric. Below is a summary of the metric performance for the five years:
No statistically significant decrease from 2011–2012 or from 2013–2014
Statistically significant decrease from 2012–2013 and from 2014–2015
The 2015 outage frequency is significantly lower than in each year from 2011–2014 These observations confirm an improved performance of M-12(i) for ac circuits. Figure 4.16 presents the number of automatic outages per transformer of 200 kV+ for 2011–2015.

Chapter 4 – Reliability Indicator Trends
NERC | State of Reliability | May 2016 41
Figure 4.16: Automatic Transformer Outages Initiated by Failed Protection System Equipment
The calculated annual outage frequencies per transformer were tested to identify significant year-to-year changes of the reliability metric. Below is a summary of the metric performance for the five years:
No statistically significant increase from 2011–2012
Year-to-year decreases from 2012–2015 with no statistically significant changes for any pair of consecutive years
The 2015 outage frequency is lower than in each year from 2011–2014 and statistically significantly lower than in 2012–2013
These observations confirm a stable performance for the five years and an improved performance since 2012 of M-12(i) for transformers. Recently introduced M-12(ii) was calculated for 2015. For the 100 kV+ elements, the number of sustained outages per ac circuit was 0.017 and per transformer 0.010. The performance trend for both circuits and transformers is considered to be improving.
M-13 Automatic AC Transmission Outages Initiated by Human Error Background This metric measures human error as one of many factors in the performance of ac transmission system automatic outages. This is done by taking the normalized count of ac transmission elements that were initiated by Human Error. The metric was enhanced in 2014 and 2015 to be consistent with the collection of BES data in TADS. The definition of BES was changed to include equipment to 100 kV in some circumstances and this metric was revised to include any BES ac transmission element outages that were initiated by the TADS ICC of Human Error. This metric will use

Chapter 4 – Reliability Indicator Trends
NERC | State of Reliability | May 2016 42
the TADS definition of Human Error. Transmission elements in this metric include ac circuits and transformers, calculated as:
The continued normalized count (on a per circuit basis) of 200 kV+ ac transmission element outages (i.e., TADS momentary and sustained automatic outages) initiated by Human Error
Beginning January 1, 2015, the normalized count (on a per circuit basis) of 100 kV+ ac transmission element outages (i.e., TADS sustained automatic outages) initiated by Human Error
Assessment Changes of M-13(i) by year are shown in Figures 4.17 and 4.18. Figure 4.17 presents the number of automatic outages per ac circuit of 200 kV+ for 2011–2015.
Figure 4.17: Automatic AC Circuit Outages Initiated by Human Error The calculated annual outage frequencies per ac circuit were tested to identify significant year-to-year changes of the reliability metric. Below is a summary of the metric performance for the five years:
No change from 2011–2012
No statistically significant decrease from 2012–2013 or from 2013–2014
Statistically significant decrease from 2014–2015
The 2015 outage frequency is statistically significantly lower than in each year from 2011–2014 These observations confirm an improved performance of M-13(i) for ac circuits. Figure 4.18 presents the number of automatic outages per transformer of 200 kV+ for 2011–2015.

Chapter 4 – Reliability Indicator Trends
NERC | State of Reliability | May 2016 43
Figure 4.18: Automatic Transformer Outages Initiated by Human Error
The calculated annual outage frequencies per transformer were tested to identify statistically significant year-to-year changes of the reliability metric. Below is a summary of the metric performance for the five years:
No statistically significant decrease from 2011–2012, from 2013–2014, or from 2014–2015
No statistically significant increase from 2012–2013
The 2015 outage frequency is lower than in 2011, 2013, and 2014 and statistically significantly lower than in 2013
These observations confirm a stable performance for the five years and an improved performance since 2013 of M-13(i) for transformers. Recently introduced M-13(ii) was calculated for 2015. For the 100 kV+ elements, the number of sustained outages per ac circuit was 0.022, and per transformer 0.019. The performance trend for both circuits and transformers is considered to be improving.
M-14 Automatic AC Transmission Outages Initiated by Failed AC Substation Equipment Background This metric measures Failed AC Substation Equipment as one of many factors in the performance of ac transmission system automatic outages. This is done by taking the normalized count of ac transmission elements that were initiated by Failed AC Substation Equipment. This metric was enhanced in 2014 and in 2015 to be consistent with the collection of BES data in TADS. The definition of BES was changed to include equipment 100 kV in some circumstances, this metric was revised to include any BES ac transmission element outages that were initiated by the TADS ICC of Failed AC Substation Equipment. This metric will use the TADS definition of Failed AC Substation Equipment. Transmission elements in this metric includes ac circuits and transformers, calculated as:

Chapter 4 – Reliability Indicator Trends
NERC | State of Reliability | May 2016 44
The continued normalized count (on a per circuit basis) of 200 kV+ ac transmission element outages (i.e., TADS momentary and sustained automatic outages) that were initiated by Failed AC Substation Equipment
Beginning January 1, 2015, the normalized count (on a per circuit basis) of 100 kV+ ac transmission element outages (i.e., TADS sustained automatic outages) that were initiated by Failed AC Substation Equipment
Assessment Changes of M-14(i) by year are shown in Figure 4.19 and Figure 4.20. Figure 4.19 presents the number of automatic outages per ac circuit of 200 kV+ for 2011–2015.
Figure 4.19: Automatic AC Circuit Outages Initiated by Failed AC Substation Equipment
The calculated annual outage frequencies per ac circuit were tested to identify statistically significant year-to-year changes of the reliability metric. Below is a summary of the metric performance for the five years:
No statistically significant decrease from 2011–2012
Statistically significant decrease from 2012–2013
No statistically significant increase from 2013–2014
No change from 2014–2015
The 2015 outage frequency is significantly lower than in 2011–2012 These observations confirm a stable performance of M-14(i) for ac circuits. Figure 4.20 presents the number of automatic outages per transformer of 200 kV+ for 2011–2015.

Chapter 4 – Reliability Indicator Trends
NERC | State of Reliability | May 2016 45
Figure 4.20: Automatic Transformer Outages Initiated by Failed AC Substation Equipment
The calculated annual outage frequencies per transformer were tested to identify significant year-to-year changes of the reliability metric. Below is a summary of the metric performance for the five years:
No statistically significant decreases for each pair of consecutive years
The 2015 outage frequency is lower than in any other year and statistically significantly lower than in 2011 and 2012
These observations confirm an improved performance of M-14(i) for transformers. The recently introduced M-14(ii) was calculated for 2015. For the 100 kV+ elements, the number of sustained outages per ac circuit was 0.032. Outages per transformer was 0.029. The performance trend for circuits is considered to be unchanged with the trend for transformers improving.
M-15 Automatic AC Transmission Outages Initiated by Failed AC Circuit Equipment Background This metric measures Failed AC Circuit Equipment as one of many factors in the performance of ac transmission system automatic outages. This is done by taking the normalized count of ac transmission elements that were initiated by Failed AC Circuit Equipment. This metric was enhanced in 2014 and in 2015 to be consistent with the collection of BES data in TADS. Since the definition of BES was changed to include equipment down to 100 kV in some circumstances, this metric was revised to include any BES ac transmission element outages that were initiated by the TADS ICC of Failed AC Circuit Equipment. This metric will use the TADS definition of Failed AC Circuit Equipment, calculated as:
The continued normalized count (on a per 100 circuit-mile basis) of 200 kV+ ac transmission circuit outages (i.e., TADS momentary and sustained automatic outages) initiated by Failed AC Circuit Equipment

Chapter 4 – Reliability Indicator Trends
NERC | State of Reliability | May 2016 46
Beginning January 1, 2015, the normalized count (on a 100 per circuit-mile basis) of 100 kV+ ac transmission circuit outages (i.e., TADS sustained automatic outages) initiated by Failed AC Circuit Equipment
Metric M-15 uses a normalization based on a line length and is defined for ac circuits only.
Assessment Changes of M-15(i) by year are shown in Figure 4.21 which presents the number of automatic outages per hundred miles for ac circuits of 200 kV+ for the time period 2011–2015.
Figure 4.21: Automatic AC Circuit Outages Initiated by Failed AC Circuit Equipment
The observed changes in the calculated frequencies cannot be statistically analyzed due to a mile-based normalization (these numbers do not represent observations in a statistical sample) and can be only compared numerically. The annual outage frequencies per hundred-mile ac circuit decreased every year from 2011–2014 and then increased in 2015. The 2015 frequency was the second largest after 2011. For the years 2011-2015, M-15(i) performance was inconsistent. Recently introduced M-15(ii) was calculated for 2015. For the 100 kV+ elements, the number of sustained outages
per hundred miles was 0.196.
The performance trend for this metric is considered to be inconclusive.
M-16 Element Availability Percentage (APC) and Unavailability Percentage Background This metric determines the percentage of BES ac transmission elements that are available or unavailable when outages due to automatic and non-automatic events are considered. Originally, there were two metrics: one to calculate availability and one to calculate unavailability. These were combined into one metric in 2013. This metric continues to focus on availability of elements at 200 kV+ because the components of the calculation include planned outages (which was no longer collected in TADS, beginning in 2015), unplanned outages (which are collected in TADS for all BES elements), and operational outages (which are only collected in TADS for 200 kV+). Therefore, the reporting voltage levels for this metric did not change.

Chapter 4 – Reliability Indicator Trends
NERC | State of Reliability | May 2016 47
Assessment For both transmission element types, ac circuits and transformers, only charts for unavailability are shown because, unlike availability, annual unavailability can be broken down by outage type. This is important since a part of unavailability due to planned outages is present for 2011–2014 and removed in 2015 due to changes in TADS data collection. Figure 4.22 presents ac circuit unavailability as a percentage for the time period 2011–2015. Note that in 2015 unavailability due to planned outages is removed from the definition and calculation. In 2011-2013, this portion of unavailability was the largest of the three.
Figure 4.22: AC Circuit Unavailability by Year and Outage Type
The ac circuit unavailability due to operational and automatic outages in 2015 was lower than for each year from 2011–2014. Figure 4.23 presents the number of instances of transformer unavailability as a percentage for the time period 2011–2015. In 2015, unavailability due to planned outages has been removed from the definition and calculation. In 2011–2014, this portion of unavailability was the largest of the three.

Chapter 4 – Reliability Indicator Trends
NERC | State of Reliability | May 2016 48
Figure 4.23: Transformer Unavailability by Year and Outage Type Transformer unavailability due to operational and automatic outages in 2015 was lower than for each year from 2011–2014. The performance trend for both circuits and transformers is considered to be improving. It is worth noting that a sizable change in transformer inventory occurred in 2015 due to changes in TADS reporting and that additional year-over-year data will be needed before drawing conclusions.

NERC | State of Reliability | May 2016 49
Chapter 5 – Enforcement Metrics for Risk and Reliability Impact
In June 2014, the Reliability Issues Steering Committee (RISC) asked the Compliance and Certification Committee (CCC) to identify ways compliance data could be used to identify opportunities to reduce risk to the BPS. The CCC and the PAS formed a team to address the development of one or more compliance-based metrics that relate to the reliability of the BPS. The team developed two metrics, focusing on the risk to and impact upon the BPS. When reviewing the enforcement metrics, it is important to keep these considerations in mind:
A violation posing a serious risk to reliability may not have an actual impact on reliability
A potential violation that causes impact to the BPS may not have posed a serious risk to reliability
Not all incidents on the BPS are the results of violations of a Reliability Standard
CP-1: Risk Metric Compliance Process-1 (CP-1) is a quarterly count of violations determined to have posed a serious risk to the reliability of the BPS.46 This metric tracks serious-risk violations based on the quarter during which the violations occurred.
Observations Figure 5.1 depicts the number of and the trend in serious-risk violations that have completed the enforcement process since the start of mandatory compliance with Reliability Standards in 2007. The rolling average provides an indicator of whether the rate of serious-risk violations is increasing, decreasing, or remaining steady. The spikes in the third quarter of 2009 and the first quarter of 2010 are largely attributable to the implementation of the CIP Reliability Standards as they became applicable to additional registered entities. The spike in the third quarter of 2011 is largely attributable to the September 8, 2011, Southwest Outage and the resulting violations resolved through FERC/NERC investigations. NERC and the REs assess and handle violations as the non-compliance is identified by registered entities and RE compliance monitoring activities. With the REs’ implementation of risk-based compliance monitoring and enforcement, the REs can focus their review on serious-risk violations. Some serious-risk violations occurring in 2013, 2014, and 2015 are yet to be filed with FERC. As the REs resolve those serious-risk violations and NERC files notices of penalty with FERC, the counts of serious-risk violations starting in 2013, 2014, and 2015 are expected to increase.
46 Information on risk assessment of non-compliance is available at:
http://www.nerc.com/pa/comp/Reliability%20Assurance%20Initiative/ERO%20Self-Report%20User%20Guide%20(April%202014).pdf

Chapter 5 – Enforcement Metrics for Risk and Reliability Impact
NERC | State of Reliability | May 2016 50
Figure 5.1: Serious-Risk Violations
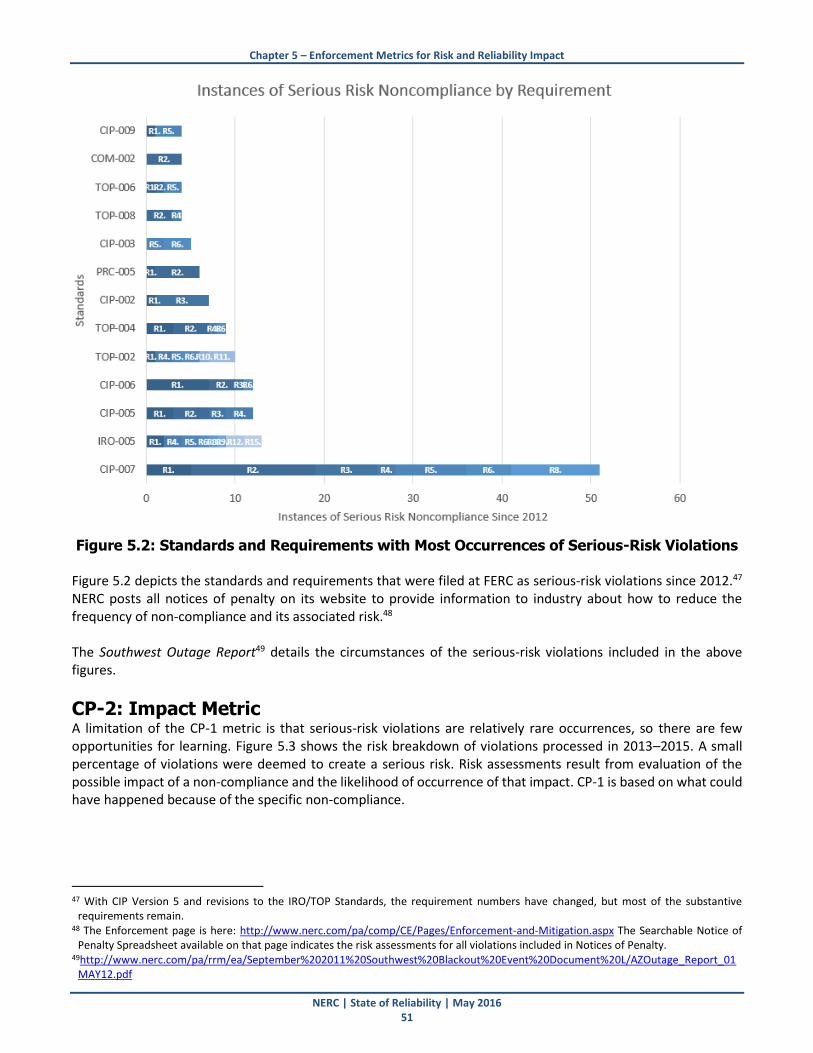
Chapter 5 – Enforcement Metrics for Risk and Reliability Impact
NERC | State of Reliability | May 2016 51
Figure 5.2: Standards and Requirements with Most Occurrences of Serious-Risk Violations
Figure 5.2 depicts the standards and requirements that were filed at FERC as serious-risk violations since 2012.47 NERC posts all notices of penalty on its website to provide information to industry about how to reduce the frequency of non-compliance and its associated risk.48 The Southwest Outage Report49 details the circumstances of the serious-risk violations included in the above figures.
CP-2: Impact Metric A limitation of the CP-1 metric is that serious-risk violations are relatively rare occurrences, so there are few opportunities for learning. Figure 5.3 shows the risk breakdown of violations processed in 2013–2015. A small percentage of violations were deemed to create a serious risk. Risk assessments result from evaluation of the possible impact of a non-compliance and the likelihood of occurrence of that impact. CP-1 is based on what could have happened because of the specific non-compliance.
47 With CIP Version 5 and revisions to the IRO/TOP Standards, the requirement numbers have changed, but most of the substantive
requirements remain. 48 The Enforcement page is here: http://www.nerc.com/pa/comp/CE/Pages/Enforcement-and-Mitigation.aspx The Searchable Notice of
Penalty Spreadsheet available on that page indicates the risk assessments for all violations included in Notices of Penalty. 49http://www.nerc.com/pa/rrm/ea/September%202011%20Southwest%20Blackout%20Event%20Document%20L/AZOutage_Report_01
MAY12.pdf

Chapter 5 – Enforcement Metrics for Risk and Reliability Impact
NERC | State of Reliability | May 2016 52
Compliance Process-2 (CP-2) is a quarterly count of the number of non-compliance with observed reliability impact, regardless of the risk assessment. This metric is based on what happened as a result of a specific non-compliance.
Figure 5.3: Final Risk Assessments (2013–2015, Q1 2016)
ERO Enterprise staff may monitor and analyze impactful violations through CP-2 to identify frequently observed issues and causes to develop lessons learned. These lessons learned could strengthen registered entity risk management programs and reduce the frequency and consequences of impactful violations. To the extent that minor problems are aggressively found and corrected, there should be a decline in the more consequential impacts higher in the pyramid shown below.
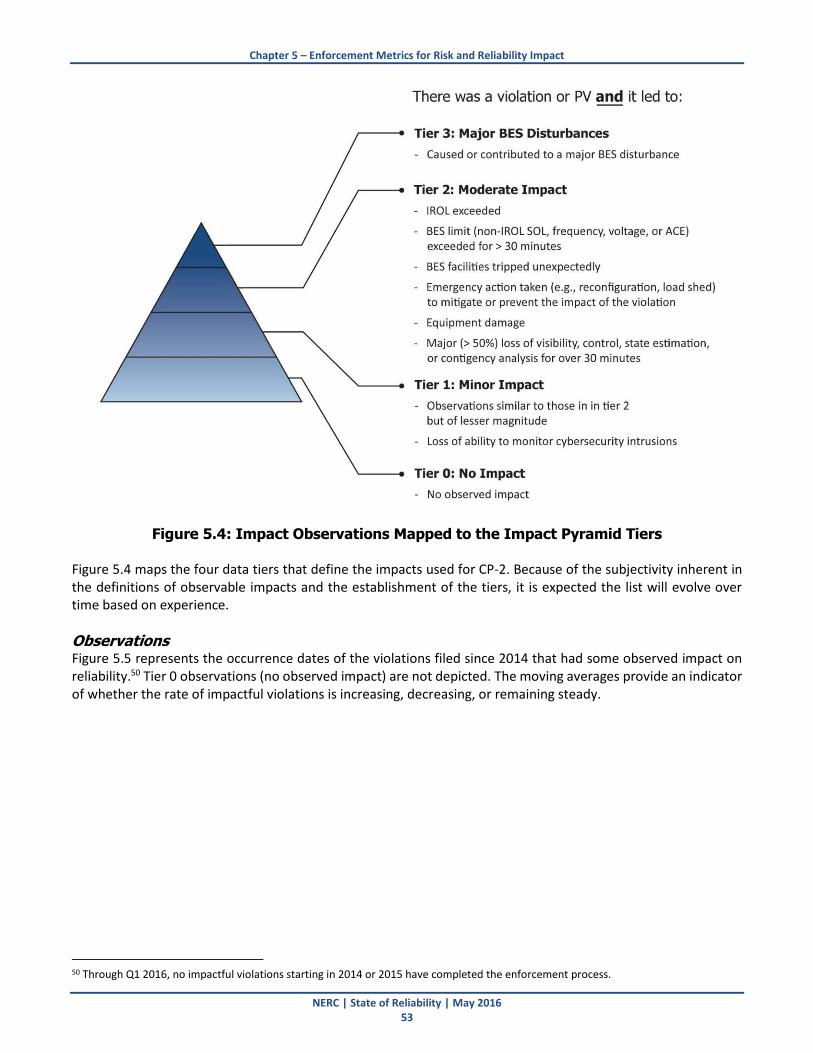
Chapter 5 – Enforcement Metrics for Risk and Reliability Impact
NERC | State of Reliability | May 2016 53
Figure 5.4: Impact Observations Mapped to the Impact Pyramid Tiers
Figure 5.4 maps the four data tiers that define the impacts used for CP-2. Because of the subjectivity inherent in the definitions of observable impacts and the establishment of the tiers, it is expected the list will evolve over time based on experience.
Observations Figure 5.5 represents the occurrence dates of the violations filed since 2014 that had some observed impact on reliability.50 Tier 0 observations (no observed impact) are not depicted. The moving averages provide an indicator of whether the rate of impactful violations is increasing, decreasing, or remaining steady.
50 Through Q1 2016, no impactful violations starting in 2014 or 2015 have completed the enforcement process.
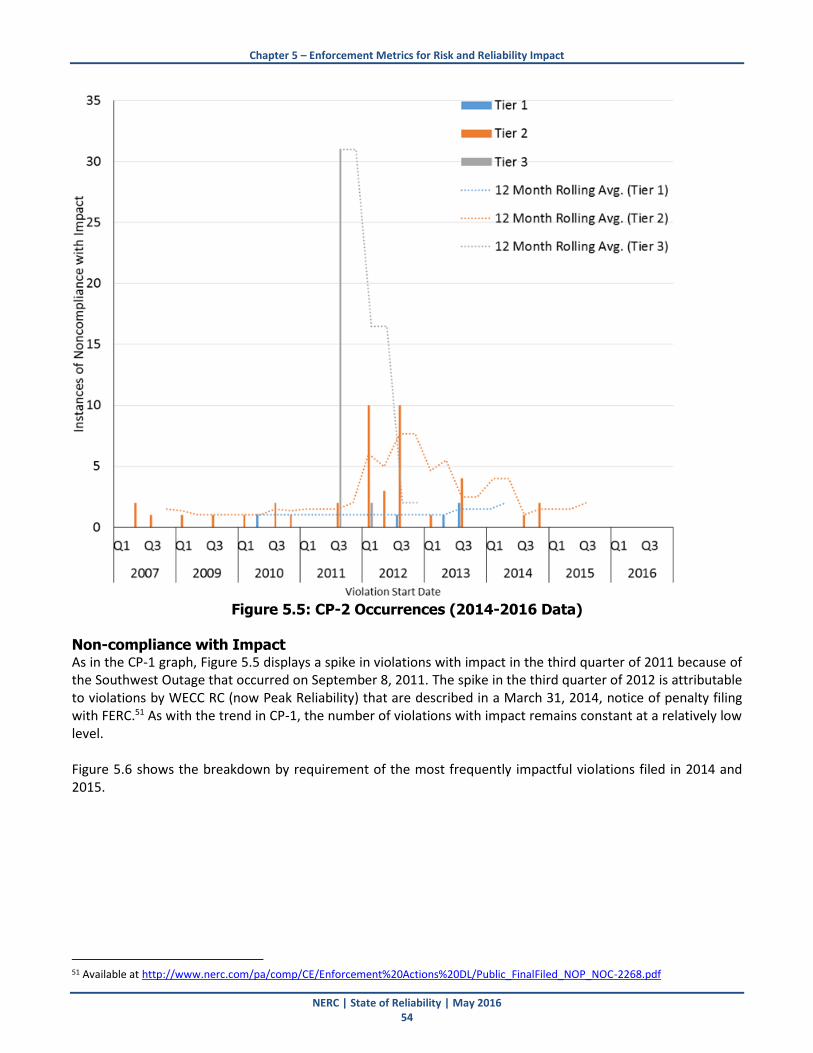
Chapter 5 – Enforcement Metrics for Risk and Reliability Impact
NERC | State of Reliability | May 2016 54
Figure 5.5: CP-2 Occurrences (2014-2016 Data)
Non-compliance with Impact As in the CP-1 graph, Figure 5.5 displays a spike in violations with impact in the third quarter of 2011 because of the Southwest Outage that occurred on September 8, 2011. The spike in the third quarter of 2012 is attributable to violations by WECC RC (now Peak Reliability) that are described in a March 31, 2014, notice of penalty filing with FERC.51 As with the trend in CP-1, the number of violations with impact remains constant at a relatively low level. Figure 5.6 shows the breakdown by requirement of the most frequently impactful violations filed in 2014 and 2015.
51 Available at http://www.nerc.com/pa/comp/CE/Enforcement%20Actions%20DL/Public_FinalFiled_NOP_NOC-2268.pdf

Chapter 5 – Enforcement Metrics for Risk and Reliability Impact
NERC | State of Reliability | May 2016 55
Figure 5.6: Most Frequently Filed Standards and Requirements (2014-2016 Data) The IRO and Transmission Operator (TOP) requirements represented in Figure 5.6 correspond to the serious-risk violations associated with the Southwest Outage and the WECC RC notice of penalty already referenced. Through the first quarter of 2016, NERC has filed only one CIP violation with an observed impact.52 NERC provides quarterly updates on trends in the Compliance Monitoring and Enforcement Program,53 and will continue to update CP-1 and CP-2 during 2016 with additional analysis regarding causal trends associated with the violations depicted in each metric.
52 The violation of CIP-007-3a R3 is described in a Notice of Penalty available at: http://www.nerc.com/pa/comp/CE/Enforcement%20Actions%20DL/FinalFiled_NOP_NOC-2391.pdf 53 Available at: http://www.nerc.com/pa/comp/CE/Pages/Compliance-Violation-Statistics.aspx
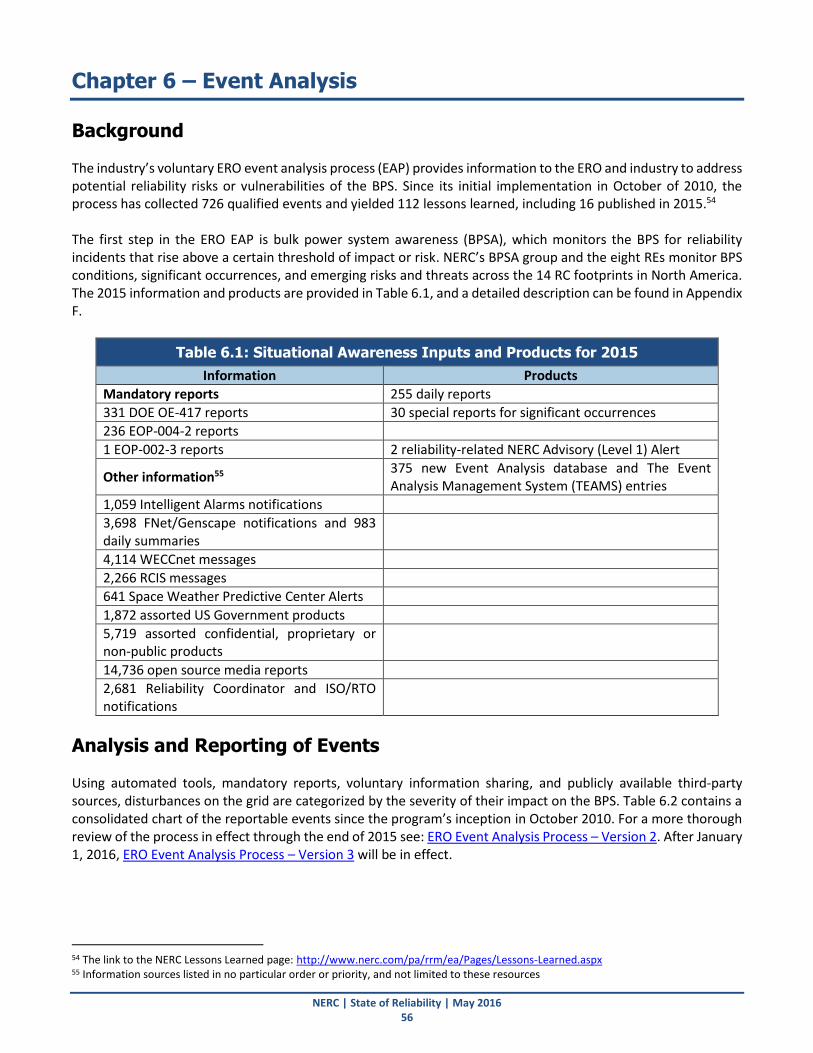
NERC | State of Reliability | May 2016 56
Chapter 6 – Event Analysis
Background The industry’s voluntary ERO event analysis process (EAP) provides information to the ERO and industry to address potential reliability risks or vulnerabilities of the BPS. Since its initial implementation in October of 2010, the process has collected 726 qualified events and yielded 112 lessons learned, including 16 published in 2015.54 The first step in the ERO EAP is bulk power system awareness (BPSA), which monitors the BPS for reliability incidents that rise above a certain threshold of impact or risk. NERC’s BPSA group and the eight REs monitor BPS conditions, significant occurrences, and emerging risks and threats across the 14 RC footprints in North America. The 2015 information and products are provided in Table 6.1, and a detailed description can be found in Appendix F.
Table 6.1: Situational Awareness Inputs and Products for 2015
Information Products
Mandatory reports 255 daily reports
331 DOE OE-417 reports 30 special reports for significant occurrences
236 EOP-004-2 reports
1 EOP-002-3 reports 2 reliability-related NERC Advisory (Level 1) Alert
Other information55 375 new Event Analysis database and The Event Analysis Management System (TEAMS) entries
1,059 Intelligent Alarms notifications
3,698 FNet/Genscape notifications and 983 daily summaries
4,114 WECCnet messages
2,266 RCIS messages
641 Space Weather Predictive Center Alerts
1,872 assorted US Government products
5,719 assorted confidential, proprietary or non-public products
14,736 open source media reports
2,681 Reliability Coordinator and ISO/RTO notifications
Analysis and Reporting of Events Using automated tools, mandatory reports, voluntary information sharing, and publicly available third-party sources, disturbances on the grid are categorized by the severity of their impact on the BPS. Table 6.2 contains a consolidated chart of the reportable events since the program’s inception in October 2010. For a more thorough review of the process in effect through the end of 2015 see: ERO Event Analysis Process – Version 2. After January 1, 2016, ERO Event Analysis Process – Version 3 will be in effect.
54 The link to the NERC Lessons Learned page: http://www.nerc.com/pa/rrm/ea/Pages/Lessons-Learned.aspx 55 Information sources listed in no particular order or priority, and not limited to these resources
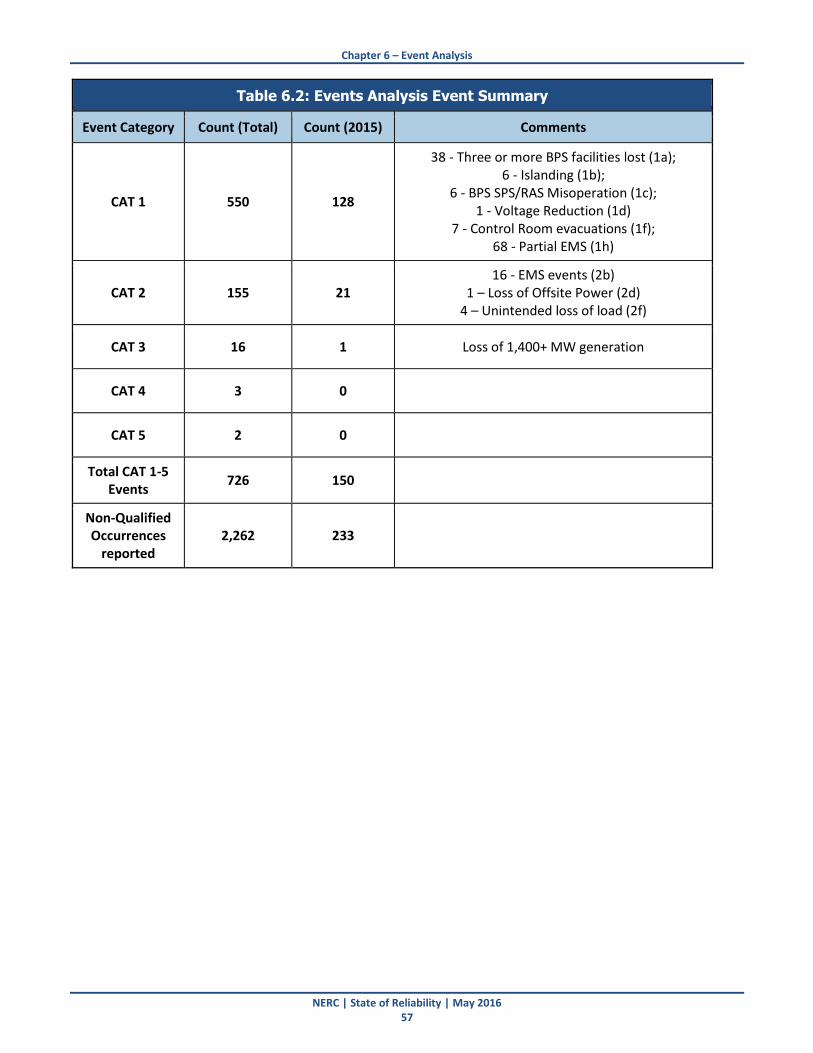
Chapter 6 – Event Analysis
NERC | State of Reliability | May 2016 57
Table 6.2: Events Analysis Event Summary
Event Category Count (Total) Count (2015) Comments
CAT 1 550 128
38 - Three or more BPS facilities lost (1a); 6 - Islanding (1b);
6 - BPS SPS/RAS Misoperation (1c); 1 - Voltage Reduction (1d)
7 - Control Room evacuations (1f); 68 - Partial EMS (1h)
CAT 2 155 21 16 - EMS events (2b)
1 – Loss of Offsite Power (2d) 4 – Unintended loss of load (2f)
CAT 3 16 1 Loss of 1,400+ MW generation
CAT 4 3 0
CAT 5 2 0
Total CAT 1-5 Events
726 150
Non-Qualified Occurrences
reported 2,262 233

Chapter 6 – Event Analysis
NERC | State of Reliability | May 2016 58
Figure 6.1: Control Chart for the Number Events (Per Month) Over Time
Figure 6.1 is the control chart for the 726 Qualified Events through 2015. In October 2013, when Version 2 of the EAP introduced a new category of events, collectively known as Category 1h: Partial Loss of Energy Management System (EMS) (see Appendix F for more information), occurrences which were not previously reported became visible and a shift in the control limits occurred. The control chart of events in 2015 shows the numbers of events were stable and predictable. Through the EAP, cause codes were assigned to 474 events, leading to 434 contributing cause codes being identified. The root cause of every event cannot be determined, though many of the contributing causes or failed defenses can be established. Figure 6.2 shows the overall trends for the contributing cause codes of events.

Chapter 6 – Event Analysis
NERC | State of Reliability | May 2016 59
Figure 6.2: The Percentage of Contributing Causes by Major Category Identification of these large areas of concern allow for the ability to prioritize and search for actionable threats to reliability. When this data was turned over to the AC Substation Equipment Task Force (ACSETF) to further investigate, it was determined that while the initial data pointed to the potential problem areas, the data was not detailed enough to analyze any specific problem areas. As a result, and following recommendations from the ACSETF report, an addendum for the types of information needed to support the Event Analysis process when failed equipment is identified was developed.56 A notable Category 2 event that affected the nation’s capital area occurred in 2015. This event resulted in a detailed event analysis report57 (EAR), which was developed in coordination with the affected Region and multiple registered entities. The EAP quickly determined causes, corrective actions, and lessons learned for the industry, demonstrating the capabilities and positive benefits of the EAP.
Major Initiatives in Event Analysis
Human Performance Event Analysis has identified work force capability and human performance (HP) challenges as possible threats to reliability. Workforce capability and human performance is a broad topic but can be divided into management, team, and individual levels. NERC held its fourth annual HP conference in Atlanta, Improving Human Performance on the Grid, at the end of March 2015.58 NERC continues to conduct cause analysis training with staff from the Regions and registered entities. As of December 2015, personnel from all eight Regions and approximately 1,200 people from 212 different registered entities have received cause analysis training, roughly 10,000 hours of training.
56 http://www.nerc.com/pa/rrm/ea/Pages/EA-Program.aspx 57 http://www.nerc.com/news/Pages/April-2015-Washington-D.C.-Area-Low-Voltage-Disturbance-Event.aspx 58 http://www.nerc.com/pa/rrm/hp/2015_Human_Performance_Conference/Forms/AllItems.aspx

Chapter 6 – Event Analysis
NERC | State of Reliability | May 2016 60
2015 Winter Weather Review NERC reviewed the 2015 BPS winter performance to continue benchmarking current winter performance with previous winter events to identify risks to BPS reliability and inform stakeholders of the impacts of those risks. The 2015 Winter Review serves as an analysis and comparison of the BPS performance in the winter quarter of 2015 versus previously recorded years, most notably the 2014 polar vortex. It briefly reviews conditions and results from the 2014 Polar Vortex Review then shows similar conditions and results from 2015 when extreme winter conditions became comparable. Winter 2015 was marked by cold temperatures similar to Winter 2014, with the coldest temperatures experienced during February 2015 throughout the Eastern Interconnection. Numerous cities hit their daily low-temperature records during February 2015. Due to the low temperatures and associated high electricity demand for heating needs, several areas set all-time record winter peak demand the morning of February 20, 2015, that surpassed the previous all-time winter peaks set January 7, 2014. Although new record winter peaks were set during this time frame, no emergency demand response or any other capacity emergency actions were required. Overall BPS performance during the 2015 cold weather events showed improvements over Winter 2014. In part, the improvements reflected actions taken by stakeholders as a result of analysis, lessons learned, and implementation of recommendations from what was experienced in 2014 and years prior. The importance of preparation for extreme weather events could be readily observed from the improved unit performance. Below are a few of the observations and recommendations based on the analysis of this performance:
Whenever possible, many generators would start on gas then switch to oil instead of attempting to start on oil.
Owners started units earlier than expected due to anticipated colder temperatures, helping to mitigate the risk of taking more time to start.
Keeping stations in service overnight with a reduced output level was beneficial to ensuring the unit would stay warm and on-line when needed for the peak.
More thorough testing of the plant and, if applicable, on the alternate fuel proved effective in proactively identify issues.
Proactive staffing of typically unmanned stations enabled more rapid response.
In the PJM footprint, many generation units participated in prewinter operational testing. Units that participated in the prewinter operational testing had a lower rate of forced outages compared to those that did not test.59
PJM established a gas-electric coordination team to establish closer coordination with natural gas pipelines and assist PJM dispatch in factoring gas availability data into its cold weather planning and scheduling with generators. PJM dispatch also benefited from improved reporting on gas status by generators.
Generation facilities across all Regions have indicated that they have reviewed and/or implemented recommendations from the February 2011 Southwest Cold Weather Event Lessons Learned as well as the Generator Winter Weather Readiness guideline. This is due in large part to industry’s effective focus on planning and timely preparations for extreme cold weather. 60
59 http://www.pjm.com/~/media/documents/reports/20150513-2015-winter-report.ashx 60 http://www.nerc.com/pa/rrm/ea/ColdWeatherTrainingMaterials/2015_Winter_Review_December_2015_FINAL.pdf
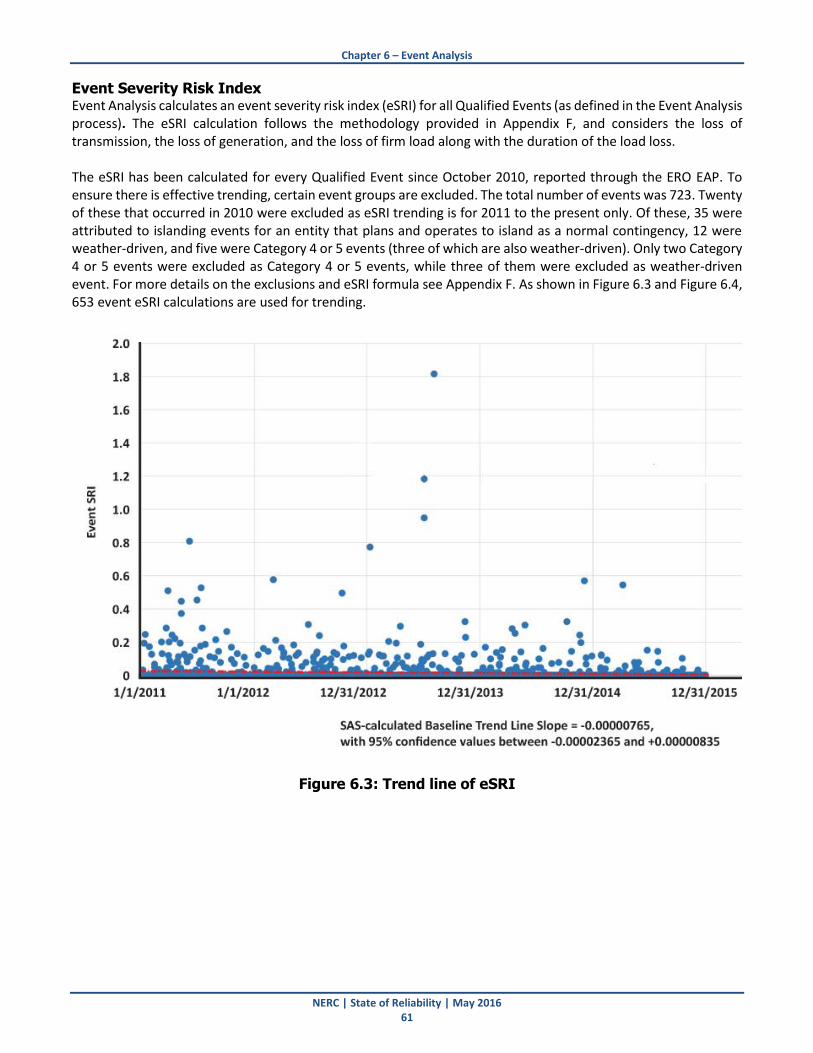
Chapter 6 – Event Analysis
NERC | State of Reliability | May 2016 61
Event Severity Risk Index Event Analysis calculates an event severity risk index (eSRI) for all Qualified Events (as defined in the Event Analysis process). The eSRI calculation follows the methodology provided in Appendix F, and considers the loss of transmission, the loss of generation, and the loss of firm load along with the duration of the load loss. The eSRI has been calculated for every Qualified Event since October 2010, reported through the ERO EAP. To ensure there is effective trending, certain event groups are excluded. The total number of events was 723. Twenty of these that occurred in 2010 were excluded as eSRI trending is for 2011 to the present only. Of these, 35 were attributed to islanding events for an entity that plans and operates to island as a normal contingency, 12 were weather-driven, and five were Category 4 or 5 events (three of which are also weather-driven). Only two Category 4 or 5 events were excluded as Category 4 or 5 events, while three of them were excluded as weather-driven event. For more details on the exclusions and eSRI formula see Appendix F. As shown in Figure 6.3 and Figure 6.4, 653 event eSRI calculations are used for trending.
Figure 6.3: Trend line of eSRI

Chapter 6 – Event Analysis
NERC | State of Reliability | May 2016 62
Figure 6.4: Expanded View of eSRI Trend Line Y axis 0 to 0.3
As can be seen from the expanded view (included to address the scale limit visibility), the eSRI is approximately zero within the statistical confidence interval. Furthermore, as indicated in Figures 6.3 and 6.4, the trend line is relatively flat.

NERC | State of Reliability | May 2016 63
Chapter 7 – BES Security Metrics
Background The 2015 State of Reliability report included a chapter that introduced new security performance metrics definitions and results based on preliminary data provided by the E-ISAC. This chapter provides results based on data collected and validated during 2014 and 2015. As E-ISAC staff analyzed the data, they saw a need to clarify a few of the definitions and collaborated with the BES Security Metrics Working Group (BESSMWG) to enhance the metrics to meet their intent. This chapter also provides an overview of a roadmap prepared by the BESSMWG for the development of additional security metrics in future.
Purpose For years, NERC and the electricity industry have taken actions to address cyber and physical security risks to the BES as a result of potential and real threats, vulnerabilities, and events. These metrics complement other NERC reliability performance metrics by defining lagging and leading indicators for security performance as they relate to reliable BES operation. The metrics provide a global and industry-level view of how security risks are evolving, and indicate the extent to which the electricity industry is successfully managing these risks. Due to the vast array of different operational systems used by electricity entities, the BESSMWG has not developed cybersecurity metrics that may be applicable to individual entities at the operational level. For information about the operational level, see CIP Reliability Standards with mandatory requirements to support security.
Security Performance Metrics and Results This section provides the five security performance metrics E-ISAC uses. The E-ISAC and BESSMWG have reviewed these results and, where possible, have identified trends while recognizing that these results are based on only two years of data.
BES Security Metric 1: Reportable Cybersecurity Incidents This metric reports the total number of Reportable Cybersecurity Incidents61 that occur over time and identifies how many of these incidents have resulted in a loss of load. It is important to note that any loss of load will be counted, regardless of direct cause. For example, if load was shed as a result of a loss of situational awareness caused by a cyber incident that affected an entity’s EMS, the incident would be counted even though the cyber incident did not directly cause the loss of load. This metric provides an indication of the number of Reportable Cybersecurity Incidents and the resilience of the BES to operate reliably and continue to serve load. This metric is based on data reported to and analyzed by E-ISAC. Entities must report cybersecurity incidents as required by the NERC Reliability Standard CIP-008-5 Incident Reporting and Response Planning. While the data provided in Table 7.1 indicates there were zero reportable cybersecurity incidents during 2015 and therefore also zero that resulted in loss of load, this does not necessarily suggest that the risk of a cybersecurity incident is low as the number of cybersecurity vulnerabilities is continuing to increase (ref. security metric 5).62
61 Ref. NERC Glossary of Terms: “A Cybersecurity Incident that has compromised or disrupted one or more reliability tasks of a functional entity.” 62 ERO Reliability Risk Priorities, RISC Recommendations to the NERC Board of Trustees, October 2015, p. 7 Risk Mapping chart depicts cybersecurity risk as
having high potential impact and relative likelihood of BPS-wide occurrence.

Chapter 7 – BES Security Metrics
NERC | State of Reliability | May 2016 64
Table 7.1: Reportable Cybersecurity Incidents
Metric 2014 2015
Q1 Q2 Q3 Q4 Q1 Q2 Q3 Q4
Total number of Reportable Cybersecurity Incidents 3 0 0 0 0
Total number of Reportable Cybersecurity Incidents resulting in loss of load
0 0 0 0 0
BES Security Metric 2: Reportable Physical Security Events This metric reports the total number of physical security reportable events63 that occur over time and identifies how many of these events have resulted in a loss of load. It is important to note that any loss of load is counted, regardless of direct cause. For example, if load was shed as a result of safety concerns due to a break-in at a substation, the event is counted even though no equipment was damaged which directly cause the loss of load. The metric provides an indication of the number of physical security reportable events and the resilience of the BES to operate reliably and continue to serve load. This metric is based on data reported to NERC’s BPSA group and analyzed by E-ISAC. Entities must report physical security events as required by the NERC EOP-004-2 Event Reporting reliability standard. It is emphasized that this metric does not include physical security events reported to the E-ISAC that do not meet the reporting threshold as defined by the NERC EOP-004-2 standard, such as physical threats and damage to substation perimeter fencing. Also, this metric does not include physical security events affecting equipment at the distribution level (i.e., non-BES equipment). Table 7.2 contains the data for this metric. During 2014 and 2015, one physical security event occurred that caused a loss of load. This near-zero result does not necessarily suggest that the risk of a physical security event causing a loss of load is low, as the number of reportable events as a result of physical security threats and those reportable events that result in physical damage or destruction to a facility have increased by about 50 percent in 2015 compared with 2014. Although this metric does not include physical security events affecting equipment at the distribution level (i.e., non-BES equipment), NERC receives information through both mandatory and voluntary reporting that indicates that distribution-level events are more frequent than those affecting BES equipment.
Table 7.2: Reportable Physical Security Events
Metric 2014 2015
Q1 Q2 Q3 Q4 Q1 Q2 Q3 Q4 Total
Total number of reportable events as a result of physical security threats to a facility or BES control center without physical damage or destruction
47 11 15 21 29 76
Total number of reportable events that cause physical damage or destruction to a facility
9 5 5 2 5 17
63 Reportable Events are defined in Reliability Standard EOP-004-2 Event Reporting, Attachment 1.

Chapter 7 – BES Security Metrics
NERC | State of Reliability | May 2016 65
Table 7.2: Reportable Physical Security Events
Metric 2014 2015
Q1 Q2 Q3 Q4 Q1 Q2 Q3 Q4 Total
Total number of reportable events as a result of physical security threats to a facility or BES control center, or cause physical damage or destruction to a facility, that result in a loss of load
0 1 0 0 0 1
BES Security Metric 3: E-ISAC Membership This metric reports the total number of electricity sector organizations and individuals registered as members of the E-ISAC, which include NERC registered entities and others in the electricity sector, such as distribution utilities (i.e., membership is not limited to BES organizations). Given today’s rapidly changing threat environment, it is important that electricity entities be able to quickly receive and share security-related information. This metric identifies the number of organizations registered as well as the number of individuals. Increasing E-ISAC membership should serve to collectively increase awareness of security threats and vulnerabilities and enhance the sector’s ability to respond quickly and effectively. This metric is based on quarterly data available from the E-ISAC. It is provided in Table 7.3.
Table 7.3: E-ISAC Membership
Metric 2014 2015
Q1 Q2 Q3 Q4 Q1 Q2 Q3 Q4
Total number of electricity sector organizations registered as members of the E-ISAC
496 557 578 827 840 848 868 898
Total number of individuals in E-ISAC member organizations who have E-ISAC accounts
1,514 1,844 2,010 2,770 2,797 2,949 3,292 3,834
The data indicates the following:
As of the end of 2015, all RCs and 85 percent of BAs had an active account with the E-ISAC. As defined by the NERC functional model, RCs and BAs play a critical role by coordinating the operation of the BES within their respective areas and with each other.
The rapid increase in organization registration experienced during 2014 has leveled off 2015. NERC is continuing to conduct additional outreach across the industry to further increase awareness and active involvement in the E-ISAC portal.
The number of individual users is increasing at a faster rate than the number of registered organizations. Organizations are increasing the number of individuals with access to the E-ISAC portal, likely as part of efforts to increase their security capabilities and capacity.

Chapter 7 – BES Security Metrics
NERC | State of Reliability | May 2016 66
BES Security Metric 4: Industry-Sourced Information Sharing This metric reports the total number of incident bulletins (i.e., cyber bulletins and physical bulletins) published by the E-ISAC based on information voluntarily submitted by E-ISAC member organizations.64 E-ISAC member organizations include NERC registered entities and others in the electricity sector, including distribution utilities (i.e., it is not limited to the BES). Incident Bulletins describe physical and cybersecurity incidents and provide timely, relevant, and actionable information of broad interest to the electricity sector. Given today’s complex and rapidly changing threat environment, it is important that electricity sector entities share their own security-related intelligence as it may help identify emerging trends or provide an early warning to others. This metric provides an indication of the extent to which E-ISAC member organizations are willing and able to share information related to cyber and physical security incidents they experience. As E-ISAC member organizations increase the extent that they share their own information, all member organizations will be able to increase their own awareness and ability to respond quickly and effectively. This should enhance the resilience of the BES to new and evolving threats and vulnerabilities. Table 7.4 shows that the E-ISAC received almost three times as many reports in 2015 compared with 2014, perhaps indicating that more organizations are increasingly aware of the value in sharing information with the E-ISAC.
Table 7.4: Industry-Sourced Information Sharing65
Metric 2014 2015
Q1 Q2 Q3 Q4 Total Q1 Q2 Q3 Q4 Total
Total number of E-ISAC Cyber Bulletins based on information provided by the electricity sector.
18 26 22 14 80 28 87 69 34 218
Total number of E-ISAC Physical Bulletins based on information provided by the electricity sector.
0 0 0 0 0 0 0 0 53 53
BES Security Metric 5: Global Cyber Vulnerabilities This metric reports the number of global cybersecurity vulnerabilities that are considered to be high severity based on data published by the National Institute of Standards and Technology (NIST). NIST defines high severity vulnerabilities as those with a common vulnerability scoring system66 (CVSS) of seven or higher, but this metric is not limited to information technology typically used by electricity sector entities. For 2015, a sub-metric is included to report the number of global cybersecurity incidents in order to identify any correlation between vulnerabilities and incidents. While there are a number of different publicly-available sources for this information, the BESSMWG has selected the PWC Global State of Information Security Report because it has consistently reported the number of incidents since at least 2013. This metric is based on surveys, and although the survey respondents change from year to year, reports of this nature tend to have consistent results and will continue to be a valid indicator. The data for this metric is included in Table 7.5. The year-over-year increase in global cybersecurity vulnerabilities (23 percent) compared with global cybersecurity incidents 38 percent indicates that vulnerabilities are increasingly being successfully exploited and reinforces the need for organizations to continue to enhance their cybersecurity capabilities.
64 In September 2015, the E-ISAC launched its new portal. Watchlist entries are now called cyber bulletins. The category physical bulletins is on the portal to share physical security information. Prior to 2015 Q4, physical security reports were shared through the E-ISAC Report weekly report, but not through Watchlist entries. 65 Note that the data in Security Metric 4 may include incidents from Security Metric 1 and 2. 66 Ref. NIST http://nvd.nist.gov/cvss.cfm

Chapter 7 – BES Security Metrics
NERC | State of Reliability | May 2016 67
Table 7.5: Global Cyber Vulnerabilities
Metric 2014 2015
Q1 Q2 Q3 Q4 Total Q1 Q2 Q3 Q4 Total
Number of global cyber vulnerabilities considered to be high severity
446 499 418 557 1,920 535 463 698 672 2,368
Number of global cybersecurity incidents 18,456 25,469
The BESSMWG intends to explore metrics more relevant to the electricity industry than these global vulnerabilities and incidents. For example, the BESSMWG could develop a representative list of BES cyber assets commonly used by the industry and track the number of vulnerabilities specific to these assets over time. Similarly, the E-ISAC may be able to report the number of incidents that have affected assets on the representative list.
Roadmap for Future Metrics Development During 2015, the BESSMWG and the E-ISAC developed a roadmap for future metrics development, including refining the initial set of five metrics based on production experience. As can be seen in Figure 7.1, the industry is still engaged in the early stages of this effort. The roadmap recognizes the challenges associated with requesting entities to provide new data to NERC and the need to ensure the metrics are valuable to the industry as a whole.
Figure 7.1: Future Metrics Development Roadmap The roadmap accounts for the unique challenges associated with collecting security-related data, including:
Historically, NERC and the E-ISAC have limited data related to cyber and physical security incidents as these incidents have been relatively rare and have had little or no impact on BES reliability.
The magnitude or number of constantly changing security threats and vulnerabilities are not yet known with any degree of certainty, particularly as they relate to BES reliability.
The number and type of cyber systems and equipment used by the industry is vast, making it difficult to develop metrics that are meaningful to individual entities across the industry.

Chapter 7 – BES Security Metrics
NERC | State of Reliability | May 2016 68
Data that details security threats, vulnerabilities, and real incidents is highly sensitive. Handled inappropriately, this can expose vulnerabilities and encourage adversaries to develop new and more sophisticated exploits.
The BESSMWG and E-ISAC have researched security metrics developed by leading experts outside the electricity industry and examined over 150 of these to initially assess their applicability from a BES reliability perspective. Out of the over 150 metrics considered, only about 30 were selected for more detailed consideration during 2016 and beyond. This assessment underscores the challenges associated with developing relevant and useful security metrics that rely on data willingly and ably provided by individual entities. A particular area deserving consideration for future metrics includes using automated communications methods67 to share cybersecurity information between individual organizations and the E-ISAC.
67 For example, the Cybersecurity Risk Information Sharing Program (CRISP) uses information sharing devices to collect and transmit security information from electricity operator participant sites. Data is shared with CRISP participants, and unattributed data is shared with the broader E-ISAC membership.
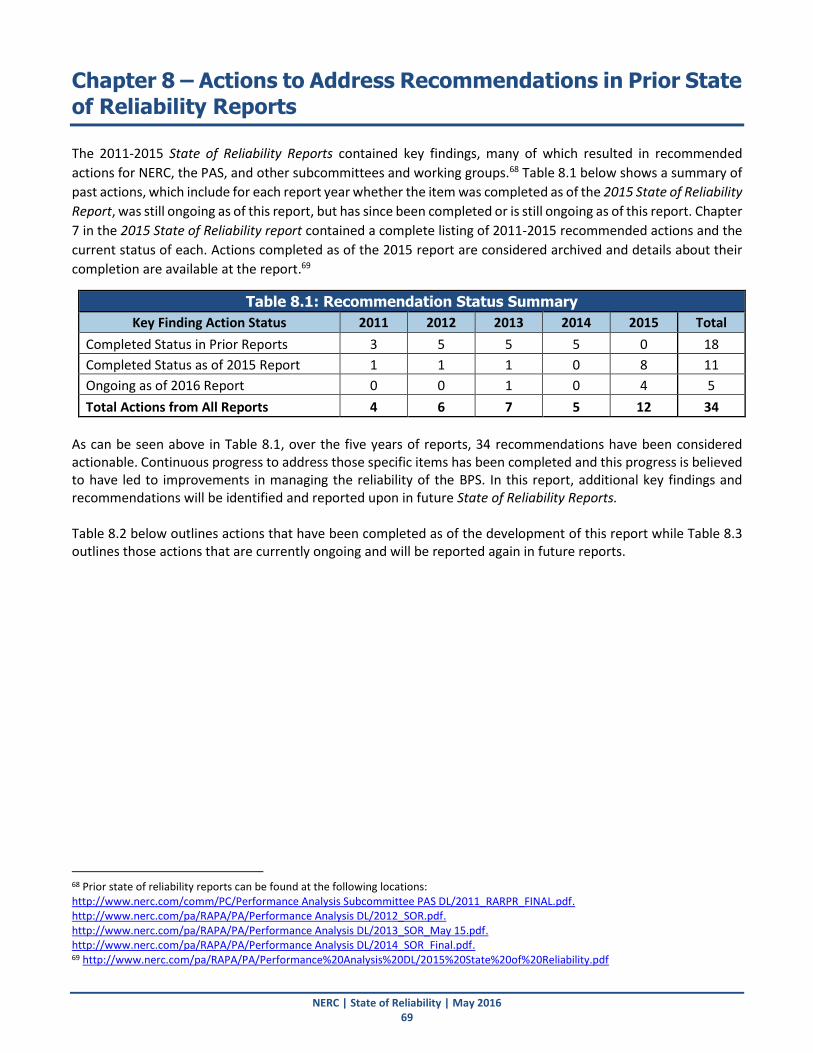
NERC | State of Reliability | May 2016 69
Chapter 8 – Actions to Address Recommendations in Prior State
of Reliability Reports
The 2011-2015 State of Reliability Reports contained key findings, many of which resulted in recommended
actions for NERC, the PAS, and other subcommittees and working groups.68 Table 8.1 below shows a summary of
past actions, which include for each report year whether the item was completed as of the 2015 State of Reliability
Report, was still ongoing as of this report, but has since been completed or is still ongoing as of this report. Chapter
7 in the 2015 State of Reliability report contained a complete listing of 2011-2015 recommended actions and the
current status of each. Actions completed as of the 2015 report are considered archived and details about their
completion are available at the report.69
Table 8.1: Recommendation Status Summary
Key Finding Action Status 2011 2012 2013 2014 2015 Total
Completed Status in Prior Reports 3 5 5 5 0 18
Completed Status as of 2015 Report 1 1 1 0 8 11
Ongoing as of 2016 Report 0 0 1 0 4 5
Total Actions from All Reports 4 6 7 5 12 34
As can be seen above in Table 8.1, over the five years of reports, 34 recommendations have been considered actionable. Continuous progress to address those specific items has been completed and this progress is believed to have led to improvements in managing the reliability of the BPS. In this report, additional key findings and recommendations will be identified and reported upon in future State of Reliability Reports. Table 8.2 below outlines actions that have been completed as of the development of this report while Table 8.3 outlines those actions that are currently ongoing and will be reported again in future reports.
68 Prior state of reliability reports can be found at the following locations: http://www.nerc.com/comm/PC/Performance Analysis Subcommittee PAS DL/2011_RARPR_FINAL.pdf. http://www.nerc.com/pa/RAPA/PA/Performance Analysis DL/2012_SOR.pdf. http://www.nerc.com/pa/RAPA/PA/Performance Analysis DL/2013_SOR_May 15.pdf. http://www.nerc.com/pa/RAPA/PA/Performance Analysis DL/2014_SOR_Final.pdf. 69 http://www.nerc.com/pa/RAPA/PA/Performance%20Analysis%20DL/2015%20State%20of%20Reliability.pdf

Chapter 8 – Actions to Address Recommendations in Prior State of Reliability Reports
NERC | State of Reliability | May 2016 70
Completed Recommendations
Table 8.2: Completed Recommendations
Item Reference
Finding Report
Year
Key Finding
Reference Key Finding Synopsis Actions Taken to Date
1 2011 Page 3
Paragraph 3
Generating Availability Performance: "In the last three years, the Equivalent Forced Outage Rate - Demand (EFORd) increased, indicating a higher risk that a unit may not be available. Detailed analysis is needed to identify the root causes of increasing forced outage rate."
Analysis performed by NERC and the GADS Working Group indicate that average forced outage rates (eFORd) have decreased from 2012 to 2014 indicating a lower risk that generation units may not be available when needed. This finding is contrary to the previous forced outage rate trend from 2009 to 2011.
2 2012 Page 11
Paragraph 1
Resource Mix Changes Necessitate New Metrics: "Resources such as wind generation and demand response are the non-traditional resources that perform differently than conventional generators. New metrics should be developed in order to determine what, if any, impact these differences have on reliability."
Wind data reporting instructions (Section 1600 Data Request for Wind Characteristics) were approved by NERC's Board in November 2015. Wind performance data intended to enable the development of metrics for future
State of Reliability reports. Demand
response metrics have been developed and approved by PAS in September 2015.
3 2013 Page 28
Paragraph 3
Severity Risk Index Assessment: "Additionally, it appears that with the modified method of calculating SRIbps, generation severity plays a substantial role in the daily summary values as measured by SRIbps. Future state of reliability reports will contain information assembled and analyzed from GADS, which is likely to bring greater understanding to these facilities and their role assessing the reliability of the BPS. Further analysis of generation performance, particularly as it relates to daily bulk power system performance is appropriate; additional analysis will be
incorporated into State of Reliability
reports in the future."
Generation loss was noted as a significant contributor to daily SRIbps. It will be subsequently reported within the Annual State of Reliability Report. To ensure that all stakeholders fully understand the weighting methodology behind the components that result in the score, greater explanation of the formula will be included as basic information in the Chapter 3, where the discussion about the SRI results occurs. Lastly, the SRI measure will be included in PAS's annual review of approved metrics.
4 2015 Page 6
Paragraph 2
Key Finding 1: Weather Continues to Stress BPS Reliability: To the extent that weather is determined as a large impact to day-to-day and extreme-day performance, other metrics that report on BPS reliability (specifically load-loss events) that retain weather impacts should be developed. Recommendation: NERC and industry should develop metrics that provide insight into weather impacts on BPS performance.
NERC PAS will incorporate weather context into its Key Findings assessment to provide a historical context. NERC and the industry will continue to monitor this phenomenon and determine if weather normalization incorporation into the SRIbps assessment is useful. NERC PAS recognizes that a longer period of assessment may be required in order to develop meaningful conclusions.

Chapter 8 – Actions to Address Recommendations in Prior State of Reliability Reports
NERC | State of Reliability | May 2016 71
Table 8.2: Completed Recommendations
Item Reference
Finding Report
Year
Key Finding
Reference Key Finding Synopsis Actions Taken to Date
5 2015 Page 8
Paragraph 1
Key Finding 2: No Load Loss Due to Cyber or Physical Security Events: NERC, with support from CIPC, should deploy the security metrics presented in Chapter 9. Working with industry and forums such as the North American Transmission Forum (NATF), NERC should analyze information from these security metrics and consider development of additional metrics that could provide valuable information on cybersecurity.
The security metrics have been developed, in addition to a roadmap for future security metric development and are discussed in further detail in
Chapter 8 of 2016 State of Reliability.
6 2015 Page 10
Paragraph 3
Key Finding 5: Stable Frequency Response Trend: NERC should monitor the effectiveness of the Industry Advisory on generator governor frequency response on the Eastern Interconnection. NERC should assess the impact of BAL-003-1 on frequency response for all interconnections subsequent to the Reliability Standard's effective dates.
NERC continues to perform year-over-year statistical analysis on frequency response trends for each interconnection that will demonstrate the impacts of the Industry Advisory and other initiatives discussed in Chapters 2 & 4.
7 2015 Page 21
Paragraph 1
SRI Weighting Factors: Additionally, further assessment of the SRI weight factors should be considered to determine whether modifications to the measure are appropriate.
The weighting factors are addressed in Item 3 above.
8 2015 Page 26
Paragraph 3
Reliability Naming Convention: Both metric naming conventions (M-x and ALRxx) are used in this chapter, but in future reports, the new metric names will be used.
New convention fully adopted in
Chapter 4 of the 2016 State of Reliability.
9 2015 Page 26
Paragraph 4
System Voltage Metric Development: Efforts are underway to develop one or more metrics to more effectively determine system voltage performance.
The ERSTF has proposed a system voltage metric, addressed in item 13 below.
10 2015 Page 58
Paragraph 5
Compliance Metrics: The PAS plans to recommend to the OC and PC the testing of these two compliance metrics: CP-1 (Risk Focus), and CP-2 (Impact Focus).
New metrics fully adopted in Chapter 5
of the 2016 State of Reliability.

Chapter 8 – Actions to Address Recommendations in Prior State of Reliability Reports
NERC | State of Reliability | May 2016 72
Table 8.2: Completed Recommendations
Item Reference
Finding Report
Year
Key Finding
Reference Key Finding Synopsis Actions Taken to Date
11 2015 Page 83
Paragraph 1
Next Steps for Security Metrics: Through 2015, the BESSMWG will work with the ES-ISAC to help validate the data for these five metrics and continue to define additional metrics that can be developed with readily available data. In addition, the BESSMWG will develop a longer-term roadmap to explore other metrics that would be valuable, regardless of the extent to which the data is currently readily available.
These security metric actions are addressed in item 6 above.
Ongoing Recommendations Table 8.3: Ongoing Recommendations
Item Reference
Finding Report
Year
Key Finding
Reference Key Finding Synopsis Actions Taken to Date
12 2013 Page 17
Paragraph 1
Automatic Transmission Events with Unknown Cause Necessitates Analysis: "Initiating [unknown] cause codes comprise 19 percent of all events with automatic outages. This may be an area where more analysis is needed."
Regional entities have worked with transmission owners to improve data that was collected, reducing unknown sustained outage causes. This effort serves to structure a model for subsequent investigative analysis. Additional detailed analysis of these cause-coded outages, consistent with analysis performed by other transmission analytical groups is being reviewed and will further inform the process. Industry awareness of these cause codes is being elevated by TADS and Regional Entities.
13 2015 Page 9
Paragraph 5
Key Finding 3: Decline of Average Transmission Outage Severity: NERC, working with the NATF, should evaluate the failure rate of circuit breakers and determine the impact of bus configuration on ac transmission circuit outages. NERC, working with IEEE, and other applicable industry forums, should develop a consistent method for the collection and distribution of ac substation equipment failure data.
"NERC analysis has confirmed that the failure of a circuit breaker to operate properly increases the probability that additional BPS elements will also be forced out of service, increasing the transmission outage severity of the event and that TADS does not currently collect sufficient data to correlate bus configuration with transmission outage severity. NERC continues to evaluate the impact of bus configuration on AC transmission outages through the use of advanced engineering methods and statistical analysis as well as to define additional data requirements necessary to perform this analysis. NERC recognizes that this is a complex subject and will continue to perform outreach to industry forums and subject matter experts.

Chapter 8 – Actions to Address Recommendations in Prior State of Reliability Reports
NERC | State of Reliability | May 2016 73
Table 8.3: Ongoing Recommendations
Item Reference
Finding Report
Year
Key Finding
Reference Key Finding Synopsis Actions Taken to Date
14 2015 Page 31
Paragraph 2
Transmission Related Events Resulting in Load Loss: Special Considerations for the metric (transmission related events resulting in load loss): The collected data does not indicate whether load loss during an event occurred as designed. Data collection will be refined in the future for this metric to allow enable data grouping into categories, such as separating load loss as designed from unexpected firm load loss. Also, differentiating between load losses as a direct consequence of an outage compared to load loss as a result of an operator-controlled action to mitigate an IROL/SOL exceedance should be considered.
NERC, the PAS, and the TADSWG are currently evaluating data collection and methods that may be enhanced to provide increased awareness of year-over-year trends when load loss occurs during transmission events. These efforts may include collaboration with IEEE and industry forums. This is included in the PAS annual reliability metrics review process.
15 2015 Page 32
Paragraph 1
System Voltage Performance: The ERSTF has recommended a measure that was approved by the Operating Committee (OC) and Planning Committee (PC) for data collection and testing, which may support development of new voltage and reactive support metrics going forward.
The ERSTF White Paper contained a proposed measure 7, which was assigned to the PAS to develop the necessary data collection processes to allow a test of measure 7 as a potential future voltage and reactive metric.
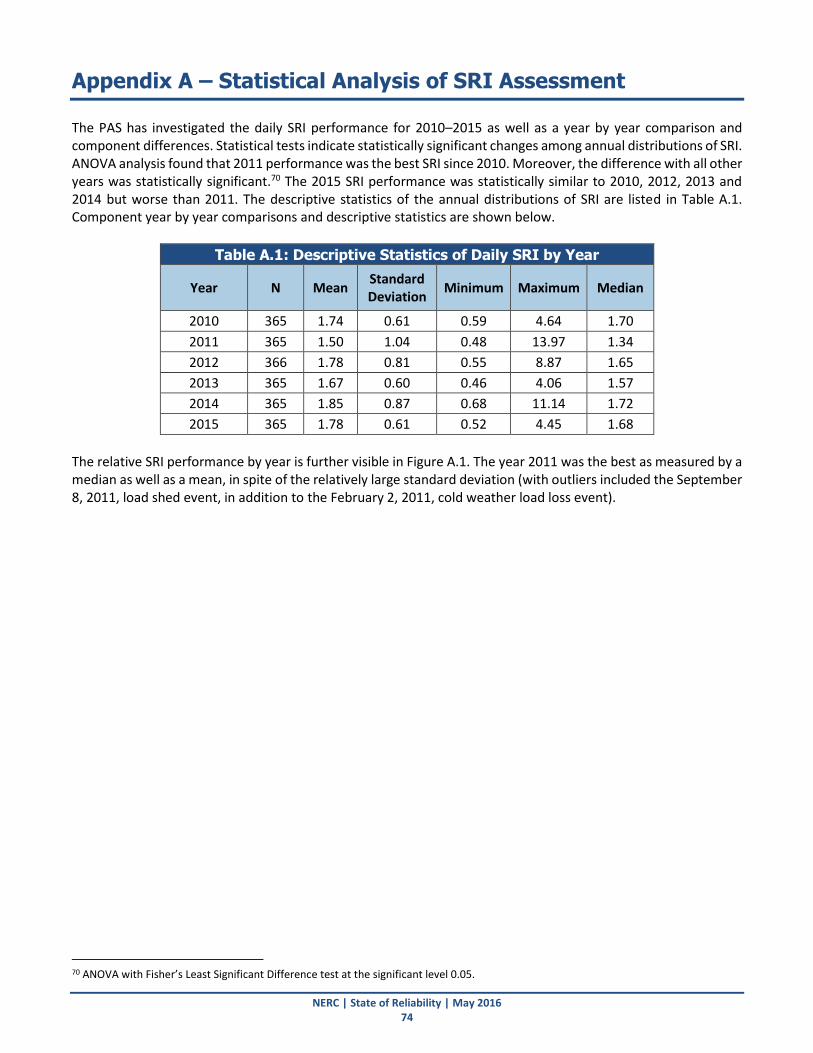
NERC | State of Reliability | May 2016 74
Appendix A – Statistical Analysis of SRI Assessment
The PAS has investigated the daily SRI performance for 2010–2015 as well as a year by year comparison and component differences. Statistical tests indicate statistically significant changes among annual distributions of SRI. ANOVA analysis found that 2011 performance was the best SRI since 2010. Moreover, the difference with all other years was statistically significant.70 The 2015 SRI performance was statistically similar to 2010, 2012, 2013 and 2014 but worse than 2011. The descriptive statistics of the annual distributions of SRI are listed in Table A.1. Component year by year comparisons and descriptive statistics are shown below.
Table A.1: Descriptive Statistics of Daily SRI by Year
Year N Mean Standard Deviation
Minimum Maximum Median
2010 365 1.74 0.61 0.59 4.64 1.70
2011 365 1.50 1.04 0.48 13.97 1.34
2012 366 1.78 0.81 0.55 8.87 1.65
2013 365 1.67 0.60 0.46 4.06 1.57
2014 365 1.85 0.87 0.68 11.14 1.72
2015 365 1.78 0.61 0.52 4.45 1.68
The relative SRI performance by year is further visible in Figure A.1. The year 2011 was the best as measured by a median as well as a mean, in spite of the relatively large standard deviation (with outliers included the September 8, 2011, load shed event, in addition to the February 2, 2011, cold weather load loss event).
70 ANOVA with Fisher’s Least Significant Difference test at the significant level 0.05.

Appendix A – Statistical Analysis of SRI Assessment
NERC | State of Reliability | May 2016 75
Figure A.1: Boxplot of SRI Distribution by Year
The performance of each year statistically compared to every other year is depicted in Table A.2 below. If no reference to statistical significance is made within the table, it is assumed to be statistically significant.71
Table A.2: Pairwise Comparison of SRI by Year
Compared to Year
Base Year 2011 2012 2013 2014 2015
2010 2011
Better
No Statistically Significant Difference
No Statistically Significant Difference
No Statistically Significant Difference
No Statistically Significant Difference
2011 2011 Better 2011 Better 2011 Better 2011 Better
2012 2013 Better No Statistically
Significant Difference
No Statistically Significant Difference
2013 2013 Better No Statistically
Significant Difference
2014 No Statistically
Significant Difference
Below, the analysis is repeated for all three components of the SRI.
71 At significance level 0.05.

Appendix A – Statistical Analysis of SRI Assessment
NERC | State of Reliability | May 2016 76
The descriptive statistics of the annual distributions of the generation component of the daily SRI are listed in Table A.3.
Table A.3: Descriptive Statistics of Generation SRI Component
Year N Mean Standard Deviation
Minimum Maximum Median
2010 365 1.03 0.34 0.29 2.67 1.01
2011 365 0.72 0.29 0.12 3.00 0.69
2012 366 1.12 0.36 0.30 2.92 1.08
2013 365 1.10 0.33 0.29 2.11 1.08
2014 365 1.29 0.72 0.43 9.80 1.16
2015 365 1.20 0.43 0.36 3.52 1.14
Statistical tests indicate statistically significant changes among annual distributions of the generation component of the daily SRI. ANOVA analysis shows that all pairwise annual differences in the average generation component values are statistically significant except between years 2012 and 2013. The relative performance of the generation component by year is further displayed in Figure A.2. 2011 was the best as measured by a median as well as a mean, and 2014 was the worst with the largest average, median, and the standard deviation of the generation component.

Appendix A – Statistical Analysis of SRI Assessment
NERC | State of Reliability | May 2016 77
Figure A.2: Boxplot of Distribution of Generation SRI Component by Year
The descriptive statistics of the annual distributions of the transmission component of the daily SRI are listed in Table A.4.
Table A.4: Descriptive Statistics of Transmission SRI Component
Year N Mean Standard Deviation
Minimum Maximum Median
2010 365 0.55 0.39 0.06 3.17 0.48
2011 365 0.55 0.38 0.03 3.53 0.46
2012 366 0.50 0.38 0.00 3.35 0.43
2013 365 0.42 0.32 0.00 2.20 0.33
2014 365 0.42 0.27 0.05 1.85 0.37
2015 365 0.45 0.32 0.03 2.43 0.38
Statistical tests indicate statistically significant changes among annual distributions of the transmission component of the daily SRI. ANOVA analysis shows that the years 2010, 2011, and 2012 were worse than the years

Appendix A – Statistical Analysis of SRI Assessment
NERC | State of Reliability | May 2016 78
2013, 2014, 2015. The first three years had not only statistically larger averages, but also larger medians and standard deviations then the latest three years. The relative performance of the transmission component by year is further illustrated by Figure A.3.
Figure A.3: Boxplot of Distribution of Transmission SRI Component by Year
The descriptive statistics of the annual distributions of the load loss component of the daily SRI are listed in Table A.5.
Table A.5: Descriptive Statistics of Load Loss SRI Component
Year N Mean Standard Deviation
Minimum Maximum Median
2010 365 0.16 0.18 0.00 1.62 0.11
2011 365 0.23 0.77 0.00 11.98 0.11
2012 366 0.17 0.35 0.00 4.88 0.08
2013 365 0.15 0.24 0.00 2.32 0.08
2014 365 0.14 0.25 0.00 3.59 0.07
2015 365 0.13 0.15 0.00 1.72 0.09

Appendix A – Statistical Analysis of SRI Assessment
NERC | State of Reliability | May 2016 79
Statistical tests indicated statistically significant changes among annual distributions of the load loss component of the daily SRI. ANOVA analysis showed that the year 2011 was the worst year with statistically significantly larger average daily load loss component than any other year. There were no significant differences between any other pairs of years. The relative performance of the load loss component by year is further illustrated by Figure A.4.
Figure A.4: Boxplot of Distribution of Load Loss Component of SRI by Year

Appendix A – Statistical Analysis of SRI Assessment
NERC | State of Reliability | May 2016 80
In Figure A.5, the daily performance of SRI is shown over the six-year history along with a time trend line.
Figure A.5: Scatter Plot for SRI 2010–2015 The time trend line has a statistically significant positive slope (p = 0.008). The same result can be drawn for the correlations analysis: on average, daily SRI is increasing over time (i.e., the hypothesis on a constant expected SRI over 2010–2015 cannot be accepted at 0.05 significance level). Statistical analysis of the seasonal performance reveals statistically significant differences in SRI by season. The fall SRI has the best performance, the summer SRI has the worst. Table A.6 shows the statistics by season based on the 2010–2015 data.
Table A.6: Descriptive Statistics of SRI by Season
Season N
SRI
Mean Standard Deviation
Minimum Maximum Median
Winter 542 1.67 0.92 0.49 11.14 1.49
Spring 552 1.66 0.54 0.46 5.78 1.61
Summer 550 2.07 0.69 0.69 8.87 1.98
Fall 547 1.48 0.80 0.48 13.97 1.38

Appendix A – Statistical Analysis of SRI Assessment
NERC | State of Reliability | May 2016 81
Statistical tests72 indicate that all differences in the seasonal expected SRI are statistically significant except those for winter and spring, which are illustrated in Figure A.6.
Figure A.6: Boxplot for SRI by Season 2010–2015
72ANOVA with Fisher’s Least Significant Difference test at the significant level 0.05.

NERC | State of Reliability | May 2016 82
Appendix B – Statistical Analysis of Transmission Data
Study Method Defining BPS Impact from Transmission Risk The SRI presented in Chapter 3 consists of several weighted risk impact components: generation, transmission, and load loss.73 The transmission outage impact component of the SRI is defined as wT × NT, where wT is a weighting factor of 30 percent and NT is the severity impact of a given day’s transmission outages on the BPS based on TADS outages. This appendix provides an analysis of the individual TADS events based on TADS outage ICCs. Equation B.1 is used to calculate the transmission outage severity component of a TADS event. The severity of a transmission outage is calculated based on its assumed contribution of power flow capacity through transmission circuits based on voltage class. The average power flow MVA values, or equivalent MVA values, used in Equation B.1, are shown in Table B.1. These equivalent MVA values are also applied to the denominator of the transmission outage severity equation to normalize the function. The TADS event severity is then analyzed by ICC to investigate relative information between the ICCs. For normalization, the total number of transmission circuits from the same year as the event is multiplied by each voltage class’s equivalent MVA value. For example, if an outage occurred in 2015, the normalization would use the total number of transmission circuits in 2015. This allows comparison of TADS events across years while taking into account the changing number of circuits within the BPS.
𝑇𝑟𝑎𝑛𝑠𝑚𝑖𝑠𝑠𝑖𝑜𝑛 𝑆𝑒𝑣𝑒𝑟𝑖𝑡𝑦 (𝑇𝐴𝐷𝑆 𝑒𝑣𝑒𝑛𝑡) = [∑ (𝐸𝑞𝑢𝑖𝑣𝑎𝑙𝑒𝑛𝑡 𝑀𝑉𝐴)𝐴𝐶 𝑐𝑖𝑟𝑐𝑢𝑖𝑡 𝑂𝑢𝑡𝑎𝑔𝑒𝑠 𝑖𝑛 𝐸𝑣𝑒𝑛𝑡
∑ (𝐸𝑞𝑢𝑖𝑣𝑎𝑙𝑒𝑛𝑡 𝑀𝑉𝐴)𝐴𝐶 𝑐𝑖𝑟𝑐𝑢𝑖𝑡 𝐼𝑛𝑣𝑒𝑛𝑡𝑜𝑟𝑦 𝐶𝑜𝑢𝑛𝑡𝑠] ∙ 1000
Equation B.1
Table B.1: Transmission Outage Severity Equivalent MVA Values
Voltage Class Equivalent MVA Value
100–199 kV 200
200–299 kV 700
300–399 kV 1300
400–599 kV 2000
600–799 kV 3000
Changes to the TADS Data Definition Beginning in 2015, the existing scope of TADS was expanded to include inventory and automatic outage data for power system elements below 200 kV. Two additional voltage classes were amended, namely, less than 100 kV and 100–199 kV. This reporting change was established through the NERC Rules of Procedure 1600 Data Request so that the TADS data collection would align with the implementation of the FERC approved BES definition74.
73 http://www.nerc.com/docs/pc/rmwg/pas/index_team/sri_equation_refinement_may6_2011.pdf, pp. 2-3. 74 http://www.nerc.com/pa/RAPA/Pages/BES.aspx

Appendix B – Statistical Analysis of Transmission Data
NERC | State of Reliability | May 2016 83
Also, for the calendar year 2015, non-automatic planned outage reporting was discontinued for the reasons stated in the Request for Public Comment on the Discontinuation of TADS Non-Automatic Planned Outage Data Collection.75 Although for the traditional voltage classes for 200 kV and above, non-automatic planned outage data continue to be collected. These are outages that occur for the purpose of avoiding an emergency (i.e., risk to human life, damage to equipment, damage to property) or to maintain the system within operational limits and that cannot be deferred. They also include non-automatic outages resulting from manual switching.76 While Momentary and Sustained Automatic Outage reporting for elements 200 kV+ remains unchanged, only Sustained Automatic Outages (i.e., those lasting 1 minute or longer) are reported for elements in the amended less than 100 kV and 100–199 kV voltage classes. No non-automatic outages (i.e., planned or operational) are reported for elements below 200 kV.
Impact of the TADS Data Collection Changes Changes to the TADS data collection as described above has an impact on existing metrics and provides the opportunity for expanded analysis. Table B.2 below illustrates the ac circuit data collected at the various voltage classes available to support outage metrics. For example, discontinuation of the non-automatic planned outage data no longer supports a total outage availability (or unavailability) metric. Sustained outages are the only common outages collected at all voltage classes above and below 200 kV.
Table B.2: TADS BES Outage Data Collection by AC Voltage Class (Effective Jan 1, 2015)
AC Voltage Class
Automatic Outages Non-Automatic Outages
Sustained Momentary Planned Operational
Below 100 kV Yes No No No
100–199 kV Yes No No No
200–299 kV Yes Yes No Yes
300–399 kV Yes Yes No Yes
400–599 kV Yes Yes No Yes
600–799 kV Yes Yes No Yes
Legend
Yes Outage data collected for this type of outage and voltage class
No Outage data not collected for this type of outage and voltage class
The extension of TADS data collection to 100–199 kV elements resulted in a substantial increase in the TADS inventory and number of outages. Based on the 2015 data, the 100–199 kV voltage class contributed the following:
~ 15,500 ac circuits (about 65 percent of the total ac circuits in TADS),
~ 218,500 total miles (about 48 percent of the total ac circuit miles), and
75 http://www.nerc.com/comm/PC/Transmission%20Availability%20Data%20System%20Working%20Grou/Planned_Outage_Removal_Data_Request_Letter_and_Data_Request.pdf 76 http://www.nerc.com/pa/RAPA/tads/Key_TADS_Documents/2016_TADS_Definitions-Appendix_7.pdf

Appendix B – Statistical Analysis of Transmission Data
NERC | State of Reliability | May 2016 84
~ 5700 automatic outages of ac circuits (59 percent of the total automatic outages of ac circuits). In the study cases 1–4 described below, TADS events associated with automatic outages on ac circuits 200 kV+ are analyzed for the period 2012–2015. An overview of the 2015 TADS events associated with the sustained automatic outages on ac circuits 100–199 kV is provided in study 5. Study 6 analyzes 2015 sustained outages of 100 kV+. Note that the Less than 200 kV sustained automatic outage data set was not included in study cases 1–4 to allow for a valid year-over-year comparative analysis of the 200 kV+ data set for the years 2012–2015. In summary, the following six study cases were analyzed for TADS data sets described above. The results of the six studies follow in Appendix B:
1. 200 kV+ TADS events (momentary and sustained),
2. 200 kV+ common or dependent-mode (CDM) events that resulted in multiple transmission element outages,
3. 200 kV+ TADS events that resulted in sustained outages,
4. 200 kV+ TADS events (momentary and sustained) by Region,
5. 100–199 kV sustained 2015 TADS events,
6. 100 kV+ sustained 2015 outages analyzed by SCC. It is important to point out that even though the cases 1–4 above do not include the 100–199 kV ac circuits, a denominator of the Equation B.1 for the transmission outage severity for all 2015 TADS events includes these circuits as a part of the complete ac circuit inventory of that year. Therefore, any year-over-year analysis of the transmission outage severity should take into account the inventory change in 2015 to avoid incorrect conclusions about transmission outage severity trends.
Determining Initiating Causes and Modification Method TADS collects automatic outages77 and operational outages.78 A TADS event is a transmission incident that results in the automatic outage (sustained or momentary) of one or more elements. TADS events are categorized by ICCs. These ICCs facilitate the study of cause-effect relationships between each event’s ICC and event severity. The procedure illustrated in Figure B.1 is used to determine a TADS event’s ICC. The procedure that defines ICCs for a TADS event allows ICC assignment to a majority of transmission outage events recorded in TADS.
Figure B.1: TADS Event Initiating Cause Code Selection Procedure
77 An outage that results from the automatic operation of a switching device, causing an element to change from an in‐service state to a not in‐service state. Single‐pole tripping followed by successful ac single‐pole (phase) reclosing is not an Automatic Outage. 78 A Non‐Automatic Outage for the purpose of avoiding an emergency (i.e., risk to human life, damage to equipment, damage to property) or to maintain the system within operational limits and that cannot be deferred. Includes Non‐Automatic Outages resulting from manual switching errors.
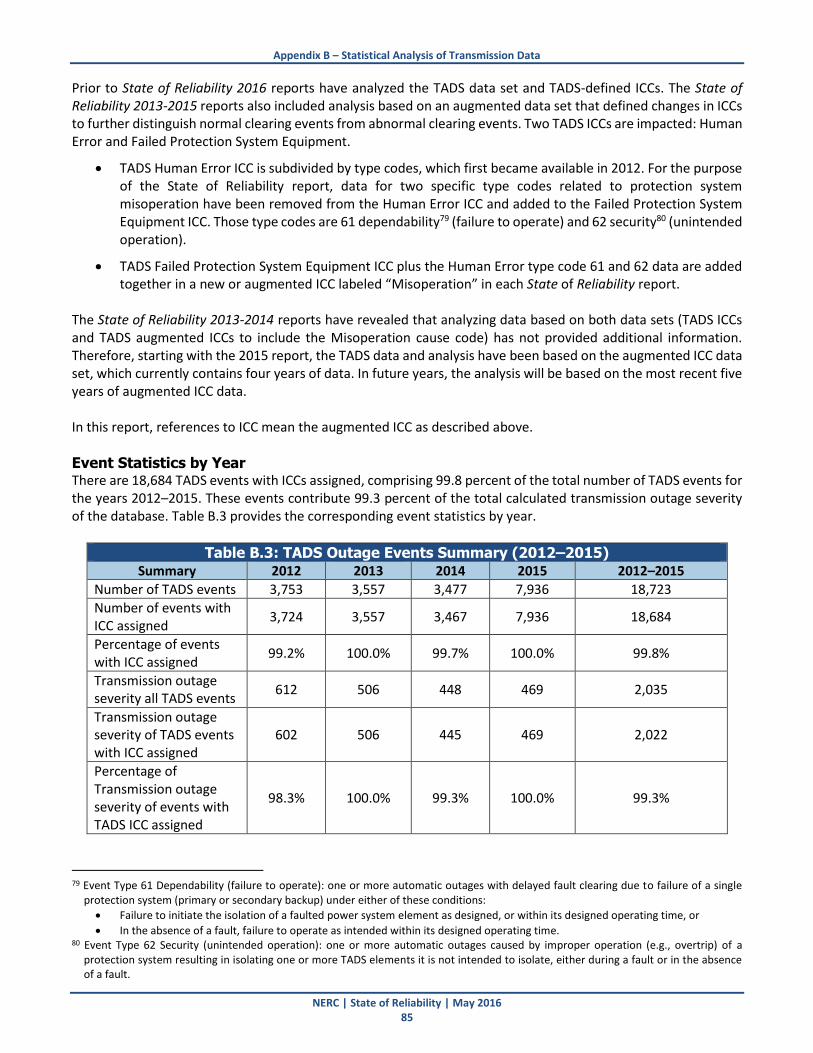
Appendix B – Statistical Analysis of Transmission Data
NERC | State of Reliability | May 2016 85
Prior to State of Reliability 2016 reports have analyzed the TADS data set and TADS-defined ICCs. The State of Reliability 2013-2015 reports also included analysis based on an augmented data set that defined changes in ICCs to further distinguish normal clearing events from abnormal clearing events. Two TADS ICCs are impacted: Human Error and Failed Protection System Equipment.
TADS Human Error ICC is subdivided by type codes, which first became available in 2012. For the purpose of the State of Reliability report, data for two specific type codes related to protection system misoperation have been removed from the Human Error ICC and added to the Failed Protection System Equipment ICC. Those type codes are 61 dependability79 (failure to operate) and 62 security80 (unintended operation).
TADS Failed Protection System Equipment ICC plus the Human Error type code 61 and 62 data are added together in a new or augmented ICC labeled “Misoperation” in each State of Reliability report.
The State of Reliability 2013-2014 reports have revealed that analyzing data based on both data sets (TADS ICCs and TADS augmented ICCs to include the Misoperation cause code) has not provided additional information. Therefore, starting with the 2015 report, the TADS data and analysis have been based on the augmented ICC data set, which currently contains four years of data. In future years, the analysis will be based on the most recent five years of augmented ICC data. In this report, references to ICC mean the augmented ICC as described above.
Event Statistics by Year There are 18,684 TADS events with ICCs assigned, comprising 99.8 percent of the total number of TADS events for the years 2012–2015. These events contribute 99.3 percent of the total calculated transmission outage severity of the database. Table B.3 provides the corresponding event statistics by year.
Table B.3: TADS Outage Events Summary (2012–2015) Summary 2012 2013 2014 2015 2012–2015
Number of TADS events 3,753 3,557 3,477 7,936 18,723
Number of events with ICC assigned
3,724 3,557 3,467 7,936 18,684
Percentage of events with ICC assigned
99.2% 100.0% 99.7% 100.0% 99.8%
Transmission outage severity all TADS events
612 506 448 469 2,035
Transmission outage severity of TADS events with ICC assigned
602 506 445 469 2,022
Percentage of Transmission outage severity of events with TADS ICC assigned
98.3% 100.0% 99.3% 100.0% 99.3%
79 Event Type 61 Dependability (failure to operate): one or more automatic outages with delayed fault clearing due to failure of a single
protection system (primary or secondary backup) under either of these conditions:
Failure to initiate the isolation of a faulted power system element as designed, or within its designed operating time, or
In the absence of a fault, failure to operate as intended within its designed operating time. 80 Event Type 62 Security (unintended operation): one or more automatic outages caused by improper operation (e.g., overtrip) of a
protection system resulting in isolating one or more TADS elements it is not intended to isolate, either during a fault or in the absence of a fault.

Appendix B – Statistical Analysis of Transmission Data
NERC | State of Reliability | May 2016 86
The increased number of events in 2015 reflects the changes in TADS data collection and includes sustained outages of the 100–199 kV ac circuits. For comparison, in 2012–2014, a TADS event in North America started, on average, every two hours and 26 minutes, while in 2015 a TADS event started, on average, every one hour and six minutes because more events have become reportable. The total transmission outage severity of all TADS events, however, did not increase dramatically in 2015. This is because of the denominator in Equation B.1 increased due to the 2015 inventory increase and because events on 100–199 kV ac circuits have a smaller transmission outage severity contribution when compared with other events (as reflected by equivalent MVA values in Table B.1).
Study 1: TADS Sustained and Momentary Events for 200 kV+ AC Circuits Events with Common ICC by Year and Estimates of Event Probability Table B.4 lists annual counts and hourly event probability of TADS events by ICC. The ICCs with the largest number of events are Lightning, Unknown, Weather excluding Lightning, Misoperation, Failed AC Circuit Equipment, and Failed AC Substation Equipment. These ICC groups combined amount to 76 percent of TADS events for 200 kV+ for the most recent four years. Almost all TADS ICC groups have sufficient data available to be used in a statistical analysis. Only three ICCs (Vegetation; Vandalism, Terrorism, or Malicious Acts; and Environmental) do not have sufficient size for reliable statistical inferences. Therefore, these ICC groups are combined into a new group, named “Combined Smaller ICC Groups,” that can be statistically compared to every other group and also studied with respect to annual changes of transmission outage severity. With the development of the transmission outage severity measure and TADS event ICCs, it is possible to statistically analyze the most recent four years of TADS data (2012–2015). For TADS events initiated by a common cause, the probability81 of observing the initiation of an event during a given hour is estimated using the corresponding historical event occurrences reported in TADS. Namely, the event occurrence probability is the total number of occurrences for a given type of event observed during the historical data period divided by the total number of hours in the same period. Therefore, the sum of the estimated probabilities for all events is equal to the estimated probability of any event during a given hour.
Table B.4: TADS 200 kV+ Events and Hourly Event Probability by ICC (2012–2015)
Initiating Cause Code 2012 2013 2014 2015 2012–2015
Event Initiation Probability/Hour
Lightning 852 813 709 783 3157 0.090
Unknown 710 712 779 830 3,031 0.086
Weather excluding Lightning 446 433 441 498 1,818 0.052
Misoperation 321 281 314 165 1,081 0.031
Failed AC Circuit Equipment 261 248 224 255 988 0.028
Failed AC Substation Equipment 248 191 223 221 883 0.025
Foreign Interference 170 181 226 274 851 0.024
Human Error (w/o Type 61 OR Type 62)
212 191 149 132 684 0.020
Contamination 160 151 149 154 614 0.018
81 Probability is estimated using event occurrence frequency of each ICC type without taking into account the event duration.

Appendix B – Statistical Analysis of Transmission Data
NERC | State of Reliability | May 2016 87
Table B.4: TADS 200 kV+ Events and Hourly Event Probability by ICC (2012–2015)
Initiating Cause Code 2012 2013 2014 2015 2012–2015
Event Initiation Probability/Hour
Power System Condition 77 109 83 96 365 0.010
Fire 106 130 44 65 345 0.010
Other 104 64 77 77 322 0.009
Combined Smaller ICC groups 57 53 49 37 196 0.006
Vegetation 43 36 39 32 150 0.004
Vandalism, Terrorism, or Malicious Acts
10 9 8 1 28 0.001
Environmental 4 8 2 4 18 0.001
All with ICC assigned 3,724 3,557 3,467 3,587 14,335 0.409
All TADS Events 3,753 3,557 3,477 3,587 14,374 0.410
Determining Relative Risk The process of the statistical analysis performed to identify top causes to transmission risk is demonstrated in Figure B.2. After completing Step 1 (quantifying an event impact by transmission outage severity) and Step 2 (assigning ICC’s to TADS events), NERC staff determined in Step 3 the correlation between each ICC and transmission outage severity. Statistically significant relationships between several ICC’s and transmission outage severity were then determined. Sample distributions were also studied to determine any statistically significant pair-wise differences in expected transmission outage severity between ICCs, including a time trend analysis where applicable. At Step 4 the relative risk was calculated for each ICC group and then ranked by risk to the transmission system.
Figure B.2: Risk Identification Method To study the relationship between ICCs and the transmission outage severity for TADS events, NERC investigated the statistical significance of the correlation between transmission outage severity and the indicator function82 of
82 The indicator function of a given ICC assigns value 1 to an event with this ICC and value 0 to the rest of the events.
Appendix B – Statistical Analysis of Transmission Data
NERC | State of Reliability | May 2016 88
a given ICC.83 The test is able to determine a statistically significant positive or negative correlation between ICC and transmission outage severity. Distributions of transmission outage severity for the entire dataset were examined separately for events with a given ICC. A series of t-tests84 were performed to compare the expected transmission outage severity of a given ICC with the expected outage severity of the rest of the events at significance level of 0.05. Then, the Fisher’s Least Square Difference85 method was applied to determine statistically significant86 differences in the expected transmission outage severity for all pairs of ICCs. Statistically significant differences in the expected transmission outage severity for each ICC group were analyzed for each year of data. This showed if the average transmission outage severity for a given ICC group had changed over time. The relative risk was calculated for each ICC group. The impact of an outage event was defined as the expected transmission outage severity associated with a particular ICC group. The probability that an event from a given group initiates during a given hour is estimated from the frequency of the events of each type without taking into account the event duration. The risk per hour of a given ICC was calculated as the product of the probability per hour and the expected severity (impact) of an event from this group. The relative risk was then defined as the percentage of the risk associated with each ICC out of the total (combined for all ICC events) risk per hour. The risk profiles of TADS events initiated by common causes are visualized as bubble charts that summarize results of correlational, distributional, and risk ranking analyses.
Correlation between ICC and Transmission Outage Severity To study a relationship between ICC and transmission outage severity of TADS events, the statistical significance of the correlation between transmission outage severity and the indicator function87 of a given ICC was investigated.88 A statistically significant positive or negative correlation between ICC and transmission outage severity could be determined by the statistical test. There were three key outcomes of all the tests as stated below:
A statistically significant positive correlation of ICC to transmission outage severity indicates a greater likelihood that an event with this ICC would result in a higher transmission outage severity.
A significant negative correlation indicates the contrary; in this case, a lower transmission outage severity would be likely.
If no significant correlation is found, it indicates the absence of a linear relationship between ICC and the transmission outage severity, and that the events with this ICC have an expected transmission outage severity similar to all other events from the database.
83 For each ICC, a null statistical hypothesis on zero correlation at significance level 0.05 was tested. If the test resulted in rejection of the
hypothesis, it is concluded that a statistically significant positive or negative correlation between an ICC and transmission severity exists; the failure to reject the null hypothesis indicates no significant correlation between ICC and transmission severity.
84 For t-test, see D. C. Montgomery and G. C. Runger, Applied Statistics and Probability for Engineers. Fifth Edition. 2011. John Wiley & Sons. Pp. 361-369.
85 For Fisher’s Least Significance Difference (LSD) method or test, see D. C. Montgomery and G. C. Runger, Applied Statistics and Probability for Engineers. Fifth Edition. 2011. John Wiley & Sons. Pp. 524-526.
86 At significance level of 0.05. 87 The indicator function of a given ICC assigns value 1 to an event with this ICC and value 0 to the rest of the events. 88 For each ICC, a null statistical hypothesis on zero correlation at significance level 0.05 was tested. If the test resulted in rejection of the
hypothesis, it is concluded that a statistically significant positive or negative correlation between an ICC and transmission outage severity exists; the failure to reject the null hypothesis indicates no significant correlation between ICC and transmission outage severity.

Appendix B – Statistical Analysis of Transmission Data
NERC | State of Reliability | May 2016 89
Figure B.3 shows the correlations between calculated transmission outage severity and the given ICC. A red bar corresponds to an ICC with statistically significant positive correlation with transmission outage severity, a green bar corresponds to an ICC with statistically significant negative correlation, and a blue bar indicates no significant correlation. Thus, Misoperation, Failed AC Substation Equipment, Power System Condition, and Human Error have statistically significant positive correlation with transmission outage severity. The expected severity of events with each of these ICCs is greater than the expected severity of other ICC events. Secondly, Foreign Interference, Unknown, Weather excluding Lightning, Combined Smaller ICC Groups and Failed AC Circuit Equipment have a statistically significant negative correlation with transmission outage severity. The expected severity of events initiated by these causes is less than the expected transmission outage severity of other TADS events. Events with each of the ICCs with blue bars have the expected transmission outage severity similar to all other events in TADS.
Figure B.3: Correlation between ICC and Transmission Outage Severity of 200 kV+ TADS
Events (2012–2015)
Distribution of Transmission Outage Severity by ICC The distribution of transmission outage severity was studied separately for events with a given ICC and the complete dataset. The transmission outage severity of the 2012–2015 TADS events (200 kV+ data set) has a sample

Appendix B – Statistical Analysis of Transmission Data
NERC | State of Reliability | May 2016 90
mean of 0.135 and a sample standard deviation of 0.09. The sample statistics for transmission outage severity are listed in Table B.5 with the ICCs ordered from the largest average transmission outage severity to the smallest. A series of the Fisher’s Least Square Difference tests confirms that the groups of events initiated by Misoperation, Power System Condition, Failed AC Substation Equipment and Human Error have statistically89 greater expected severity than other events. It means that when an event initiated by one of these causes occurs, on average it has a greater impact and a higher risk to the transmission system. Moreover, the tests on homogeneity of variances highlights statistically greater variances (and the standard deviations) for each of these groups as compared with other events. The greater variance is an additional risk factor since it implies more frequent occurrences of events with high transmission outage severity. Table B.5 also provides a column that lists ICCs that are statistically less than a given ICC referenced by the table’s initial column index. For example, Power System Condition, Misoperation, and Failed AC Substation Equipment initiate events with statistically larger transmission outage severity than any other ICC starting with Human Error. However, pairwise differences between the three top groups are not significant, meaning that an individual impact of events from these groups are similar.
Table B.5: Distribution of Transmission Outage Severity (TS) of 200 kV+ Events by ICC (2012–2015)
No. Initiating Cause Code (ICC) Average
TS
Is Expected TS statistically significantly
different than for other events?
ICC with statistically significantly smaller
average TS
Standard Deviation
of TS
1 Misoperation 0.162 Larger 4,5,6,7,8,9,10,11,12,13 0.13
2 Power System Condition 0.159 Larger 4,5,6,7,8,9,10,11,12,13 0.14
3 Failed AC Substation Equipment 0.157 Larger 4,5,6,7,8,9,10,11,12,13 0.11
4 Human Error (w/o Type 61 OR Type 62)
0.145 Larger 7,9,10,11,12,13 0.10
5 Fire 0.143 No 9,10,11,12,13 0.08
6 Contamination 0.139 No 9,10,11,12,13 0.07
7 Lightning 0.136 No 9,10,11,12,13 0.08
8 Other 0.136 No 11,12,13 0.10
All events 0.135 N/A N/A 0.09
All with ICC assigned 0.135 N/A N/A 0.09
9 Failed AC Circuit Equipment 0.128 Smaller 12,13 0.08
10 Unknown 0.126 Smaller 12,13 0.07
11 Weather excluding Lightning 0.124 Smaller 12,13 0.07
12 Foreign Interference 0.110 Smaller none 0.06
13 Combined Smaller ICC groups 0.110 Smaller none 0.05
89 At significance level 0.05

Appendix B – Statistical Analysis of Transmission Data
NERC | State of Reliability | May 2016 91
Average Transmission Outage Severity by ICC: Annual Changes Year-over-year changes in calculated transmission outage severity for 200 kV+ TADS events by ICC are reviewed next. Figure B.4 shows changes in the average transmission outage severity for each ICC for the 2012–2015 dataset. The groups of ICC events are listed from left to right by descending average transmission outage severity for the four years. The largest average transmission outage severity over the data period was observed for events initiated by Misoperation.
Figure B.4: Average Transmission Outage Severity of 200 kV+ TADS Events by ICC and
Year (2012–2015) The noticeable decrease in the average transmission outage severity in 2015 for all ICC groups (shown in Figure B.4) was due to a larger ac circuit inventory and, therefore, to a larger total MVA of the ac circuit inventory which is a denominator in the formula for the transmission outage severity of a TADS event (Equation B.1). A fair comparison and a valid year-to-year analysis can be performed when 2016 data is available and compared with the 2015 data. Figure B.5 shows the 2015 average transmission outage severity by ICC. ICC groups are listed by decreasing average transmission outage severity from left to right. The ICC group Power System Condition is top-ranked, followed closely by Failed AC Substation Equipment. Power System Condition is defined as “automatic outages caused by power system conditions such as instability, overload trip, out‐of‐step, abnormal voltage, abnormal frequency, or unique system configurations (e.g., an abnormal terminal configuration due to existing condition with one breaker already out of service).”

Appendix B – Statistical Analysis of Transmission Data
NERC | State of Reliability | May 2016 92
Figure B.5: 2015 Average Transmission Outage Severity of 200 kV+ TADS Events by ICC
ICC Misoperation has the highest average transmission outage severity over the four-year period, but in 2015 it ranks third. Statistically, there is no significant difference in the expected severity of events initiated by Misoperation and events from the top groups including Power System Condition to Contamination.
Transmission Outage Severity Risk and Relative Risk of TADS Events by ICC The risk of each ICC group can be defined as the total transmission outage severity associated with this group. Its relative risk is equal to the percentage of the group transmission outage severity in the 2012–2015 database. Equivalently, the risk of a given ICC per hour can be defined as the product of the probability that an event with this ICC initiates during an hour and the expected severity (impact) of an event from this group. For any ICC group, the relative risk per hour is the same as the relative risk for a year (or any other time period) if estimated from the same dataset. Relative risk of the 2012–2015 TADS events by ICC is listed in Table B.6. The probability that an event from a given ICC group initiated during a given hour is estimated from the frequency of the events of each type without taking into account the event duration. Excluding weather-related events and events with unknown ICCs, events initiated by Misoperation and by Failed AC Substation Equipment had the largest shares in the total transmission outage severity and contributed 9 percent and 7.1 percent, respectively, to transmission outage severity relative risk for the most recent four years. Power System Condition has a low rank despite having the second largest average transmission outage severity of an individual event. This is because there are a small number of events with this ICC and the occurrences of these events are rare (as reflected by their small probability).

Appendix B – Statistical Analysis of Transmission Data
NERC | State of Reliability | May 2016 93
Table B.6: Relative Risk of TADS 200 kV+ by ICC (2012–2015)
Group of TADS events
Probability that an event from a group
starts during a given hour
Expected Impact
(expected transmission
outage severity of an event)
Risk associated
with a group per
hour
Relative Risk by group
All TADS events 200 kV+ 0.410 0.135 0.0554 100.0%
All 200 kV+ with ICC assigned 0.409 0.135 0.0550 99.3%
Lightning 0.090 0.136 0.0123 22.2%
Unknown90 0.086 0.126 0.0109 19.7%
Weather excluding Lightning 0.052 0.124 0.0064 11.6%
Misoperation 0.031 0.162 0.0050 9.0%
Failed AC Substation Equipment 0.025 0.157 0.0039 7.1%
Failed AC Circuit Equipment 0.028 0.128 0.0036 6.5%
Human Error (w/o Type 61 OR Type 62)
0.020 0.145 0.0028 5.1%
Foreign Interference 0.024 0.110 0.0027 4.8%
Contamination 0.018 0.139 0.0024 4.4%
Power System Condition 0.010 0.159 0.0017 3.0%
Fire 0.010 0.143 0.0014 2.5%
Other 0.009 0.136 0.0012 2.3%
Combined Smaller ICC groups 0.006 0.110 0.0006 1.1%
Figure B.6 shows year-over-year changes in the relative risk of TADS events by ICC. The groups of ICC events are listed from left to right by descending relative risk for the most recent four years. The top-three contributors to transmission risk—Lightning, Unknown, and Weather excluding Lightning, had an increase in relative risk in 2015 as well as the number and frequency of events. The relative risk of Misoperation was reduced by more than by half, from 11.1 percent in 2014 to 5.3 percent, shown percent in 2015. Table B.4 shows that the number of events initiated by Misoperation significantly decreased in 2015, causing a significant drop in their combined transmission outage severity and the relative risk of the ICC. Relative risk increased for some ICC groups: Failed AC Circuit Equipment, Foreign Interference, and Fire. The Human Error group had a reduced risk, and other ICC groups remained the same.
90 In addition to the efforts by NERC, the North American Transmission Forum (NATF) has been working with their membership to review, analyze, and better understand outages coded as Unknown. The goal of this work is to reduce the overall percent of Unknown outages. NATF facilitates this primarily through their Outage Data Reporting Guidelines and Interpretations document and ongoing education to promote consistent cause code and sub-cause code assignments. The increased consistency in coding is a major factor in reducing Unknown outages. In addition, the use of sub-cause codes garners further understanding of the outages coded as Unknown by indicating the level of investigation and weather associated with those outages. Focused outreach and education has been made to members with higher Unknown outage rates, resulting in an overall decline in those rates for the NATF membership.
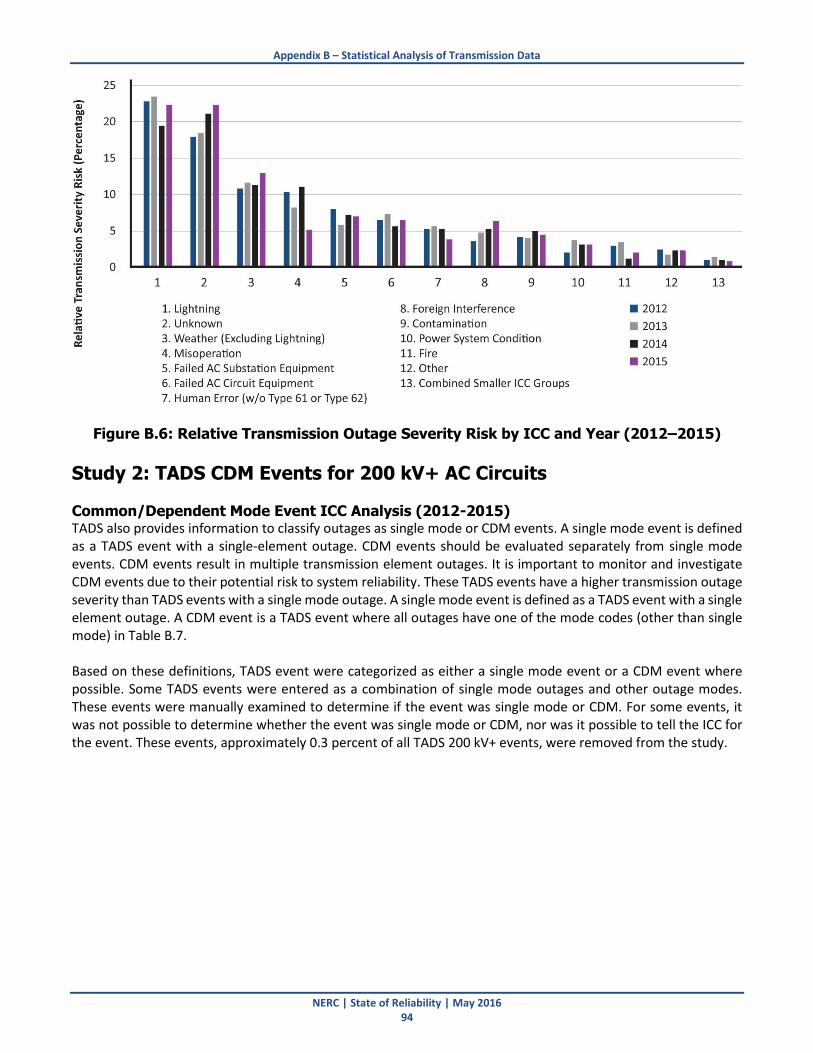
Appendix B – Statistical Analysis of Transmission Data
NERC | State of Reliability | May 2016 94
Figure B.6: Relative Transmission Outage Severity Risk by ICC and Year (2012–2015)
Study 2: TADS CDM Events for 200 kV+ AC Circuits
Common/Dependent Mode Event ICC Analysis (2012-2015) TADS also provides information to classify outages as single mode or CDM events. A single mode event is defined as a TADS event with a single-element outage. CDM events should be evaluated separately from single mode events. CDM events result in multiple transmission element outages. It is important to monitor and investigate CDM events due to their potential risk to system reliability. These TADS events have a higher transmission outage severity than TADS events with a single mode outage. A single mode event is defined as a TADS event with a single element outage. A CDM event is a TADS event where all outages have one of the mode codes (other than single mode) in Table B.7. Based on these definitions, TADS event were categorized as either a single mode event or a CDM event where possible. Some TADS events were entered as a combination of single mode outages and other outage modes. These events were manually examined to determine if the event was single mode or CDM. For some events, it was not possible to determine whether the event was single mode or CDM, nor was it possible to tell the ICC for the event. These events, approximately 0.3 percent of all TADS 200 kV+ events, were removed from the study.

Appendix B – Statistical Analysis of Transmission Data
NERC | State of Reliability | May 2016 95
Table B.7: Outage Mode Codes
Outage Mode Code Automatic Outage Description
Single Mode A single-element outage that occurs independently of another automatic outage
Dependent Mode Initiating A single-element outage that initiates at least one subsequent element automatic outage
Dependent Mode An automatic outage of an element that occurred as a result of an initiating outage, whether the initiating outage was an element outage or a non-element outage
Common Mode One of at least two automatic outages with the same initiating cause code where the outages are not consequences of each other and occur nearly simultaneously
Common Mode Initiating A common-mode outage that initiates one or more subsequent automatic outages
Table B.8 lists numbers of CDM events by ICC for 2012–2015. Lightning initiated the largest number of CDM events, followed by Misoperation and Failed AC Substation Equipment. There was a total of 2,162 CDM events defined with 2,125 of these assigned to one of the 15 ICCs. Table B.8 shows the reciprocal of the CDM probability/hour of 0.062 predicts that in NERC’s defined BES system of 200 kV+ facilities a CDM event started, on average, every 16 hours and 36 minutes. CDM events are a subset of the TADS events previously evaluated in Study 1 and comprise 15 percent of all TADS 200 kV+ events from 2012–2015. Table B.8 provides the population percentage of CDM events in the different ICC groups. These percentages vary greatly. There are only 4.2 percent of CDM events among events initiated by Contamination while the 41.4 percent of events initiated by Power System Condition are CDM events. Annual datasets of CDM events do not have enough observations to track statistically significant year-over-year changes in transmission outage severity. Upon combining the three smallest ICC groups (Vegetation; Environmental; and Vandalism, Terrorism, or Malicious Acts) into a new group (Combined Smaller ICC groups), the four-year ICC groups are used for the correlation analysis. Out of all ICCs, only Foreign Interference has a statistically significant (negative) correlation with the indicator of transmission outage severity. The transmission outage severity by ICC is analyzed and the distributions of transmission outage severity by ICC are statistically compared. The sample statistics for transmission outage severity by ICC are listed in Table B.9 (same format as Table B.5). The transmission outage severity of the 2012–2015 CDM events of the 200 kV+ has a sample mean of 0.205 and a sample deviation of 0.16 shown in the highlighted row. The mean transmission outage severity is greater than the 0.0135 for all 200 kV+ TADS events in Table B.5 which is not surprising since CDM events involve multiple outages.

Appendix B – Statistical Analysis of Transmission Data
NERC | State of Reliability | May 2016 96
Table B.8: CDM Events 200 kV+ and Hourly Event Probability by ICC (2012–2015)
Initiating Cause Code CDM
events
TADS events
200 kV+
CDM as % of ALL
CDM Event Initiation Probability/Hour
Lightning 359 3,157 11.4% 0.010
Misoperation 350 1,081 32.4% 0.010
Failed AC Substation Equipment 323 883 36.6% 0.009
Unknown 198 3,031 6.5% 0.006
Weather excluding Lightning 170 1,818 9.4% 0.005
Power System Condition 151 365 41.4% 0.004
Human Error (w/o Type 61 OR Type 62) 148 684 21.6% 0.004
Failed AC Circuit Equipment 142 988 14.4% 0.004
Foreign Interference 99 851 11.6% 0.003
Other 94 322 29.2% 0.003
Fire 45 345 13.0% 0.001
Contamination 26 614 4.2% 0.001
Combined Smaller ICC groups 20 196 10.2% 0.001
Vegetation 10 150 6.7% 0.0003
Environmental 6 28 21.4% 0.0002
Vandalism, Terrorism, or Malicious Acts 4 18 22.2% 0.0001
with ICC assigned 2,125 14,335 14.8% 0.061
TADS events 2,162 14,374 15.0% 0.062
A series of the Fisher’s Least Square Difference tests determined there were few statistically significant differences in the average transmission outage severity between ICC groups. These results reflect less variability between ICC groups for CDM events than for all events, considering the relatively small sample sizes for some groups (as shown in Table B.8). Only events initiated by Foreign Interference and events from smaller groups have, on average, statistically different (smaller) transmission outage severity than overall CDM events. Table B.9 provides a column that lists ICCs that are statistically less than a given ICC referenced by the table’s initial column index. For example, Contamination, Human Error, and Lightning initiate events with statistically larger transmission outage severity than ICC Foreign Interference or Combined Smaller ICC groups.

Appendix B – Statistical Analysis of Transmission Data
NERC | State of Reliability | May 2016 97
Table B.9: Distribution of Transmission Outage Severity (TS) of 200 kV+ CDM Events by ICC (2012–2015)
No. Initiating Cause Code (ICC) Average
TS
Is Expected TS statistically significantly
different than for other events?
ICC with statistically significantly
smaller average TS
Standard Deviation of
TS
1 Contamination 0.246 No 12,13 0.197
2 Human Error (w/o Type 61 OR Type 62)
0.215 No 12,13 0.165
3 Lightning 0.213 No 12,13 0.145
4 Fire 0.210 No 13 0.139
5 Power System Condition 0.209 No 13 0.193
6 Misoperation 0.207 No 13 0.201
CDM events 0.205 N/A N/A 0.160
7 Unknown 0.204 No 13 0.143
8 Failed AC Circuit Equipment 0.204 No 13 0.137
CDM with ICC assigned 0.203 N/A N/A 0.159
9 Failed AC Substation Equipment 0.201 No 13 0.153
10 Weather excluding Lightning 0.199 No 13 0.134
11 Other 0.179 No none 0.152
12 Foreign Interference 0.149 Smaller none 0.096
13 Combined Smaller ICC groups 0.140 Smaller none 0.058

Appendix B – Statistical Analysis of Transmission Data
NERC | State of Reliability | May 2016 98
The overall transmission risk and relative risk by ICC group for CDM events were calculated and ranked. Table B.10 provides a breakdown of relative risk of CDM events by ICC group.
Table B.10: Evaluation of 200 kV+ CDM Event ICC Contribution to Transmission Outage Severity (2012–2015)
Group of TADS events
Probability that an event from a group starts during a given
hour
Expected Impact (expected
transmission outage severity of
an event)
Risk associated
with a group per hour
Relative Risk by group
All TADS 200 kV+ 0.410 0.135 0.055 100.0%
CDM events 0.062 0.205 0.013 22.8%
CDM with ICC assigned 0.061 0.203 0.012 22.2%
Lightning 0.010 0.213 0.002 3.9%
Misoperation 0.010 0.207 0.002 3.7%
Failed AC Substation Equipment 0.009 0.201 0.002 3.3%
Unknown 0.006 0.204 0.001 2.1%
Weather excluding Lightning 0.005 0.199 0.001 1.7%
Human Error (w/o Type 61 OR Type 62)
0.004 0.215 0.001 1.6%
Power System Condition 0.004 0.209 0.001 1.6%
Failed AC Circuit Equipment 0.004 0.204 0.001 1.5%
Other 0.003 0.179 0.0005 0.9%
Foreign Interference 0.003 0.149 0.0004 0.8%
Fire 0.001 0.210 0.0003 0.5%
Contamination 0.001 0.246 0.0002 0.3%
Combined Smaller ICC groups 0.001 0.140 0.0001 0.1%
Analysis of the TADS CDM events indicated that events with ICCs of Misoperation and Failed AC Substation Equipment are the two largest contributors to transmission outage severity with the exception of lightning-initiated events. Still, there is no significant correlation between these ICCs and the transmission outage severity.
Study 3: TADS Sustained Events of 200 kV+ Sustained Event ICC analysis (2012–2015) TADS provides information to classify automatic outages as momentary or sustained.91 A Momentary Outage is defined as an automatic outage with an outage duration less than one minute. If the circuit recloses and trips again within less than a minute of the initial outage, it is only considered one outage. The circuit would need to remain in service for longer than one minute between the breaker operations to be considered two outages.
91 http://www.nerc.com/pa/RAPA/tads/Pages/default.aspx.

Appendix B – Statistical Analysis of Transmission Data
NERC | State of Reliability | May 2016 99
A Sustained Outage92 is defined as an automatic outage with an outage duration of a minute or greater. The definition of Sustained Outage has been extended to a TADS event with duration of a minute or greater. It is important to monitor and investigate sustained outages and sustained events due to their potential risk to system reliability. Since outage duration is not included in the definition of transmission outage severity (Equation B.1), NERC separately studies the transmission outage severity of sustained events for 200 kV+ elements by ICC.
Table B.11: Sustained Events 200 kV+ and Hourly Event Probability by ICC (2012–2015)
Initiating Cause Code Sustained
events ALL TADS
events Sustained
as % of ALL Sustained Event Initiation
Probability/Hour
Unknown 1,203 3,031 39.7% 0.034
Weather excluding Lightning 1,139 1,818 62.7% 0.032
Lightning 932 3,157 29.5% 0.027
Misoperation 808 1,081 74.7% 0.023
Failed AC Circuit Equipment 774 988 78.3% 0.022
Failed AC Substation Equipment 750 883 84.9% 0.021
Human Error (w/o Type 61 OR Type 62) 592 684 86.5% 0.017
Foreign Interference 423 851 49.7% 0.012
Fire 261 345 75.7% 0.007
Power System Condition 255 365 69.9% 0.007
Other 244 322 75.8% 0.007
Contamination 216 614 35.2% 0.006
Combined Smaller ICC groups 153 196 78.1% 0.004
Vegetation 116 150 77.3% 0.003
Vandalism- Terrorism- or Malicious Acts 23 28 82.1% 0.001
Environmental 14 18 77.8% 0.000
with ICC assigned 7,750 14,335 54.1% 0.221
TADS events 7,780 14,374 54.1% 0.222
Table B.11 lists sustained events by ICC for 2012–2015 and their corresponding population percentages for TADS 200 kV+ events. Events with an Unknown ICC represented the largest number of sustained events. Sustained events, initiated by the ICC of Weather excluding Lightning, comprise the second largest group, followed by the ICCs of Lightning and Misoperation. A total of 7,780 sustained events were reported, representing 54.1 percent of all TADS 200 kV+ events. A total of 7,750 of these sustained events were able to be assigned one of the 15 ICCs. Table B.11 provides information on the percentage of sustained events in different ICC groups. These percentages vary greatly with less than 30 percent of all events initiated by Lightning resulting in sustained events versus 86.5
92 The TADS definition of Sustained Outage is different from the NERC Glossary of Terms Used in Reliability Standards definition of Sustained
Outage that is presently only used in FAC‐003‐1. The glossary defines a Sustained Outage as follows: “The de-energized-energized condition of a transmission line resulting from a fault or disturbance following an unsuccessful automatic reclosing sequence and/or unsuccessful manual reclosing procedure.” The definition is inadequate for TADS reporting for two reasons. First, it has no time limit that would distinguish a sustained outage from a momentary outage. Second, for a circuit with no automatic reclosing, the outage would not be “counted” if the TO has a successful manual reclosing under the glossary definition.

Appendix B – Statistical Analysis of Transmission Data
NERC | State of Reliability | May 2016 100
percent of events initiated by Human Error and 84.9 percent of events initiated by Failed AC Substation Equipment. In Table B.11, the reciprocal of the probability/hour of 0.222 estimates that in the defined BES system of 200 kV+ facilities, a sustained event started, on average, every 4 hours and 30 minutes. Some ICC groups of sustained events do not have a population large enough to determine statistically significant year-over-year changes in transmission outage severity. However, the four-year ICC groups can be used for correlation analysis. For this analysis, the three smallest ICC groups (Vegetation; Environmental; and Vandalism, Terrorism, or Malicious Acts) were combined into a new group (Combined Smaller ICC groups). Figure B.7 shows the correlation between calculated transmission outage severity and each ICC (same format as Figure B.3).
Figure B.7: Correlation between ICC and Transmission Outage Severity of 200 kV+
Sustained Events (2012–2015)

Appendix B – Statistical Analysis of Transmission Data
NERC | State of Reliability | May 2016 101
Similar to the analysis of all 200 kV+ TADS events, Misoperation, Power System Condition, and Failed AC Substation Equipment have a statistically significant positive correlation with transmission outage severity. Other ICCs with significant positive correlation are Contamination and Lightning. The expected severity of events with each of these ICCs is greater than the expected severity of other ICC events. Weather excluding Lightning, Foreign Interference, Failed AC Circuit Equipment, Combined Smaller ICC Groups, and Unknown have a statistically significant negative correlation with transmission outage severity. The expected severity of events initiated by these causes is less than the expected transmission outage severity of other TADS events. Events with each of the ICCs with blue bars have the expected transmission outage severity similar to all other events in TADS. The distribution of transmission outage severity is studied separately for sustained events with a given ICC and the complete dataset. The transmission outage severity of the 2012–2015 TADS sustained events has a sample mean of 0.143 and a sample standard deviation of 0.10. The sample statistics for transmission outage severity by ICC are listed in Table B.12 (same format as Table B.5). Sustained events initiated by Power System Condition have the highest expected transmission outage severity, followed by events with ICCs Misoperation, Contamination and Failed AC Substation Equipment. Power System Condition and Misoperation also have significantly greater variation (and the standard deviation), which means more frequent occurrences of events with these ICCs with higher transmission outage severity.
Table B.12: Distribution of Transmission Outage Severity (TS) of Sustained Events 200 kV+ by ICC (2012–2015)
# Initiating Cause Code (ICC) Average
TS
Is Expected TS statistically significantly different than for other
sustained events?
ICC with statistically significantly smaller
average TS
Stand Deviation
of TS
1 Power System Condition 0.181 Larger 3,4,5,6,7,8,9,10,11,12,13 0.161
2 Misoperation 0.168 Larger 5,6,7,8,9,10,11,12,13 0.146
3 Contamination 0.162 Larger 9,10,11,12,13 0.096
4 Failed AC Substation Equipment
0.161 Larger 6,7,8,9,10,11,12,13 0.120
5 Fire 0.151 No 9,10,11,12,13 0.090
6 Lightning 0.150 Larger 9,10,11,12,13 0.101
7 Human Error (w/o Type 61 OR Type 62)
0.146 No 9,10,11,12,13 0.103
8 Other 0.144 No 10,11,12,13 0.111
All Sustained Events 0.143 N/A N/A 0.104
Sustained with ICC 0.142 N/A N/A 0.103
9 Unknown 0.135 Smaller 11,12,13 0.082
10 Failed AC Circuit Equipment 0.128 Smaller 12,13 0.081
11 Weather excluding Lightning
0.124 Smaller none 0.074
12 Foreign Interference 0.112 Smaller none 0.068
13 Combined Smaller ICC groups
0.108 Smaller none 0.049

Appendix B – Statistical Analysis of Transmission Data
NERC | State of Reliability | May 2016 102
The transmission risk and relative risk by ICC group were calculated, ranked, and are provided in Table B.13 with a breakdown of relative risk of sustained events by ICC.
Table B.13: Evaluation of 200 kV0 kV+ Sustained Event ICC Contribution to Transmission Outage Severity (2012–2015)
Group of Sustained events
Probability that an
event from a group starts
during a given hour
Expected Impact
(expected transmission
outage severity of an
event)
Risk associated
with a group per
hour
Relative Risk by group
All TADS 200 kV+ 0.410 0.135 0.055 100.0%
Sustained events 0.222 0.143 0.032 57.4%
Sustained with ICC assigned 0.221 0.142 0.031 56.8%
Unknown 0.034 0.135 0.005 8.4%
Weather excluding Lightning 0.032 0.124 0.004 7.2%
Lightning 0.027 0.150 0.004 7.2%
Misoperation 0.023 0.168 0.004 7.0%
Failed AC Substation Equipment 0.021 0.161 0.003 6.2%
Failed AC Circuit Equipment 0.022 0.128 0.003 5.1%
Human Error (w/o Type 61 OR Type 62) 0.017 0.146 0.002 4.5%
Foreign Interference 0.012 0.112 0.001 2.4%
Power System Condition 0.007 0.181 0.001 2.4%
Fire 0.007 0.151 0.001 2.0%
Other 0.007 0.144 0.001 1.8%
Contamination 0.006 0.162 0.001 1.8%
Combined Smaller ICC groups 0.004 0.108 0.000 0.8%
Analysis of the TADS sustained events indicate that the ICC Unknown has the greatest relative risk from 2012 to 2015. Sustained events with ICCs of Misoperation and Failed AC Substation Equipment are the two largest contributors to transmission outage severity with the exception of Unknown and weather-related events. They also have a significant positive correlation with transmission outage severity. The ICC with the highest expected severity, Power System Condition, ranks low in Table B.13 because of its relative small risk due to infrequent occurrences of sustained events with this ICC.
Study 4: Regional Entity Transmission Analysis The following is a study of the transmission outage severity of TADS events by Region. This analysis is based on the 2012–2015 TADS data for the 200 kV+ ac circuits and utilizes the general methodology described in the previous sections. Here, a summary of this analysis is introduced and similarities and differences in transmission risk profiles by Region are examined. Figure B.8 shows the breakdown of NERC-wide inventory and transmission outage severity risk by Region. The breakdown of the total transmission outage severity is similar to breakdown of the NERC inventory by ac circuit counts and by ac circuit miles.

Appendix B – Statistical Analysis of Transmission Data
NERC | State of Reliability | May 2016 103
Figure B.8: NERC Inventory and Transmission Outage Severity Breakdown by Region
(2012–2015)
The Regional ac circuit inventories differ by count (number of circuits or circuit miles) and by voltage class mix. This may contribute to the significant differences in the average transmission outage severity of TADS events between Regions. Since the ac circuit voltage determines the transmission outage severity (Equation B.1), outages on systems with higher voltages would have a greater impact. The transmission outage severity by ICC was studied for each Region. A comparative analysis of RE relative risks by ICC is summarized in Figure B.9. Figure B.9 represents the relative breakdown of the total transmission severity by ICC for outage events occurring within each Region and for NERC overall. ICCs are listed from left to right by decreasing relative risk for NERC data. For the top NERC ICCs, the ICC contributions vary dramatically among Regions. Relative risk for Lightning ranges from 10 percent in FRCC to 30 percent in TRE and 29 percent in SPP. Events with ICC of Unknown contribute between 10 percent in RF and in NPCC and 30 percent in WECC. Weather excluding Lightning, as an outage cause code, initiates events comprising nine percent transmission outage severity in NPCC and SERC and 25 percent in MRO. Misoperation has the highest relative risk in NPCC (17 percent) and the lowest in FRCC, TRE, and WECC (six percent) with other Regions’ numbers close to the NERC average of nine percent. For MRO, SPP, TRE, and WECC, ac Substation Equipment failures resulted in five percent of the total transmission outage severity, while they contributed 13 percent in RF. FRCC has a very distinctive profile with a unique risk breakdown. First, the top-three ICCs for North America (the two weather-related ICCs and Unknown) comprise only 37 percent of the transmission outage severity in FRCC, versus 54 percent for NERC. Second, FRCC’s top-risk ICC is Foreign Interference, which ranks very low for NERC and other Regions. Note that NERC’s top non-weather-related contributors, Misoperation, and Failed AC Substation Equipment, together comprise only 12 percent of FRCC’s transmission risk compared with 14 percent for Failed AC Circuit Equipment.

Appendix B – Statistical Analysis of Transmission Data
NERC | State of Reliability | May 2016 104
Power System Condition, which initiates events with the highest average severity of sustained events and second highest for all 200 kV+ events, ranks low for NERC. However, for NPCC, it ranks third and contributes 12 percent of the total severity for the Region.
Figure B.9: Relative Transmission Risk by ICC and Region (2012–2015)
Study 5: Sustained Events for 100-199 kV AC Circuits (2015) The addition of the 100-199 kV elements beginning in the year 2015 significantly increased TADS inventory, especially for ac circuits. It should be noted that only sustained outages were collected by TADS for voltages less than 200 kV. The TADS events for the 100-199 kV voltage class in 2015 comprised the majority of the ac circuit outages and events as illustrated by Figure B.10.

Appendix B – Statistical Analysis of Transmission Data
NERC | State of Reliability | May 2016 105
Figure B.10: TADS Events by Voltage Group and Event Type (2015)
Since the equivalent MVA of the 100-199 kV voltage class is much smaller than the higher voltage classes, the TADS events that affected these ac circuits contributed only 20 percent to the total transmission outage severity of TADS events in 2015. Figure B.11 shows a breakdown of the 2015 TADS transmission outage severity by voltage group and by event type.
Figure B.11: Transmission Outage Severity of TADS Events by Voltage Group and Event
Type (2015)

Appendix B – Statistical Analysis of Transmission Data
NERC | State of Reliability | May 2016 106
The analysis of the 100-199 kV events by ICC yields the ICC ranking by the contribution to the transmission severity as shown in Figure B.12.
Figure B.12: Relative Risk of the 100-199 kV TADS Events by ICC (2015)
The top three contributors to the transmission outage severity are the same as for the 200 kV+ events. ICC Failed AC Circuit Equipment contributes 11 percent of the transmission outage severity of the 100-199 kV ac circuits and ranks fourth while for the 200 kV+ ac circuits it ranks below Misoperation and Failed AC Substation Equipment.
Study 6: Sustained Cause Code Study for 2015 Sustained Outages of 100 kV+ Beside an ICC, a sustained cause code (SCC) is assigned to a sustained outage. The SCC describes the cause that contributed to the longest duration of the outage. The list of TADS SCCs is the same as the list of ICCs. A method of assigning a single SCC to a TADS event with multiple outages having different SCCs has not yet been developed. Therefore, it is not yet possible to analyze SCCs by applying the same methodology as described in Studies 1 through 5 for ICCs. In this study, the 2015 sustained outages of the 100-199 kV+ with a transmission outage severity calculated by Equation B.1 are investigated by SCC. TADS outages, unlike TADS events, can be dependent and they do not represent a statistical sample with independent observations. Therefore, the risk analysis for outages is limited to the transmission outage severity calculation, numerical comparison of the transmission outage severity of SCC groups, and their ranking. However, there is another important variable reported for sustained outages – the outage duration. Provided below are some statistics on the outage duration by SCC and demonstrate a way to incorporate duration into analysis of the relative risk by SCC. Table B.14 lists the number of outages, the average, the median, and the maximum outage duration by SCC and overall for the 2015 sustained outages of the 100 kV+. SCCs are listed in decreasing order by number of outages.
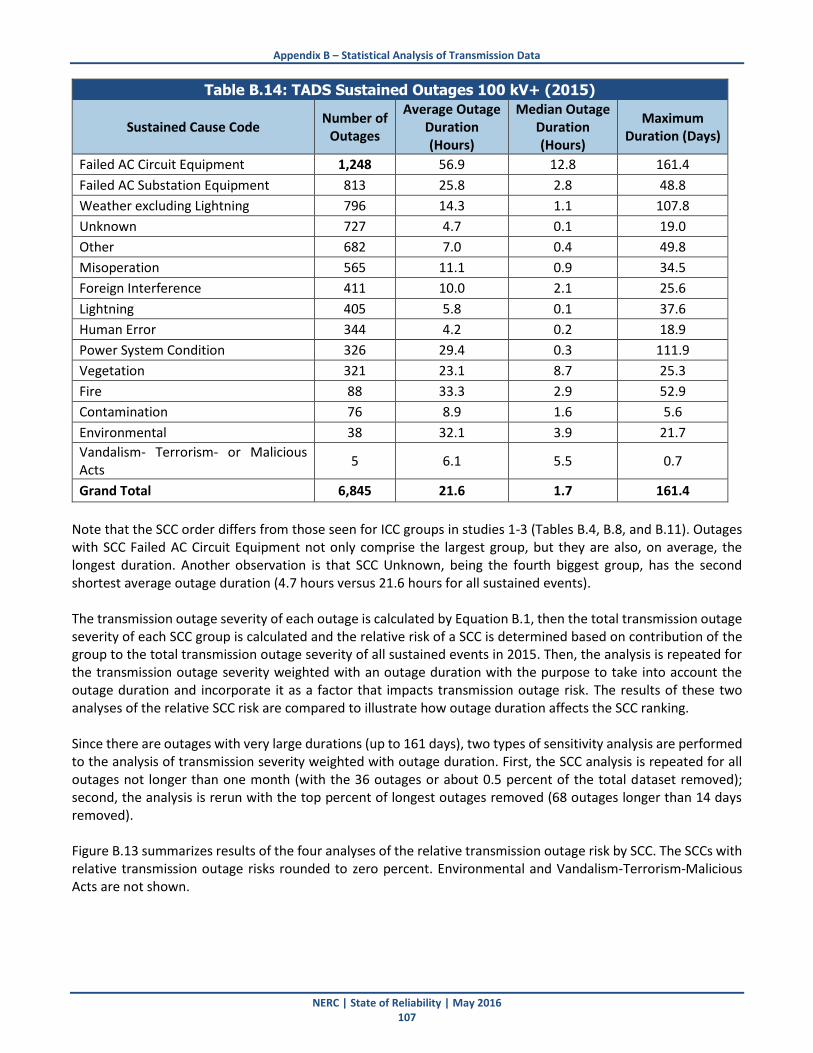
Appendix B – Statistical Analysis of Transmission Data
NERC | State of Reliability | May 2016 107
Table B.14: TADS Sustained Outages 100 kV+ (2015)
Sustained Cause Code Number of
Outages
Average Outage Duration (Hours)
Median Outage Duration (Hours)
Maximum Duration (Days)
Failed AC Circuit Equipment 1,248 56.9 12.8 161.4
Failed AC Substation Equipment 813 25.8 2.8 48.8
Weather excluding Lightning 796 14.3 1.1 107.8
Unknown 727 4.7 0.1 19.0
Other 682 7.0 0.4 49.8
Misoperation 565 11.1 0.9 34.5
Foreign Interference 411 10.0 2.1 25.6
Lightning 405 5.8 0.1 37.6
Human Error 344 4.2 0.2 18.9
Power System Condition 326 29.4 0.3 111.9
Vegetation 321 23.1 8.7 25.3
Fire 88 33.3 2.9 52.9
Contamination 76 8.9 1.6 5.6
Environmental 38 32.1 3.9 21.7
Vandalism- Terrorism- or Malicious Acts
5 6.1 5.5 0.7
Grand Total 6,845 21.6 1.7 161.4
Note that the SCC order differs from those seen for ICC groups in studies 1-3 (Tables B.4, B.8, and B.11). Outages with SCC Failed AC Circuit Equipment not only comprise the largest group, but they are also, on average, the longest duration. Another observation is that SCC Unknown, being the fourth biggest group, has the second shortest average outage duration (4.7 hours versus 21.6 hours for all sustained events). The transmission outage severity of each outage is calculated by Equation B.1, then the total transmission outage severity of each SCC group is calculated and the relative risk of a SCC is determined based on contribution of the group to the total transmission outage severity of all sustained events in 2015. Then, the analysis is repeated for the transmission outage severity weighted with an outage duration with the purpose to take into account the outage duration and incorporate it as a factor that impacts transmission outage risk. The results of these two analyses of the relative SCC risk are compared to illustrate how outage duration affects the SCC ranking. Since there are outages with very large durations (up to 161 days), two types of sensitivity analysis are performed to the analysis of transmission severity weighted with outage duration. First, the SCC analysis is repeated for all outages not longer than one month (with the 36 outages or about 0.5 percent of the total dataset removed); second, the analysis is rerun with the top percent of longest outages removed (68 outages longer than 14 days removed). Figure B.13 summarizes results of the four analyses of the relative transmission outage risk by SCC. The SCCs with relative transmission outage risks rounded to zero percent. Environmental and Vandalism-Terrorism-Malicious Acts are not shown.
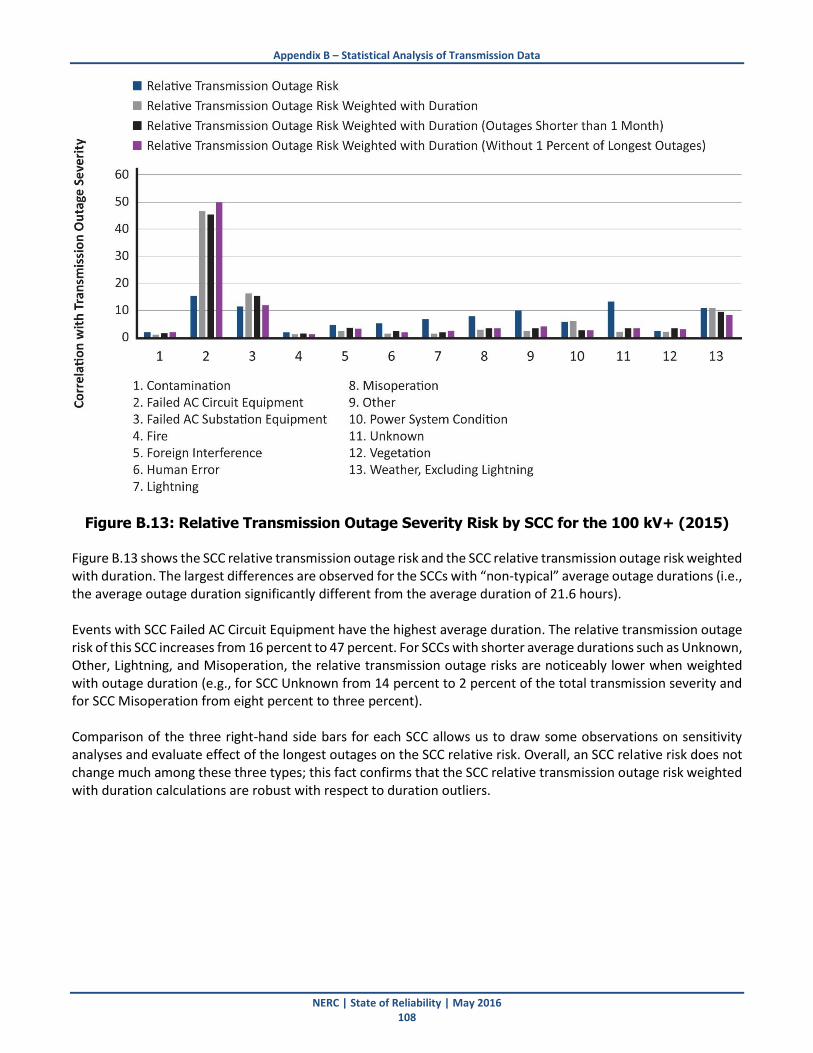
Appendix B – Statistical Analysis of Transmission Data
NERC | State of Reliability | May 2016 108
Figure B.13: Relative Transmission Outage Severity Risk by SCC for the 100 kV+ (2015) Figure B.13 shows the SCC relative transmission outage risk and the SCC relative transmission outage risk weighted with duration. The largest differences are observed for the SCCs with “non-typical” average outage durations (i.e., the average outage duration significantly different from the average duration of 21.6 hours). Events with SCC Failed AC Circuit Equipment have the highest average duration. The relative transmission outage risk of this SCC increases from 16 percent to 47 percent. For SCCs with shorter average durations such as Unknown, Other, Lightning, and Misoperation, the relative transmission outage risks are noticeably lower when weighted with outage duration (e.g., for SCC Unknown from 14 percent to 2 percent of the total transmission severity and for SCC Misoperation from eight percent to three percent). Comparison of the three right-hand side bars for each SCC allows us to draw some observations on sensitivity analyses and evaluate effect of the longest outages on the SCC relative risk. Overall, an SCC relative risk does not change much among these three types; this fact confirms that the SCC relative transmission outage risk weighted with duration calculations are robust with respect to duration outliers.

Appendix B – Statistical Analysis of Transmission Data
NERC | State of Reliability | May 2016 109
Table B.15 shows the SCC rankings by relative transmission outage risk (unweighted and weighted with outage duration).
Table B.15: SCC Ranking for TADS Sustained Outages 100 kV+ (2015)
Sustained Cause Code By Relative Transmission
Outage Risk
By Relative Transmission Outage Risk Weighted with Outage
Duration
Contamination 12 13
Environmental 14 14
Failed AC Circuit Equipment 1 1
Failed AC Substation Equipment 3 2
Fire 13 12
Foreign Interference 10 7
Human Error 9 11
Lightning 7 10
Misoperation 6 5
Other 5 6
Power System Condition 8 4
Unknown 2 9
Vandalism, Terrorism, or Malicious Acts
15 15
Vegetation 11 8
Weather excluding Lightning 4 3
For several SCCs, there are significant differences between their respective ranks. As the result of Study 6, both rankings are derived and presented without making a decision about superiority of either method of the relative transmission outage risk evaluation. Each method has its advantages and disadvantages: the transmission outage risk based on transmission outage severity calculations without duration is simpler and (which is more important) allows to analyze all outages and events (momentary and sustained). The transmission outage risk based on the transmission outage severity weighted with outage duration discards momentary outages from the analysis and, while it does take into account differences in sustained outage duration, more analysis and the industry expert discussions are needed to decide whether the weighing is fair (for example, as a result of this weighting, an one-hour ac circuit outage from the 300–399 kV voltage class contributes to the total weighted transmission severity equally with an outage of the 100–199 kV ac circuit with duration of six hours and 30 minutes; with an outage of the 200-299 kV ac circuit with duration of one hours and 51 minutes; with an outage of the 400-599 kV ac circuit with duration of 39 minutes; and with an outage of the 600–799 kV ac circuit with duration of 26 minutes).
Summary of TADS Data Analysis Several studies of TADS events from 2012–2015 were performed, including:
1. An analysis of TADS outage events (Momentary and Sustained) for ac circuits 200 kV+
2. An analysis of a subset of outage events that included only events with multiple transmission element outages, (i.e., CDM events)
3. An analysis of all outage events that lasted for more than a minute (defined as a sustained outage event)
Appendix B – Statistical Analysis of Transmission Data
NERC | State of Reliability | May 2016 110
4. An analysis of the transmission outage severity of TADS events by RE
5. For the first time, NERC analyzed the 2015 sustained outage events for the 100–199 kV ac circuits based on the data that started collection in TADS beginning January 2015
6. The 2015 sustained outages were analyzed by SCC Figure B.14 represents an analysis of the transmission outage severity risk of the 2012–2015 TADS events for the 200 kV+ ac circuits. The x-axis is the magnitude of the correlation of a given Initiating Cause Code (ICC) with transmission outage severity. The y-axis represents the expected transmission outage severity of an event when it occurs. The color of the marker indicates if there is a correlation of transmission outage severity with the given ICC (either statistically significantly positive—Red, statistically significantly negative—Green, or no significant correlation—Blue). The size/area of the marker indicates the probability of an event initiating in any hour with a given ICC and is proportional to the number of events initiated by a given cause. The Misoperation ICC (which represents TADS ICCs Failed Protection System Equipment and Human Error associated with Misoperations) and the Failed AC Substation Equipment ICC both show a statistically significant positive correlation with transmission outage severity and thus a higher relative transmission risk. Power System Condition, while showing a positive correlation of transmission outage severity, has a lower relative transmission risk, based on the frequency of these TADS events and their expected transmission outage severity. Biggest marker corresponds to the biggest ICC group; Lightning, which has no significant correlation with transmission outage severity but shows a high relative transmission risk because of the high probability of events initiated by lightning. The next two biggest ICC groups, Unknown, and Weather excluding Lightning, have a statistically significant negative correlation with the transmission outage severity.
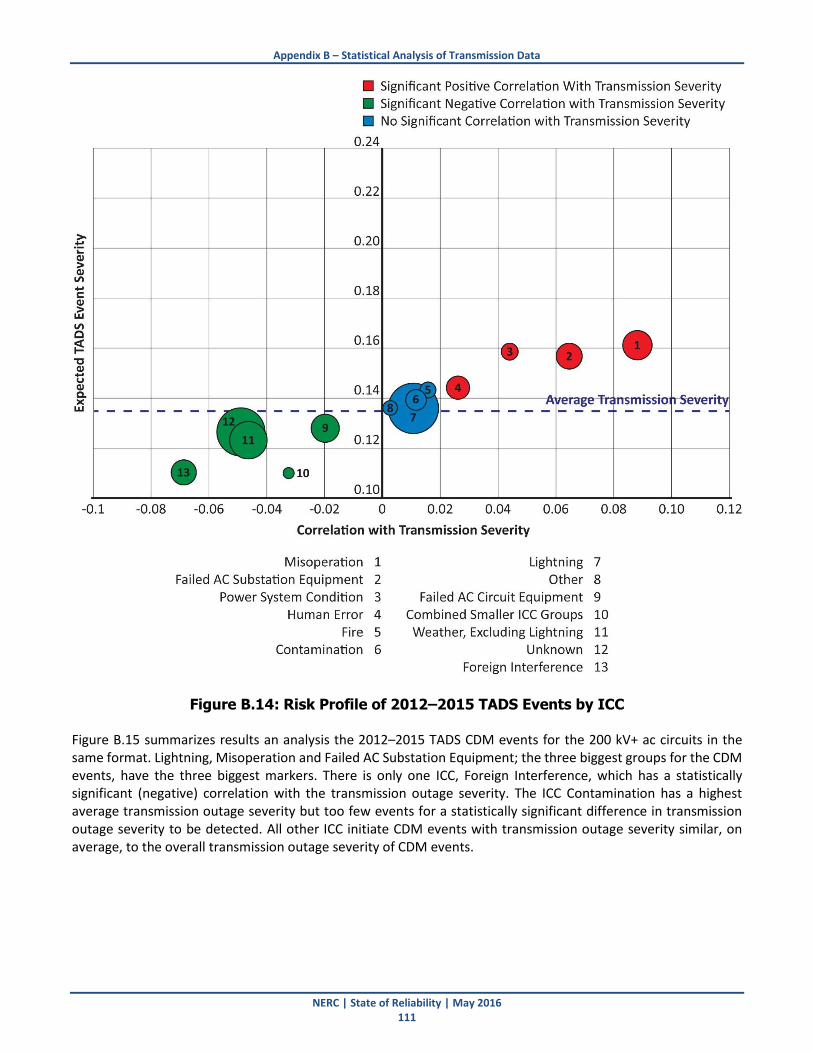
Appendix B – Statistical Analysis of Transmission Data
NERC | State of Reliability | May 2016 111
Figure B.14: Risk Profile of 2012–2015 TADS Events by ICC Figure B.15 summarizes results an analysis the 2012–2015 TADS CDM events for the 200 kV+ ac circuits in the same format. Lightning, Misoperation and Failed AC Substation Equipment; the three biggest groups for the CDM events, have the three biggest markers. There is only one ICC, Foreign Interference, which has a statistically significant (negative) correlation with the transmission outage severity. The ICC Contamination has a highest average transmission outage severity but too few events for a statistically significant difference in transmission outage severity to be detected. All other ICC initiate CDM events with transmission outage severity similar, on average, to the overall transmission outage severity of CDM events.

Appendix B – Statistical Analysis of Transmission Data
NERC | State of Reliability | May 2016 112
Figure B.15: Risk Profile of 2012–2015 TADS CDM Events by ICC for 200 kV+ Figure B.16 represents an analysis of the transmission outage severity risk of the 2012—2015 ICC study of sustained events in the same format. Misoperation, Failed AC Substation Equipment, and Lightning show a statistically significant positive correlation with transmission outage severity, thus a higher relative transmission risk. Power System Condition and Contamination while showing a positive correlation of transmission outage severity, have a lower relative transmission risk; based on the frequency of these events and their expected transmission outage severity. In contrast, Unknown and Weather excluding Lightning indicate a high relative transmission risk but have a negative correlation with transmission outage severity.

Appendix B – Statistical Analysis of Transmission Data
NERC | State of Reliability | May 2016 113
Figure B.16: Risk Profile of the 2012–2015 Sustained Events by ICC The statistical analysis of the 2012–2015 TADS data on the transmission outage severity and initiating causes of TADS outage events yields the following observations:
Excluding weather-related and Unknown ICCs, Misoperations and Failed AC Substation Equipment remain the two largest contributors to transmission outage severity for all TADS events of the 200 kV+ (momentary and sustained) (Table B.6) and all sustained TADS events of the 200 kV+ (Table B.16). For common and dependent mode events of the 200 kV+, Misoperations and Failed AC Substation Equipment ranked second and third, respectively, after ICC Lightning (Table B.10).
In 2015, the frequency of events of the 200 kV+ with ICC Misoperation significantly reduced (Table B.4), and their combined contribution to the total transmission outage severity decreased from 11.1 percent in 2014 to 5.3 percent in 2015 (the relative risk rank changed from fourth to seventh) (Figure B.6).
TADS events initiated by ICCs Misoperations and Failed AC Substation Equipment have statistically significant higher expected transmission outage severity than all other TADS events (Table B.5 and Figure B.3).

Appendix B – Statistical Analysis of Transmission Data
NERC | State of Reliability | May 2016 114
Among other ICCs, Human Error and Power System Condition have a statistically significant positive correlation with transmission outage severity (Figure B.3) but events initiated by these ICCs are less frequent (Table B.4). Therefore, these ICCs rank relatively low by relative risk (seventh and tenth out of 13 ICC groups) (Table B.6).
Unlike the results for all TADS events and CDM events, the sustained outage events for the ICC Lightning has a statistically significant positive correlation with transmission outage severity (Figure B.7).
The ICC groups of CDM events show less variability in distribution of the transmission outage severity. Only the ICC Foreign Interference has a statistically significant (negative) correlation with the transmission outage severity (Table B.9 and Figure B.14).
Among 20 TADS events with the highest transmission outage severity for the most recent four years, three ICC stand out from the rest: Misoperation (six events), Lightning (four events) and Failed AC Substation Equipment (three events). The 20 events are also CDM and sustained events.
Ranking of ICC groups by relative risk differ significantly between the NERC Regions (Figure B.9). In 2015, for sustained TADS events of the 100–199 kV lines, weather-related and Unknown ICCs were the top contributors to the transmission outage severity followed by Failed AC Circuit Equipment, Failed AC Substation Equipment and Foreign Interference (Figure B.12).
Outages with SCC Failed AC Circuit Equipment not only comprise the biggest group among the 2015 sustained outages, but they are also, on average, the longest duration.

NERC | State of Reliability | May 2016 115
Appendix C – Analysis of Generation Data
Introduction GADS began as a voluntary reporting system in 1982. In 2012, GADS data collection became mandatory as part of NERC’s reliability program. Mandatory reporting was phased in; only units 50MW and larger were required to report their operating data to GADS in 2012, all others were voluntary. Beginning in 2013, all units 20MW and larger were required to report their data. In addition, some smaller units report into GADS on a voluntary basis. Except where noted, the analysis for this report includes only active units with a mandatory reporting obligation.93 Data used in the analysis includes information reported into GADS through the end of the 2015 reporting year. Currently, GADS does not include wind, solar or other renewable technology generating assets. Wind performance data reporting requirements have been developed and a phased in reporting process will begin in 2017–2020. Reporting data requirements for solar have been initiated with a target goal of beginning data submittal by 2021. GADS collects and stores unit operating information on a quarterly basis. By pooling individual unit information, overall generating unit availability performance and other metrics are calculated. The information supports equipment reliability, availability analyses, and risk-informed decision making to industry. Reports and information resulting from the data collected through GADS are used by industry for benchmarking and analyzing electric power plants. Table C.1 shows some key characteristics of the population in GADS.
Table C.1: Key Characteristics of GADS
Metric/year 2012 2013 2014 2015
Number of Reporting Units =>20 MW 4,343 6,033 6,169 6,236
Average Age of the Fleet (Years) 28.8 33.2 33.6 34.2
Average Age of Coal Units (Years) 40.2 41.0 42.0 43.0
Average Age of Gas Units (Years) 19.2 21.9 22.4 22.9
Average Age of Nuclear Units (Years) 33.0 34.0 35.0 36.1
The age of the generating fleet is a particularly revealing statistic derived from GADS, because an aging fleet could potentially see increasing outages. However, with proper maintenance and equipment replacement, older units may perform comparably to newer units. Figure C.1 uses GADS data to plot fleet capacity by age and fuel type. Figure C.1 shows two characteristics of the fleet reported to GADS: (1) there is an age bubble around 36–45 years, driven by coal and some gas units; and (2) there is a significant age bubble around 11–19 years comprised almost exclusively of gas units. The data shows a clear shift toward gas-fired unit additions, and the overall age of the fleet across North America is almost 10 years younger than the age of the coal-fired baseload plants that have been the backbone of power supply for many years. This trend is projected to continue given current forecasts around price and availability of natural gas as a power generation fuel, as well as regulatory impetus.
93 In 2015, fewer than 100 MW of units had a voluntary reporting status in GADS. In addition, differences between historical data reported in this report and the 2015 report are due to this change in the analysis. Units that retired in 2015 are also excluded from the analysis.
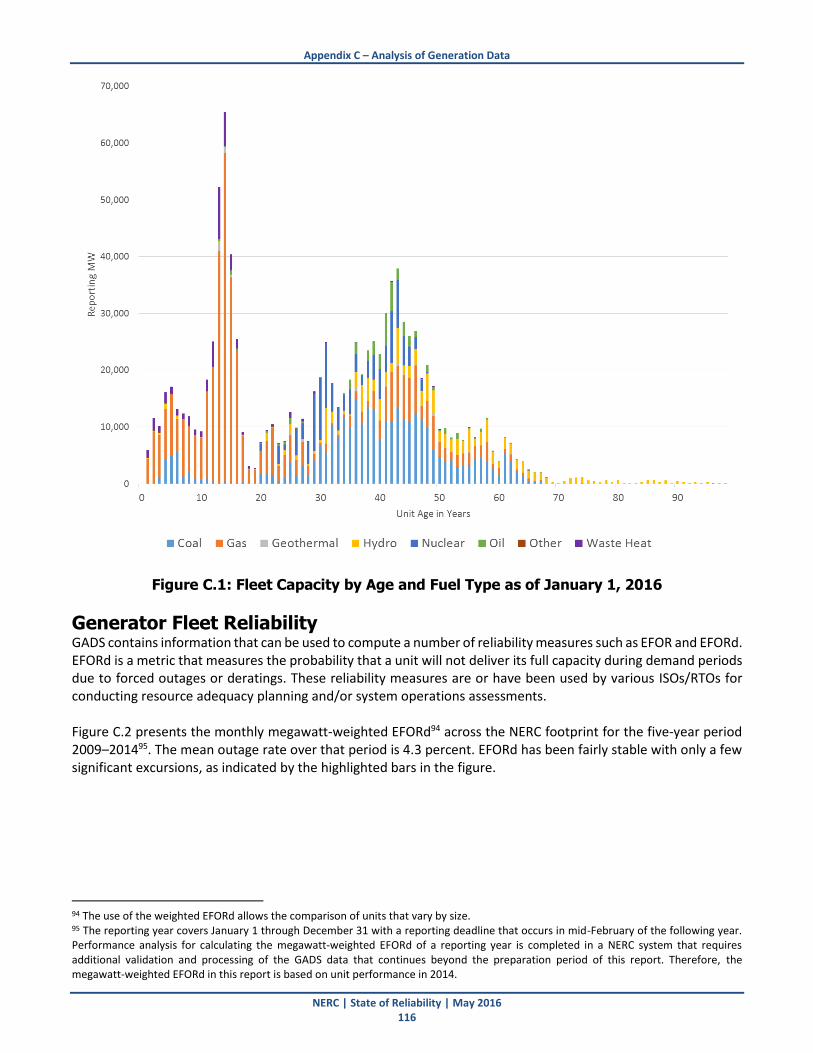
Appendix C – Analysis of Generation Data
NERC | State of Reliability | May 2016 116
Figure C.1: Fleet Capacity by Age and Fuel Type as of January 1, 2016
Generator Fleet Reliability GADS contains information that can be used to compute a number of reliability measures such as EFOR and EFORd. EFORd is a metric that measures the probability that a unit will not deliver its full capacity during demand periods due to forced outages or deratings. These reliability measures are or have been used by various ISOs/RTOs for conducting resource adequacy planning and/or system operations assessments. Figure C.2 presents the monthly megawatt-weighted EFORd94 across the NERC footprint for the five-year period 2009–201495. The mean outage rate over that period is 4.3 percent. EFORd has been fairly stable with only a few significant excursions, as indicated by the highlighted bars in the figure.
94 The use of the weighted EFORd allows the comparison of units that vary by size. 95 The reporting year covers January 1 through December 31 with a reporting deadline that occurs in mid-February of the following year. Performance analysis for calculating the megawatt-weighted EFORd of a reporting year is completed in a NERC system that requires additional validation and processing of the GADS data that continues beyond the preparation period of this report. Therefore, the megawatt-weighted EFORd in this report is based on unit performance in 2014.

Appendix C – Analysis of Generation Data
NERC | State of Reliability | May 2016 117
Figure C.2: Monthly Capacity Weighted EFORd 2009–2014
Forced Outage Causes To better understand the causes of forced outages of generators, the annual and top-10 forced outage causes for the summer and winter seasons were analyzed for the period of 2012–2015. This analysis is focused on forced outage causes measured in terms of megawatt hours lost, to reflect both the amount of capacity affected and the duration of the outages. The levels of forced outages reported into the GADS database are presented in Figure C.3 and Table C.2, providing detail on the MWh lost due to forced outages for the period 2012–2015 by season.
Figure C.3: Total MWh Lost Due to Forced Outages 2012–2015

Appendix C – Analysis of Generation Data
NERC | State of Reliability | May 2016 118
Table C.2: Total MWh Lost Due to Forced Outages, by Season 2012–2015
NERC Total Annual MWh Summer MWh Winter MWh Spring/Fall MWh
2012 214,867,802 62,890,135 72,191,101 79,786,567
2013 651,511,562 129,920,201 363,617,775 157,973,586
2014 422,713,436 97,264,944 162,009,409 163,439,083
2015 450,958,972 129,703,616 204,677,109 116,578,248
Based on the four years of available data since GADS reporting became mandatory, the following observations can be made:
Between 2012 and 2013, the number of units with a mandatory reporting obligation increased by 39 percent. This increase in the number of units reporting is the primary reason for the increase in forced outage MWh reported in 2012 and 2013.
Severe storms in the last quarter of 2012, such as Hurricane Sandy, resulted in an increase in the forced outage MWh reported for winter96 2013 and 2014.
For this analysis, the season of a forced outage is associated with the season in which the start date of the event was reported in that year; when an event continues into the next year, a new event record is created in January. This results in the event being categorized as occurring in the winter for the continuation event.
Between 2012 and 2014, the shoulder months of spring/fall have higher forced outage MWh than the summer period.
Further analysis into the causes of forced outages considered the impact of weather. Figure C.4 presents the percentage of MWh lost due to weather-related forced outage cause codes reported each year. This indicates that while weather does cause major headlines, the overall effect on the fleet is minimal. The real impacts of weather-related events are localized impacts and of relatively short duration.
96 Winter includes the months of January, February and December. When analysis is performed on a calendar year basis, as for this report, these three months are included from the same calendar year. Summer includes May through September; all other months are categorized as spring/fall.

Appendix C – Analysis of Generation Data
NERC | State of Reliability | May 2016 119
Figure C.4: Contribution of Weather-Related Causes to Annual Total MWh Lost Due to Forced Outages 2012–2015
To gain additional insight into the drivers for the reported megawatt hours lost due to forced outages, the top-10 forced outage causes were examined to determine the impact these top-10 forced outage causes have on the annual total of MWh lost. The top-10 forced outage causes represent one percent of the types of forced outages reported annually; Table C.4 lists the top-10 outage causes for each year in the analysis period. Figure C.5 shows the contribution of the top-10 forced outage causes on a NERC-wide basis over the period 2012–2015.

Appendix C – Analysis of Generation Data
NERC | State of Reliability | May 2016 120
Figure C.5: Contribution of Top-10 Causes to Annual Total MWh Lost Due to Forced
Outages 2012–2015 Table C.3 provides a comparison of the top-10 causes to the corresponding annual total of MWh lost due to forced outages. The contribution from the top-10 causes to the annual total megawatt hours lost averages 33.8 percent, with the highest percentage of megawatt hours lost due to the top-10 causes occurring in 2013. The average is only slightly higher than the contribution of top-10 causes for 2014 and 2015.
Table C.3: Percentage of Top 10 Forced Outage Cause MWh by Season to Annual Total MWh Lost Due to Forced Outages 2012–2015
NERC Total Annual MWh Summer MWh Winter MWh Spring/Fall MWh
2012 30% 6% 12% 12%
2013 41% 5% 27% 9%
2014 32% 6% 14% 13%
2015 32% 7% 21% 5%
The top-10 causes vary annually and the contribution from each of the top-10 causes to the total megawatt hours lost varies as well. Figure C.6 shows the contribution from each of the individual top-10 causes that accumulate by year to the top-10 annual lost MWh shown in Figure C.3.

Appendix C – Analysis of Generation Data
NERC | State of Reliability | May 2016 121
Figure C.6: Contribution of the Individual Top-10 Cause Codes to Top-10 Annual MWh Lost Due to Forced Outages
Table C.4 lists the top-10 forced outage causes on an annual basis. The list is ordered from the most impactful cause to the least, based on annual MWh lost.
Table C.4: Top 10 Cause Codes on Annual Basis (MWh)
Rank 2012 2013 2014 2015
1 Waterwall (Furnace
wall) Rotor - General
Waterwall (Furnace wall)
Main Transformer
2 Rotor - General Main Transformer Emergency Generator
Trip Devices Stator Windings,
Bushings, and Terminals
3 Transmission System Problems other than
Catastrophes
Stator Windings, Bushings, and
Terminals Flood Generator Vibration
4 Main Transformer Other Miscellaneous Generator Problems
Main Transformer Waterwall (Furnace
wall)
5 Other Boiler
Instrumentation and Control Problems
Stator - General Lack of Fuel
(interruptible supply of fuel)
Stator Core Iron

Appendix C – Analysis of Generation Data
NERC | State of Reliability | May 2016 122
Table C.4: Top 10 Cause Codes on Annual Basis (MWh)
Rank 2012 2013 2014 2015
6 Second Superheater Regulatory
Proceedings and Hearings
Other Low Pressure Turbine Problems
Major Turbine Overhaul (720 Hrs. Or Longer)
7 Generator Output
Breaker Rotor Windings
AC Conductors and Buses
Other Exciter Problems
8 Hurricane Flood Stator Windings,
Bushings, and Terminals
Other Switchyard or High Voltage System
Problems
9 Regulatory
Proceedings and Hearings
Waterwall (Furnace wall)
Major Turbine Overhaul (720 Hrs. Or Longer)
Other High Pressure Turbine Problems
10 First Reheater Air Supply Duct
Expansion Joints Miscellaneous
Regulatory AC Protection Devices
Several outage causes appear in the top 10 more often than others. Weather-related outages in 2012 due to Hurricane Sandy resulted in flooding which impacted a number of units that continued to report forced outages into 2013 and 2014. Table C.5 lists the recurring cause codes and number of years that the cause code appears in the top 10.
Table C.5: Recurring Top 10 Cause Codes
Code Description Number of Years in Top 10
Causes
1000 Waterwall (Furnace wall) 4
3620 Main Transformer 4
4520 Stator Windings, Bushings, and Terminals 3
9000 Flood 2
9500 Regulatory Proceedings and Hearings 2
4400 Major Turbine Overhaul (720 Hrs. Or Longer) 2
4511 Rotor - General 2
The waterwall outages would generally be expected given the amount of steam generation in the fleet. These failures are not an uncommon occurrence in normal operations. Main Transformer outages are also high on the list. This is likely a result of the long lead time to replace a failed generator step up transformer. While the failure rate is very low, the impact is high for main transformers.

NERC | State of Reliability | May 2016 123
Appendix D – Analysis of Demand Response Data
Overview In 2015, the DADS Working Group (DADSWG) continued efforts to improve data collection and reporting. A significant achievement from 2015 is the development and approval of four DADS metrics. Future DADSWG efforts are focused on improving data collection, maintaining data quality, and providing observations of possible demand response contributions to reliability.
Demand Response Programs Demand Response Registered Program data provides important information about the individual programs that include product type, service type, relationships to other entities and programs, and monthly registered capacities. The DADS data is reported semiannually as summer and winter seasons, with the summer season representing program data from April 1 through September 30 and the winter season representing program data from October 1 to March 31 of the following year.
Registered Capacity Figure D.1 represents the registered capacity MW for all demand response registered programs in NERC. While it appears that the total registered capacity is increasing slightly annually in both summer (two percent to 10 percent) and winter (four percent), it is important to note that the demand response registered capacity is considered fungible (e.g., resources and associated capacities are interchangeable). For example, an entity’s reported demand response program may be an aggregation of individual resources and each year the individual resources could be from different sources and programs.
Figure D.1: Registered Demand Response Capacity MW for all Registered Programs Aug. /Jan. 2013–2015
Product and Service Type The webDADS portal collects information about demand response programs based on product type and product service type. Current product types in webDADS include Energy, Capacity, and Reserves. Figure D.2 shows the registered capacity MW of demand response across NERC for Summer 2013–2015 and Winter 2013–2015 by reported product and service type.

Appendix D – Analysis of Demand Response Data
NERC | State of Reliability | May 2016 124
While three years does not provide enough data to establish a trend, the data provides an encouraging narrative regarding the capacity MW registered for each service type. Since 2013 the majority of registered capacity has been reported for the product type of Capacity, further the majority of that capacity is designated as service type Load as a Capacity Resource. This type of product and service type is considered the “base load” resource for demand response and can be described as the most dependable when called on to respond.
Figure D.2: Registered Demand Response Capacity MW for all Product and Service Types Summer and Winter 2013–2015
Demand Response—Reliability Events Demand response programs are deployed by system operators that are monitoring conditions on the grid. Demand response program rules may require advanced notification for the deployment of these resources that can be several hours ahead of when the emergency condition actually occurs. As the potential for the emergency condition approaches, many operators have more responsive demand response resources that may be deployed with as little of 10 minutes of notification to ramp and curtail load. Reliability event reasons reported and summarized in DADS are categorized as one of three types of events where demand response supports the BPS: Forecast or Actual Reserve Shortage, Reliability Event, and Frequency Control.
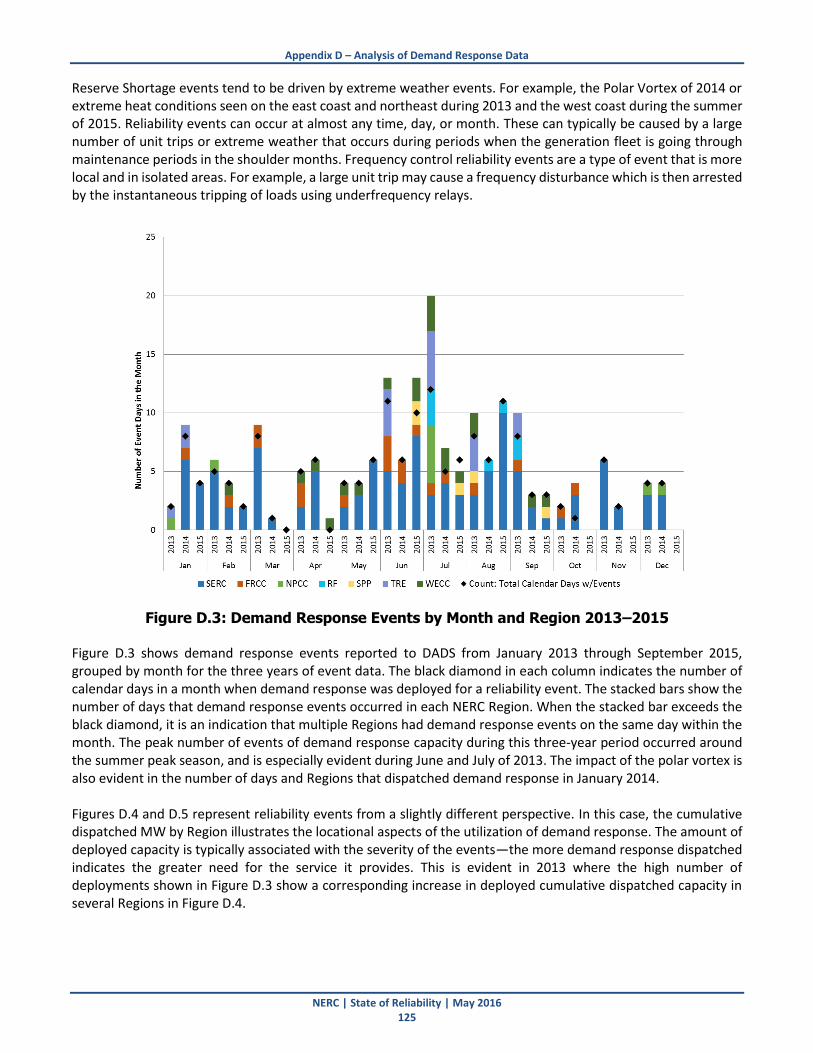
Appendix D – Analysis of Demand Response Data
NERC | State of Reliability | May 2016 125
Reserve Shortage events tend to be driven by extreme weather events. For example, the Polar Vortex of 2014 or extreme heat conditions seen on the east coast and northeast during 2013 and the west coast during the summer of 2015. Reliability events can occur at almost any time, day, or month. These can typically be caused by a large number of unit trips or extreme weather that occurs during periods when the generation fleet is going through maintenance periods in the shoulder months. Frequency control reliability events are a type of event that is more local and in isolated areas. For example, a large unit trip may cause a frequency disturbance which is then arrested by the instantaneous tripping of loads using underfrequency relays.
Figure D.3: Demand Response Events by Month and Region 2013–2015 Figure D.3 shows demand response events reported to DADS from January 2013 through September 2015, grouped by month for the three years of event data. The black diamond in each column indicates the number of calendar days in a month when demand response was deployed for a reliability event. The stacked bars show the number of days that demand response events occurred in each NERC Region. When the stacked bar exceeds the black diamond, it is an indication that multiple Regions had demand response events on the same day within the month. The peak number of events of demand response capacity during this three-year period occurred around the summer peak season, and is especially evident during June and July of 2013. The impact of the polar vortex is also evident in the number of days and Regions that dispatched demand response in January 2014. Figures D.4 and D.5 represent reliability events from a slightly different perspective. In this case, the cumulative dispatched MW by Region illustrates the locational aspects of the utilization of demand response. The amount of deployed capacity is typically associated with the severity of the events—the more demand response dispatched indicates the greater need for the service it provides. This is evident in 2013 where the high number of deployments shown in Figure D.3 show a corresponding increase in deployed cumulative dispatched capacity in several Regions in Figure D.4.

Appendix D – Analysis of Demand Response Data
NERC | State of Reliability | May 2016 126
Figure D.4: Cumulative Dispatched MW by Region for Summer Demand Response Events
2013–2015
Figure D.5: Cumulative Dispatched MW for Winter Demand Response Events, 2013—2015

Appendix D – Analysis of Demand Response Data
NERC | State of Reliability | May 2016 127
Figures D.6 and D.7 show the cumulative amount of capacity deployed by the duration of the events. The majority of the dispatched MW during the 2014 and 2015 years are in events lasting less than 60 minutes. Deployments associated with the heat wave over the East Coast and Northeast during the summer of 2013 tended to show much longer deployments, typically lasting four hours or more. Similarly, the events during the polar vortex phenomenon were much longer and extended over a broader stretch of Southeast United States. The frequency at which demand response is deployed may be a function of the demand response program’s design and not an indication of extensive reliability issues in a Region. For example, as shown in Figure C.3 note that in the SERC Region, demand response was deployed nearly every month during the analysis period. When viewed by event duration, the number of dispatched MW for these events shows that these deployments predominantly last for less than one hour.
Figure D.6: Cumulative Dispatched MW by Duration for Summer Demand Response Events,
2013–2015 Setting aside the events with a duration of less than one hour, the Summer of 2013 stands out as a year when more demand response was deployed for reliability than the combined deployments of the other two years in the analysis period due to the hot weather across the country. For winter, demand response was dispatched more during the Winter of 2014 and for longer durations due to the extreme polar vortex phenomenon than during the other winter periods in the analysis period (Figure D.7).
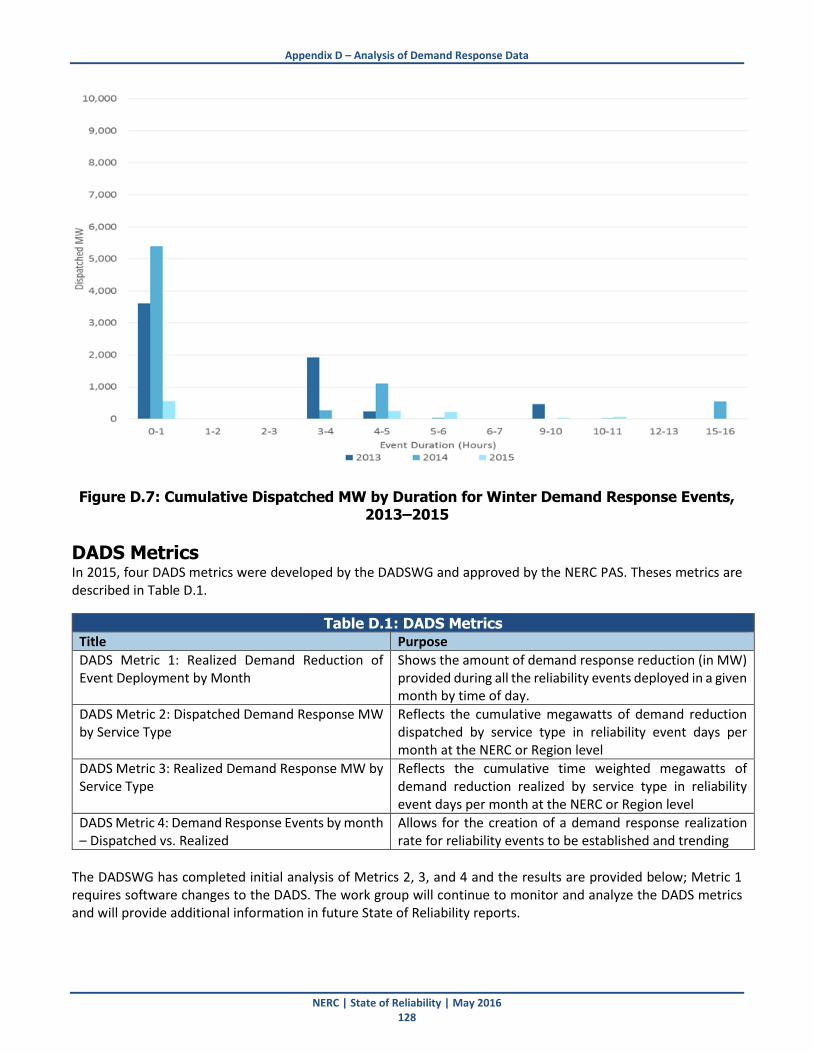
Appendix D – Analysis of Demand Response Data
NERC | State of Reliability | May 2016 128
Figure D.7: Cumulative Dispatched MW by Duration for Winter Demand Response Events, 2013–2015
DADS Metrics In 2015, four DADS metrics were developed by the DADSWG and approved by the NERC PAS. Theses metrics are described in Table D.1.
Table D.1: DADS Metrics Title Purpose
DADS Metric 1: Realized Demand Reduction of Event Deployment by Month
Shows the amount of demand response reduction (in MW) provided during all the reliability events deployed in a given month by time of day.
DADS Metric 2: Dispatched Demand Response MW by Service Type
Reflects the cumulative megawatts of demand reduction dispatched by service type in reliability event days per month at the NERC or Region level
DADS Metric 3: Realized Demand Response MW by Service Type
Reflects the cumulative time weighted megawatts of demand reduction realized by service type in reliability event days per month at the NERC or Region level
DADS Metric 4: Demand Response Events by month – Dispatched vs. Realized
Allows for the creation of a demand response realization rate for reliability events to be established and trending
The DADSWG has completed initial analysis of Metrics 2, 3, and 4 and the results are provided below; Metric 1 requires software changes to the DADS. The work group will continue to monitor and analyze the DADS metrics and will provide additional information in future State of Reliability reports.

Appendix D – Analysis of Demand Response Data
NERC | State of Reliability | May 2016 129
DADS Metric 2 The amount and types of demand response dispatched by year illustrates how much weather can affect the deployment of demand response. Figure D.8 shows the cumulative dispatched MW of demand response by service type. During the Summer of 2013, the cumulative amount of demand response deployed over all events was nearly 20,000 MW, with over 70 percent of the demand response dispatched from Load as a Capacity Resource and nearly equal amounts of Direct Load Control and Interruptible Load. The summers of 2014 and 2015 were much milder, resulting in few deployments and more conservative utilization of demand response, primarily from Direct Load Control and Interruptible Load.
Figure D.8: Cumulative Dispatched MW by Service Type for Summer Demand Response Events, 2013–2015
Winter deployments of demand response are much less extensive as reflected in the cumulative MW dispatched each winter in the analysis period (Figure D.9). Deployments during the analysis period were primarily to demand response provided from Interruptible Load resources. During the winters of 2013 and 2014, demand response providing reserves (spinning and non-spinning) accounted for almost one-third of the cumulative dispatched MW each year.

Appendix D – Analysis of Demand Response Data
NERC | State of Reliability | May 2016 130
Figure D.9: Cumulative Dispatched MW by Service Type for Winter Demand Response Events, 2013–2015
DADS Metric 3 Figures D.10 and D.11 report the performance of demand response resources based on service type for summer and winter, respectively. The average hourly response is calculated for each event as the sum of reported response divided by the number of dispatched hours reported with the event.

Appendix D – Analysis of Demand Response Data
NERC | State of Reliability | May 2016 131
Figure D.10: Cumulative Realized Demand Reduction MW by Service Type for Summer
Demand Response Events, 2013–2015

Appendix D – Analysis of Demand Response Data
NERC | State of Reliability | May 2016 132
Figure D.11: Cumulative Realized Demand Reduction MW by Service Type for Summer Demand Response Events, 2013–2015
DADS Metric 4 The effectiveness of demand response to support reliability is illustrated by a comparison of the cumulative dispatched MW to the average realized reduction MW each season and year. The following charts (Figure D.12 and D.13) show the cumulative dispatched MW and corresponding performance of all demand response types deployed in a season for each year of the analysis period. During the Summer of 2013, demand response performed at 82 percent of its committed capacity (Figure D.12). This includes the deployment of Voluntary and Emergency types of demand response, which typically performs at a much lower rate (about 20 percent of registered) than other categories of demand response. Performance during the summers of 2014 and 2015 was well above 90 percent, due to the amount and types of demand response deployed.

Appendix D – Analysis of Demand Response Data
NERC | State of Reliability | May 2016 133
Figure D.12: Realized Demand Reduction for Summer Demand Response Events 2013–2015
As previously stated, fewer MW of demand response were deployed in the winter seasons. Performance exceeded 96 percent during events in the winters of 2013 and 2014, and 90 percent in 2015 (Figure D.13).

Appendix D – Analysis of Demand Response Data
NERC | State of Reliability | May 2016 134
Figure D.13: Realized Demand Reduction for Winter Demand Response Events, 2013–2015
Looking Ahead The DADSWG is focused on improving the quality of the demand response data collected by NERC, which will provide a better perspective on how this type of resource is being used to support reliability. To achieve this objective, the following initiatives are planned for 2016 and beyond:
Development of additional metrics, as appropriate, to provide information on the changing utilization of demand response
Improvements to the DADS application to better support data reporting capabilities for market-based demand response programs that support reliability
Development of training materials to improve data quality
Definition of requirements for automated reports in the DADS application to allow for dashboard information to be provided to the NERC website
Review/Update of DADSWG scope and web pages

NERC | State of Reliability | May 2016 135
Appendix E – Reliability Indicator Trends
M-4 Interconnection Frequency Response Background Stable frequency is a key ALR performance outcome. Frequency response is essential in supporting frequency during disturbances that result in large frequency deviations, as well as during system restoration efforts. Frequency response (primary frequency control) is comprised of the actions provided by the interconnection to arrest and stabilize frequency in response to those frequency deviations. Frequency response comes from automatic generator governor response, load response (typically from motors), and devices that provide an immediate response based on locally detected changes in frequency by device-level control systems. The purpose of this metric is to monitor frequency response trends for each interconnection so that adequate primary frequency control is provided to arrest and stabilize frequency during extreme frequency events and avoid tripping the first stage of UFLS for each interconnection. The IFRO is intended to be the minimum amount of frequency response that must be maintained by an interconnection and is reviewed and determined annually in the Frequency Response Annual Analysis. Each IFRO is intended to be the minimum amount of frequency response that must be maintained by an interconnection and is reviewed and determined annually in the Frequency Response Annual Analysis. Authority in the interconnection is allocated a portion of the IFRO that represents its minimum responsibility in accordance with Reliability Standard BAL-003-1. The analysis in this chapter shows how the events resulting in the minimum frequency response compare with the IFRO. Figure E.1 illustrates a frequency deviation due to a loss of generation resource and the methodology for calculating frequency response. The event starts at time t±0. Value A is the average frequency from t-16 to t-2 seconds with Value B being the average from t+20 to t+52 seconds. The difference of value A and B is the change in frequency used for calculating frequency response. Frequency response is the absolute value of the ratio of the megawatts lost when a generation resource trips and the difference in frequency before and after the event. A large absolute value of frequency response, measured in MW/0.1Hz, is better than a small value.
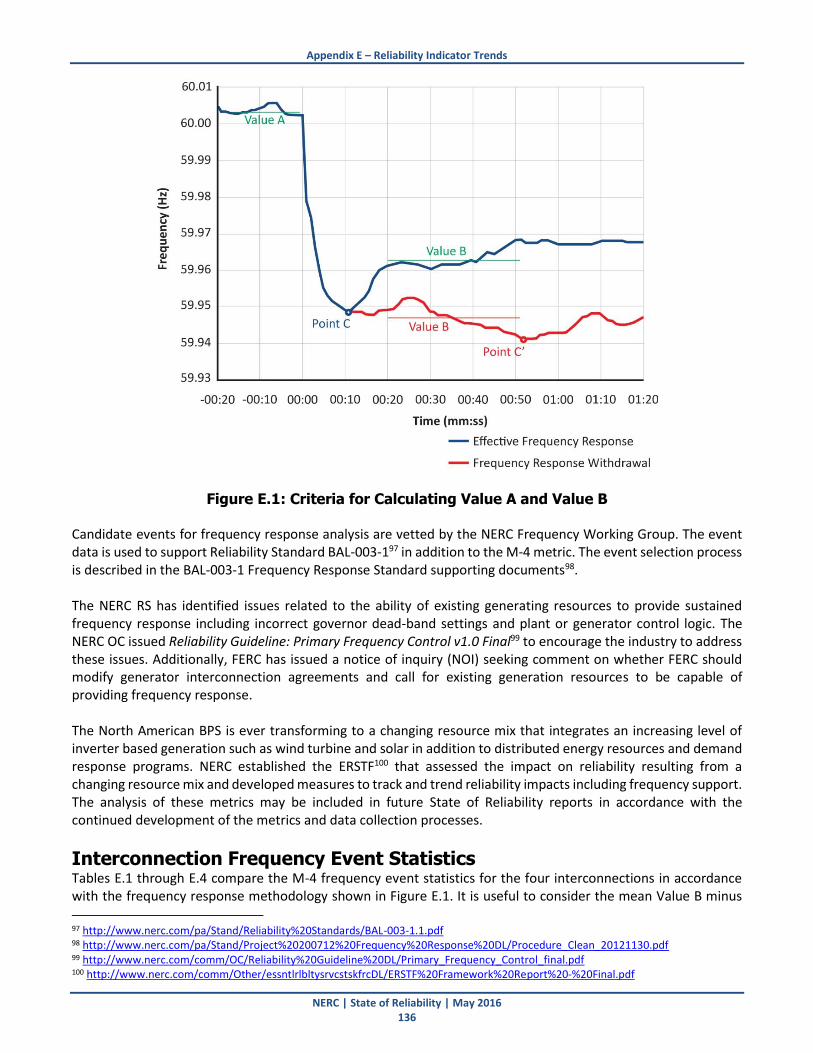
Appendix E – Reliability Indicator Trends
NERC | State of Reliability | May 2016 136
Figure E.1: Criteria for Calculating Value A and Value B Candidate events for frequency response analysis are vetted by the NERC Frequency Working Group. The event data is used to support Reliability Standard BAL-003-197 in addition to the M-4 metric. The event selection process is described in the BAL-003-1 Frequency Response Standard supporting documents98. The NERC RS has identified issues related to the ability of existing generating resources to provide sustained frequency response including incorrect governor dead-band settings and plant or generator control logic. The NERC OC issued Reliability Guideline: Primary Frequency Control v1.0 Final99 to encourage the industry to address these issues. Additionally, FERC has issued a notice of inquiry (NOI) seeking comment on whether FERC should modify generator interconnection agreements and call for existing generation resources to be capable of providing frequency response. The North American BPS is ever transforming to a changing resource mix that integrates an increasing level of inverter based generation such as wind turbine and solar in addition to distributed energy resources and demand response programs. NERC established the ERSTF100 that assessed the impact on reliability resulting from a changing resource mix and developed measures to track and trend reliability impacts including frequency support. The analysis of these metrics may be included in future State of Reliability reports in accordance with the continued development of the metrics and data collection processes.
Interconnection Frequency Event Statistics Tables E.1 through E.4 compare the M-4 frequency event statistics for the four interconnections in accordance with the frequency response methodology shown in Figure E.1. It is useful to consider the mean Value B minus 97 http://www.nerc.com/pa/Stand/Reliability%20Standards/BAL-003-1.1.pdf 98 http://www.nerc.com/pa/Stand/Project%20200712%20Frequency%20Response%20DL/Procedure_Clean_20121130.pdf 99 http://www.nerc.com/comm/OC/Reliability%20Guideline%20DL/Primary_Frequency_Control_final.pdf 100 http://www.nerc.com/comm/Other/essntlrlbltysrvcstskfrcDL/ERSTF%20Framework%20Report%20-%20Final.pdf

Appendix E – Reliability Indicator Trends
NERC | State of Reliability | May 2016 137
Point C to observe whether the interconnection exhibits frequency response withdrawal characteristics. It is also useful to consider the mean and minimum Point C values in relation to the interconnection first step UFLS relay settings.
Table E.1: Frequency Event Statistics for Eastern Interconnection
Operating Year
Number of
Events
Mean Value A
(Hz)
Mean Pt C (Hz)
Mean Value B
(Hz)
Mean B-C
Margin (Hz)
Minimum Pt C (Hz)
Mean Pt C-UFLS
Margin (mHz)
Minimum Pt C-UFLS
Margin (mHz)
2012 10 60.001 59.948 59.946 -0.002 59.937 0.448 0.437
2013 32 60.000 59.950 59.948 -0.001 59.909 0.450 0.409
2014 34 59.996 59.947 59.949 0.001 59.947 0.447 0.410
2015 36 59.996 59.948 59.950 0.002 59.928 0.448 0.428
Table E.1 shows that the Eastern Interconnection continues to exhibit frequency response withdrawal characteristics despite slight improvements over the past three years as seen by the mean B–C margins for all frequency events. The delayed recovery increases the risk that a subsequent contingency could occur from a lower starting frequency during that period. For frequency events in the 2015 operating year the lowest frequency nadir was within 428 mHz of the first-step UFLS settings of 59.5 Hz101.
Table E.2: Frequency Event Statistics for ERCOT Interconnection
Operating Year
Number of
Events
Mean Value A
(Hz)
Mean Pt C (Hz)
Mean Value B
(Hz)
Mean B-C
Margin (Hz)
Minimum Pt C (Hz)
Mean Pt C-UFLS
Margin (Hz)
Minimum Pt C-UFLS
Margin (Hz)
2012 46 59.995 59.825 59.872 0.047 59.732 0.525 0.429
2013 40 59.997 59.836 59.896 0.061 59.729 0.536 0.432
2014 33 59.997 59.858 59.905 0.047 59.744 0.558 0.444
2015 34 59.999 59.866 59.912 0.046 59.728 0.566 0.428
Table E.2 shows that in the ERCOT Interconnection for frequency events in the 2015 operating year the lowest frequency nadir was within 428 mHz of the first step UFLS settings of 59.3 Hz.
101 The highest UFLS setpoint in the Eastern Interconnection is 59.7 Hz in FRCC, based on internal stability concerns. The FRCC concluded that the IFRO starting frequency of the prevalent 59.5 Hz for the Eastern Interconnection is acceptable in that it imposes no greater risk of UFLS operation in FRCC for an external resource loss event than for an internal FRCC event.

Appendix E – Reliability Indicator Trends
NERC | State of Reliability | May 2016 138
Table E.3: Frequency Event Statistics for Québec Interconnection
Operating Year
Number of
Events
Mean Value A
(Hz)
Mean Pt C (Hz)
Mean Value B
(Hz)
Mean B-C
Margin (Hz)
Minimum Pt C (Hz)
Mean Pt C-UFLS
Margin (Hz)
Minimum Pt C-UFLS
Margin (Hz)
2012 25 60.005 59.702 59.915 0.213 58.792 1.202 0.292
2013 35 59.996 59.566 59.869 0.303 58.868 1.066 0.368
2014 33 60.006 59.695 59.909 0.214 58.986 1.195 0.486
2015 29 60.003 59.709 59.919 0.210 59.273 1.209 0.773
Table E.3 shows that in the Québec Interconnection the minimum margin between the interconnection’s Point C frequency nadir and first step UFLS settings of 58.5 Hz have increased each year from 2013–2015. For frequency events in the 2015 operating year the lowest frequency nadir was within 773 mHz of the first UFLS settings.
Table E.4: Frequency Event Statistics for Western Interconnection
Operating Year
Number of
Events
Mean Value A
(Hz)
Mean Pt C (Hz)
Mean Value B
(Hz)
Mean B-C
Margin (Hz)
Minimum Pt C (Hz)
Mean Pt C-UFLS
Margin (Hz)
Minimum Pt C-UFLS
Margin (Hz)
2012 5 60.010 59.906 59.939 0.033 59.880 0.406 0.380
2013 13 59.993 59.887 59.924 0.037 59.843 0.387 0.343
2014 17 60.001 59.880 59.917 0.036 59.671 0.380 0.171
2015 21 59.998 59.903 59.934 0.032 59.845 0.403 0.345
Table E.4 shows the Western Interconnection frequency response characteristics. In the 2014 operating year the Western Interconnection experienced a deliberate trip of 2806 MW of generation through a RAS to relieve stress on the transmission system. This resulted in a frequency decline that came within 171 mHz of the first step of UFLS relay settings of 59.5 Hz. The minimum margin in 2015 was 345 mHz.
Interconnection Frequency Response: Time Trends The time trend analyses uses the interconnection frequency response (FR) datasets for the 2012–2015 operating years. In this section, relationships between FR and the explanatory variable T (time = year, month, day, hour, minute, second) are studied. Figures E.2 through E.5 show the interconnection FR scatter plots with a linear regression trend line, the 95 percent confidence interval for the data, and the 95 percent confidence interval for the slope of the time trend line.
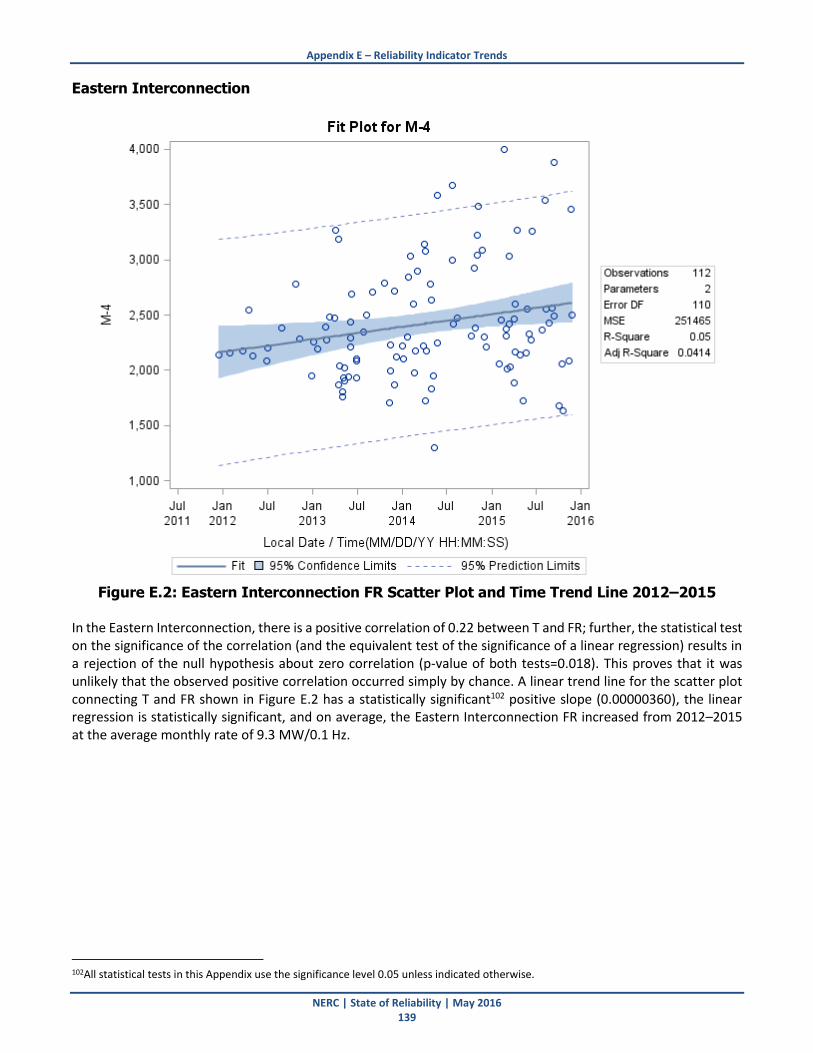
Appendix E – Reliability Indicator Trends
NERC | State of Reliability | May 2016 139
Eastern Interconnection
Figure E.2: Eastern Interconnection FR Scatter Plot and Time Trend Line 2012–2015
In the Eastern Interconnection, there is a positive correlation of 0.22 between T and FR; further, the statistical test on the significance of the correlation (and the equivalent test of the significance of a linear regression) results in a rejection of the null hypothesis about zero correlation (p-value of both tests=0.018). This proves that it was unlikely that the observed positive correlation occurred simply by chance. A linear trend line for the scatter plot connecting T and FR shown in Figure E.2 has a statistically significant102 positive slope (0.00000360), the linear regression is statistically significant, and on average, the Eastern Interconnection FR increased from 2012–2015 at the average monthly rate of 9.3 MW/0.1 Hz.
102All statistical tests in this Appendix use the significance level 0.05 unless indicated otherwise.

Appendix E – Reliability Indicator Trends
NERC | State of Reliability | May 2016 140
ERCOT Interconnection
Figure E.3: ERCOT Interconnection Frequency Response Scatter Plot and Time Trend Line 2012–2015
In the ERCOT Interconnection there is a positive correlation of 0.33 between T and FR; further, the statistical test on the significance of the correlation (and the equivalent test of the significance of a linear regression) results in a rejection of the null hypothesis about zero correlation at a standard significance level (p-value of both tests is below 0.0001). This proves that it was very unlikely that the observed positive correlation occurred simply by chance. A linear trend line for the scatter plot connecting T and FR shown in Figure E.2 has a positive slope (0.00000189), the linear regression is highly statistically significant, and on average, the ERCOT Interconnection FR grew from 2012–2015 at the monthly rate of 4.9 MW/0.1 Hz.

Appendix E – Reliability Indicator Trends
NERC | State of Reliability | May 2016 141
Québec Interconnection
Figure E.4: Québec Interconnection Frequency Response Scatter Plot and Time Trend Line 2012—2015
In the Québec Interconnection there is a negative correlation of -0.26 between T and FR; further, the statistical test on the significance of the correlation (and the equivalent test of the significance of a linear regression) results in a rejection of the null hypothesis about zero correlation (p-value of both tests is below 0.005). This proves that it was very unlikely that the observed negative correlation occurred simply by chance. A linear trend line for the scatter plot connecting T and FR shown in Figure E.4 has a statistically significant negative slope (-0.00000171), the linear regression is statistically significant, and on average, the Québec Interconnection FR decreased from 2012–2015 at the average monthly rate of 4.3 MW/0.1 Hz.

Appendix E – Reliability Indicator Trends
NERC | State of Reliability | May 2016 142
Western Interconnection
Figure E.5: Western Interconnection Frequency Response Scatter Plot and Time Trend Line 2012–2015
In the Western Interconnection there is a negative correlation of -0.04 between T and FR; however, the statistical test on the significance of the correlation (and the equivalent test of the significance of a linear regression) fails to reject the null hypothesis about zero correlation at a standard significance level (p value of both tests is 0.80). This result leads to the conclusion that the negative correlation very likely have occurred simply by chance. It implies that even though a linear trend line for the scatter plot connecting T and FR shown in Figure E.5 has a negative slope (-0.000000279), the linear regression is not statistically significant, and on average, the Western Interconnection FR has been stable from 2012–2015.
Interconnection Frequency Response: Year-to-Year Changes The analyses of changes by year use the interconnection FR datasets from the 2012–2015 operating years. The sample statistics by year are listed in Tables E.5 through E.9. The last column lists the number of FR events that fell below the absolute IFRO.103 Figures E.6 through E.9 show the box and whisker plots of the annual distribution of the interconnection’s FR. The box encloses the interquartile range with the lower edge at the first (lower) quartile and the upper edge at the
103 http://www.nerc.com/FilingsOrders/us/NERC Filings to FERC DL/Final_Info_Filing_Freq_Resp_Annual_Report_03202015.pdf

Appendix E – Reliability Indicator Trends
NERC | State of Reliability | May 2016 143
third (upper) quartile. The horizontal line drawn through the box is the second quartile or the median. The lower whisker is a line from the first quartile to the smallest data point within 1.5 interquartile ranges from the first quartile. The upper whisker is a line from the third quartile to the largest data point within 1.5 interquartile ranges from the third quartile. The data points beyond the whiskers represent outliers, or data points more than or less than 1.5 times the upper and lower quartiles, respectively. The diamonds represent the mean.
Eastern Interconnection
Table E.5: Sample Statistics for Eastern Interconnection
Operating Year
Number of
Events
Mean of Frequency Response
Standard Dev. of
Frequency Response
Median Minimum Maximum
IFRO for the
Operating Year
Number of events with
FR below the IFRO
2012-2015
112 2,424 512 2,304 1,300 3,997 N/A 0
2012 10 2,288 223 2,187 2,081 2,783 1,002 0
2013 32 2,239 384 2,201 1,707 3,264 1,002 0
2014 34 2,579 557 2,535 1,300 3,673 1,014 0
2015 36 2,480 577 2,372 1,636 3,997 1,014 0
Table E.5 and Figure E.6 illustrate Eastern Interconnection year-to year changes in the average and median FR as well as in its variation.
Figure E.6: Eastern Interconnection Frequency Response Distribution by Operating Year 2012–2015
Fisher’s Least Significant Difference test was used to analyze all pair-wise changes in the mean FR, and the test on the equality of variances to analyze changes in variance (and, thus, in the standard deviation). There was a statistically significant increase in both the mean frequency response and the variance of frequency response in

Appendix E – Reliability Indicator Trends
NERC | State of Reliability | May 2016 144
2014 vs. 2013 and in 2015 vs. 2013 operating years; no other significant change was found (a very small number of events in the 2012 operating year that does not allow for a reliable statistical comparison with other years). For the 2015 operating year frequency events the minimum frequency response of 1636 MW/0.1Hz was 61.3 percent above the IFRO with the event resulting in a C point frequency nadir within 460 mHz of the interconnection first step UFLS setting from a starting frequency of 60.005 Hz.
ERCOT Interconnection
Table E.6: Sample Statistics for ERCOT Interconnection
Operating Year
Number of
Events
Mean of Frequency Response
Standard Dev. of
Frequency Response
Median Minimum Maximum
IFRO for the
Operating Year
Number of events with
FR below the IFRO
2012-2015
153 690 215 657 337 1,628 N/A 1
2012 46 562 136 541 337 949 286 0
2013 40 752 218 705 407 1,354 286 0
2014 33 727 246 720 426 1,628 413 0
2015 34 756 197 722 469 1,316 471 1
Figure E.7 shows the box plot of the annual distribution of the ERCOT FR. Table E.2 and Figure E.6 illustrate year-to year changes in the average and median FR as well as in its variation.
E.7: ERCOT Frequency Response Distribution by Operating Year 2012–2015 Fisher’s Least Significant Difference test was used to analyze all pair-wise changes in the mean FR, and the test on the equality of variances to analyze changes in variance (and, thus, in the standard deviation). Levene’s and Brown-Forsythe’s tests for homogeneity of variance detected no statistically significant changes in annual variances; the mean FR in 2013, 2014 and 2015 operating years was significantly better than in the 2012. These results corroborate an observation on the improving frequency response trend in ERCOT. For 2015 operating year

Appendix E – Reliability Indicator Trends
NERC | State of Reliability | May 2016 145
frequency events the minimum frequency response of 469 MW/0.1Hz was 0.5 percent below the IFRO with the event resulting in a C point frequency nadir within 559 mHz of the interconnection first step UFLS setting from a starting frequency of 60.012 Hz. It should be noted that the minimum frequency response event occurred while the interconnection had load resources of 1379 MW. Load resources are contracted reserves set to trip by relay at 59.700 Hz. The State of Reliability report for operating year 2015 used 909 MW of load resources when determining the IFRO of 471. The additional load resources of 470 MW more than adequately supplemented the 2 MW/0.1 Hz shortfall in FR during this event.
Québec Interconnection
Table E.7: Sample Statistics for Québec Interconnection
Operating Year
Number of
Events
Mean of Frequency Response
Standard Dev. of
Frequency Response
Median Minimum Maximum
IFRO for the
Operating Year
Number of events with
FR below the IFRO
2012-2015
122 610 230 551 288 1,674 N/A 0
2012 25 690 299 635 371 1,674 179 0
2013 35 624 188 596 389 1,228 179 0
2014 33 555 236 469 288 1,231 180 0
2015 29 586 190 532 320 1,167 183 0
Figure E.7 shows the box plot of the annual distribution of the Québec Interconnection FR. Table E.3 and Figure E.7 illustrate year-to year changes in the average and median FR as well as in its variation.
Figure E.8: Québec Interconnection Frequency Response Distribution by Operating Year 2012–2015
Fisher’s Least Significant Difference test was used to analyze all pair-wise changes in the mean FR, and the test on the equality of variances to analyze changes in variance (and, thus, in the standard deviation). Levene’s and Brown-Forsythe’s tests for homogeneity of variance detected no statistically significant changes in annual variances.

Appendix E – Reliability Indicator Trends
NERC | State of Reliability | May 2016 146
Fisher’s Least Significant Difference test found only one statistically significant change in the mean FR; a decrease in 2014 vs. 2012. In the 2015 operating year mean FR increased but not significantly, and the increase was not big enough to change the overall decreasing trend for the Québec Interconnection FR. For 2015 M4 frequency events the minimum frequency response of 320 MW/0.1Hz was 74.9 percent above the IFRO with the event resulting in a C point frequency nadir within 773 mHz of the interconnection first step UFLS setting from a starting frequency of 60.006 Hz.
Western Interconnection
Table E.8: Sample Statistics for Western Interconnection
Operating Year
Number of
Events
Mean of Frequency Response
Standard Dev. of
Frequency Response
Median Minimum Maximum
IFRO for the
Operating Year
Number of events with
FR below the IFRO
2012-2015
56 1,344 251 1,323 822 2,099 N/A 2
2012 5 1,388 300 1,267 1,184 1,918 840 0
2013 13 1,374 251 1,463 822 1,645 840 1
2014 17 1,289 228 1,266 905 1,743 949 1
2015 21 1,361 269 1,349 1,008 2,099 906 0
Figure E.9 shows the box plot of the annual distribution of the Western Interconnection FR.
Figure E.9: Western Interconnection Frequency Response Distribution by Year 2012–2015 Fisher’s Least Significant Difference test was used to analyze all pair-wise changes in the mean FR, and the test on the equality of variances to analyze changes in variance. There were no statistically significant differences in the expected FR and variances by year. In particular, this is due to too small of a sample size for 2012. For 2015 M4 frequency events the minimum frequency response of 1008 MW/0.1Hz was 11.2 percent above the IFRO with the event resulting in a C point frequency nadir within 408 mHz of the interconnection first step UFLS setting from a starting frequency of 60.011 Hz.

Appendix E – Reliability Indicator Trends
NERC | State of Reliability | May 2016 147
Interconnection Frequency Response: Analysis of Distribution Eastern Interconnection Figure E.10 shows the histogram of the Eastern Interconnection FR for the 2012–2015 operating years based on the 112 observations of M-4. This is a right-skewed distribution with the median of 2304 MW/0.1 Hz, the mean of 2424 MW/0.1 Hz, and the standard deviation of 512 MW/0.1 Hz. It’s important to note that there is a difference between the observed frequency response for a given event in the Eastern Interconnection and the amount of response that was actually available at that instant. Observed response depends heavily on starting frequency as well as the size of the resource loss.
Figure E.10: Histogram of the Eastern Interconnection Frequency Response 2012–2015 Kolmogorov-Smirnov Goodness-of-Fit test showed that a lognormal distribution can be an acceptable approximation for the Eastern Interconnection FR distribution for the four years (though p-value of 0.08 is small, a lognormal provides a best fit among the “table” distributions). The parameters of this lognormal distribution are: the threshold=669.5, the scale=7.4, and the shape=0.28. The probability density function of the fitted distribution is shown in Figure E.10 as a green curve.

Appendix E – Reliability Indicator Trends
NERC | State of Reliability | May 2016 148
ERCOT Figure E.11 shows the histogram of the ERCOT Interconnection FR for the 2012–2015 operating years based on the 153 observations of M-4. This is a right-skewed distribution with the median of 657 MW/0.1 Hz, the mean of 690 MW/0.1 Hz and the standard deviation of 215 MW/0.1 Hz.
Figure E.11: Histogram of the ERCOT Interconnection Frequency Response 2012–2015
The Kolmogorov-Smirnov, Cramer-von Mises, and Anderson-Darling Goodness-of-Fit tests showed that a lognormal distribution can be a good approximation for the ERCOT FR distribution for the four years (p-values are 0.17, greater than 0.25 and greater than 0.25, respectively). The parameters of this lognormal distribution are: the threshold=211.7, the scale=6.1, and the shape=0.43. The probability density function of the fitted distribution is shown in Figure E.11 as a green curve.

Appendix E – Reliability Indicator Trends
NERC | State of Reliability | May 2016 149
Québec Interconnection Figure E.12 shows the histogram of the Québec Interconnection FR for the 2012-2015 operating years based on the 122 observations of M-4. This is a right-skewed distribution with the median of 551 MW/0.1 Hz, the mean of 610 MW/0.1 Hz, and the standard deviation of 230 MW/0.1 Hz.
Figure E.12: Histogram of the Québec Interconnection Frequency Response 2012–2015
Kolmogorov-Smirnov, Cramer-von Mises and Anderson-Darling Goodness-of-Fit tests showed that a lognormal distribution can be a good approximation for the Québec Interconnection FR distribution for the four years (all p-values are greater than 0.50). The parameters of this lognormal distribution are: the threshold=230.9, the scale=5.8, and the shape=0.56. The probability density function of the fitted distribution is shown in Figure E.12 as a green curve.

Appendix E – Reliability Indicator Trends
NERC | State of Reliability | May 2016 150
Western Interconnection Figure E.13 shows the histogram of the Western Interconnection FR for the 2012-2015 operating years based on the 56 observations of M-4. This is a right-skewed distribution with the median of 1323 MW/0.1 Hz, the mean of 1344 MW/0.1 Hz, and the standard deviation of 251 MW/0.1 Hz.
Figure E.13: Histogram of the Western Interconnection Frequency Response 2012–2015
Kolmogorov-Smirnov, Cramer-von Mises and Anderson-Darling Goodness-of-Fit tests showed that a lognormal distribution, a Weibull distribution and a Gamma distribution can be a good approximation for the Western Interconnection FR distribution for the four years (p-values are greater 0.50 for all three distributions). The parameters of the lognormal distribution are: the threshold=195.6, the scale=7.0, and the shape=0.22; for the Weibull distribution are: the threshold=751.7, the scale=667.0, and the shape=2.52; for the Gamma distribution are: the threshold=311.6, the scale=60.1, and the shape=17.2. The probability density function of the fitted lognormal distribution is shown in Figure E.13 as a green curve.
Explanatory Variables for Frequency Response and Multiple Regression
Explanatory Variables In the 2013–2015 State of Reliability reports, NERC staff evaluated how specific indicators could be tied to severity of frequency deviation events. For this report, the set of explanatory variables that might affect the

Appendix E – Reliability Indicator Trends
NERC | State of Reliability | May 2016 151
interconnection FR is extended to 10 variables. These variables are not pair-wise uncorrelated, and some pairs are strongly correlated; however, all are included as candidates to avoid the loss of an important contributor to the FR variability. First, significant correlations between frequency response and explanatory variables are found, then a multiple (i.e., multivariate) regression model describing the frequency response with these explanatory variables as regressors is built for each interconnection. Model selection methods help ensure the removal of highly correlated regressors and run multicollinearity diagnostics (variance inflation diagnostics) for a multiple regression model selected. The Explanatory Variables included in this study are as follows: Time – A moment in time (year, month, day, hour, minute, second) when an FR event happened. Time is measured in seconds elapsed between midnight of January 1, 1960 (the time origin for the date format in SAS), and the time of a corresponding FR event. This is used to determine trends over the study period. Winter (Indicator Function) – Defined as one for FR events that occur from December through February, and zero otherwise. Spring (Indicator Function) – Defined as one for FR events that occur from March through May, and zero otherwise. Summer (Indicator Function) – Defined as one for FR events that occur from June through August, and zero otherwise. Fall (Indicator Function) – Defined as one for FR events that occur from September through November, and zero otherwise. On-peak Hours (Indicator Function) – Defined as one for FR events that occurred during on-peak hours, and zero otherwise. On-peak hours are designated as follows: Monday to Saturday from 0700–2200 (Central Time) excluding six holidays: New Year’s Day, Memorial Day, Independence Day, Labor Day, Thanksgiving Day, and Christmas Day. Pre-disturbance Frequency A – Value A as shown in Figure 4.3 (measured in Hz). Margin=C-UFLS – Difference between an event nadir, Point C, as shown in Figure 4.3 and the UFLS for a given interconnection. Measured in Hz. The UFLS values are listed in Table E.9. Interconnection Load Level – Measured in megawatts. Interconnection Load Change by Hour – Difference between Interconnection Load at the end of the hour and at the beginning of the hour during which the frequency event occurred. Measured in megawatts.
Table E.9: Underfrequency Load Shed
Interconnection Highest UFLS Trip Frequency
Eastern 59.5 Hz
ERCOT 59.3 Hz
Québec 58.5 Hz
Western 59.5 Hz
Renewable Generation by Type – WECC provided the 2013–2014 hourly data for renewable generation load level in the Western Interconnection by generation type (Hydro, Wind, and Solar). Correlation and regression analyses

Appendix E – Reliability Indicator Trends
NERC | State of Reliability | May 2016 152
were performed for the WI FR and the generation by each source and combined. No statistically significant correlation was detected which might be due to a very small sample size: there were only 33 events in the WI for the 2013–2014. However, this is an important first step in investigating an impact of the renewables on FR and NERC will pursue similar analyses for longer time periods as well as for other interconnections. ERCOT provided the 2012–2015 hourly data for wind generation load. No significant correlation between ERCOT frequency response and wind load by hour was detected even though the dataset has a sufficient size (114 events from 2012–2015). Note that wind is the only significant renewable source in ERCOT with the average hourly generation about 4600 MW in 2015 (for comparison, the solar is still less than 200 MW total installed capacity and the hydro is even smaller). Data Sets – Since the Interconnection Load Level data are available for the 2012–2014 years only, the correlation between FR and Interconnection Load and between FR and interconnection load change by hour is calculated based on the 2012–2014 data. Multivariate models with all explanatory variables as starting regressors are built for 2012–2014 data for each interconnection. The three-year data sets have insufficient sizes for a good explanatory and predictive model, which requires estimates of big number of parameters. An adequate model for each interconnection can only come with an annual increase of the FR data sets.
Summary of Correlation Analysis Table E.10 lists the ranks of statistically significant104 variables for frequency response in each interconnection. Positive indicates a statistically significant positive correlation. Negative indicates a statistically significant negative correlation. A Dash indicates no statistically significant linear relation.
Table E.10: Observation Summary
Explanatory Valuable Eastern ERCOT Québec Western
Time 4 (positive) 2 (positive) 3 (negative) -
Winter - - 2 (positive) -
Spring - - 6 (positive) -
Summer - - 5 (negative) -
Fall - - 7 (negative) -
Pre-disturbance frequency A (Hz) 1 (negative) 1 (negative) - -
Margin = C-UFLS (Hz) 2 (negative) - 4 (positive) -
On-Peak Hours - - - -
Interconnection Load - - 1 (positive) -
Interconnection Load Change by Hour
3 (positive) - - -
Statistically significant correlation between time and FR confirms an increasing trend for FR in the Eastern and ERCOT Interconnections and a decreasing trend in the Québec Interconnection. Pre-disturbance frequency has a statistically significant (and the strongest) impact to FR in the East and ERCOT. Low frequency events with starting frequency above 60 Hz (Value A) tend to have smaller FR since it is less likely that frequency will drop below the governor deadband setting. In the Québec Interconnection, seven variables are statistically significantly correlated with FR, Interconnection Load being the strongest (and positively correlated) regressor. Also, all four seasons have significant correlation with FR; thus, the expected FR is higher in winter and spring and lower in summer and fall.
104 At the significance level 0.1.

Appendix E – Reliability Indicator Trends
NERC | State of Reliability | May 2016 153
Other observations from the comparative analysis by interconnection are as follows:
As expected, with larger datasets and more variables included in the analysis, the explanatory power of the multivariate models improves. In the East, ERCOT, and Québec Interconnections these models can explain about 30 percent of the variability in the frequency response. In the Western Interconnection with the smallest dataset of 38 points, no adequate model is built, and none of the variables is significantly correlated with FR variable.
In all interconnection about 70 percent of the events occur during on-peak hours.
In the Eastern Interconnection spring had the most events (38 percent), and in the Québec Interconnection summer had almost half of all events (48 percent). In the other two interconnections events are rather evenly distributed by season.
In the Eastern and Western Interconnections a majority of events start with pre-disturbance frequency A<60 Hz, in the ERCOT and Québec Interconnection with A>60 Hz.
In the Québec and ERCOT Interconnections, more events occur when Interconnection Load Level decreases, in the Eastern and Western Interconnections when the load level increases (more than 70 percent of events in the Western Interconnection).
More details on the correlation analysis and multivariate models by Interconnection are given below.
Eastern Interconnection: Correlation Analysis and Multivariate Model Descriptive statistics for the ten explanatory variables and the Eastern Interconnection FR are listed in Table E.11.
Table E.11: Descriptive Statistics – Eastern Interconnection
Variable N Mean Standard
Dev. Minimum Maximum
Time 112 - - 12/1/2011 11/30/2015
Winter 112 0.21 0.41 0 1
Spring 112 0.38 0.49 0 1
Summer 112 0.20 0.40 0 1
Fall 112 0.21 0.41 0 1
A (Hz) 112 60.00 0.01 59.97 60.02
Margin=C-UFLS (Hz) 112 0.45 0.01 0.41 0.48
On-Peak Hours 112 0.68 0.47 0 1
Interconnection Load 78 344,352 52,653 239,623 492,462
Interconnection Load Change by Hour 78 1,097 10,312 -32,019 33,399
Frequency Response 112 2,424 512 1,300 3,997
Interconnection load and interconnection load change by hour data are available only for the 78 FR events that occurred from 2012–2014 operating years. Other data are available for all 112 events. The correlation and a single regression analysis result in the hierarchy of the explanatory variables for the Eastern Interconnection FR as shown in Table E.12. The value of a coefficient of determination R2 indicates the percentage in variability of FR that can be explained by variability of the corresponding explanatory variable.

Appendix E – Reliability Indicator Trends
NERC | State of Reliability | May 2016 154
Table E.12: Correlation and Regression Analysis – Eastern Interconnection
Explanatory Variable Correlation
with FR
Statistically Significant105
(Yes/No)
Coefficient of Determination of Single
Regression (If SS)
A (Hz) -0.51 Yes 25.7%
Margin=C-UFLS (Hz) -0.40 Yes 15.9%
Interconnection Load Change by Hour 0.23 Yes 5.1%
Time 0.22 Yes 5.0%
Spring -0.14 No N/A
Fall 0.13 No N/A
Interconnection Load -0.11 No N/A
Summer 0.08 No N/A
On-Peak Hours -0.08 No N/A
Winter -0.04 No N/A
Out of the ten explanatory variables, four have a statistically significant correlation with the Eastern Interconnection FR. Pre-disturbance frequency and margin are negatively correlated with FR. Thus, events with higher A have smaller expected FR; similarly, events with larger margin (and, therefore, higher nadir C) have statistically significantly smaller expected FR. Statistically significant positive correlation with interconnection load change by hour shows that the larger the change the higher FR. Note that the average load change for FR event is positive (1097 MW) with 55 percent of events occurred while load was increasing, and the rest when the load was decreasing. Statistically significant positive correlation between time and FR indicates an improvement of the expected FR in time. The other six variables do not have a statistically significant106 linear relationship with FR. Both step-wise selection and backward elimination algorithms result in a multiple regression model that connects the 2012–2014 Eastern Interconnection FR with time and the margin (the other variables are not selected or were eliminated by the algorithms).107 The model’s coefficients are listed in Table E.13.
Table E.13: Coefficients of Multiple Model – Eastern Interconnection
Variable DF Parameter Estimate
Standard Error
t-value p-value Variance Inflation
Value
Intercept 1 1,195.6 3,956.8 0.3 0.76 0
Time 1 5.54E-06 1.97E-06 2.81 0.01 1.01
Margin=C-UFLS (Hz)
1 -18,305 4,032 -4.54 <0.0001 1.01
The adjusted coefficient of the determination adj R2 of the model is 27.6 percent; the model is highly statistically significant (p<0.0001). The random error has a zero mean and the sample deviation σ of 403.7 MW/0.1 Hz. Variance inflation factors for the regressors are below four, which confirms an acceptable level of multicollinearity that does not affect a general applicability of the model. The parameter estimates, or the coefficients for the
105 At the significance level 0.1 106 At the significance level 0.1 107 Regressors in the final model have p-values not exceeding 0.1

Appendix E – Reliability Indicator Trends
NERC | State of Reliability | May 2016 155
regressors, indicate how change in a regressor value impacts FR. For example, if the margin increases by 1 mHz, one would expect a frequency response decrease of 18.305 MW/0.1 Hz.
ERCOT: Correlation Analysis and Multivariate Model Descriptive statistics for the six explanatory variables and the ERCOT Interconnection FR are listed in Table E.14.
Table E.14: Descriptive Statistics – ERCOT Interconnection
Variable N Mean Standard Dev. Minimum Maximum
Time 153 0 0 12/1/2011 11/30/2015
Winter 153 0.22 0.42 0 1
Spring 153 0.27 0.44 0 1
Summer 153 0.28 0.45 0 1
Fall 153 0.24 0.43 0 1
Pre-disturbance frequency A (Hz) 153 60.00 0.02 59.95 60.03
Margin=C-UFLS (Hz) 153 0.54 0.05 0.43 0.82
On-Peak Hours 153 0.68 0.47 0 1
Interconnection Load 121 40,355 9,540 23,905 64,696
Interconnection Load Change by Hour
121 288 3,428 -4,937 32,251
Frequency Response 153 690 215 337 1,628
Interconnection load and interconnection load change by hour data are available for the 121 FR events that occurred from 2012–2014 operating years. Other data are available for all 153 events. The correlation and a single-regression analysis result in the hierarchy of the explanatory variables for the ERCOT Interconnection FR shown in Table E.15. The value of a coefficient of determination R2 indicates the percentage in variability of FR that can be explained by variability of the corresponding explanatory variable.
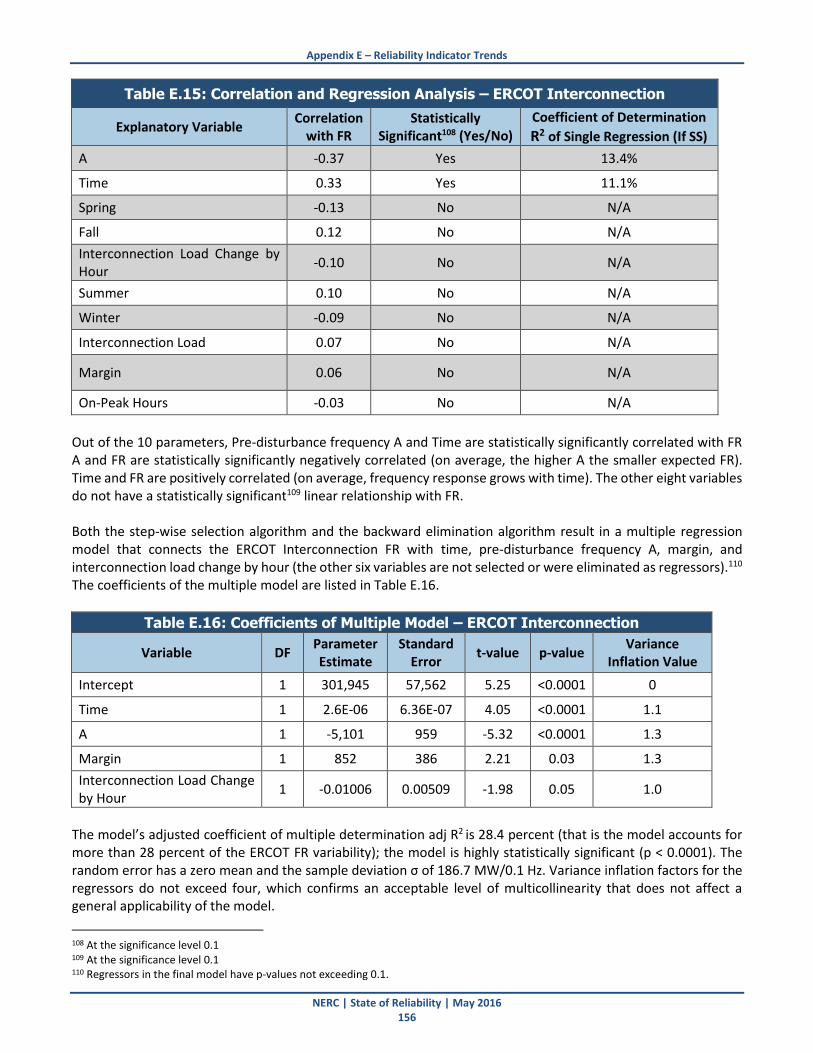
Appendix E – Reliability Indicator Trends
NERC | State of Reliability | May 2016 156
Table E.15: Correlation and Regression Analysis – ERCOT Interconnection
Explanatory Variable Correlation
with FR Statistically
Significant108 (Yes/No)
Coefficient of Determination
R2 of Single Regression (If SS)
A -0.37 Yes 13.4%
Time 0.33 Yes 11.1%
Spring -0.13 No N/A
Fall 0.12 No N/A
Interconnection Load Change by Hour
-0.10 No N/A
Summer 0.10 No N/A
Winter -0.09 No N/A
Interconnection Load 0.07 No N/A
Margin 0.06 No N/A
On-Peak Hours -0.03 No N/A
Out of the 10 parameters, Pre-disturbance frequency A and Time are statistically significantly correlated with FR A and FR are statistically significantly negatively correlated (on average, the higher A the smaller expected FR). Time and FR are positively correlated (on average, frequency response grows with time). The other eight variables do not have a statistically significant109 linear relationship with FR. Both the step-wise selection algorithm and the backward elimination algorithm result in a multiple regression model that connects the ERCOT Interconnection FR with time, pre-disturbance frequency A, margin, and interconnection load change by hour (the other six variables are not selected or were eliminated as regressors).110 The coefficients of the multiple model are listed in Table E.16.
Table E.16: Coefficients of Multiple Model – ERCOT Interconnection
Variable DF Parameter Estimate
Standard Error
t-value p-value Variance
Inflation Value
Intercept 1 301,945 57,562 5.25 <0.0001 0
Time 1 2.6E-06 6.36E-07 4.05 <0.0001 1.1
A 1 -5,101 959 -5.32 <0.0001 1.3
Margin 1 852 386 2.21 0.03 1.3
Interconnection Load Change by Hour
1 -0.01006 0.00509 -1.98 0.05 1.0
The model’s adjusted coefficient of multiple determination adj R2 is 28.4 percent (that is the model accounts for more than 28 percent of the ERCOT FR variability); the model is highly statistically significant (p < 0.0001). The random error has a zero mean and the sample deviation σ of 186.7 MW/0.1 Hz. Variance inflation factors for the regressors do not exceed four, which confirms an acceptable level of multicollinearity that does not affect a general applicability of the model.
108 At the significance level 0.1 109 At the significance level 0.1 110 Regressors in the final model have p-values not exceeding 0.1.

Appendix E – Reliability Indicator Trends
NERC | State of Reliability | May 2016 157
The parameter estimates, or the coefficients for the regressors, indicate how change in a regressor value impacts FR. For example, parameter estimate for time indicates a rate of increase of the FR per unit of time (a second). It translated to the monthly rate of increase equal 6.7 MW/0.1Hz. Similarly, if the Pre-disturbance Frequency A increases by 1 mHz, one would expect a frequency response decrease of 5.1 MW/0.1 Hz. Parameter estimate for Margin implies that this explanatory variable would positively affect FR assuming that margin changes separately and independently of other variables. However, pre-disturbance frequency and margin are not independent; in fact, they are highly statistically significantly (and positively) correlated. The interconnection load change by hour coefficient indicates that, on average, events occurred during load increase have smaller expected FR. Note that this regressor has the weakest linear relationship with the remaining regressors as its variance inflation value is very close to one. Separately, for the 2012–2015 frequency response events, the renewable (wind) generation hourly load by generation source solar) was studied as an explanatory variable for the 2012–2015 frequency response. Note that wind is the only significant renewable source in ERCOT with the average hourly generation about 4600 MW in 2015 (for comparison, the solar is still less than 200 MW total installed capacity and the hydro is even smaller). Descriptive statistics of wind load levels are listed in Table E.17.
Table E.17: Descriptive Statistics for ERCOT Wind Generation
Variable N Mean Standard Dev. Minimum Maximum
Wind Load by Hour (MW) 144 3,532 2,454 81 10,533
The data are available for the 144 FR events that occurred from 2012–2015. Even though the sample size was sufficient, no statistically significant correlation with the FR was found.

Appendix E – Reliability Indicator Trends
NERC | State of Reliability | May 2016 158
Québec: Correlation Analysis and Multivariate Model Descriptive statistics for the 10 explanatory variables and the Québec Interconnection FR are in Table E.18.
Table E.18: Descriptive Statistics - Québec Interconnection
Variable N Mean Standard Deviation
Minimum Maximum
Time 122 - - 12/1/2011 11/30/2015
Winter 122 0.13 0.34 0 1
Spring 122 0.19 0.39 0 1
Summer 122 0.48 0.50 0 1
Fall 122 0.20 0.41 0 1
Pre-disturbance frequency A (Hz) 122 60.00 0.02 59.94 60.05
Margin=C-UFLS (Hz) 122 1.16 0.46 0.29 2.28
On-Peak Hours 122 0.68 0.47 0 1
Interconnection Load 96 24,436 4,242 16,739 34,722
Interconnection Load Change by Hour
96 -84 885 -2420 2330
Frequency Response 122 610 230 288 1674
Interconnection Load and interconnection load change by hour data are available for the 96 frequency response events that occurred from 2012–2014 operating years. Other data are available for all 122 events. The correlation and a single-regression analysis result in the hierarchy of the explanatory variables for the Québec Interconnection FR shown in Table E.19. The value of a coefficient of determination R2 indicates the percentage in variability of FR that can be explained by variability of the corresponding explanatory variable.

Appendix E – Reliability Indicator Trends
NERC | State of Reliability | May 2016 159
Table E.19: Correlation and Regression Analysis- Québec Interconnection
Explanatory Variable Correlation
with FR Statistically
Significant111 (Yes/No) Coefficient of Determination
of Single Regression (If SS)
Interconnection Load 0.39 Yes 15.5%
Winter 0.29 Yes 8.5%
Time -0.26 Yes 6.5%
Margin 0.25 Yes 6.2%
Summer -0.20 Yes 3.9%
Spring 0.19 Yes 3.4%
Fall -0.18 Yes 3.1%
A -0.14 No N/A
On-Peak Hours -0.06 No N/A
Interconnection Load Change by Hour
-0.01 No N/A
Seven explanatory variables are statistically significantly correlated with FR. Interconnection Load has the strongest correlation and the greatest explanatory power (15.5 percent) for the FR. The load level and FR are positively correlated (i.e., the higher Interconnection Load is during a frequency response event, the higher expected frequency response value of this event). All four seasons are statistically significantly correlated with FR. Winter and spring are positively correlated with FR while summer and fall are negatively correlated with FR. The main reason winter events have a higher FR is because winter is the peak usage season in the Québec Interconnection. More generator units are on-line; therefore, there is more inertia in the system, so it is more robust in responding to frequency changes in the winter (the highly significant positive correlation between variables winter and Interconnection Load also confirms this). Another observation is that unlike other interconnections the Québec Interconnection has almost half of its frequency response events in summer (48 percent). Time and FR are statistically significantly and negatively correlated (on average, frequency response decreases with time). Another variable, margin, is positively correlated with FR. The remaining three variables do not have a statistically significant112 linear relationship with FR.
111 At the significance level 0.1. 112 At the significance level 0.1.

Appendix E – Reliability Indicator Trends
NERC | State of Reliability | May 2016 160
Both the step-wise selection algorithm and the backward elimination algorithm result in a multiple regression model that connects the Québec Interconnection FR with time, fall season, pre-disturbance frequency, margin and Interconnection Load (the other three variables are not selected or were eliminated).113 The coefficients of the multiple model are listed in Table E.20.
Table E.20: Coefficients of Multiple Model- Québec Interconnection
Variable DF Parameter Estimate
Standard Error
t-value p-value Variance
Inflation Value
Intercept 1 198,055 62,091 3.19 0.002 0
Time 1 -1.69E-06 7.89E-07 -2.14 0.035 1.05
Fall 1 -99.4 53.5 -1.86 0.066 1.07
A 1 -3,254 1,036 -3.14 0.002 1.04
Margin 1 165 43 3.87 0.0002 1.04
Interconnection Load 1 0.0196 0.0049 3.99 0.0001 1.05
The model’s adjusted coefficient of multiple determination adj R2 is 32.4 percent (that is more than 32 percent of the Québec Interconnection FR variability can be explained by the combined variability of these five parameters); the model is highly statistically significant (p<0.0001). The random error has a zero mean and the sample deviation σ of 197.3 MW/0.1 Hz. Variance inflation factors for the regressors do not exceed 1.07, which confirms an acceptable level of multicollinearity that does not affect a general applicability of the model. A parameter estimate for time indicates a rate of decrease of the FR per unit of time (a second). It translated to the monthly decrease rate of 4.4 MW/0.1Hz. Parameter estimate (coefficient) for the fall season indicates that for fixed values of other variables, the fall events on average have FR of 99.4 MW/0.1 Hz smaller than other events. Interconnection Load is the most statistically significant regressor in the model. Note that variable winter brings little new information about variability of FR due to its high correlation with Interconnection Load; therefore, winter becomes redundant and eliminated from the model. Coefficient for A shows that the pre-disturbance frequency A increases by 1 mHz, one would expect a FR decrease of 3.3 MW/0.1 Hz. Parameter estimate for margin implies that this explanatory variable would positively affect FR assuming that margin changes separately and independently of other variables. Noteworthy that unlike other interconnections pre-disturbance frequency and margin (and, thus, A and nadir C) are not significantly correlated.
113 Regressors in the final model have p-values not exceeding 0.1.

Appendix E – Reliability Indicator Trends
NERC | State of Reliability | May 2016 161
Western Interconnection: Correlation Analysis and Multivariate Model Descriptive statistics for the 10 explanatory variables and the Western Interconnection FR are listed in Table E.21.
Table E.21: Descriptive Statistics – Western Interconnection
Variable N Mean Standard
Dev. Minimum Maximum
Time 56 - - 12/1/2011 11/30/2015
Winter 56 0.20 0.40 0 1
Spring 56 0.29 0.46 0 1
Summer 56 0.29 0.46 0 1
Fall 56 0.23 0.43 0 1
Pre-disturbance frequency A (Hz) 56 60.00 0.01 59.98 60.02
Margin=C-UFLS (Hz) 56 0.39 0.04 0.17 0.43
On-Peak Hours 56 0.70 0.46 0 1
Interconnection Load 38 86,229 11,890 65,733 114,260
Interconnection Load Change by Hour 38 1,464 3,471 -6,311 5,905
Frequency Response 56 1,344 251 822 2,099
Interconnection load and interconnection load change by hour data are available only for the 38 frequency response events that occurred from 2012–2014 operating years. Other data are available for all 56 events. The correlation analysis determined that none of the variables has a statistically significant114 correlation with the WI FR. Neither step-wise selection algorithm nor backward elimination algorithm can built a regression model that connects the 2012–2014 Western Interconnection FR with any subset of the explanatory variables. None of the variables have a statistically significant correlation with FR. Without statistically significant correlations, given parameters cannot adequately describe the Western Interconnection FR. One of the possible explanations can be a small dataset for the 2012–2014 years, which consists of only 38 observations. Separately, for the 2013 and 2014 frequency response events, the renewable generation hourly loads by generation source (hydro, wind, and solar) were studied as explanatory variables for the 2013–2014 frequency response. Descriptive statistics of load levels by renewable generation source and combined along with their respective percentages of the Western Interconnection Load for a given hour are listed in Table E.22.
Table E.22: Descriptive Statistics for Renewable Generation Western Interconnection
Variable N Mean Standard Dev. Minimum Maximum
Hydro Load 33 31,661 6,361 16,405 43,105
Wind Load 33 5,522 2,867 1,125 11,339
Solar Load 33 1,444 1,274 0 4,996
Total Renewable Load 33 38,627 7,948 21,627 55,349
114 At the significance level 0.1.

Appendix E – Reliability Indicator Trends
NERC | State of Reliability | May 2016 162
Table E.22: Descriptive Statistics for Renewable Generation Western Interconnection
Variable N Mean Standard Dev. Minimum Maximum
Hydro as Percent Total Load 33 37% 8% 22% 54%
Wind as Percent Total Load 33 7% 4% 1% 15%
Solar as Percent Total Load 33 2% 1% 0% 6%
Renewable Load as Percent Total Load 33 46% 10% 26% 62%
Frequency Response 33 1,337 240 822 1,781
The data are available for the 33 frequency response events that occurred in 2013 and 2014. No statistically significant correlation between the explanatory variables defined from renewable generation data and the Western Interconnection FR was found for the data available. The small sample size might be a possible explanation for these results.
M-9 Correct Protection System Operations
Background In 2013, the metric was modified to focus on correct protection system operations, rather than focusing solely on misoperations. Therefore, in this report, the focus of this metric will include an analysis of correct operations and a discussion of misoperations. Protection system misoperations were identified as an area that requires further analysis in past State of Reliability reports. The improvements to the data collection process that the Protection System Misoperations Task Force (PSMTF) and SPCS proposed in 2013 were implemented and have improved the accuracy of misoperation reporting. At the recommendation of the PSMTF and SPCS, the respective protection system subcommittees within each RE began misoperation analysis in early 2014, and have continued to conduct such analysis on an annual basis.
Assessment Figure E.14 shows the correct operations rate for NERC during the reporting period. This information has not been included in prior State of Reliability reports, but is included here for the time period that the data is available.

Appendix E – Reliability Indicator Trends
NERC | State of Reliability | May 2016 163
Figure E.14: Correct Protection System Operations Rate
Figure E.15 shows the misoperation rate by Region through the third quarter of 2015. The misoperation rate reflects the ratio of misoperations to total operations for the entire BPS of 100 kV+. This ratio provides a consistent way to trend the rate of misoperations as compared to a misoperation count alone, where weather and other factors can influence the count. Total protection system operations were first requested with the fourth quarter 2012 misoperation data.
Figure E.15: Protection System Misoperations by Region (2Q 2012–3Q 2015)
Figure E.16 illustrates misoperations by cause code with the top-three causes due to incorrect setting, logic, or design error; relay failures/malfunctions; and communication failure. These three cause codes have consistently accounted for approximately 65 percent of all misoperations since data collection started in 2011.

Appendix E – Reliability Indicator Trends
NERC | State of Reliability | May 2016 164
Figure E.16: NERC Misoperations by Cause Code (2Q 2011–3Q 2015)
Linkage between Misoperations and Transmission-Related Qualified Events An analysis of misoperation data and events in the event analysis (EA) process found that in 2015 there were 50 transmission-related system disturbances which resulted in a Qualified Event. Of those 50 events, 34 events, or 68 percent, had associated misoperations. Of the 34 events, 33 of them, or 97 percent, experienced misoperations that significantly increased the severity of the event. There were four events where one or more misoperations and a substation equipment failure occurred in the same event. The relay ground function accounted for 11 misoperations in 2014 causing events that were analyzed in the EAP. This was reduced to six events in 2015. Actions to Address Misoperations NERC is in the process of revising a number of Reliability Standards that involve protection systems.115 To increase awareness and transparency, NERC will continue to conduct industry webinars116 on protection systems and document success stories on how GOs and TOs are achieving high levels of protection system performance. The quarterly protection system misoperation trending by NERC and the REs can be viewed on NERC’s website.117
115 http://www.nerc.com/pa/Stand/Pages/Standards-Under-Development.aspx 116 http://www.nerc.com/files/misoperations_webinar_master_deck_final.pdf 117 http://www.nerc.com/pa/RAPA/ri/Pages/ProtectionSystemMisoperations.aspx

Appendix E – Reliability Indicator Trends
NERC | State of Reliability | May 2016 165
Summaries of Individual Regional Entity Initiatives: Florida Reliability Coordinating Council (FRCC) FRCC entities follow a process that includes performing regular peer reviews of the analysis of misoperations and tracking of corrective actions through completion. In addition, FRCC operating entities have a process in place for entities to perform condition and risk assessments to coordinate protection system outages and communicate relevant information. Midwest Reliability Organization (MRO) The MRO Protective Relay Subcommittee (PRS) has prepared a whitepaper discussing the misoperation modes of several protection system schemes that have been observed to have a disproportionate share of misoperations within MRO. This paper then identifies effective approaches to reduce their occurrence. This paper will be distributed to all applicable Entities and also presented at the MRO annual Reliability Conference. Northeast Power Coordinating Council (NPCC) NPCC has instituted a procedure for peer review and analysis of all NPCC protection system misoperations. The NPCC review process is intended as a feedback mechanism that promotes continuous improvements based on lessons learned from the reported protection system misoperations. The NPCC Task Force on System Protection reviews the NERC lessons learned and NPCC-reported protection system misoperations while providing regional perspectives that entities can use to further improve performance and reduce misoperations. NPCC collects additional data on microprocessor-based relay misoperations to develop potential measures that address misoperations caused by Incorrect Setting/Logic/Design Errors and share knowledge of identified relay vendor specific product concerns along with the vendor recommended mitigations. ReliabilityFirst (RF) RF has addressed the NERC misoperation reduction goal through providing training opportunities on protection topics to our member entities. The RF Protection Subcommittee has initiated annual refresher training in the areas identified as the top misoperation causes in the Region and in NERC. These topics have included communication system design and protection polarization techniques. Last year, RF expanded the offering to field protection engineers and technicians to get this information to the personnel responsible for testing and analyzing the misoperations. We will continue to offer these opportunities into the future and have offered to share this training with other Regions. SERC Reliability Corporation (SERC) The SERC Protection and Controls Subcommittee (PCS) recognizes that registered entities must evaluate their individual performance and determine correct steps to reduce misoperations based their particular processes. The SERC PCS has developed a best practices document for registered entities to refer to when determining improvement plans. In addition to the NERC misoperations count and misoperation rate metrics, the SERC PCS is developing a composite metric to measure each registered entities performance. The composite metric assigns different weights to misoperation cause, category, voltage level, misoperation rate, and time required to complete corrective action plan in order to differentiate between misoperations which present higher risk to BES reliability. The composite metric can be used by the registered entity to target improvement toward misoperations that pose greater risk. At the SERC Engineering Committee (EC) level, specific misoperations performance data has been presented from different perspectives:
1. Misoperation rate and total count: Category 1 (six entities representing 70 percent of SERCs misoperation counts)

Appendix E – Reliability Indicator Trends
NERC | State of Reliability | May 2016 166
2. Misoperation rate and total count: Category 2 (10 additional entities representing the next 24 percent of SERCs misoperation counts)
3. Misoperations designated as failure to trip/slow to trip (the highest risk misoperations) During the recent meeting, the EC directed SERC staff to communicate to the 16 associated SERC entities (representing 94 percent of SERC Misoperation counts), their entity’s relative position on the referenced graphs, for information and action, as required. Southwest Power Pool Regional Entity (SPP RE) The SPP System Protection & Control Working Group (SPCWG) has prepared a whitepaper discussing misoperations caused by communication failures which has been a leading cause of misoperations in the SPP Region. The SPCWG is currently working on a whitepaper discussing misoperations caused by incorrect settings/logic/design errors which has been the second leading cause of misoperations in the SPP Region. These papers then identify effective approaches to reduce misoperation occurrences. Texas Reliability Entity (Texas RE) & Electric Reliability Council of Texas (ERCOT) The ERCOT System Protection Working Group (SPWG) analyzed misoperations within the Region and found that over 40 percent of the incorrect settings/logic/design misoperations were due to miss coordination of ground overcurrent settings. To that end, the SPWG members are preparing a whitepaper discussing ground fault characteristics, modeling of ground fault conditions, and advantages and disadvantages of different ground fault protection schemes in order to share best practices among the entities in the Region. Western Electricity Coordinating Council (WECC) WECC tracks trends in misoperations in its annual State of the Interconnection report and is conducting an in-depth analysis to identify the most effective areas to focus on to reduce misoperations. To address relay settings—the top contributor to misoperations—WECC includes questions in its annual Operational Practices Survey to understand entity practices with regard to relay settings. Through outreach efforts and working with its Relay Work Group, WECC encourages entities to evaluate their individual systems to best determine ways to reduce misoperations. WECC will apply information from its analysis and outreach efforts to include a protection system topic in our 2016/2017 best practices webinar series.
Misoperations Analysis
Misoperation Rate by Region and for NERC Table E.23 lists the operation and misoperation counts and the corresponding misoperation rate by Region and for NERC for the 12 quarters available (Q42012–Q32015). NERC’s numbers are based on the combined data for the seven Regions listed in the Table E.23 (WECC data are unavailable).
Table E.23: Operations and Misoperations by Region from Q4 2012 to Q3 2015
Region Operations Misoperations Misoperation Rate
RF 8,510 1,146 13.5%
SPP 5,243 654 12.5%
MRO 4,198 471 11.2%
FRCC 1,936 217 11.2%
SERC 12,318 1,065 8.6%
TRE 6,242 491 7.9%
NPCC 7,859 574 7.3%
NERC 46,306 4,618 10.0%

Appendix E – Reliability Indicator Trends
NERC | State of Reliability | May 2016 167
Figure E.17: Three-Year Misoperation Rate by Region (Q4 2012–Q3 2015)
Figure E.17 shows the Regional misoperation rate and summarizes results of the statistical tests on misoperation rate comparison. The blue bars show the rates that are statistically significantly higher than NERC’s rate, and black bars correspond to the rates significantly lower than NERC’s rate. There is no significant difference between FRCC and NERC misoperation rates for the three years combined. MRO and FRCC have very close three-year misoperation rates (11.22 percent and 11.21 percent, respectively). While the difference between MRO and NERC rates is statistically significant, the difference between FRCC and NERC rates is not. It can be explained by a larger population size for MRO (4198 MRO’s total operations vs. 1936 FRCC’s total operations) that provides greater statistical confidence despite virtually the same misoperation rate (p=0.01 vs. p=0.08). In Figures E.17, E.18, and E.19, the misoperation rate for WECC cannot be calculated because the total number of operations is not available.
Comparison of Regional Misoperation Rates
Table E.24: Regions with Misoperation Rate Statistically Significantly Different
Region Higher Lower
RF none MRO, FRCC, SERC, TRE, NPCC
SPP none SERC, TRE, NPCC
MRO RF SERC, TRE, NPCC
FRCC RF SERC, TRE, NPCC

Appendix E – Reliability Indicator Trends
NERC | State of Reliability | May 2016 168
Table E.24: Regions with Misoperation Rate Statistically Significantly Different
Region Higher Lower
SERC RF, SPP, MRO, FRCC NPCC
TRE RF, SPP, MRO, FRCC none
NPCC RF, SPP, MRO, FRCC, SERC none
RE misoperation data was analyzed to find statistically significant differences in misoperation rates between Regions. Table E.24 lists all the pairs of Regions with statistically significant differences in misoperation rate.
Year-Over-Year Changes by Region Changes from the first four quarters (Q4 2012–Q3 2013, Year 1) to the second four quarters (Q4 2013–Q3 2014, Year 2) to the third four quarters (Q4 2014–Q3 2015, Year 3) were studied to compare time periods with similar composition of seasons. The changes are shown in Figure E.18.
Figure E.18: Year-Over-Year Changes in Misoperation Rate by Region and NERC
In Figure E.18, Regions are listed alphabetically from left to right with the total misoperation rate for NERC on the far right. Red arrows indicate a statistically significant increase in misoperation rate between two years, green arrows show a statistically significant decrease in misoperation rate. Table E.25 lists the Regional misoperation rates that are shown graphically in Figure E.18.

Appendix E – Reliability Indicator Trends
NERC | State of Reliability | May 2016 169
Table E.25: Year-Over-Year Changes in Misoperation Rate by Region and NERC
Region Year 1 (Q4 2012-Q3 2013)
Year 2 (Q4 2013-Q3 2014)
Year 3 (Q4 2014-Q3 2015)
FRCC 13.2% 11.6% 9.0%
MRO 11.0% 10.9% 11.8%
NPCC 7.6% 8.0% 6.3%
RF 11.5% 16.1% 13.3%
SERC 9.1% 8.8% 8.0%
SPP 14.2% 11.4% 11.6%
TRE 7.7% 8.3% 7.6%
NERC 10.1% 10.4% 9.4%
Figure E.19: Year-Over-Year Changes in Misoperation Rate for Top 3 Causes by Region and NERC
In Figure E.19, Regions are listed alphabetically from left to right with the total NERC rate on the far right of the combined misoperation rate of the top three causes of misoperations (incorrect settings/logic/design errors, relay failures/malfunctions, and communication failures) for the three years. Red arrows indicate a statistically significant increase in misoperation rate between two years, green arrows show a statistically significant decrease in misoperation rate.
NERC | State of Reliability | May 2016 170
Appendix F – Event Analysis Discussion
Background The industry’s voluntary EAP continues to provide valuable information for the ERO and industry to address potential reliability risks or vulnerabilities of the BPS. Since its initial implementation in October of 2010, the process has reported 726 qualified events to the ERO and yielded 112 Lessons Learned, including 16 published in 2015118. NERC and the Regions assess every qualified event to identify causal factors and share with industry the possible risks to reliability. This year, the NERC Cause Code Assignment Process (CCAP) provided greater ability for historical trending and predictive analysis. Industry continued to actively participate in assigning cause codes for events, providing greater transparency on how the ERO analyzes and trends events. This active collaboration is a testament to the importance and effectiveness placed on this area by the industry, and also how important it is for the ERO and industry to truly understand the different contributors to events. The EAS has been essential in the maturation of this process and has facilitated the active dissemination of many of the products that have been delivered to date. This chapter highlights some of the significant products that have been produced from this active collaboration.
Bulk Power System Awareness The first step in the ERO EAP is to monitor BPS occurrences above a certain threshold of impact or risk. BPSA is the process for understanding the potential threats or vulnerabilities to the reliability of the BPS. This starts with understanding occurrences and events in the context in which they occur. NERC’s BPSA group and the eight REs monitor BPS conditions, significant occurrences, and emerging risks and threats across the 14 RCs in North America to maintain an understanding of conditions and situations that could impact the reliable operation of the BPS. The 2015 incoming information consisted of:
Mandatory reports
331 DOE OE-417 reports
236 EOP-004-2 reports
1 EOP-002-3 report
Other information (in no particular order or priority, and not limited to these resources)
1,059 Intelligent Alarms notifications
3.698 FNet/Genscape notifications and 983 FNet daily summaries
4,114 WECCnet messages
2,266 RCIS messages
641 Space Weather Predictive Center Alerts
1,872 assorted U.S. Government products
5,719 assorted confidential, proprietary or non-public products
14,736 open source media reports
2,681 RC and ISO/RTO notifications
118 The link to the NERC Lessons Learned page: http://www.nerc.com/pa/rrm/ea/Pages/Lessons-Learned.aspx. The information gathered allows the ERO to identify and conduct in-depth, critical self-analyses of qualified events to identify trends and provide experience-based insight to prevent repeat occurrences. The BPSA group also supports the development and publication of industry alerts and awareness products and facilitates information sharing among industry, Regions, and the government during crisis situations and major system disturbances.

Appendix F – Event Analysis Discussion
NERC | State of Reliability | May 2016 171
Products:
255 daily reports
30 special reports for significant occurrences
2 reliability-related NERC Advisory (Level 1) Alerts
375 new Event Analysis database and TEAMS entries
Analysis and Reporting of Events BPS conditions provide recognizable signatures through automated tools, mandatory reports, voluntary information sharing, and third-party publicly available sources. The significant majority of these signatures represent conditions and occurrences that have little or no reliability impact, either positive or adverse, on the BPS. However, being continually cognizant of the short-term condition of the BPS and the signatures associated with the entire range of reliability performance helps the ERO identify significant occurrences and events. Registered entities continue to share information and collaborate with the ERO well beyond what is required to maintain and improve the overall reliability of the grid. Only a small subset of the occurrences of which the BPSA group is made aware rise to the level of a reportable event. When a registered entity experiences an event, the registered entity will recommend an initial category for the event. The categories listed in the Categorization of Events section of the process do not cover all possible events119. The quality, detailed analysis, and investigations that entities have performed have led to quality reports. Good quality event analysis reports allow for more accurate cause coding of events and has led to better trending. Better trending leads to timely identification of issues being communicated back to the industry. For trending of events, NERC uses standard Statistical Process Control techniques for tracking the numbers of events reported. This methodology results in control charts, where control limits are calculated using an “Individuals-Moving Range” calculation. In this way, there is no unnecessary reaction to what would be considered normal variation is the numbers of events reported, allowing the expenditure of resources in a more efficient manner. This also helps determine what “normal” looks like, when determining if an anomalies have occurred. Where known process changes occur, such as happened when Version 2 of the EAP became effective (October 2013), control limit re-calculations occur, resulting in distinct shifts in control limits (the black, vertical dashed line in the Figure F.1).
119 http://www.nerc.com/pa/rrm/ea/EA%20Program%20Document%20Library/ERO_EAP_V3_final.pdf

Appendix F – Event Analysis Discussion
NERC | State of Reliability | May 2016 172
Figure F.1: Control Chart for the Number of Events (Per Month) Over Time
NERC Cause Code Assignment Process Through the EAP, NERC assesses every event report to identify and then share, industry-wide, the apparent threats to reliability that may be emerging. The NERC CCAP120 manual was updated in March 2015. Cause coding has allowed for easier trending for all event causes. While the root cause of every event can not necessarily be determined, many of the contributing causes or failed defenses can be determined, analyzed, and trended to provide valuable information to the industry. Through the EAP, cause codes were assigned to 475 events with 434 of these resulting in contributing cause codes being identified. A similar identification of trends can be observed in the large contribution of “less than adequate” or “needs improvement” cause factors in the area of management and organizational practices that contribute to events. Many of these threats can be identified and shared with the industry for awareness. For example, in Figure F.2 below, the identification of some of the particular challenges to organization and management effectiveness are identified. Management of complex systems and organizations is a challenge in every industry, and the percentage of events with these contributing factors is collectively found in other industries.
120 http://www.nerc.com/pa/rrm/ea/EA%20Program%20Document%20Library/CCAP_Manual_March_2016.pdf

Appendix F – Event Analysis Discussion
NERC | State of Reliability | May 2016 173
Figure F.2: Management or Organization Challenges Contributing to an Event Many of the most frequently identified contributing causes for events seen in Figure E.1 were found in the severe cold weather events.
Winter Weather Preparedness and Review The Winter of 2015 marked the second consecutive year in which extreme cold weather conditions affected North America, primarily the Eastern and Midwestern portions of the grid. In the first quarter of 2015, North America experienced two notable cold snaps, one from roughly January 5 to January 8, and the other from February 16 to February 20. These cold snaps created conditions similar to those experienced in the January 2014 polar vortex. Several RC areas of the BPS experienced near-peak loads on several of these days. These similar conditions create a good benchmark for a comparison to extremes experienced in 2014. Overall BPS performance during the 2015 cold weather events showed improvements over the Winter of 2014. In part, the improvements reflected actions taken by stakeholders as a result of analysis, lessons learned, and implementation of recommendations from what was experienced in 2014 and years prior. While few generation outage rates remained above historical norms in 2015, the ERO continues to emphasize the need for thorough and sustained winter preparation to improve generation performance and close coordination and communication between generator and system operators, particularly during peak winter demand periods. In some areas, such

Appendix F – Event Analysis Discussion
NERC | State of Reliability | May 2016 174
as in the Texas RE footprint, the outages above the selected norms showed no correlation between winter preparation and the outages (i.e., they were not related to cold weather conditions).
Temperatures and Peaks The Winter of 2015 was marked by cold temperatures similar to the Winter of 2014, with the coldest temperatures experienced during February 2015 throughout the Eastern Interconnection. Numerous cities hit their daily low-temperature records during February 2015. Due to the low temperatures and associated high electricity demand for heating needs, PJM set a new wintertime peak demand record of 143,086 megawatts the morning of February 20, 2015 (hour ending 0800). The new peak record surpassed the previous all-time winter peak of 142,863 MW set January 7, 2014. Although the new record winter peak was set during this time frame, no emergency demand response or any other capacity emergency actions were required. Many other areas also set all-time record winter peaks in 2015.
Generator Performance Generator performance in January and February of 2015 showed improvement over 2014 with improved overall forced outage rates. PJM reached a new all-time winter peak the morning of February 20, 2015, despite experiencing a Regional forced outage rate of 13.4 percent, representing 24,805 MW of generation forced out of service. Although the 2015 winter peak forced outage rates represent an improvement over the 22 percent forced outage rate during the January 7, 2014 peak, the 2015 rates were still above the recently experienced historical winter peak outage rate of between seven percent and 10 percent. Similar findings occurred across the Eastern Interconnection. The performance improvements of winter 2015 over 2014 are attributed to steps generation owners and transmission operators initiated after the winter of 2014.121
Preparation The Fall of 2014 preparedness seminar, in preparation for the Winter of 2014–2015, was addressed in the State of Reliability 2015, and this is what helped in the results of the outcome from the Winter of 2015. Likewise, in the Fall of 2015, a webinar and preparedness training was provided to the industry to prepare for Winter 2015–2016. For this training, information was shared from the 2015 Winter Performance overview, 2014 Polar Vortex Review, southwest cold weather event of February 2011, the preliminary 2015–2016 North America Winter Outlook, and data from the survey to assess the effectiveness of severe winter weather preparation materials. The winter preparation materials can be found on NERC’s website.
Individual and Organizational Human Performance Analysis of the event reports to date have identified possible workforce capability and human performance challenges that pose threats to reliability. Workforce capability and HP is a broad topic and can most simply be divided into management, team, and individual levels. To provide more detailed information on the types of errors that were observed in BPS events since the inception of the NERC Event Analysis program, and specifically events that involved human error or potentially less-than-adequate training, the following summary is provided. Generally, individual error is classified in the mode of performance in which the individual was operating when the error was committed. The NERC CCAP uses a popular methodology as prescribed in one of the three modes, depending on the nature of the task and the level of experience with the particular situation. That is, when information is first perceived and interpreted in the processing system, that information is processed cognitively in either the skill-based, knowledge-based, or rule-based levels, depending on the individual’s degree of experience with the particular situation. Additionally, when contributing causes are considered, over half of the event reports to date indicate some management or organizational challenges. To support industry with these challenges, NERC held its fourth annual
121 http://www.nerc.com/pa/rrm/ea/Pages/Cold-Weather-Training-Materials.aspx

Appendix F – Event Analysis Discussion
NERC | State of Reliability | May 2016 175
HP conference in Atlanta, Improving Human Performance on the Grid7, at the end of March 2015. The focus this year was not only on individual human performance, but the organizational and management challenges around human capital. The conference included industry and related industry professionals in the field, with over 200 attendees from all Regions. The conference and associated workshops were very well received. NERC supported WECC for a similar venue for industry in the fall. NERC provided industry support in this area to well over 250 registered entities across the eight Regions.
Monitoring and Situation Awareness (Real-Time Tools) Energy Management Systems (EMS), including Supervisory Control and Data Acquisition (SCADA), digital, or analog communications and real time tools, are vital for maintaining situational awareness and making operating decisions at both the individual and the organizational level. EMS systems are extremely reliable and are typically redundant. However, an outage of the EMS system increases the potential risk to the reliability of the BPS. The NERC EA program has received 126 Category 2b event reports, where a complete loss of SCADA, monitoring, or control has lasted for more than 30 minutes. NERC’s commitment to active collaboration and sharing has allowed more information to be adequately reviewed and shared about these events in conjunction with the NERC Regions and the affected entities. In October 2013, the EAP changed to add a new category of events. Category 1h, for the partial loss of EMS, is defined as: Loss of monitoring or control, at a control center, such that it significantly affects the entity’s ability to make operating decisions for 30 continuous minutes or more. Since this change, 153 partial loss of EMS events have been reported. Examples include but are not limited to the following:
1. Loss of operator ability to remotely monitor and/or control BES elements
2. Loss of communications from SCADA RTUs
3. Unavailability of ICCP links reducing BES visibility
4. Loss of the ability to remotely monitor and control generating units via AGC
5. Unacceptable State Estimator or Contingency Analysis solutions The EAS transitioned the EMS Task Force (EMSTF) to a permanent working group to analyze the events and data that were being collected about EMS outages and challenges. Industry also recognized that many EMS outages were significantly less than the Category 2b, but impacted the decision-making activities for which the EMS is used. Category 1h was created to learn more about these type of events. This category allows the EMSWG to collect a greater number of the occurrences of EMS partial outages and share this information with the industry. With this modification of reporting EMS events, the number of Category 1h events reported by the industry has provided useful information and has decreased the number of Category 2b events. The active participation has led to even more detailed reporting and sharing of information, all helping the industry understand and mitigate the risk of these events. From the EA reports and the work of the EAS, NERC published multiple lessons learned specifically about EMS outages and worked to build and support an industry-led EMSTF to support the EAS. The hard work and active sharing of this group has reduced some of the residual risk associated with this potential loss of situation awareness and monitoring capability that comes with this type of event, and they will continue to provide valuable information to the industry. With the support of the EMSTF, NERC hosted its third annual Monitoring and Situational Awareness Conference on September 29 and 30. The theme of this year’s conference was “Confidence in Tools (a System Operator’s View)” which focused on the tools and monitoring capabilities of both EMS/SCADA systems that provides the situational awareness to system operator’s with a real-time “bird’s eye” view of system conditions. This year’s

Appendix F – Event Analysis Discussion
NERC | State of Reliability | May 2016 176
conference was hosted by ERCOT at their ERCOT Executive and Administration Center in Austin, Texas. The conference brought together more than 100 operations and EMS experts from registered entities, government regulators, and a variety of vendors and consultants from all Regions and Canada The feedback from participants has been extremely positive for the conferences. Attendees liked the technical nature of the presentations and the takeaways they could use to improve the processes and procedures at their own companies. The openness with which the EMS issues and their corrective actions were shared was greatly appreciated by the attendees. Also appreciated was the platform that NERC provided to transparently share the events and learn from them. A fourth workshop was requested by industry for 2016. Industry has demonstrated appropriate responses to EMS outages, and the ERO can now more accurately assess the residual risk to the BPS from EMS outages. Industry has expressed continued strong interest and support for these information-sharing venues.
Event SRI (eSRI) NERC Event Analysis staff calculates an eSRI for all qualified events (as defined in the EAP). This calculation is based on the methodology used by NERC for the standard SRI as described in Chapter 3, and considers the loss of transmission, the loss of generation, and the loss of firm load (along with load-loss duration). Every event reported through the EAP has its eSRI calculated, but for the purposes of trending, certain event groups are excluded. The excluded groups are:
1. Weather-driven events;
2. AESO islanding events; and
3. Category 4-5 events.
4. Events prior to 2011 The purpose of excluding Category 4–5 events is that they are monitored and tracked in a distinct manner, so counting them in this trending would be duplicative. As AESO designed islanding events as an intentional act in their SPS schemes, these are also excluded. The purpose of excluding the weather-driven events is because they are outside of the control of the BES entities, thus not considered when studying impact over which there is control. A weather-driven event is an event whose root cause is determined to be weather (or other force of nature); examples would include the Hurricane Sandy event, an earthquake, or a string of tornadoes knocking down transmission towers, among others. There have been 14 of these events since October 2010, when the current EAP was developed (one was in 2010, and one was associated with AESO islanding, thus both of these have been excluded). For the purposes of trending, it has been decided that the 18 events in 2010 would not be included in trending, as this was such a small sample, from a limited time frame. For the events reported since October 2010, the total number of events was 709; of these, 35 were AESO islanding (one of which was also weather-driven), 12 were weather-driven, and five (three of which are also weather-driven) were Category 4–5 events. This means only two Category 4–5 events were excluded as Category 4–5 events, while three of them were excluded as weather-driven events. The total number of events for which eSRI will be included the trending through 2015 is 642 events (out of the total of 709). The formula used is:
eSRI = RPL *WL * (MWL) + WT * (NT) + WG * (NG), where

Appendix F – Event Analysis Discussion
NERC | State of Reliability | May 2016 177
RPL = Load Restoration Promptness Level,
WL = Weighting of load loss (60 percent),
MWL = normalized weighting of load loss,
WT = weighting of transmission lines lost (30 percent),
NT = normalized number of transmission lines lost, in percent,
WG = weighting of loss generation (10 percent),
NG = normalized Net Dependable Capacity of generation lost. The value of this calculation results in a number between zero and one; thus, for easier use in analysis, this small number is multiplied by 1000. Once this number is calculated for each event and is plotted in chronological sequence, the slope of the trend line is calculated and plotted. In this way, the trend can be visually identified (as well as numerically calculated using statistical software). Every day has its eSRI calculated (meaning a day with no events has an eSRI = 0.000). For any days with multiple events, the eSRIs are additive.
Summary The EAP continues to provide valuable information for the industry to address potential threats or vulnerabilities to the reliability of the BPS. This continued active collaboration remains a testament to how much effort and resources are being expended in this area by the industry as well as how important it is for the ERO and industry to truly understand the different contributors to events. The continued cooperation and collaboration with the industry is the hallmark to this program’s success. The ability to identify specific pieces of equipment that are potential threats, as well as emerging trends that increase risk to the system, illustrates the value of the EAP. These outcomes, coupled with the ability to actively share the information through Lessons Learned, webinars, technical conferences, and related venues, remain critical to the sustainment of high reliability.

NERC | State of Reliability | May 2016 178
Appendix G – Abbreviations Used in This Report
Acronym Description ALR Adequate Level of Reliability
APC element Availability Percentage
BA Balancing Authority
BES Bulk Electric System
BESSMWG BES Security Metrics Working Group
BPS Bulk Power System
BPSA Bulk Power System Awareness
CCC Compliance and Certification Committee
CDM Common/Dependent Mode
CIP Critical Infrastructure Protection
CP-1 Compliance Process-1
CP-2 Compliance Process-2
CRISP Cybersecurity Risk Information Sharing Program
CVSS Common Vulnerability Scoring System
DADS Demand Response Availability Data System
DADSWG Demand Response Availability Data System Working Group
EAP Event Analysis Process
EAR Event Analysis report
EEA Energy Emergency Alert
EFOR Equivalent Forced Outage Rate
EFORd Equivalent Forced Outage Rate – demand
E-ISAC Electricity Information Sharing and Analysis Center
EMS Energy Management Systems
EMSTF Energy Management System Task Force
eSRI Event Severity Risk Index
ERO Electric Reliability Organization
ERCOT Electric Reliability Council of Texas
ERSTF Essential Reliability Services Task Force
FERC Federal Energy Regulatory Commission
FR Frequency Response
FRCC Florida Reliability Coordinating Council
GADS Generating Availability Data System
GADSWG Generating Availability Data System Working Group
ICC Initiating Cause Code
IFRO Interconnection Frequency Response Obligation
IROL Interconnection Reliability Operating Limit
ISO Independent System Operator
ISO-NE ISO New England
LTRA Long Term Reliability Assessment
KCMI Key Compliance Monitoring Index
MW megawatt
MWh megawatt hour
MRO Midwest Reliability Organization
MVA Mega Volt Ampere
MSSC Most Severe Single Contingency

Appendix G – Abbreviations Used in This Report
NERC | State of Reliability | May 2016 179
Acronym Description NERC North American Electric Reliability Corporation
NIST National Institute of Standards and Technology
NOI Notice of Inquiry
NPCC Northeast Power Coordinating Council
NYISO New York Independent Service Operator
PAS Performance Analysis Subcommittee
PSMTF Protection System Misoperation Task Force
RC Reliability Coordinator
RE Regional Entities
RF ReliabilityFirst
RSG Reserve Sharing Group
SCC Sustained Cause Code
SERC SERC Reliability Corporation
SNL Sandia National Laboratories
SOL System Operating Limit
SPS Special Protection Schemes
SPCS System Protection and Control Subcommittee
SPP-RE Southwest Power Pool Regional Entity
SRI Severity Risk Index
SS Statistically Significant
TADS Transmission Availability Data System
TADSWG Transmission Availability Data System Working Group
Texas RE Texas Reliability Entity
UFLS Underfrequency Load Shed
WECC Western Electricity Coordinating Council
NERC | State of Reliability | May 2016 180
Appendix H – Contributions
Acknowledgements NERC would like to express its appreciation to the many people who provided technical support and identified areas for improvement.
NERC Industry Groups
Table H.1: NERC Industry Group Acknowledgements Group Officers
Planning Committee Reviewers
Gary T. Brownfield, Ameren Services Phil Fedora, NPCC David Jacobson, Manitoba Hydro Herb Schrayshuen, Small End-Use Electricity Customer Carl Turner, Florida Municipal Power Agency Brian Van Gheem, ACES
Operating Committee Reviewers
Jim Case, Entergy Stuart Goza, TVA Tom Leeming, Exelon Corporation Doug Peterchuck, Omaha Public Power District Dave Souder, PJM Interconnection, LLC John Stephens, City Utilities of Springfield Rocky Williamson, Southern Company
Performance Analysis Subcommittee Chair: Melinda Montgomery, Entergy Vice Chair: Heide Caswell, PacifiCorp State of Reliability Report Lead: Tom Sims
Demand Response Availability Data System Working Group
Chair: Maggie Peacock, WECC Vice Chair: Bob Reynolds, SPP RE
Events Analysis Subcommittee Chair: Hassan Hamdar, FRCC Vice Chair: Rich Hydzik, Avista Corporation
Generation Availability Data System Working Group Chair: Leeth DePriest, Southern Company Vice Chair: Steve Wenke, Avista Corporation
Transmission Availability Data System Working Group
Chair: Jeff Schaller, Hydro One Networks, Inc. Vice Chair: Kurt Weisman, ATC
Resources Subcommittee Chair: Troy Blalock, SCE&G Vice Chair: John Tolo, Tucson Electric Power
Operating Reliability Subcommittee Chair: Eric Senkowicz, FRCC Vice Chair: Dave Devereaux, IESO
Frequency Working Group Chair: Sydney Niemeyer, NRG Energy
Operating Committee Chair: Jim Case, Entergy Vice Chair: Lloyd Linke, WAPA
Planning Committee Chair: Dave Weaver, PECO Vice Chair: Brian Evans-Mongeon, Utility Services Inc.
Reliability Assessment Subcommittee Chair: Phil Fedora, NPCC Vice Chair: Tim Fryfogle, Reliability First
System Protection and Control Subcommittee Chair: Philip Winston, Southern Company Vice Chair: Richard Quest, Midwest Reliability Org
Compliance and Certification Committee Chair: Patricia E. Metro, NRECA Vice Chair: Jennifer Flandermeyer, KCP&L

Appendix H – Contributions
NERC | State of Reliability | May 2016 181
ERO Enterprise Staff
Table H.2: Contributing Regional Staff
Name Regional Entity
ERO - Executive Management Group
Regional Subject Matter Experts
Vince Ordax FRCC
John Seidel MRO
Phil Fedora NPCC
Paul Kure RF
Brian Thumm SERC
Bob Reynolds SPP RE
David Penney Texas RE
Maggie Peacock WECC
Carter Edge REMG
NERC Staff
Table H.3: NERC Staff
Name Title E-mail Address
Mark Lauby Senior Vice President and Chief Reliability Officer [email protected]
James Merlo Senior Director, Reliability Risk Management [email protected]
David Till Senior Manager, Performance Analysis [email protected]
Brad Gordon Manager, Reliability Performance Analysis [email protected]
Svetlana Ekisheva Principal Statistician, Performance Analysis [email protected]
Trinh Ly Engineer, Performance Analysis [email protected]
Margaret Pate Reliability Risk Control Liaison, Performance Analysis [email protected]
Donna Pratt Senior Advisor, Performance Analysis [email protected]
Elsa Prince Principal Advisor, Performance Analysis [email protected]
Katherine Street Principal Advisor, Performance Analysis [email protected]
Lee Thaubald Technical Analyst, Performance Analysis [email protected]
Matthew Varghese Senior Engineer, Performance Analysis [email protected]
Val Agnew Senior Director of Reliability Assurance [email protected]
Rich Bauer Senior Manager, Event Analysis [email protected]
Terry Brinker Senior Manager, Standards Information [email protected]
Laura Brown Associate Director, Policy and Coordination [email protected]
Terry Campbell Manager of Technical Publications [email protected]
Bob Canada Associate Director, Physical Analysis [email protected]
Alex Carlson Technical Publications Specialist [email protected]
Sam Chanoski Director of Situation Awareness and Event Analysis [email protected]
Thomas Coleman Director, Reliability Assessments [email protected]
Bob Cummings Director, Reliability Initiatives and System Analysis [email protected]
Howard Gugel Director, Standards [email protected]
Larry Kezele Senior Manager of Operating Committee Support [email protected]
Naved Khan Engineer, Compliance Enforcement [email protected]

Appendix H – Contributions
NERC | State of Reliability | May 2016 182
Table H.3: NERC Staff
Name Title E-mail Address
Ed Kichline Senior Counsel and Associate Director of Enforcement [email protected]
Soo Jin Kim Manager of Reliability [email protected]
Matt Lewis Manager, Training and Education [email protected]
Ben McMillan Manager, Event Analysis [email protected]
Kimberly Mielcarek Senior Director of Communications [email protected]
John Moura Director of Reliability Assessment and Systems Analysis [email protected]
Amir Najafzadeh Senior Engineer, Reliability Assessments [email protected]
Elliott Nethercutt Senior Technical Advisor, Reliability Assessments [email protected]
Steve Noess Director of Standards Development [email protected]
Ryan Quint Senior Engineer, System Analysis [email protected]
Janet Sena Senior Vice-President, Policy and External Affairs [email protected]
Pooja Shah Senior Engineer, Reliability Assessments [email protected]
Sandy Shiflett Senior Program Specialist [email protected]
Jule Tate Associate Director, Events Analysis [email protected]
Ganesh Velummylum Senior Manager, System Analysis [email protected]
Tobias Whitney Manager, CIP Compliance [email protected]