state of new jerseystate of new jersey
TRANSCRIPT

State of New JerseyState of New JerseyState of New JerseyState of New Jersey
Department of Corrections Department of Corrections Department of Corrections Department of Corrections
State Parole BoardState Parole BoardState Parole BoardState Parole Board
Juvenile Justice Commission Juvenile Justice Commission Juvenile Justice Commission Juvenile Justice Commission
RELEASE OUTCOME 2009:
A THREE-YEAR FOLLOW-UP
CHRIS CHRISTIE
Governor
KIM GUADAGNO
Lt. Governor
GARY M. LANIGAN
Commissioner New Jersey Department of Corrections
JAMES T. PLOUSIS
Chairman New Jersey State Parole Board
KEVIN M. BROWN
Executive Director New Jersey Juvenile Justice Commission

Release Outcome Report 2009………………………………………………………………… 2
Acknowledgements
New Jersey Department of Corrections Gary M. Lanigan
Commissioner
Judi Lang
Chief of Staff
Kristen M. Zgoba, Ph.D.
Supervising Research Scientist
Catherine Halper
Supervisor, Resource Review & Study Unit
Sabrina Haugebrook, MPA, M.S.
Research Scientist II
New Jersey State Parole Board James T. Plousis Chairman
David W. Thomas
Executive Director
Lawrence Gregorio Deputy Executive Director
Deborah Mohammed-Spigner, Ph.D. Research Scientist II
New Jersey Juvenile Justice Commission Kevin M. Brown
Executive Director
Gloria R. Hancock, Ed.D. Deputy Executive Director of Programs
Michael Aloisi, Ph.D. Supervising Administrative Analyst
John E. Vanloan Administrative Analyst II
New Jersey Division of Criminal Justice Liz Zupko Administrative Analyst I
New Jersey Office of Information Technology Lee R. Winson Software Development Specialist III
Release Outcome Report 2009………………………………………………………………… 3
Table of Contents
Acknowledgements 2
Executive Summary 4
Introduction 6
Agency Mission Statements 7
Methodology 9
Results: NJDOC and NJSPB 11 2009 Release Cohort Characteristics
2009 Release Cohort Recidivism Characteristics
Three Year Comparison of Percentages
Cumulative Rearrest Rates
2009 Release Offenders Most Serious Offense
Factors Associated with Recidivism
Results: JJC 18 Overall Recidivism Rates for Youth
Time to Failure in Months
Recidivism by Offender Status
Factors Associated with Recidivism
Notes 26
Conclusion 23
Release Outcome Report 2009………………………………………………………………… 4
EXECUTIVE SUMMARY
OVERALL FINDINGS
• The State of New Jersey continues to experience a downward trend in all three of the categories of recidivism. The full 2009 release cohort experienced a 1.85% decrease in the percentage of re-arrests and a 7.14% decrease in the percentage of re-convictions. There was an 8.57% decrease in reincarcerations, as compared to the 2008 release cohort. • Approximately 67% of adult offenders did not return to prison within the 3 year analysis of this report.
SAMPLE CHARACTERISTICS OF 2009 RELEASE COHORT
• The adult cohort was comprised of 11,895 offenders: 7,330 supervised offenders (61.6%) and 4,565 (38.4%) unsupervised offenders. It is important to note that although the
cohort of adults is separated between supervised and unsupervised offenders, differences may be attributable to differences in supervision levels
• The juvenile cohort was comprised of 854 releases
• The race of the adult cohort was comprised of 22.5% Caucasian, 59.1% African American, 17.9% Hispanic and .5% other races
• The juvenile population was predominantly male, youth of color, with an average age at release of 17.8 years.
• The median time served for the adult cohort was 502 days, with 95% of the sample serving under 5 years
• The majority of adult offenders served time for a drug offense (41.3%), followed by a violent offense (20.8%)
TOTAL ADULT COHORT RECIDIVISM CHARACTERISTICS
• 53.1% of the cohort was rearrested, this is a 1.85% decrease from the 2008 release cohort
• 38.8% of the cohort was reconvicted, this is a 7.14% decrease from the 2008 release cohort
• 32.4% of the cohort was reincarcerated, this is a 8.57% decrease from the 2008 release cohort
• For those offenders who were rearrested, the average time to failure was just over one year (mean=385 days; median= 312 days, sd= 292 days)
• For those parolees who violated parole, the average time to parole violation was just under one year (mean=353 days, sd=241 days)
• While weapon offenders had the highest percentage of recidivists among them, a weapons offense was the least repeated offense across all categories
• Drug and “other” crimes were the most repeated crimes. The category of “other” crimes included offenses that did not fit into the 5 typologies, such as, crimes against the courts (contempt), traffic offenses, non-violent family offenses, decency offenses, public order and immigration offenses. Offenders released for a drug and “other” offense recidivated within the 36 months for the same offense 51.7% and 31.6% of the time, respectively
• Inmates who were released on a weapon charge returned to prison 37.9% on a new drug offense. Conversely, those who were released for violent and property offenses had the highest rate of recommission for a crime falling into the “other” category, 32.1% and 28.5% respectively
Release Outcome Report 2009………………………………………………………………… 5
ADULT RELEASE COHORT RECIDIVISM DIFFERENCES
• Compared to supervised offenders (52.2% rearrest and 38.6% reconviction), unsupervised offenders had higher rates of rearrest (54.5%) and reconviction (39.2%); however, supervised offenders had a slightly higher rate of reincarceration (32.7%) compared to unsupervised offenders (31.8%). Comparative statistics related to supervised vs. unsupervised offenders may sometimes be misinterpreted because supervised offenders are subject to greater scrutiny than unsupervised offenders and may be returned to prison due to technical violations or other reasons that would not be identified in someone who is not closely supervised. There is no evidence to show that supervised offenders commit more crimes than an unsupervised offender.
• Proportionally more of the unsupervised group of offenders are rearrested within the first year, particularly the first six months
• Of the full sample rearrested, 56.3% did so by 1 year, and 84% by 24 months-this highlights the rapid rate at which recidivism occurs
FACTORS ASSOCIATED WITH ADULT OFFENDER RECIDIVISM
• Statistically, prior correctional history was a large contributor to rearrest, specifically, if an offender had two or more prior incarcerations, the chance for a new arrest increased by a factor of four
• Correctional history was significantly related to the likelihood of rearrest. Twenty one percent of the full sample of released offenders had a minimum of one prior state incarceration and an additional 45% had two or more prior state incarceration terms, totaling 66% of the sample of inmates. Twenty one percent of offenders who were rearrested had served one prior correctional term, and 56% of those offenders who were rearrested served two or more prior prison terms, while 23% of those with no prior incarceration were re-arrested (x2=60.02,df=2, p<.000)
• Younger offenders were more likely to be rearrested; every additional year of age reduced an offender’s odds of rearrest by almost one
• On average, offenders who were rearrested served shorter sentences of 643 days, while non-recidivists served 796 days
• Offenders who committed weapons, “other” crimes and drug offenses had an increased probability of a new arrest, with “other” crimes maintaining the highest odds of re-arrest (1.65) and weapon offenses close behind (1.45). Violent offenders were rearrested proportionally less than other types of offenders
• Race was related to rearrest; compared to Caucasian offenders, African American offenders had a 1.2 increased odds of rearrest, while Hispanic and Asian offenders’ had decreased odds of rearrest
• Released males were statistically more likely to be rearrested than females
JUVENILE COHORT RECIDIVISM CHARACTERISTICS
• 84.8% of the cohort had a new court filing/arrest
• 73.4% of the cohort had a new court filing/arrest that resulted in a new adjudication/conviction
• 34.7% of the cohort had a new court filing/arrest that resulted in a new commitment to a State facility
• The average time to re-offend for a new court filing/arrest was 269 days
Release Outcome Report 2009………………………………………………………………… 6
• The average time to re-offend for a new adjudication/conviction was 288 days
• The average time to re-offend for a new commitment to a State facility was 342 days
FACTORS ASSOCIATED WITH JUVENILE RECIDIVISM (New Court Filing/Arrest)
• Males were more likely to recidivate (85.8% recidivating vs. 68.6% of females)
• Youth of color (combining African American, Hispanic and “Other” youth of color) were more likely to recidivate than Caucasian youth (85.7% vs. 76.7%)
• Youth residing in the 15 most densely populated cities were more likely to recidivate compared with other youth (89.1% vs. 81.2%)
• Recidivating youth had accumulated a greater number of total adjudications of delinquency than non-recidivists (7.3 vs. 5.2)
• Juveniles committed/admitted on public order charges, e.g. disorderly conduct (as their most serious offense) were most likely to recidivate (95.9%), followed by 94.6% for weapons, 92.3% for CDS, 85.8% for property, 83.3% for Violations of Probation, and 77.7% for persons offenses
• Juveniles committed/admitted on 3rd degree offenses (as their most serious offense) were most likely to recidivate (90.2%), followed by 89.3% for 4th degree, 87.1% for disorderly persons or petty disorderly persons (DP/PDP), 83.3% for Violations of Probation, 80.9% for 2nd degree, and 73.5% for 1st degree offenses
• Recidivating youth were reading at a lower grade level equivalent based on a MAP Reading Test than non-recidivists (5.2 grade level vs. 6.0)
• Recidivating youth scored at a lower grade level equivalent based on a MAP Math Test than non-recidivists (5.2 grade level vs. 5.9)
• Youth receiving special education and/or related services (“classified youth”) were more likely to recidivate than other youth (89.0% vs. 80.2%)
• Recidivating youth had a lower composite score on the Kaufman Brief Intelligence Test (indicating level of functional intelligence) than non-recidivists (82.6 vs. 86.9)
• Recidivating youth had a higher score on the JJC’s Initial Classification & Custody Document (indicating level of risk) than non-recidivists (12.3 vs. 10.5)
• Recidivating youth were found to have higher levels of educational/vocational need than non-recidivists, based on the JJC’s Comprehensive Informational Assessment (CIA) (3.9 vs. 3.4)
• With regard to multiple needs, recidivating youth were found to have a greater number of staff assessed areas of need based on the JJC’s CIA (5.2 vs. 4.7)
INTRODUCTION
Once an offender is released back into the community, how to deter that former offender, including parolees, from recidivating can be a difficult task for the criminal justice system and society as a whole. Recidivism can be defined a variety of ways, but for this report is defined as any rearrest, reconviction and reincarceration within a 36 month time frame post release from a State prison or a juvenile facility. The cost of recidivism by offenders has a profound impact on community safety, social capital and budget, across states and local communities. As such, the manner by which the criminal justice system deals with this problem will affect everyone. This report tracks the outcome of those released from the New Jersey Department of Corrections, the New Jersey State Parole Board and the New Jersey Juvenile Justice Commission. For the juvenile analysis, recidivism was defined as “a new offense that would be a crime if perpetrated by an adult, committed by a previously-adjudicated youth who has been released from a program
Release Outcome Report 2009………………………………………………………………… 7
or returned to the community.” For the adult analysis, recidivism was tracked on rearrest, reconviction, reincarceration and technical violations.
Over the last few years of the economic downturn, government has faced significant budget constraints, having to do more with less. Because of these budget restrictions, government has to perform and set benchmarks with performance measurement designated as the key for a more efficient system of criminal justice. The State of New Jersey continues to experience a downward trend in all three of the categories of recidivism. The full 2009 release cohort experienced a 1.85% decrease in the percentage of re-arrests and a 7.14% decrease in the percentage of re-convictions. There was an 8.57% decrease in reincarcerations, as compared to the 2008 release cohort. Approximately 67% of adult offenders did not return to prison within the 3 year analysis of this report.
In terms of New Jersey’s incarcerated population, approximately 11,895 adult inmates and 854 juvenile offenders were released in 2009 from State correctional facilities. These groups will be identified throughout the report as supervised (paroled), unsupervised and juvenile cohorts.
The JJC operates an array of correctional settings as a core responsibility within its broader mandate as a juvenile justice agency. The settings serving youth prior to their release from custody include secure care facilities, residential community homes, and day programs. JJC facilities and program sites serve both youth committed by the court to the JJC for a term of incarceration, and youth placed by the court with the JJC while serving a period of probation supervision (i.e., JJC “probationers”). Committed youth released from custody typically receive a period of supervision in the community through the JJC’s Office of Juvenile Parole and Transitional Services (JP&TS). Several transitional programs supplement the more traditional supervision and activities of JP&TS for released youth.
This report is a result of a legislative mandate instituted by P.L. 2009, c.329, (C.30: 4-
91.15). These aforementioned agencies are tasked by the legislature to compile a series of reports that record and examine recidivism rates. To that end, this report is the third in a series of reports that measures overall recidivism levels, describes adult and juvenile cohort characteristics, and analyzes those factors associated with recidivism.
The first sections of the report provide an introduction and the various agencies’ mission
statements. Additionally, it provides an extensive review of the methodology and definitions used in this report, as they significantly vary between agencies.
The following sections address recidivism of the total sample, the supervised and
unsupervised adults, the juvenile releases, and the characteristics associated with re-offending. Additionally, the factors associated with recidivism are examined, as are any patterns that have developed. The final section focuses on the conclusions from the collaborating agencies.
AGENCY MISSION STATEMENTS
New Jersey Department of Corrections
The mission of the New Jersey Department of Corrections is to protect the public by operating safe, secure and humane correctional facilities. The mission is realized through
Release Outcome Report 2009………………………………………………………………… 8
effective supervision, proper classification, appropriate treatment of offenders, and by providing services that promote successful reentry into society. According to the 2014 budget, the department is responsible for managing $1 billion and employing approximately 8,200 persons, including more than 6,000 in custody positions, to supervise approximately 23,000 inmates. The NJDOC is responsible for 13 institutions -- 11 adult male correctional facilities, one women's correctional institution and a central reception/intake unit. These facilities collectively house inmates in minimum, medium and maximum security levels. In addition, the department contracts with various Residential Community Release Program centers to provide for the transition of minimum security inmates back into the community. The department is committed to providing offender students with structured learning experiences, both academic and social, which will enhance their return to the community as productive citizens. The NJDOC’s goal is to provide the offender students with the experiences and skills necessary to enter and remain current with the advanced technology influencing the current and future job market. Comprehensive academic education and career technical training, infused with technology based skills, are important elements to a successful transition into society and the workforce. The department offers an array of institutional and community-based program opportunities for offenders, including community labor assistance, academic and vocational educational programs, recreational programs, library (lending and law) services and substance abuse treatment. Other specialized services include victim awareness, chaplaincy services, county assistance, quality assurance, liaison to Intensive Supervision Program and ombudsman services, which is a medium utilized by offenders to seek redress for problems and complaints. Additionally, the NJDOC, acting in conjunction with the New Jersey State Parole Board, provides a continuum of treatment services for offenders as they complete their sentences. Public safety is enhanced through the development, coordination, administration and delivery of these institutional and community-based programs and services. New Jersey State Parole Board
The New Jersey Parole Act of 1979 places with the New Jersey State Parole Board the
authority and responsibility of deciding which inmates of the State’s and of the counties’ correctional institutions shall be granted release on parole and what the conditions of that release will be. Since 2001, the Board has been charged with the responsibility of overseeing all of the functions, powers and duties of the State’s 364 parole officers who supervise and monitor parolees. The Parole Act of 1979 created presumptive parole, meaning that, when an inmate appears before a Board Panel, the assumption, before anything is said or reviewed, is that the inmate has a legitimate expectation of release on his or her parole eligibility date. It is therefore important that the Board make appropriate release decisions based on all relevant information. To assist Board members in this important task, the Board obtains a comprehensive pre-parole package that includes a current psychological evaluation of the inmate as well as a risk and needs assessment tool (the LSI-R) to determine what degree of supervision and what program placement may be appropriate if release is authorized.
The statute provides, as to offenses committed on or after August 19, 1997, that an adult
inmate shall be paroled unless he or she has failed to cooperate in his or her own rehabilitation or there is a reasonable expectation that the inmate will violate conditions of parole. This statutory standard implements an important objective of parole---namely, to encourage an inmate to avoid

Release Outcome Report 2009………………………………………………………………… 9
institutional disciplinary infractions and to participate in institutional programs while incarcerated. Once an offender is granted parole release, the Board then has the continuing responsibility of ascertaining and monitoring compliance with the conditions of supervision that have been established by the Board. If the parolee does not comply with the conditions of supervision, the Board has the lawful authority to issue a warrant for the arrest of that parolee. Following an administrative hearing, a Board Panel may either “revoke” the grant of parole and return the parolee to prison, or modify the offender’s parole conditions.
The mission of the Board is to improve the quality of life for the citizens of New Jersey. The Board seeks to accomplish this through the administration of an innovative parole system. The parole system in New Jersey addresses the needs of the community, victims and offenders through responsible decision-making and supervision processes. The implementation of this system results in effective parole case management and serves to attain the important goals of the Board, to increase public safety and decrease recidivism while promoting successful offender reintegration. NJSPB is committed to promoting public safety and to fostering rehabilitation of offenders by implementing policies that result in effective parole case management.
New Jersey Juvenile Justice Commission
The mission of the Juvenile Justice Commission is to lead the reform of the juvenile justice system in New Jersey as mandated by N.J.S.A. 52:17B-169 et seq. The agency values and expects its employees and residents to demonstrate leadership, integrity, commitment and respect as it works to protect public safety, reduce delinquency and hold youthful offenders accountable for their delinquent actions by:
• Partnering with local and county jurisdictions in collaborative efforts to prevent youth from entering the juvenile justice system and intervene with court-involved youth;
• Providing youthful offenders with a continuum of rehabilitative services and sanctions in appropriate settings that promote positive growth and development opportunities; and
• Assisting youthful offenders to achieve successful reentry back to their communities through a network of support services and personal skill development that strengthens their levels of self-sufficiency.
METHODOLOGY
This report examines subsequent criminal activity of adult offenders released from the completion of a maximum sentence with the New Jersey Department of Corrections or released due to court recall (n= 4,565) and released to supervision by the State Parole Board or the AOC Intensive Supervision Program (n=7,330) in 2009; this resulted in the review of criminal activity for a total sample of 11,895 adults. This study also examined the release of juveniles (n=854) from the Juvenile Justice Commission in 2009. The subjects were placed into one of the following three categories: the unsupervised cohort (NJDOC), the supervised cohort (SPB) and the juvenile cohort (JJC). It is important to note that the first valid release date was utilized for each adult offender in the cohort, which resulted in a count of offenders, not releases. This is consistent with previous federal studies and the more recent publication from the Pew Center on the States (2011)1.
Accordingly, the first rearrest was then tracked on various characteristics in an effort to not inflate the statistics. The adults who are excluded from this study are out-of-state releases or
Release Outcome Report 2009………………………………………………………………… 10
offenders who were arrested outside New Jersey, offenders without a State Bureau of Identification (SBI) number, and offenders who were deported or deceased.
In an effort to provide the highest degree of data available for review of recidivism, and beyond that supplied by federal studies, the State of New Jersey has provided data on all three levels of criminal activity as well as violations of supervision. Specifically, the adult release cohort was tracked and measured in the following ways:
1. Rearrest: Measured as the first rearrest on felony charges within the three-year follow-up,
regardless of disposition. This count would include a new arrest/crime for a parolee. This date is tracked for a review on time to failure.
2. Reconviction: Measured as the first reconviction from at least one charge within the three-year follow-up. This count is regardless of whether or not the offender went on to be readmitted to the NJDOC.
3. Reincarceration: Measured as the first New Jersey readmission for an outstanding felony indictment regardless of incarceration location within the three-year follow-up period. This is consistent with the 2011 Pew study definition of recidivism2.
4. Technical parole violation: Measured as any supervised offender who returns to State prison or county jail within the three-year follow-up for a technical violation of parole condition only (i.e., dirty urine, curfew infraction). A new crime that results in a rearrest for a supervised offender will be counted under the “rearrest” category.
Crime categories were separated consistent with the federal government’s crime types
including weapons offenses, drug offenses, property offenses, violent offenses and “other” offenses. The category of “other” crimes included offenses that did not fit into the 5 typologies, such as, crimes against the courts (contempt), traffic offenses, non-violent family offenses, decency offenses, public order and immigration offenses. Additional variables are included in an effort to determine whether an association with recidivism exists. These variables include offense dates, the type of rearrest offense, release age, LSI-R score, time served, original admission offense type, gender, race/ethnicity and prior criminal history.
Release data from the New Jersey Department of Corrections' Offender Based
Correctional Informational System (OBCIS) was matched against the State Police Offender Based Transaction System/Computerized Criminal History (OBTS/CCH) database. OBTS/CCH is used in the generation of New Jersey's “RAP” sheets – Records of Arrest and Prosecution. The inmate SBI number was used to electronically retrieve arrest, conviction and incarceration information for criminal events both prior and subsequent to their 2009 release. Additionally, there was a match to iTag records to capture program participation and LSI-R characteristics.
For the JJC analysis, the measures and definitions of recidivism were consistent with the work of the National Council of Juvenile Correctional Administrators (CJCA). Recidivism was defined as “a new offense that would be a crime if perpetrated by an adult, committed by a previously-adjudicated youth who has been released from a program or returned to the community.” Measurement of recidivism refers to the type(s) of data used to identify an individual as a recidivist or non-recidivist. While there are various ways that recidivism can be measured, the present study focused on three measures. The three primary measures of recidivism considered in the study address three distinct questions.
1. Do youth have a subsequent delinquency court filing or adult arrest for a new offense?
Release Outcome Report 2009………………………………………………………………… 11
2. Do youth have a subsequent adjudication or conviction for a new offense? 3. Do youth experience a subsequent commitment to the JJC or to the New Jersey
Department of Corrections for a new offense? The three measures, therefore, are identified as:
1. New court filing/arrest (regardless of whether it results in an adjudication of delinquency or conviction as an adult)
2. New adjudication/conviction 3. New commitment to the JJC or NJDOC
The date recorded for the recidivism event was the available date most closely
representing when the juvenile committed (or allegedly committed) the new offense. The study used this offense date to determine whether a given recidivism event occurred within three, six, 12, 24, or 36 months.3 The JJC’s Information Technology Unit provided a database, based on its Juvenile Information Management System (JIMS), containing youths’ names and relevant information to identify youth released from JJC custody during 20094. For each of the releases initially identified, an additional search was conducted with the assistance of the Administrative Office of the Courts (AOC) and the Department of Law & Public Safety’s (DL&PS) Division of Criminal Justice. The AOC (Family Division Statistics) provided recidivism-related data from its Family Automated Case Tracking System database, while the DL&PS, Division of Criminal Justice provided recidivism-related data from the State Police Criminal Case History database.
Note that since the average age at release for youth in the study was 17.8 years, many youth turned 18 years of age during the follow-up period. As a result, and as suggested by the three questions noted above, the study reviewed both juvenile and adult records for youth in order to assess recidivism5.
RESULTS NJ Department of Corrections and NJ State Parole Board
During calendar year 2009, 11,895 inmates were released from the NJDOC. Of the final
sample, 7,330 offenders were released as supervised (i.e. under parole supervision) and 4,565 offenders were released as unsupervised (max-outs), completing their sentences while incarcerated. The supervised offenders represented approximately two-thirds of all offenders released in this cohort. As can be seen in Table 1, of the total sample, 92.45% of offenders were male and 7.55% were female. The racial characteristics of the released offenders (supervised and unsupervised) show that more African American offenders (59.1%) were released, followed by Caucasian inmates (22.5%) and Hispanic offenders (17.9%). Thirty-four percent of the total sample did not have a prior correctional history, but the remaining 65.9% had a minimum of one additional State incarceration. When one looks closer, 36.8% of the supervised sample had no prior criminal history, while 29.9% of the unsupervised sample had no prior criminal history (p<.000). The most prevalent serious offense that the sample committed was a drug offense (41.3%), followed by a violent felony (20.8%). The average release age of all offenders was 35, with the unsupervised sample being statistically older than the supervised sample at 35.42 years (p<.000). The median time served for the 2009 release cohort was 502 days.

Release Outcome Report 2009………………………………………………………………… 12
Table 1: 2009 Release Cohort Characteristics Variable Supervised (n=7,330) Unsupervised (n=4,565) Total (N=11,895)
Gender
Male 6,764 4,233 10,997 (92.45%)
Female 566 332 898 (7.55%)
Race
Caucasian 1,642 1,038 2,680 (22.5%)
African American 4,311 2,715 7,026 (59.1%)
Hispanic 1,336 788 2,124 (17.9%)
Other 41 24 65 (0.5%)
Prior History*
No Prior History 2,694 1,364 4,058 (34.1%)
1 Prior Incarceration 1,499 1,003 2,502 (21.0%)
2 or More Prior Incarcerations
3,137 2,198 5,335 (44.9%)
Variable Supervised (n=7,330) Unsupervised (n=4,565) Total (N=11,895)
Most Serious Offense
Violent 1,513 957 2,470 (20.8%)
Weapon 242 172 414 (3.5%)
Property 1,491 902 2,393 (20.1%)
Drugs 3,070 1,839 4,909 (41.3%)
Other 1,014 695 1,709 (14.4%)
Release Age* Mean= 34.73 (SD= 9.9) Mean= 35.42 (SD= 10.0) Mean= 35 (SD 10.0)
Time Served in Days Median= 495 (SD= 859) Median= 509 (SD= 890) Median= 502 (SD 871.8)
*p < .000 As displayed in Table 2, 53.1% of the overall sample was rearrested, 38.8% was reconvicted and 32.4% returned to State incarceration either via a new charge or a technical violation. Of the 7,330 supervised releases, 3,828 (52.2%) were rearrested and 3,502 (47.8%) were not; and of the 4,565 unsupervised releases, 2,487 (54.5%) were rearrested and 2,078 (45.5%) were not. This difference meets statistical significance (p<.000), as more of the unsupervised offenders were rearrested. It should be noted that differences may be attributable to differences in supervision levels. Comparative statistics related to supervised vs. unsupervised offenders may sometimes be misinterpreted because supervised offenders are subject to greater scrutiny than unsupervised offenders and may be returned to prison due to technical violations or other reasons that would not be identified in someone who is not closely supervised. There is no evidence to show that supervised offenders commit more crimes than an unsupervised offender. The supervised and unsupervised groups were not statistically significant on the measures of reconviction or reincarceration.
Examining the rearrested groups further reveals that for 861 (34.6%) of the
“Unsupervised and Re-Arrested” group, the arrest occurred within the first six months, and by 12 months of release the cumulative total re-arrested was 1,438 (57.8%). In comparison, at the six month mark, 31.1% of the “Supervised and Re-arrested” group was rearrested, while over half, 2,120 (55.4%) were rearrested within 12 months of their release. This finding meets statistical significance (p<.000), as proportionally more of the unsupervised group of offenders are rearrested within the first year, particularly the first six months. The median time to failure for rearrest in days for the full sample was under one year. The supervised group had a median time

Release Outcome Report 2009………………………………………………………………… 13
to rearrest of 318 days and the unsupervised had a median of 297 days, this was not statistically different.
Table 2: 2009 Release Cohort Recidivism Characteristics Variable Supervised (n=7,330) Unsupervised (n=4,565) Total (N=11,895)
Rearrest*
Yes 3,828 2,487 6,315 (53.1%)
No 3,502 2,078 5,580 (46.9%)
Reconviction
Yes 2,832 1,788 4,620 (38.8%)
No 4,498 2,777 7,275 (61.2%)
Reincarceration
Yes 2,399 1,456 3,855 (32.4%)
No 4,931 3,109 8,040 (67.6%)
Time to Rearrest*
No Rearrest 3,502 2,078 5,580 (46.9%)
6 Months 1,191 861 2,052 (17.3%)
7-12 Months 929 577 1,506 (12.7%)
13-24 Months 1,078 665 1,743 (14.7%)
25-30 Months 362 233 595 (5.0%)
31-36 Months 268 151 419 (3.5%)
Variable Supervised (n=7,330) Unsupervised (n=4,565) Total (N=11,895)
Time to Rearrest (Days) Median= 318 (SD=293)
Median= 297 (SD=291) Median= 312 (SD=292)
Time to Parole Violation for
Parolees (Days) Mean= 353, Median= 299 (SD=241)
*p < .000
As can be seen in Table 3 below, when compared to the previous 2008 cohort, the State of New Jersey continues to experience a downward trend in all three of the categories of recidivism. The full 2009 release cohort experienced a 1.85% decrease in the percentage of re-arrests and a 7.14% decrease in the percentage of re-convictions. There was an 8.57% decrease in reincarcerations, as compared to the 2008 release cohort. This is a percent change difference and the statistics are computed to maintain methodological consistency with the Pew Center on the States 2011 “State of Recidivism” report. These decreases are consistent with the State of New Jersey’s commitment to reducing recidivistic activity.
Table 3: Four Year Comparison of Percentages
Release Year Re-Arrest Re-conviction Re-incarceration
2006 57% 47% 34%
2007 57% 45% 37%
2008 54% 42% 35%
2009 53% 39% 32%
Release Outcome Report 2009………………………………………………………………… 14
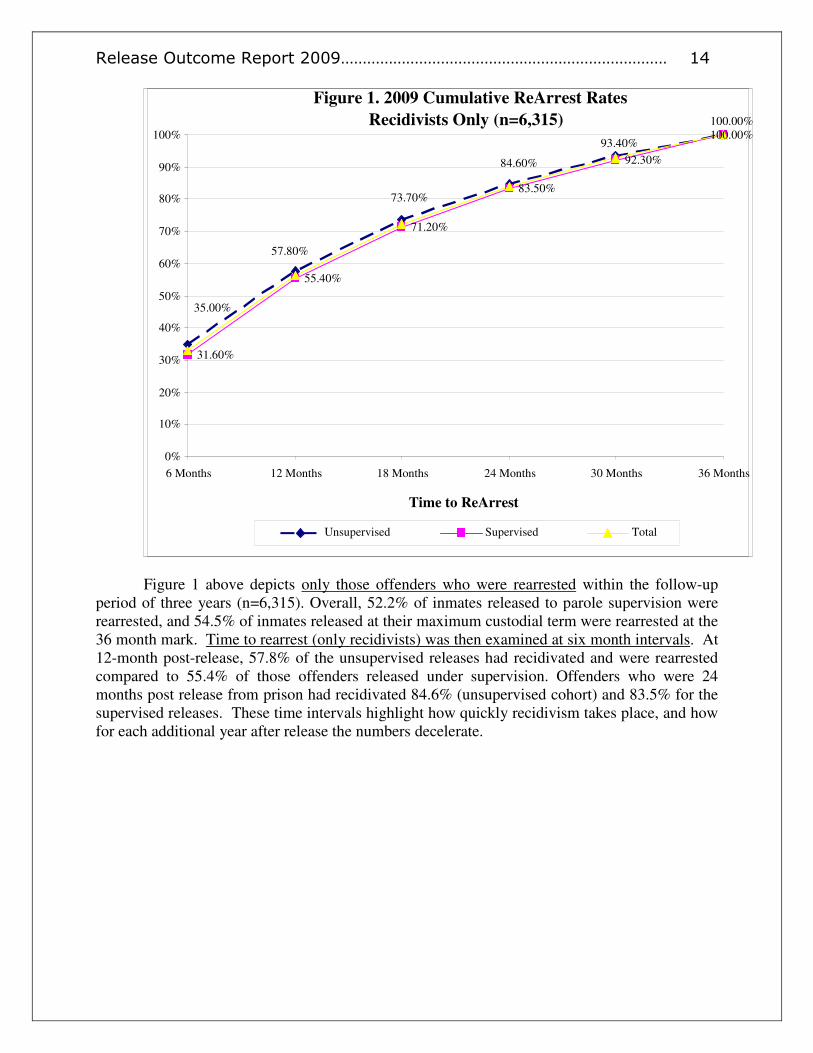
Figure 1 above depicts only those offenders who were rearrested within the follow-up period of three years (n=6,315). Overall, 52.2% of inmates released to parole supervision were rearrested, and 54.5% of inmates released at their maximum custodial term were rearrested at the 36 month mark. Time to rearrest (only recidivists) was then examined at six month intervals. At 12-month post-release, 57.8% of the unsupervised releases had recidivated and were rearrested compared to 55.4% of those offenders released under supervision. Offenders who were 24 months post release from prison had recidivated 84.6% (unsupervised cohort) and 83.5% for the supervised releases. These time intervals highlight how quickly recidivism takes place, and how for each additional year after release the numbers decelerate.
Figure 1. 2009 Cumulative ReArrest Rates
Recidivists Only (n=6,315)
31.60%
55.40%
71.20%
83.50%
92.30%
100.00%100.00%
35.00%
57.80%
73.70%
84.60%
93.40%
0%
10%
20%
30%
40%
50%
60%
70%
80%
90%
100%
6 Months 12 Months 18 Months 24 Months 30 Months 36 Months
Time to ReArrest
Unsupervised Supervised Total

Release Outcome Report 2009………………………………………………………………… 15
As graphically displayed in Figure 2 above, a breakdown of offense categories6 was
analyzed. Based on the New Jersey Criminal Code, offenses were broken down into five categories: violent, weapons, property, drug, and other. (The other category is a general category for offenses not captured by the other four main crime types). These offense types are based on the most serious offense for which offenders were convicted.
The left side of Figure 2 represents the most serious charge that led to the offender’s
incarceration during the study period (i.e. the “index offense”). These percentages are based on the entire sample of offenders (n=11,895). As depicted in the graph, drug offenses account for the largest proportion of index offenses at 41.3%, followed by violent offenses (20.8%), property offenses (20.1%), “other” offenses (14.4%), and weapons offenses (3.5%).
The right side of the graph illustrates the percentage of recidivism based upon the type of
offense committed at the index offense. When focusing on the much smaller pool of recidivists (n=6,315), the pattern of offending is interesting. Offenders who had committed weapons charges had the highest percentage of recidivists among them (61%), with those offenders who committed “other” crimes recidivating as a close second (60.5%). Violent offenders had the lowest levels of recidivism, (43.9%).
An additional way to look at the degree of recidivism is to examine the type of crimes
recommitted, based on the type of crime the offender committed originally. In essence, this
Figure 2. Most Serious Type of Offense
Index & ReArrest Offenses CY2009 NJ-DOC Release Cohort
20.8%
3.5%
20.1%
41.3%
14.4%
43.9%
61.1%
47.8%
57.1%60.5%
0%
10%
20%
30%
40%
50%
60%
70%
80%
90%
100%
Violent Weapons Property Drugs Other
Most Serious Index Offense Most Serious Recommitted Offense
Total Sample (N=11,895)
Recidivists Only (n=6,315)
Release Outcome Report 2009………………………………………………………………… 16
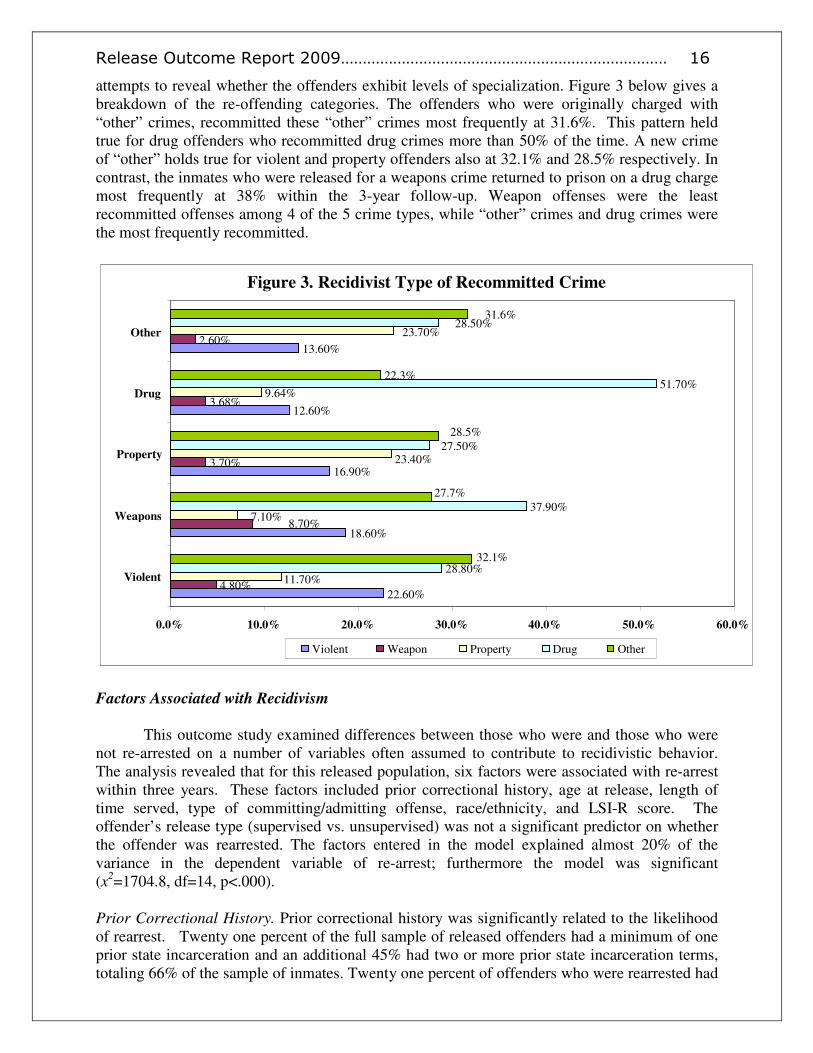
attempts to reveal whether the offenders exhibit levels of specialization. Figure 3 below gives a breakdown of the re-offending categories. The offenders who were originally charged with “other” crimes, recommitted these “other” crimes most frequently at 31.6%. This pattern held true for drug offenders who recommitted drug crimes more than 50% of the time. A new crime of “other” holds true for violent and property offenders also at 32.1% and 28.5% respectively. In contrast, the inmates who were released for a weapons crime returned to prison on a drug charge most frequently at 38% within the 3-year follow-up. Weapon offenses were the least recommitted offenses among 4 of the 5 crime types, while “other” crimes and drug crimes were the most frequently recommitted.
Factors Associated with Recidivism
This outcome study examined differences between those who were and those who were not re-arrested on a number of variables often assumed to contribute to recidivistic behavior. The analysis revealed that for this released population, six factors were associated with re-arrest within three years. These factors included prior correctional history, age at release, length of time served, type of committing/admitting offense, race/ethnicity, and LSI-R score. The offender’s release type (supervised vs. unsupervised) was not a significant predictor on whether the offender was rearrested. The factors entered in the model explained almost 20% of the variance in the dependent variable of re-arrest; furthermore the model was significant (x2=1704.8, df=14, p<.000).
Prior Correctional History. Prior correctional history was significantly related to the likelihood of rearrest. Twenty one percent of the full sample of released offenders had a minimum of one prior state incarceration and an additional 45% had two or more prior state incarceration terms, totaling 66% of the sample of inmates. Twenty one percent of offenders who were rearrested had
Figure 3. Recidivist Type of Recommitted Crime
22.60%
18.60%
4.80%
28.80%
37.90%
16.90%
12.60%
13.60%
8.70%
3.70%
3.68%
2.60%
7.10%
11.70%
23.40%
9.64%
23.70%
27.50%
51.70%
28.50%
32.1%
28.5%
22.3%
31.6%
27.7%
0.0% 10.0% 20.0% 30.0% 40.0% 50.0% 60.0%
Violent
Weapons
Property
Drug
Other
Violent Weapon Property Drug Other

Release Outcome Report 2009………………………………………………………………… 17
served one prior correctional term, and 56% of those offenders who were rearrested served two or more prior prison terms, while 23% of those with no prior incarceration were re-arrested (x2=60.02,df=2, p<.000). Multivariate statistics shed further light, indicating that if offenders had one prior correctional incarceration, the odds of a re-arrest doubled. If an offender had two prior correctional incarcerations or more, the odds of a re-arrest more than tripled. Age at release. Younger offenders were more likely to have been rearrested than older offenders; the differences across age were statistically significant. Offenders who recidivated were younger than non-recidivists (33.6 years vs. 36.5 years, t=15.77, df=11892, p<.000). Multivariate statistics indicated that age was inversely related to the odds of rearrest; for every one year increase in age, the offender’s odds of a new arrest decreased by a factor of almost one (0.95). Length of time served
7. Offenders were more likely to be rearrested for a new crime if they
served shorter amounts of time. Offenders who were rearrested served on average 643 days in prison, while non-recidivists served 796 days (t=9.50, df=11892, p<.01).
Type of Committing Offense. The type of instant offense the offender committed was significant in bivariate tests of independence and multivariate regression models predicting a new arrest. Specifically, offenders who committed weapons (61% rearrest), “other” offenses (60% rearrest) and drug offenses (57% rearrest) were rearrested proportionally more than offenders who committed a violent crime (44% rearrest) (x2=190.71, df=4, p<.000). Offenders who committed weapons, “other” crimes and drug offenses had an increased probability of a new arrest, with “other” crimes maintaining the highest odds of re-arrest (1.65), with weapon offenses close behind (1.45). Violent offenders were rearrested proportionally less than other types of offenders. Race/Ethnicity. The variable of race/ethnicity was significant in bivariate tests of independence and multivariate regression models. Proportionally, African American offenders (59%) were rearrested more, compared to Caucasian (47%) and Hispanic (40.5%) offenders (x2=304.25, df= 3, p<.000). Over 66% of offenders who were re-arrested were African American. Multivariate statistics indicated that race/ethnicity was predictive of rearrest, particularly, compared to Caucasians, African Americans had increased odds of a re-arrest of 1.20. Additionally, when compared to Caucasians, Hispanics and Asians had decreased odds of a re-arrest. LSI-R Score. The Level of Services Inventory-Revised is a risk and needs assessment instrument used to measure an offender’s level of recidivism risk. Higher scores on the scale indicate an offender is at increased risk for recidivism. Bivariate tests of independence indicated offenders who recidivated tested higher on the LSI-R measure, with recidivists scoring 26.68 (sd=6.02) and non-recidivists scoring 23.89 (sd= 7.00) (t=19.97, df=8,671, p<.000). Multivariate statistics indicated that LSI-R score was positively correlated to odds of rearrest; with an offender’s odds of a new arrest increasing by a factor of 1.04 for each additional point scored.

Release Outcome Report 2009………………………………………………………………… 18
Juvenile Justice Commission
The reporting of results begins with a focus on an examination of the overall recidivism rates for youth released from JJC custody in 2009. As shown in Figure 4, the rate of recidivism increased over time through the three-year period for each of the three measures, although there is a noticeable tapering off beyond 24 months. By one year following release, 62.8% of the youth released in 2009 had a new court filing/arrest. In addition, more than one-half (51.9%) committed a new offense resulting in an adjudication/conviction, while 20.7% offended resulting in a new commitment to a State facility. At two years following release, recidivism rates had increased considerably: more than three-quarters (79.2%) had a new court filing/arrest, 67.8% a new adjudication/conviction, and 30.9% a new commitment to a State facility. By three full
years after release, recidivism rates rose to more than eight in ten (84.8%) for new court filings/arrests, 73.4% for new adjudications/convictions, and 34.7% for new commitments. The study also examined average time to recidivate (in days) for all youth re-offending within three years. Average time to recidivate (i.e., to re-offend) was as follows:
• for those with a new court filing/arrest, 269 days;
• for those with a new adjudication/conviction, 288 days; and
• for those with a new commitment, 342 days. In other words, it took (on average) nine months for youth with new court filings/arrests
to re-offend and almost ten months for those with new adjudications/convictions to re-offend. Further, those with a new commitment took more than eleven months to re-offend.
A closer look at recidivists only (i.e., those who re-offended within three years) revealed
that a large share of recidivating youth re-offended within six months of release, with a disproportionate share doing so within one year. Specifically, with regard to youth with a new
Figure 4. Overall Recidivism Rates for Youth Released from JJC Custody in 2009
84.8%
73.4%79.2%
62.8%
40.2%
22.8%
67.8%
51.9%
30.9%
17.3%
34.7%30.9%
20.7%
12.1%7.3%
0%
10%
20%
30%
40%
50%
60%
70%
80%
90%
100%
3 Months 6 Months 12 Months 24 Months 36 Months
Arrest/Court Filing Adjudication/Conviction Commitment
Release Outcome Report 2009………………………………………………………………… 19
court filing/arrest, 47.4% recidivated within six months, and 74.0% within the first year. In addition, 42.1% of youth with a new adjudication/conviction re-offended within six months, and 70.7% did so within the first year. Finally, 34.8% of those who received a new commitment re-offended within six months, while 59.8% did so within the first year.
A substantial proportion of the recidivists re-offended shortly after release, i.e., within
three months of release. Specifically, among the recidivists, 26.9% of those with a new court filing/arrest, 23.6% of those with a new adjudication/conviction, and 20.9% of those with a new commitment re-offended within three months of their release from JJC custody.
Recent Trends in Juvenile Recidivism
As part of the analysis, a comparison was made with previous years’ findings with regard to the three measures of juvenile recidivism. As indicated in the table below, juvenile recidivism rates remained fairly stable over time, between 2007 and 2009. With regard to new court filings/arrests, the rate was essentially unchanged over the three year period. With regard to new adjudications/convictions, there was some fluctuation over the three year period. While the figure for 2009 (73.4%) was slightly higher than for the previous year (73.3%), both 2008 and 2009 show a decrease when compared to 2007. Finally, with regard to new commitments, some improvement is indicated between 2007 and 2009. The rate of 34.7% indicates a small but meaningful improvement in recidivism compared with the previous years.
Recent Trend in Juvenile Recidivism 2007 to 2009
Release Year Court Filing/Arrest Adjudication/Conviction Commitment
2007 85.0% 75.1% 38.9%
2008 85.0% 73.3% 38.7%
2009 84.8% 73.4% 34.7%
In addition to the above, time to recidivism was examined to explore potential trends. In this case, some improvement was seen for all three measures. For the 2009 cohort, it took JJC youth longer to re-offend on each measure than for the two prior years. The contrast was greater with 2008. Specifically, with regard to new court filings/arrests, it took recidivating youth 269 days to re-offend, compared with 236 days for 2008 (and 256 days for 2007). With regard to new adjudications/convictions, it took youth 288 days to re-offend and subsequently receive an adjudication/conviction, compared with 256 days for 2008 (and 273 days for 2007). As with gains in recidivism rates, the greatest improvement was in new commitments. In 2009, it took recidivating youth 342 days (close to one year) to re-offend and subsequently get committed, compared with 281 days for 2008 (and 303 days for 2007). Recidivism by Offender Status
Small to moderate differences were found between committed and probationer youth with regard to their likelihood of recidivating, with differences reaching statistical significance only for those receiving a new commitment. Committed youth were somewhat more likely to receive a new court filing/get arrested within the three-year period (committed = 85.7%; probationer = 82.9%). Committed youth were also somewhat more likely to re-offend and receive an adjudication/conviction (75.1% vs. 70.0%). Finally, committed youth were more
Release Outcome Report 2009………………………………………………………………… 20
likely to re-offend and receive a new commitment (37.6% vs. 28.9%), with the difference being statistically significant (p=.012)8.
With regard to the time it took to recidivate, committed youth took somewhat longer than probationers to re-offend for new court filings/arrests (279 days vs. 251 days), while probationers took slightly longer to re-offend for adjudications/convictions (290 days vs. 287 days). Probationers also took somewhat longer to re-offend for new commitments (385 days vs. 326 days). None of the differences were statistically significant.
Factors Associated with Recidivism
This recidivism study examined differences between those who did and those who did not recidivate in terms of a limited number of factors (i.e., variables) available for examination. The analysis of bivariate relationships revealed that for this released population, among the variables having substantial portions of both committed and probationer youth data available, nine factors were associated at a statistically significant level with recidivism within three years (on one or more of the three measures). These factors included gender, race/ethnicity, municipality of residence, number of total adjudications of delinquency, type of committing/admitting offense, degree of committing/admitting offense, Reading Proficiency, Math Proficiency, and Educational Classification Status. Gender. Released males were substantially more likely to have recidivated than females; the difference was statistically significant for each of the three measures. The recidivism rate for males was substantially higher for new court filings/arrests within three years of release (85.8% vs. 68.6%, p= .001); for new adjudications/convictions (74.7% vs. 52.9%, p=.001); and for new commitments (35.9% vs. 15.7%, p=.003). Race/Ethnicity. Released African American youth were most likely to have had a new court filing/arrest (86.5%), followed by Hispanic youth (82.5%), Caucasian youth (76.7%), and Other youth (75.0%). This difference in new court filings/arrests across race/ethnicity failed to reach statistical significance (p=.075). Youth categorized as Other (non-Caucasian; a total of eight youth included in the study) were most likely to have received a new adjudication/conviction (75.0%), followed by African American youth (74.6%), Hispanic youth (73.7%), and then white youth (64.0%); the difference was not statistically significant (p=.218). Finally, unlike for the prior measures, the difference for new commitments across race/ethnicity was statistically significant (p=.000), with a total of 39.2% of African American youth receiving a new commitment, followed by 29.2% of Hispanic youth, 12.8% of white youth, and 12.5% of Other youth.
As part of the analysis, race/ethnicity was recoded into “minority” and “nonminority” categories (with Caucasian the sole race/ethnicity category coded as nonminority). Those categorized as minority (i.e., youth of color) were more likely to have recidivated, with the differences reaching statistical significance for all three measures. Minority youth were more likely to have had a new court filing/arrest (85.7% vs. 76.7%, p=.029); a new adjudication/conviction (74.5% vs. 64.0%, p=.036; and a new commitment (37.1% vs. 12.8%, p=.000). Municipality of Residence. Released youth were categorized as residing in one of the fifteen most densely populated New Jersey cities (the urban 15 areas), or not9. Statistically significant differences were found for new court filings/arrests and for new commitments. Those residing in
Release Outcome Report 2009………………………………………………………………… 21
the Urban 15 areas were more likely than those in non-Urban 15 areas to have recidivated based on new court filings/arrests (89.1% vs. 81.2%, p=.001); new adjudications/convictions (76.4% vs. 70.9%, p=.071); and new commitments (39.1% vs. 31.0%, p=.013). Number of Adjudications. The average number of adjudications of delinquency accumulated by the time youth were committed or admitted to the JJC (both prior and current adjudications) for the released population was 7.0. Statistically significant differences were found for each of the three measures. The average number for youth who experienced a new court filing/arrest within three years of release was higher than for those who did not (7.3 vs. 5.2, p=.000). The same was true for new adjudications/convictions (7.5 vs. 5.6, p=.000), and for new commitments (8.1 vs. 6.4, p=.000). Type of Offense. Youth committed/admitted to the JJC for public order offenses (e.g., disorderly conduct) were most likely to have had a new court filing/arrest within three years (95.9%), followed by those entering with weapons offenses (94.6%), CDS offenses (92.3%), property offenses (85.8%), Violations of Probation, VOPs (83.3%), and then persons offenses (77.7%). The difference was statistically significant (p=.000). For new adjudications/convictions, the highest rate was for weapons offenses (89.3%), followed by public order offenses (83.7%), CDS offenses (83.1%), property offenses (77.5%), VOPs (69.7%), and, finally, persons offenses (64.9%). The difference was also statistically significant (p=.000). Finally, for new commitments, the highest rate was for weapons offenses (46.4%), followed by public order offenses (44.9%), property offenses (42.5%), CDS offenses (37.7%), persons offenses (30.6%), and then VOPs (28.6%). The difference for new commitments was also statistically significant (p=.010). Degree of Offense. Youth committed/admitted to the JJC for 3rd degree offenses were most likely to have had a new court filing/arrest within three years (90.2%), followed by those entering with 4th degree offenses (89.3%), disorderly persons or petty disorderly persons offenses (DP/PDP) (87.1%), VOPs, which have no designated degree (83.3%), 2nd degree offenses (80.9%), and, finally, 1st degree offenses (73.5%). The difference in new court filing/arrest by degree of offense was statistically significant (p=.006). For new adjudications/convictions, the highest rate was for youth with 4th degree offenses (82.1%), followed by 3rd degree offenses (82.0%), DP/PDP offenses (79.0%), VOPs (69.7%), 2nd degree offenses (69.1%) and then 1st degree offenses (52.9%). The difference was also statistically significant (p=.000). Finally, for new commitments, youth with 4th degree offenses had the highest recidivism rate (48.2%), followed by 3rd degree offenses (40.6%), 2nd degree offenses (37.1%), VOPs (28.6%), DP/PDP offenses (25.8%), and 1st degree offenses (23.5%). The difference in new commitments was also statistically significant (p=.002). Reading Proficiency (Grade Level Equivalency). The MAP Reading Test is a standardized assessment tool used as an indicator of preparedness for NJ high school proficiency exams. It is considered to be one of several available ways to assess academic achievement. The average grade level equivalent for Reading based on the MAP Test was 5.3. Statistically significant differences were found for all three measures. For new court filings/arrests, the average grade level for recidivists was lower (5.2 vs. 6.0, p=.020). The same was true for new adjudications/convictions (5.1 vs. 6.0, p=.003), and for new commitments (4.9 vs. 5.6, p=.002).
Math Proficiency (Grade Level Equivalency). The MAP Math Test also serves as an indicator of preparedness, here with regard to the area of Math proficiency. The average grade level
Release Outcome Report 2009………………………………………………………………… 22
equivalent for Math based on the MAP Test was 5.3. Statistically significant differences, again, were found for all three measures. For new court filings/arrests, the average grade level for recidivists was lower (5.2 vs. 5.9, p=.015). The same was true for new adjudications/convictions (5.1 vs. 6.0, p=.000), and for new commitments (4.8 vs. 5.6, p=.001). Education Classification Status (Special Education). For the overall released youth population, 51.5% were “classified,” receiving special education and/or related services, while the remaining 48.5% received regular education activities and services. Education classification status was related to recidivism, at a statistically significant level, for both the new court filings/arrests and the new adjudications/convictions measures, but not for new commitments. Specifically, for new court filings/arrests, 89.0% of the educationally classified youth recidivated compared with 80.2% of those not classified (p=.000). Also, for new adjudications/convictions, 79.5% of the educationally classified youth recidivated compared with 67.5% of those not classified (p=.000).
In addition to the above analysis, multivariate analysis was undertaken using logistic regression. The six explanatory factors which included data for the large majority of youth in the analysis (based on bivariate analysis), and that were found to be appropriate for the procedure were included in the analysis: gender, minority status, total number of adjudications of delinquency, municipality of residence (i.e., Urban 15 vs. non-Urban 15 areas), MAP Reading Grade Equivalency, and Education Classification Status. The statistical procedure examined the effects of the six factors on recidivism (measured as new court filings/arrests) for the released population. The analysis found that when analyzed together, total adjudications (p=.000), and gender (p=.007) each demonstrated independent significant relationships with recidivism while the remaining four factors no longer maintained a statistically significant relationship with re-offending.
Finally, in addition to the recidivism analyses described above, several additional
characteristics of released juveniles were examined, with a primary concern for their relationship with the new court filings/arrests measure. The focus of the further analysis was on areas of youths’ functioning and needs. For these additional variables, data is collected exclusively or largely on JJC’s committed youth (rather than on JJC’s probationers). As a result, the findings are relevant largely for the JJC’s committed population. Statistically significant relationships with recidivism (i.e., new court filings/arrests) were found as follows:
• Recidivists were found to score more highly on the JJC’s Initial Classification & Custody Document (ICCD) which guides placement decisions and serves as a broad measure of risk for subsequent behavior problems. The average ICCD score for recidivists was 12.3, compared with 10.5 for non-recidivists (p=.006).
• Recidivists were found to have higher need scores than non-recidivists regarding the educational/vocational need area (p=.032), based on the JJC’s Comprehensive Informational Assessment (CIA), 3.9 vs. 3.4 total score, p=.032. The item within the educational/vocational area that best differentiated recidivists and non-recidivists involved whether the youth had ever been expelled from school, with those expelled being more likely to recidivate. The CIA tool assesses levels of need on eight separate life domains along with an overall assessment of total need. The domains include: family/household; educational/vocational; substance abuse; peers/role models; attitudes/behaviors; use of time/leisure activity; medical/physical health; and psychological/mental health. None of the remaining need areas were found to have a statistically significant relationship with new
Release Outcome Report 2009………………………………………………………………… 23
court filings/arrests, although individual items within those areas were found to be related to recidivism.
• Recidivists were found to have a greater number of staff assessed areas of need based on the CIA (5.2 vs. 4.7, p=.005). Additionally, youth assessed by staff as having moderate or higher levels of need in five or more distinct need areas (out of a total of eight need areas) were more likely to recidivate (89.0% vs. 79.8%, p=.004).
• Recidivists had a somewhat lower composite score of functional intelligence than non-recidivists (82.6 vs. 86.9, p=.001), based on the Kaufman Brief Intelligence Test (KBIT). The average score for the released population on the KBIT was 83.2. Test results indicated that the released youth typically functioned well below the average range in terms of intelligence.
Once again, a multivariate analysis was undertaken using logistic regression. This time
ICCD score, educational/vocational need, number of assessed needs, and KBIT score were entered into the logistic regression analysis along with the six explanatory factors included in the analysis discussed earlier This multivariate analysis found that with the 10 factors analyzed together, once again gender (p=.001) and total adjudications (p=.004) demonstrated independent significant relationships with recidivism, as did area of educational/vocational need (p=.028), while the remaining factors no longer maintained a statistically significant relationship with re-offending.
CONCLUSION
This report is the third in a series of reports measuring various outcomes relative to New Jersey’s adult and juvenile offender populations and meets a legislative mandate. To this end, the New Jersey Department of Corrections (NJDOC), the New Jersey State Parole Board (NJSPB) and the Juvenile Justice Commission (JJC) examined the recidivism of a select cohort of offenders (juvenile and adult) released from the custody of each respective law enforcement agency in calendar year 2009. In addition to measuring overall recidivism levels, this report describes adult and juvenile cohort characteristics, as well as analyzes those factors associated with recidivism. Both supervised (NJSPB) and unsupervised (NJDOC) releases were examined.
The NJDOC defines recidivism in agreement with the Department of Justice, Bureau of
Justice Statistics and the Pew Center on the States, while the JJC defines recidivism in accordance with the National Council of Juvenile Correctional Administrators (CJAC). For the juvenile analysis, recidivism was defined as “a new offense that would be a crime if perpetrated by an adult, committed by a previously-adjudicated youth who has been released from a program or returned to the community.” For the adult analysis, recidivism was tracked on rearrest, reconviction, reincarceration and technical violations. All analyses presented the overall recidivism rates up to 36 months post release.
For adult offenders, regardless of their release type, 53.1% of the cohort was rearrested
and this represented a 1.85% decrease from the 2008 release cohort. Approximately 39% of the adult cohort was reconvicted, this is a 7.14% decrease from the 2008 release cohort. Lastly, 32.4% of the adult cohort was reincarcerated, representing an 8.57% decrease from the 2008 release cohort. The time to failure for those offenders who were rearrested, was just under one year (median=312, sd= 292).
Release Outcome Report 2009………………………………………………………………… 24
For this report, the Juvenile Justice Commission followed the justice system activity of its released youth for three full years after each had been released from custody. As the results of the analysis of the 2008 releases indicate, rates of recidivism were substantial. Specifically, at the three-year point, 84.8% of the released youth had a new court filing/arrest, 73.4% re-offended resulting in a new adjudication/conviction, and 34.7% re-offended resulting in a new commitment to the JJC or to State prison. An examination of juvenile recidivism rates over a three year period (2007 to 2009) revealed generally stable figures, with the exception being a small but meaningful drop in new commitments in 2009. To provide some context for the results, it is worth noting that the juvenile justice literature reports that juveniles placed in State correctional programs across the country return to offending and to the correctional system at high rates, and often very quickly. The extent of identified personal, family and community/neighborhood risk factors faced by youth placed with the JJC underscores the challenges to achieving sustained, successful reintegration back to the community. What is clear from the findings is that many youth begin to re-offend in the early months after their release from custody. Specifically, by the time youth had been released for three months, 22.8% of the released youth had a new court filing/arrest, 17.3% re-offended and were subsequently adjudicated/convicted, and 7.3% re-offended and were subsequently committed. Even so, these figures and a related analysis of time to recidivism over the three year period of 2007 to 2009 reveal that JJC youth in the 2009 cohort took longer to re-offend, on each of the three recidivism measures, than youth in the 2007 and, especially, the 2008 cohorts.
In addition to investigating recidivism by release type and time to failure, demographic
and incarceration variables were measured to identify which factors are associated with recidivism, and if related, their level of influence. For the adult cohort, several variables were found to correlate with and increase the odds of recidivism. These variables include race, release age, prior incarceration, committing offense type, time served, and LSI-R score. In terms of demographic variables, those offenders who are younger and African-American are at greater risk of reoffending. A new arrest was higher for male offenders during the 36 month after release. The age variable in criminological research is considered a significant contributor to recidivism and it followed the expected pattern in this report. In the NJDOC 2009 cohort, the recidivists were younger than those offenders who did not recidivate. This is consistent with prior criminological research which states that offenders age out of crime and that crimes is negatively correlated with age. Moreover, unsupervised offenders, drug offenders, offenders serving shorter sentences, and offenders with lengthier correctional histories were more likely to recidivate. Prior correctional history was the largest contributor to re-arrest. Specifically, one prior incarceration doubled the odds of a re-arrest, while two or more tripled the odds of a re-arrest. These findings are in accordance with prior research. An offender’s LSI-R score also proved to predict re-arrest, and showed a positive correlation. As an inmate’s risk score increased, so did their odds of a re-arrest.
As the NJDOC release cohort analysis shows, offenders who were released in 2009
tended to follow the same patterns as releases in previous years, with continued decreases in recidivism. Many of the offenders in NJ were rearrested for a drug offense and a drug offense tended to be the most serious offense which led to the instant offense for this cohort. The
Release Outcome Report 2009………………………………………………………………… 25
NJDOC will continue the trend of working with stakeholders in the community to address drug offending.
Within the NJDOC cohort there were differences between those who did recidivate and
those who did not. Approximately 67% of offenders did not return to prison within the 3 year analysis of this report. These offenders have likely returned to their communities as productive citizens and this is worth noting. The programs that the NJDOC offers to inmates are substantial in size and value, including academic and certification courses. Data collection on these types of courses, as well as the over 1,000 classes offered, is in its early phases.
In the JJC study, there were differences examined between those who did and those who
did not recidivate within three years of release. In the overall analysis of bivariate relationships, thirteen factors were identified as being significantly associated with recidivism as measured by new court filings/arrests. They included: gender (males recidivated at higher rates); race/ethnicity (minority youth (i.e., youth of color) recidivated at a higher rate than Caucasian youth). The municipality of residence (those residing in the 15 most populated municipalities recidivated at higher rates than those who resided elsewhere); number of delinquency adjudications (those having a greater number of prior and current delinquency adjudications recidivated at higher rates). The type of offense (those with public order offenses at admission/commitment were the most likely to recidivate); degree of offense (those with 3rd degree offenses at admission/commitment had the highest rate of recidivism). Others factors such as Reading Proficiency (those with lower test scores recidivated at higher rates); Math Proficiency (those with lower test scores recidivated at higher rates); and Education Classification Status (those classified as requiring special education and/or related services recidivated at higher rates); functional intelligence (recidivists had lower composite scores on the KBIT); ICCD score (recidivists had a higher ICCD score, a broad measure of risk of subsequent behavior problems); Educational/Vocational Needs (recidivists had a higher level of assessed need in this area); and Multiple Needs ( recidivists had a greater number of staff assessed areas of need). Finally, a final multivariate analysis of the above factors identified as appropriate for the procedure was undertaken. The analysis found that when analyzed together only gender, total adjudications, and level of educational/vocational need demonstrated independent relationships with recidivism (measured as a new court filing/arrest).
As policymakers galvanize attention toward proven program approaches to reduce criminogenic behavior, the NJDOC, SPB and JJC will adhere to their mission statements and continue the efforts to keep both adult and juvenile offenders from returning to a life behind bars. Commitment to this goal ensures safer communities and provides a benchmark for future success. As these three agencies move forward with safeguarding the public, they will continue to cultivate programs which will continue the downward trend of recidivism. Since most offenders in prison will return to the community, law enforcement professionals should continue to assist these offenders while they are incarcerated to prepare for life upon reentry.

Release Outcome Report 2009………………………………………………………………… 26
Notes
1. Following the precedent and methodology set by the U.S. Department of Justice, Bureau of Justice Statistics (Langan, P.A., & Levin, D.J. (2002) Report NCJ 193427) and the recent PEW study (Pew Center on the States, State of Recidivism: The Revolving Door of America’s Prisons, April 2011), a three-year follow-up was undertaken. This time frame allowed for the examination of recidivism patterns and variations among supervision levels and types of offenders, while also contributing to an improved understanding of the factors that impact recidivism.
2. This outcome study uses the same counting measure of readmission to the NJDOC for a new crime or a technical violation as the 2011 PEW publication, with the exception that a number of cases had to be excluded due to missing information and/or mismatched identities. 3. Council of Juvenile Correctional Administrators. (August 2009). A CJCA White Paper: Defining and
Measuring Recidivism. Braintree, MA: CJCA. 4. This decision is most relevant for the measures “new adjudication/conviction” and “new commitment to JJC/DOC.” For example, “new adjudication/conviction within one year” means that the offense leading to the new adjudication/conviction occurred within one year, even though the actual adjudication/conviction may have occurred sometime after that one-year mark. An end date (December 31, 2012) was utilized for the analysis after which recidivism was not considered for anyone in the study. By that date, all study youth had been released for at least three years. This was done to maximize consistency across annual recidivism analyses. 5. The rate of recidivism increased over time through the three-year period for each of the three measures, although there is a noticeable tapering off beyond 24 months. The final data file on which the analysis was provided included data on 854 separate cases, with one case corresponding to each released juvenile included in the analysis. Valid admission types were identified as: new admissions, recommitments from parole, recommitments from post-incarceration supervision, and recommitments from judicial recall. Valid release types were identified as: maxed out, maxed to post-incarceration supervision, paroled, and (for probationers) released completed. 6. These definitions follow the NJ Criminal Codes Parts 1 through 5 (except Weapons and Drug Offenses- defined in Part 5 Crimes against Public Order, Health and Decency) and are extracted for the study purposes. Violent crimes involve Danger to a Person (which includes Criminal Homicide, Cloning, Assault, Reckless Endangering and Threats, Kidnapping, Sexual Offenses, Robbery, Arson and Bias Crimes). Property crimes include Offenses against Property (which includes Criminal Mischief & Other Property Destruction, Burglary & Criminal Intrusion, Theft, Forgery & Fraudulent Practices and Disturbance/Desecration of Human Remains). Weapons offenses are violations of restriction on the possession, use, sales or trafficking, manufacturing, import and export of deadly weapons (firearms and their ammunition, silencers, explosives and certain knives). Drug offenses are violations of restrictions on the possession, manufacture, or distribution of Controlled Dangerous Substances (drugs classified as having a potential for abuse). This also includes Anti-Drug Profiteering, Drug Dealer Liability, and Drug Paraphernalia crimes. 7. Length of Stay means the time an inmate served in custody from the Date of Sentence (or Probable Cause Hearing if the original admission was a Technical Parole Violation) until the date of release to the community either at maximum custodial term or to Parole supervision. This represents the time that the inmate was the responsibility of NJ-DOC regardless of his or her custodial location.
8. For purposes of this report, statistical significance is identified as achieving a significance level on relevant tests of .05 or beyond.

Release Outcome Report 2009………………………………………………………………… 27
9. The six Major Urban municipalities are: Camden, Elizabeth, Jersey City, Newark, Paterson and Trenton. The fifteen urban (Urban 15) municipalities are: Bayonne, Camden, Clifton, East Orange, Elizabeth, Irvington, Jersey City, Newark, Passaic, Paterson, Toms River Township, Trenton, Vineland, and Woodbridge Township. Listed in the top 100 nationally in rank order; are the highest receiving municipalities, which are the top most dangerous cities in New Jersey. They are: Camden (2nd.), Atlantic City (7th), Trenton (29th), Bridgeton (44th), Newark (51st), Elizabeth (71st), and Paterson (84th).