state of michigan department of treasury · city of thousand oaks water and wastewater financial...
TRANSCRIPT

Water and Wastewater Financial Plan Study Report City of Thousand Oaks
Flint Water Rate Analysis
State of Michigan
Department of Treasury
Final Report | May 13, 2016


3013 Main Street Kansas City, MO
Phone 816.285.9020 Fax 816.285.9021
www.raftelis.com
May 11, 2016
Mr. Nick A. Khouri State Treasurer State of Michigan 430 W. Allegan Street, 3rd Floor Lansing, MI 48922
Subject: Flint Water Rate Analysis
Dear Treasurer Khouri, Raftelis Financial Consultants, Inc. (RFC) is pleased to submit our report which summarizes our
conclusions with respect to the rate analysis for the City of Flint’s (City) water utility for the
Karegnondi Water Authority (KWA) Subcommittee of the Flint Water Interagency Coordinating
Committee (FWICC). Based on our analysis we can conclude the following:
1. Flint’s system was built to serve 200,000, but now has a population of less than half of that. The
result is a shrinking number of customers responsible for the growing costs of the aging water
system.
2. The typical customer bill is $53.84 per month. This is comprised of overall operating costs ($18.56),
GLWA purchases ($12.95), capital costs including KWA debt service ($8.65), Transfer to Other City
Funds ($7.54), retiree healthcare ($3.19), non-revenue water (due to leakage, theft, meter error,
firefighting and hydrant flushing) ($2.94).
3. Flint’s rates are high relative to peer communities. The historical policy of purchasing water from
DWSD and maintaining a treatment plant is likely a large contributor to this difference. If Flint’s
cost structure were similar to that of peer utilities, Flint’s typical bill would be substantially lower.
4. Flint’s current rates are not sufficient to fund the water utility. Absent any action to increase
funding or decrease costs, this funding gap will continue to rise over time. Solutions to this funding
gap include reducing costs or subsidizing some costs at the state and federal level.
5. The options selected by the City for water supply and back-up supply will have a significant impact
on rates moving forward.
We stand ready to assist the Treasury, KWA Subcommittee and Flint Interagency Water coordinating
committee going forward.
Sincerely,
RAFTELIS FINANCIAL CONSULTANTS, INC.
William G. Stannard, PE President and Chief Executive Officer

State of Michigan Department of Treasury
TABLE OF CONTENTS
EXECUTIVE SUMMARY ............................................................................ 1
KEY FINDINGS .................................................................................................................. 1
BACKGROUND AND OBJECTIVES OF THE STUDY ....................................................... 5
HOW DID FLINT WATER RATES GET TO THE LEVEL THEY ARE NOW? ..................... 6
WHAT ARE THE LARGEST COST DRIVERS OF FLINT’S EXISTING RATES? ............... 9
WHY ARE FLINT’S RATES SO MUCH HIGHER THAN OTHER COMMUNITIES? ..........10
WHAT MIGHT FLINT’S COSTS LOOK LIKE GOING FORWARD? ..................................13
1. COST DRIVERS OF FLINT WATER RATES ..................................... 16
1.1 HISTORICAL FLINT WATER RATES ........................................................................16
1.2 CURRENT FLINT WATER RATES ............................................................................19
2. UTILITY BENCHMARKING ................................................................ 29
2.1 COMMUNITIES FOR COMPARISON .........................................................................29
2.2 OPERATING AND CAPITAL COST COMPARISON .................................................33
2.3 NON-REVENUE WATER ...........................................................................................38
2.4 FLINT RATES WITH COSTS AT PEER UTILITY LEVEL ..........................................39
3. PROJECTION OF FUTURE WATER COSTS .................................... 42
3.1 DISCUSSION OF WATER SUPPLY AND BACK-UP OPTIONS ................................42
3.2 SUFFICIENCY OF EXISTING RATES TO COVER WATER UTILITY COSTS ...........43
3.3 COST PER TYPICAL CUSTOMER PROJECTION ....................................................44
3.4 CONCLUSION REGARDING COST PROJECTIONS ................................................44
APPENDICES .......................................................................................... 47
APPENDIX A: BENCHMARKING DATA ...........................................................................47
APPENDIX B: UTILITY COST DATA ................................................................................50
GLOSSARY OF TERMS .......................................................................... 52

Analysis of Flint Water Rates
This page intentionally left blank to facilitate two-sided printing.

Analysis of Flint Water Rates | 1
EXECUTIVE SUMMARY
KEY FINDINGS
How did Flint’s water rates get to the level they are now?
1. The Flint water system is largely a fixed cost operation, meaning the cost of providing water
service to Flint customers does not vary significantly with the amount of water used.
2. The water system was built to serve 200,000 people, while the current population is less than half
of that.1 Over time, as the population and industrial base of the City declined, City customers
used less and less water, while costs continued to increase. This was further impacted by the loss
of revenues from General Motors.
3. Prior to Fiscal Year (FY) 2009, the City went many years without any rate increases, while the cost
of producing water, including costs from Flint’s water provider Detroit Water and Sewerage
Department (DWSD), continued to rise at a rate of approximately 6.2 percent per year.2 The water
utility has historically been (and continues to be) behind the curve and needed larger rates
increases to mitigate the deficits that had built up from prior years.
4. Historically, Flint has been required to maintain its own treatment plant as back-up, in addition to
purchasing water from DWSD. Due to the use of the treatment plant as back-up, the City has
effectively been paying for two water sources.
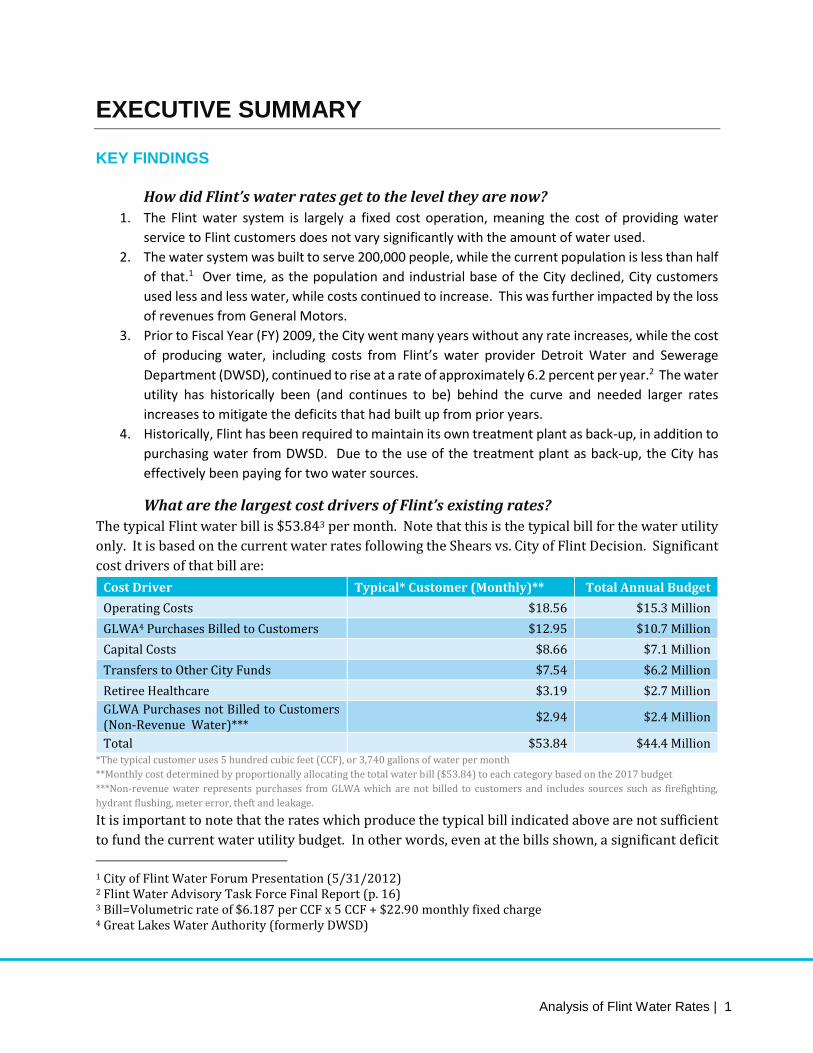
What are the largest cost drivers of Flint’s existing rates?
The typical Flint water bill is $53.843 per month. Note that this is the typical bill for the water utility
only. It is based on the current water rates following the Shears vs. City of Flint Decision. Significant
cost drivers of that bill are:
Cost Driver Typical* Customer (Monthly)** Total Annual Budget
Operating Costs $18.56 $15.3 Million
GLWA4 Purchases Billed to Customers $12.95 $10.7 Million
Capital Costs $8.66 $7.1 Million
Transfers to Other City Funds $7.54 $6.2 Million
Retiree Healthcare $3.19 $2.7 Million
GLWA Purchases not Billed to Customers (Non-Revenue Water)***
$2.94 $2.4 Million
Total $53.84 $44.4 Million *The typical customer uses 5 hundred cubic feet (CCF), or 3,740 gallons of water per month
**Monthly cost determined by proportionally allocating the total water bill ($53.84) to each category based on the 2017 budget
***Non-revenue water represents purchases from GLWA which are not billed to customers and includes sources such as firefighting,
hydrant flushing, meter error, theft and leakage.
It is important to note that the rates which produce the typical bill indicated above are not sufficient
to fund the current water utility budget. In other words, even at the bills shown, a significant deficit
1 City of Flint Water Forum Presentation (5/31/2012) 2 Flint Water Advisory Task Force Final Report (p. 16) 3 Bill=Volumetric rate of $6.187 per CCF x 5 CCF + $22.90 monthly fixed charge 4 Great Lakes Water Authority (formerly DWSD)
2 | State of Michigan Department of Treasury
between projected revenues and expenditures exists. The City’s current cash flow projections for the
next fiscal year indicate a potentially tenuous position in the near future.
Why are Flint’s rates so much higher than other communities?
The City’s water rates produce a bill of $53.84 per month for the typical customer, the highest of any
of the peer utilities surveyed. The cost structure of Flint’s water utility compared to its peers is the
key driver of the difference between Flint’s rates and its peers. Specific differences include:
1. Water Supply and Treatment Costs: It costs the City of Flint approximately $10 to produce 1,000
gallons of water versus an average of $2 per 1,000 gallons for the peer utilities. A large driver of this
difference has been the requirement to maintain the Flint Water Treatment Plant as a back-up source,
in addition to purchasing treated water from DWSD.
2. System Size: Flint currently maintains 96 feet of pipe per customer, versus the average of 83 feet per
customer for the peer communities. Versus peer utilities, rates from Flint customers must support a
much larger network of pipes, increasing the cost to each user.
3. Population Decline: Flint’s population declined 3 percent from 2010 to 2014 versus a decline of
only .11 percent for the peer utilities surveyed. Versus peer utilities, Flint’s customers are increasingly
more responsible for a greater share of system costs per customer.
4. Transfers to Other City Funds: Transfers represent 17 percent of Flint’s operating budget, over twice
the peer average of 7 percent. Transfers to other funds recognize the costs to those funds of providing
services to the water utility. While some level of transfers is entirely appropriate, Flint has highest
level of transfers of any of the peer utilities surveyed.
5. Non-Revenue Water: In recent years, Flint has only billed 50 to 60 percent of the water it produces
compared to 90 percent for peer utilities. While some losses, such as the water used to fight fires,
are legitimate, others such as leakage, meter error and theft are more problematic and cause Flint’s
rates to be higher than they otherwise would be.
6. Retiree Healthcare Costs: Flint spends approximately 7 percent of its operating budget on retiree
healthcare costs. Peer utilities spend 5 percent of their operating budgets on average.
If Flint’s cost structure were similar to its peer utilities the typical bill for Flint customers would be
substantially lower.
Analysis of Flint Water Rates | 3
What might Flint’s costs look like going forward?
As part of the analysis, the Treasury Department asked RFC to produce a five year projection of water
costs for the typical Flint customer. After examining the cost and usage data as well as the currently
estimated future capital costs, we can draw four conclusions regarding future costs.
1. There is a gap between the existing bill paid by the typical Flint customer and the estimated costs
necessary to support the system.
2. Absent any action to increase funding or reduce costs, the gap between revenues and costs will
continue to grow.
3. The decisions regarding future water supply for Flint will impact the level of costs going forward.
4. Reducing this gap will require some combination of reduced operating expenditures and
subsidization of operating or capital expenditures.
Note that the projections shown are not rate proposals, but rather are estimates of what could
occur if no action is taken on some of the issues identified in this report.
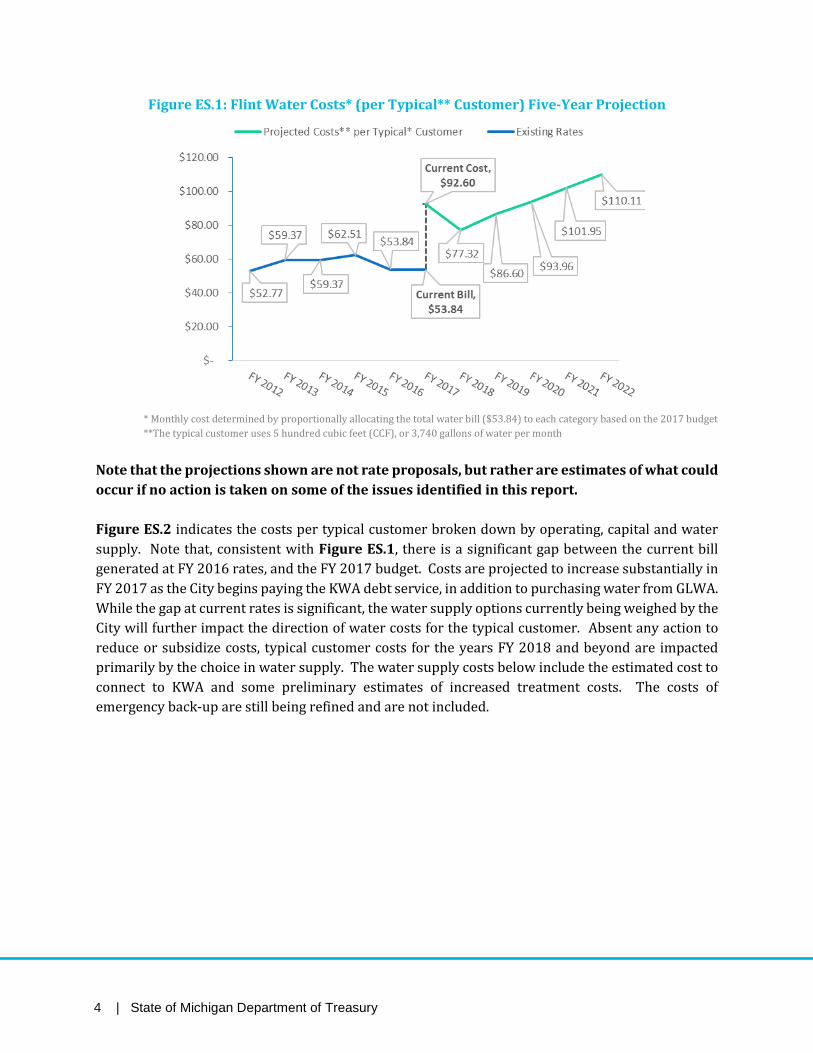
Figure ES.1 indicates the gap between the existing typical bill and the costs of the water system.
While rates currently in place produce a typical bill of $53.84 these rates are not sufficient to cover
the costs of operating the water utility. Assuming rates are unchanged in FY 2017, the typical bill will
remain at $53.84, but the costs will be substantially higher at an estimated $92.60. The dashed line
in Figure ES.1 indicates the gap. The difference is driven by numerous factors including:
1. Continuing declines in water consumption and customers in the City;
2. The rate reduction associated with the Shears vs. City of Flint Decision;
3. The unanticipated loss of revenues from General Motors;
4. The onset of debt service payments for the Karegnondi Water Authority (KWA) in FY 2017, in
addition to continued purchases from GLWA; and
5. Increases in operating costs in FY 2016 and FY 2017.
When the rates in FY 2015 were set, it was anticipated that the City would no longer be purchasing
water from DWSD (now GLWA). Given that future water supply options are still under evaluation,
the City will be paying both the KWA debt service and the GLWA purchased water cost. In other
words, the rates in place currently do not take into consideration the changes which have occurred
since they were initially set in FY 2015.
The potential reduction in costs indicated in FY 2017 relate to the assumption that the City will begin
purchasing and treating water from KWA and discontinue purchases from GLWA. It is important to
note the projections shown in Figure ES.1 are costs per typical customer and are not based on
proposed rate increases, nor do they make any presumptions about how these costs might be funded.
Section 3 details the assumptions used to develop the projections.
4 | State of Michigan Department of Treasury
Figure ES.1: Flint Water Costs* (per Typical** Customer) Five-Year Projection
* Monthly cost determined by proportionally allocating the total water bill ($53.84) to each category based on the 2017 budget
**The typical customer uses 5 hundred cubic feet (CCF), or 3,740 gallons of water per month
Note that the projections shown are not rate proposals, but rather are estimates of what could
occur if no action is taken on some of the issues identified in this report.
Figure ES.2 indicates the costs per typical customer broken down by operating, capital and water
supply. Note that, consistent with Figure ES.1, there is a significant gap between the current bill
generated at FY 2016 rates, and the FY 2017 budget. Costs are projected to increase substantially in
FY 2017 as the City begins paying the KWA debt service, in addition to purchasing water from GLWA.
While the gap at current rates is significant, the water supply options currently being weighed by the
City will further impact the direction of water costs for the typical customer. Absent any action to
reduce or subsidize costs, typical customer costs for the years FY 2018 and beyond are impacted
primarily by the choice in water supply. The water supply costs below include the estimated cost to
connect to KWA and some preliminary estimates of increased treatment costs. The costs of
emergency back-up are still being refined and are not included.

Analysis of Flint Water Rates | 5
Figure ES.2: Flint Water Costs* (per Typical Customer**) Five- Year Range
*The typical customer uses 5 hundred cubic feet (CCF), or 3,740 gallons of water per month
**Monthly cost determined by proportionally allocating the total water bill ($53.84) to each category based on the 2017 budget
***Excludes water supply costs
****Includes current estimates of costs to connect to KWA and additional treatment costs, excludes emergency back-up costs
As discussed above, the typical customer cost projections are not based on proposed or even
projected rate increases. Rather they indicate what could happen to typical customer costs in the
absence of any action being taken on the issues identified in this report. Moving forward, the
objective of all parties involved will be to identify cost savings and State and Federal subsidies to shift
the projected future costs for the typical customer downward.
BACKGROUND AND OBJECTIVES OF THE STUDY
In April of 2016, The Michigan Department of Treasury (Treasury), on behalf of the Karegnondi
Water Authority (KWA) Subcommittee of the Flint Water Interagency Coordinating Committee
(FWICC), engaged Raftelis Financial Consultants (RFC) to analyze the City of Flint’s (City) water rates,
from a historical perspective, versus peer utilities and on a going forward basis.
Until May of 2014, the City of Flint purchased water from the Detroit Water and Sewerage
Department (DWSD). Citing a desire to control costs, the City moved to join the KWA in April of 2013,
which would build its own pipeline from Lake Huron and deliver raw water to Flint and other
communities in Genesee County. Water service from DWSD ended in April 2014 because Flint’s
contract was cancelled by DWSD. The Flint River was selected as an interim source of supply to
bridge the gap between DWSD and KWA, in anticipation of the pipeline being completed in 2016.
After over a year of treating and distributing water from the Flint River, the City began purchasing
water from the Great Lakes Water Authority (GLWA), after concerns arose regarding elevated lead

6 | State of Michigan Department of Treasury
levels. The impetus for this evaluation were concerns regarding the level, key drivers, and future
trajectory of Flint water rates.
For the analysis of Flint water rates, RFC was tasked with answering the following questions:
1. How did Flint Water rates get to the level they are now?
2. What are the largest cost drivers of Flint’s existing water rates?
3. Why are Flint’s water rates so much higher than other comparable communities?
4. What will Flint’s water rates look like going forward?
HOW DID FLINT WATER RATES GET TO THE LEVEL THEY ARE NOW?
After an in depth examination of the trends in historical rates we can conclude the following are the
primary drivers of the recent rate increases:
1. The Flint water system is largely a fixed cost operation, meaning the cost of providing water
service to Flint customers does not vary significantly with the amount of water used.
5. The water system was built to serve 200,000 people, while the current population is less than half
of that.5 Over time as the population and industrial base of the City declined, City customers used
less and less water, while costs continued to increase. This was further impacted by the loss of
revenues from General Motors.
2. Prior to FY 2009 the City went many years without any rate increases, while the cost of producing
water, including costs from Flint’s water provider Detroit Water and Sewerage Department
(DWSD), continued to rise at a rate of approximately 6.2 percent per year.6 The water utility has
historically (and continues to be) been behind the curve and needed larger rates increases to
mitigate the deficits that had built up from prior years.
3. Historically, Flint has been required to maintain its own treatment plant as back-up, in addition to
purchasing water from DWSD. Due to the use of the treatment plant as back-up, the City has
effectively been paying for two water sources.
In general, historical declines in industry and population in the City have been manifest in concurrent
declines in water customers and water usage. One noteworthy contributor to increases in Flint’s
historical costs has been the increase in the cost to purchase water from DWSD (now GLWA). Figure
ES.3 indicates the DWSD/GLWA effective rate from FY 2009 to present.
5 City of Flint Water Forum Presentation (5/31/2012) 6 Flint Water Advisory Task Force Final Report (p. 16)

Analysis of Flint Water Rates | 7
Figure ES.3: DWSD/GLWA Effective* Rates to City of Flint
*Effective rate is total costs (fixed and volumetric) divided by billed usage
**Flint River used in FY 2015
***City began purchasing water from GLWA in FY 2016
Figure ES.4 below is adapted from the City’s FY 2012 Water Forum Presentation. While the water
crisis increased the financial challenges faced by the utility, these challenges are not new, as indicated
by the operating losses from FY 2007 to FY 2013 indicated below.
Figure ES.4: City of Flint Financial History Timeline from FY 2012 Water Forum Presentation

8 | State of Michigan Department of Treasury
Figure ES.5 indicates the bill for a typical Flint customer. A typical Flint customer uses 5 hundred
cubic feet (CCF), or 3,740 gallons of water per month. While Figure ES.3 below indicates that water
rates were not increased from FY 2005 to FY 2009, the City’s costs continued to increase over this
time period.
Figure ES.5: Flint Water Bill, Typical* Customer (Historical)
*The typical customer uses 5 hundred cubic feet (CCF), or 3,740 gallons of water per month
**Per Emergency Manager Order No. 31
***Per Shears vs. City of Flint Decision
Given the decline in population (and revenues), increases in operating expenditures, increases in the
rates charged for DWSD wholesale water, and increasing debt service associated with maintaining
the Flint Water Treatment plant, the lack of increases in the years prior to FY 2009 caused a
significant gap between revenues and expenditures. The result were the large increases from FY
2010 onward, which were needed to close the deficit.
It is worth noting that while the recent rate increases (including those that occurred while the City
was under emergency management) did have a significant impact on affordability for the typical
customer, these increases were the symptom, not the cause of Flint’s rate challenges. Perhaps the
most glaring cause is the shrinking customer base over which the costs are recovered.
Figure ES.6 indicates trends in water consumption and total budgeted expenditures. As indicated,
both annual consumption and customers have declined over the past 7 years. As noted above this is
only part of a much larger historical trend. Generally, a water utility is a fixed cost operation where
the majority of costs do not vary with usage or the number of customers. Consequently, despite the
significant decline in City water customers and water consumption, the costs to operate the City’s
water system have not declined at a similar rate. The result has been a decreasing number of
customers and usage over which to recover an increasing level of costs, resulting in increasing
upward pressure on water rates.

Analysis of Flint Water Rates | 9
Figure ES.6: Annual Billed Water Usage vs. Total Budget
*Purchases from DWSD ceased in FY 2015, Flint River used as primary source
WHAT ARE THE LARGEST COST DRIVERS OF FLINT’S EXISTING RATES?
While aggregate costs are helpful in evaluating the total costs of providing water service,
understanding the impact to the typical customer can be beneficial as well. As discussed above the
typical Flint customer has a current water bill of $53.84 per month. This bill can be broken down
proportionally by the various costs of the Flint water system. Note that this is not the same as the
average monthly cost per customer (as is used in Section 2 of this report), but rather it is a
proportional expression of the customer bill in terms of the water utility’s costs. Figure ES.7
indicates a breakdown of that bill by the major cost drivers of the water utility. Water Supply, for
example, costs the typical customer $15.89 per month.
It is important to note that the rates which produce the typical bill are not sufficient to fund the
current water utility budget. In other words, even at the rates shown, a significant deficit between
projected revenues and expenditures exists.

10 | State of Michigan Department of Treasury
Figure ES.7: FY 2017 Principal Cost Drivers* of Flint Water Rates ($ Monthly Per Typical** Customer)
Total: $53.84 *Monthly cost determined by proportionally allocating the total water bill ($53.84) to each category based on the 2017 budget
**The typical customer uses 5 hundred cubic feet (CCF), or 3,740 gallons of water per month
*** Non-revenue water represents purchases from GLWA which are not billed to customers and includes sources such as firefighting,
hydrant flushing, meter error, theft and leakage.
****KWA Debt Service
WHY ARE FLINT’S RATES SO MUCH HIGHER THAN OTHER COMMUNITIES? RFC and the Michigan Department of Treasury worked together to develop a list of utilities that
seemed most comparable in size, location, and utility function. Ultimately, RFC researched and
surveyed 12 water utilities across Michigan, Indiana, and Ohio in addition to the Flint water utility.
Summary demographic information is located in Table ES.1 below.

Analysis of Flint Water Rates | 11
Table ES.1: Flint and Comparable Communities
Community Number of
Customer Accounts Miles of Pipe in
System Feet of Pipe per
Customer Saginaw, MI 18,018 411 120.44 Troy, MI 27,637 540 103.17 Burton, MI 6,289 120 100.75 Flint, MI 29,805 540 95.66 Kalamazoo, MI 46,220 808 92.30 Ann Arbor, MI 26,816 441 86.83 Wyoming, MI 22,485 363 85.24 Average* 40,398 533 82.55 Canton, OH 44,829 664 78.21 Lansing, MI 55,003 750 72.00 South Bend, OH 43,273 585 71.38 Dearborn, MI 32,600 370 59.93 Dayton, OH 121,210 807 35.15 Youngstown, OH N/A
Our analysis indicates that the largest driver is the difference in water supply and treatment costs
between the City and peer utilities. This is likely due to the historical requirement that the City
operate and maintain its treatment plant, in addition to purchasing water from DWSD. Other
significant drivers of the difference include retiree health care, transfers, and higher capital costs.
Figure ES.8 below indicates the cost per customer of the key drivers, both for the City and the
average of the peer utilities. The cost per customer was determined by taking the total costs divided
the total number of customers multiplied by 12. Note that this is not the same as the proportional
allocation of the typical bill shown above.
Figure ES. 8: Key Cost Drivers of Flint Rates vs. Comparable Communities (Monthly Cost per Customer*)
*Determined by dividing the total cost for each driver by the total number of customers multiplied by 12
**Water Supply and Treatment for Flint includes water purchased from GLWA and the operation of the Flint Water Treatment Plant
$-
$10.00
$20.00
$30.00
$40.00
$50.00
$60.00
$70.00
Water Supply & Treatment Retiree Health Care Transfers Capital
Flint Cost per Customer Avg. of Surveyed Utilities Cost per Customer

12 | State of Michigan Department of Treasury
Figure ES.9 shows both the current typical Flint monthly bill of $53.84, the typical bill for each peer
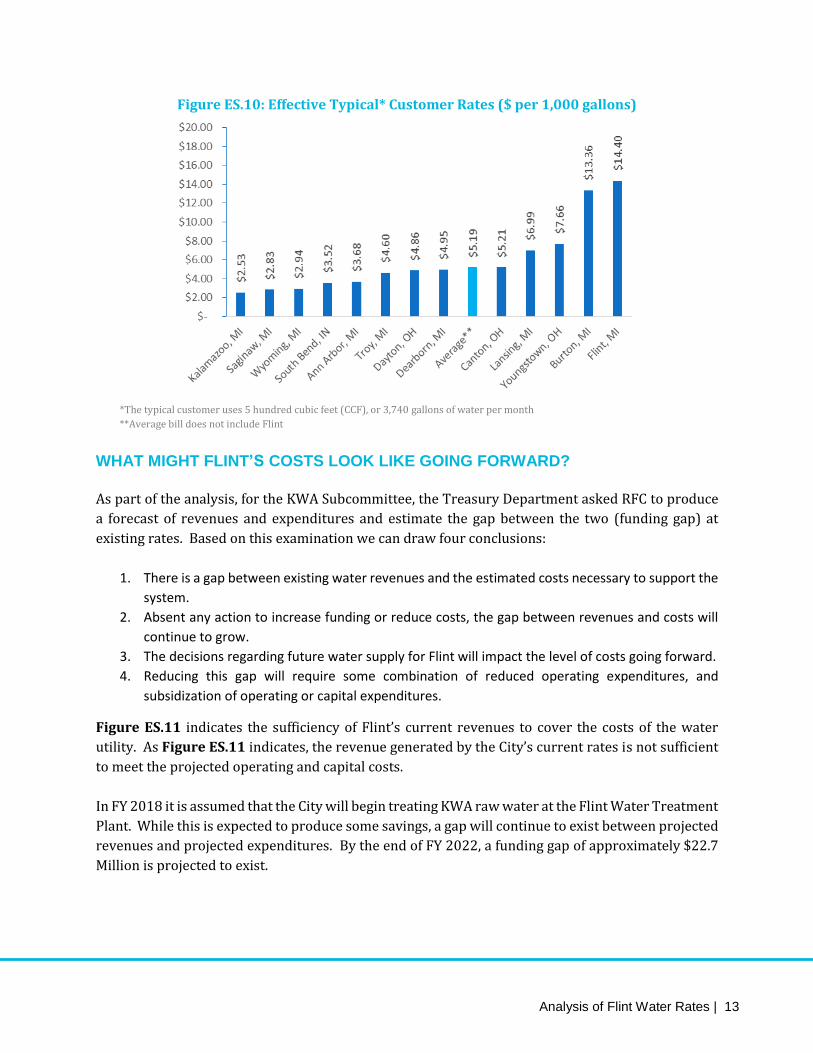
utility, and the average of the peer utilities. Figure ES.10 indicates the effective customer rate per
1,000 gallons. If Flint’s cost structure were similar to that of peer utilities, the typical Flint bill
would be substantially lower. Note that while Burton was included (to represent an additional
Genesee County community), it is a much smaller utility (<7,000 customers) whose system and
costs are not necessarily comparable to either Flint or the other peer utilities. Given that a water
system has some base level of costs to provide service, systems with very few customers tend to
have much higher rates. Burton, like Flint, faces the GLWA costs, but has the additional challenges
associated with smaller utilities.
Figure ES.9: Typical* Flint Monthly Bill at Comparable Levels of Peer Utilities
*The typical customer uses 5 hundred cubic feet (CCF), or 3,740 gallons of water per month
**Average bill does not include Flint
Analysis of Flint Water Rates | 13
Figure ES.10: Effective Typical* Customer Rates ($ per 1,000 gallons)
*The typical customer uses 5 hundred cubic feet (CCF), or 3,740 gallons of water per month
**Average bill does not include Flint
WHAT MIGHT FLINT’S COSTS LOOK LIKE GOING FORWARD?
As part of the analysis, for the KWA Subcommittee, the Treasury Department asked RFC to produce
a forecast of revenues and expenditures and estimate the gap between the two (funding gap) at
existing rates. Based on this examination we can draw four conclusions:
1. There is a gap between existing water revenues and the estimated costs necessary to support the
system.
2. Absent any action to increase funding or reduce costs, the gap between revenues and costs will
continue to grow.
3. The decisions regarding future water supply for Flint will impact the level of costs going forward.
4. Reducing this gap will require some combination of reduced operating expenditures, and
subsidization of operating or capital expenditures.
Figure ES.11 indicates the sufficiency of Flint’s current revenues to cover the costs of the water
utility. As Figure ES.11 indicates, the revenue generated by the City’s current rates is not sufficient
to meet the projected operating and capital costs.
In FY 2018 it is assumed that the City will begin treating KWA raw water at the Flint Water Treatment
Plant. While this is expected to produce some savings, a gap will continue to exist between projected
revenues and projected expenditures. By the end of FY 2022, a funding gap of approximately $22.7
Million is projected to exist.

14 | State of Michigan Department of Treasury
The difference is driven by numerous factors including:
1. Continuing declines in water consumption, and customers in the City;
2. The rate reduction associated with the Shears vs. City of Flint Decision;
3. Increases in annual operating costs
4. Increases in capital costs associated with transitioning to KWA
5. Increases in capital costs associated with improvements to Flint water system
While the gap at current rates is significant, the water supply options currently being weighed by the
City will further impact the direction of water costs. Costs for the years FY 2018 and beyond are
impacted primarily by the choice in water supply. The projections shown assume the City transitions
to KWA as originally planned.
As discussed above, the typical customer cost projections are not proposed or even projected rate
increases. Rather they indicate what could happen to typical customer costs in the absence of any
action being taken on the issues identified in this report. Moving forward, the objective of all parties
involved will be to identify cost savings and State and Federal subsidies to shift the projected future
costs for the typical customer downward.
Figure ES.11: Water Utility Funding Gap at Existing Rates

Analysis of Flint Water Rates | 15

16 | State of Michigan Department of Treasury
1. COST DRIVERS OF FLINT WATER RATES
The proceeding section will examine the principal drivers of the level of the City’s water rates. The
proceeding section is broken down between a discussion of historical rates and the principle
drivers of the current rates.
1.1 HISTORICAL FLINT WATER RATES
After an in depth examination of the trends in historical rates we can conclude the following are the
primary drivers of the recent rate increases:
1. The Flint water system is largely a fixed cost operation, meaning the cost of providing water
service to Flint customers does not vary significantly with the amount of water used.
2. The water system was built to serve 200,000 people, while the current population is less than half
of that.7 Over time, as the population and industrial base of the City declined, City customers
used less and less water, while costs continued to increase.
3. Prior to FY 2009, the City went many years without any rate increases, while the cost of producing
water, including costs from Flint’s water provider Detroit Water and Sewerage Department
(DWSD), continued to rise at a rate of approximately 6.2 percent per year.8 The water utility has
historically been (and continues to be) behind the curve and needed larger rates increases to
mitigate the deficits that had built up from prior years.
4. Historically, Flint has been required to maintain its own treatment plant as back-up, in addition to
purchasing water from DWSD. Due to the use of the treatment plant as back-up, the City has
effectively been paying for two water sources.
7 City of Flint Water Forum Presentation (5/31/2012) 8 Flint Water Advisory Task Force Final Report (p. 16)

Analysis of Flint Water Rates | 17
Figure 1.1 below indicates the historical trend in Flint water rates. The typical customer in Flint
uses 5 hundred cubic feet (CCF) or 3,740 gallons per month.
Figure 1.1: Typical* Water Bill (Historical)
*The typical customer uses 5 hundred cubic feet (CCF), or 3,740 gallons of water per month
**Per Emergency Manager Order No. 31
***Per Shears vs. City of Flint Decision
As indicated, in FY 2005 the typical Flint customer paid $27.17 for water service. Rates were not
increased from FY 2005 to FY 2009, after which slight increases occurred until FY 2010 and FY 2011.
In FY 2012 and FY 2013 rates were increased in order to eliminate a deficit in the water fund.9 Rates
then remained unchanged until FY 2015 when rates were again increased to facilitate the transition
to the KWA. In FY 2016, rates were decreased following the Shears vs. City of Flint Decision.
In general, historical declines in industry and population in the City have been manifest in concurrent
declines in water customers and water usage. Efforts to avoid rate increases in the past have likely
resulted in underfunding and underinvestment in the water utility. While Figure 1.1 below indicates
that water rates were not increased from FY 2005 to FY 2009, the City’s costs continued to increase
over this time period.
A large contributor to the change in Flint’s costs historically relates to water purchases from DWSD
(now GLWA). Figure 1.2 indicates the DWSD/GLWA effective rate from FY 2009 to present.
9 Per Emergency Manager Order No. 31

18 | State of Michigan Department of Treasury
Figure 1.2: DWSD/GLWA Effective Rates to City of Flint
*Effective rate is total costs (fixed and volumetric) divided by billed usage
**Flint River used in FY 2015
***City began purchasing water from GLWA in FY 2016
Despite the decline in population and usage, the cost to provide water in the City continued to rise.
This is because the Flint water utility is a fixed cost operation, meaning the majority of costs do not
decline, even if usage declines.
For example, Flint continued to take on additional debt to maintain its treatment plant
(approximately $43 Million over the past 15 years), the cost of which could not be reduced in the face
of declining usage. In theory, Flint’s water supply costs from DWSD would decline as usage declines,
but large portion of the bill from DWSD has historically been fixed, negating much of the cost
reduction that might have come from declining usage.
RFC in conjunction with the American Water Works Association conducts a biennial rate survey of
utilities across the United States. While the median bills of the utilities surveyed increased by about
6% per year from FY 2005 to FY 2009, Flint’s water rates remained flat. This results in large increases
from FY 2010 onward, which were needed to close the deficit.
It is worth noting that while the recent rate increases (including those that occurred while the City
was under emergency management) did have a significant impact on affordability for the typical
customer, these increases were the symptom, not the cause of Flint’s rate challenges. Perhaps the
most glaring cause is the shrinking customer base over which the costs are recovered. This is
discussed in further detail in Section 1.2.8.
In addition to this more general trend, is the impact of large customers leaving the Flint water system.
Two of the largest customers to leave were Genesee County and General Motors (GM).
Analysis of Flint Water Rates | 19
Prior to leaving the Flint water system in FY 2014, Genesee County was paying the City of Flint a
volumetric charge per thousand cubic feet (Mcf) of water used, and a monthly fixed charge. However,
the majority of this revenue loss was offset by lower purchased water expense from DWSD. The
impact of this estimated revenue loss was incorporated into the FY 2015 water rates.
In October of 2014 (FY 2015), General Motors announced that it would stop using Flint water for its
engine operations facility, due to corrosion issues, until the switch to KWA is completed. While the
loss of Genesee County was anticipated, and accounted for in water rates, the loss of some of GM’s
revenues was not. While, this impacts the level of revenue Flint will ultimately collect, it will not
impact rates directly, unless rates are adjusted to reflect the loss. Given that GM anticipates resuming
the use of Flint water for the engine operations facility once KWA is complete, the impact on the water
utilities financial health will be short term.
Given the decline in population (and revenues), increases in operating expenditures and increases in
the rates charged for DWSD wholesale water (averaging 6.2 percent per year10), the lack of increases
in the years prior to FY 2009 likely caused a significant gap between revenues and expenditures.
1.2 CURRENT FLINT WATER RATES
Overall Costs
While aggregate costs are helpful in evaluating the total costs of providing water service,
understanding the impact to the typical customer can be beneficial as well. As discussed above the
typical Flint customer has a current water bill of $53.84 per month.
This bill can be broken down proportionally by the various costs of the Flint water system. Note that
this is not the same as the monthly cost per customer (as is used in Section 2 of this report), but
rather it is a proportional expression of the customer bill in terms of the water utility’s costs. Figure
1.3 indicates a breakdown of that bill by the major cost drivers of the water utility.
It is important to note that the rates which produce the typical bill indicated above are not sufficient
to fund the current water utility budget. In other words, even at the typical bill shown, a significant
deficit between projected revenues and expenditures exists.
Operating costs account for $18.56 per month ($15.3 Million annually) of the typical customer’s bill.
Operating costs are those costs which are incurred to run the utility on a daily basis. These include
personnel costs and the materials and supplies necessary to operate the water system.
The next largest cost, Water Supply Costs (GLWA) represent $15.89 per typical customer per month
($13.1 Million annually) includes the cost of purchased water from the Great Lakes Water Authority
10 Flint Water Advisory Task Force Final Report (p. 16)

20 | State of Michigan Department of Treasury
(GLWA). This can be further broken down by the fixed and variable components of the GLWA bill.
Over half the cost of water from GLWA is paid in the form of a fixed service charge and represents
$9.65 per typical customer per month ($7.9 Million annually). The remaining $6.24 per typical
customer per month comes in the form of a commodity charge, which is based on the amount of water
purchased by the City. Of this $6.24, $3.30 represents water which is purchased and ultimately sold
to City customers. $2.94 represents water which is purchased from GLWA but not billed to customers
(non-revenue water). Non-revenue water can include water used for firefighting, hydrant flushing,
meter error, leakage and theft and is discussed in detail in Section 1.2.7.
Capital costs represent $8.65 of the typical customer’s monthly bill ($7.1 Million annually) and relate
to the cost of rehabilitating the capital infrastructure needed to deliver safe and reliable water
service. At present, the majority of the capital costs indicated relate to the KWA debt service.
Transfers to Other City Funds make up $7.54 of the typical customer bill ($6.2 Million annually)
and represent monies transferred from the water utility to other funds (typically the City’s general
fund) to recognize the costs incurred by those funds to serve the water utility. A municipality may
maintain a centralized information technology department, for example, whose services are used by
other funds, such as the water fund. Transfers are discussed at length in Section 1.2.3.
Retiree Healthcare represents $3.19 of the typical customer bill ($2.6 Million annually) and is the
water utility’s allocation of City retiree healthcare costs.
Figure 1.3: FY 2017 Principal Cost Drivers* of Flint Water Rates ($ Monthly Per Typical** Customer)
Total: $53.84 *Monthly cost determined by proportionally allocating the total water bill ($53.84) to each category based on the 2017 budget
**The typical customer uses 5 hundred cubic feet (CCF), or 3,740 gallons of water per month
*** Non-revenue water represents purchases from GLWA which are not billed to customers and includes sources such as firefighting,
hydrant flushing, meter error, theft and leakage.

Analysis of Flint Water Rates | 21
**** KWA Debt Service
Operating Costs (Overall)
As indicated above, operating costs make up the largest portion of the current typical customer bill.
While the breakdown shown above indicates total operating costs ($18.56, $15.3 Million), the
proceeding section summarizes the same basic information, with a more detailed breakdown of
operating expenditures.
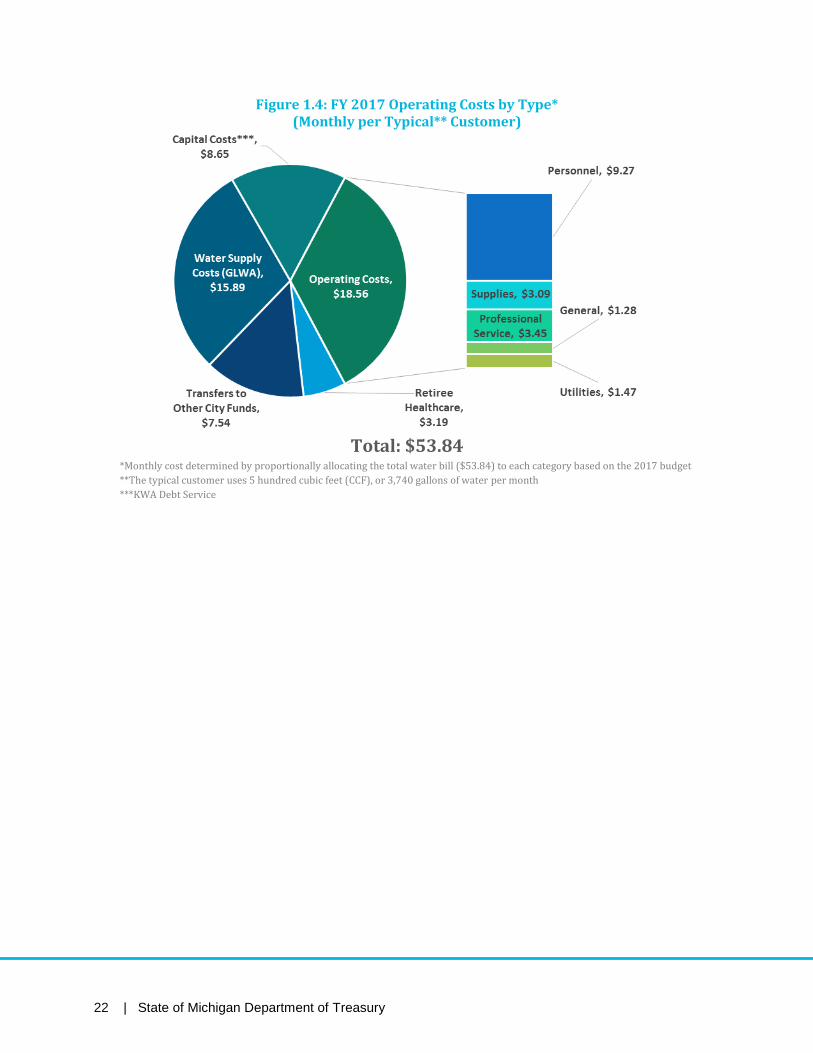
Figure 1.4 indicates the breakdown by type of cost and Figure 1.5 indicates the breakdown by
function. Similar to Section 1.2.1 these figures represent a proportional breakdown of the typical
bill, not the monthly cost per customer used in Section 2.
As Figure 1.4 indicates, the largest operating cost type is water supply costs, which represents
$15.89 per month ($13 Million annually) of the typical customer’s water bill. As discussed above,
this includes the cost of purchasing water from GLWA, some of which is not ultimately billed to
customers (i.e. non-revenue water).
Personnel costs, which represent $9.27 per month ($7.6 Million annually) for the typical customer,
are next and include the salaries and benefits of current water utility employees. Retiree healthcare
costs have been broken out from general personnel costs to indicate the unique impact of these costs
on the typical customer bill. Retiree healthcare costs represents the water utility’s allocation of the
current annual expenses associated with providing healthcare coverage to retired City employees
and represents $3.19 per month ($2.6 Million annually).
As discussed above Transfers to Other City Funds represent a $7.54 per month ($6.2 Million
annually) of the typical customer water bill. Transfers are discussed in further detail in Section 1.2.3
of this report.
Professional services represent $3.45 per month ($2.8 Million) of the typical customer water bill
and include work needed to operate the water utility that is contracted out to a third party.
Professional services are utilized in situations where the City lacks the staff or expertise to perform
a particular task, or for tasks where it would not be feasible to maintain full-time staff (i.e. large one-
time expenditures).
22 | State of Michigan Department of Treasury
Figure 1.4: FY 2017 Operating Costs by Type* (Monthly per Typical** Customer)
Total: $53.84 *Monthly cost determined by proportionally allocating the total water bill ($53.84) to each category based on the 2017 budget
**The typical customer uses 5 hundred cubic feet (CCF), or 3,740 gallons of water per month
***KWA Debt Service

Analysis of Flint Water Rates | 23
Figure 1.5 indicates a breakdown of operating costs by utility function. The largest cost relates to
water supply and treatment. Water supply and treatment includes water purchases from the
GLWA as well as the operation and maintenance of the City’s water treatment plant, which has
historically been maintained as a back-up to GLWA supply. Administration includes the personnel
costs not directly related to any particular function, as well as the Transfer to Other City Funds.
Transmission and Distribution relates to the maintenance of the City’s network of 450 miles of
water mains. Finally, Customer Service relates to the cost of reading customer meters and sending
monthly bills.
Figure 1.5: FY 2017 Operating By Function (Monthly per Typical** Customer)
Total: $53.84 *Monthly cost determined by proportionally allocating the total water bill ($53.84) to each category based on the 2017 budget
**The typical customer uses 5 hundred cubic feet (CCF), or 3,740 gallons of water per month
***KWA Debt Service
Operating Costs (Transfer to other City Funds)
Figure 1.6 indicates a detailed breakdown of the amount transferred from the water utility to other
City funds. Transfers between a utility fund and other City funds are not uncommon and generally
occur in recognition of the costs incurred by other funds to provide service to the utility. The
breakdown shown is the transfer component of the bill from above ($7.54, $6.2 Million) broken down
proportionally by type of transfer. Note that this is not the same as transfers per customer as shown
in Section 2.

24 | State of Michigan Department of Treasury
Four types of transfers are indicated: Indirect Cost Allocation, Direct Charge for City Services, Other
Transfers and Payment in Lieu of Taxes.
Indirect cost allocations represent $3.76 per month ($3.10 Million annually) for the typical
customer and generally result from a proportional allocation process, which attempts to estimate the
level of service provided to the water utility. IT services, for example, might be allocated based on
the number of computer workstations used by the utility relative the total number for the City at
large. The result would be an indirect (i.e. proportional) allocation of the annual cost of IT services
incurred by the water utility. This is common practice in many cities, especially for costs which are
not easily attributable to any one particular fund.
Direct charges for City Services represent $1.51 per month ($1.24 Million annually) for the typical
customer and are used when it is clear how much of a particular service the water utility is using. If
the City maintains a central garage for repairing City vehicles, and the cost of performing a particular
type of vehicle maintenance (e.g. oil change) is known, the cost of that service can be recovered
directly from the water utility.
Payment in Lieu of Taxes (PILOT) represent $0.90 per month ($0.74 Million annually) for the
typical customer and are a type of transfer which recognizes the fact that, if the utility were a private
entity it would pay some level of property taxes based on net plant investment or some other metric.
A PILOT serves as an additional funding source for general City services that would otherwise be
funded by property taxes.
General Transfers represent $1.37 per month ($1.13 Million annually) for the typical customer and
indicates direct transfers to the City’s general fund, based on City policy. These are used to fund City
services that would be otherwise funded by other City taxes and fees.
While it is common for a municipality to transfer funds from its utilities to its general fund, it is less
common to have the number and level of transfers currently in place at the City. Generally, transfers
should relate the actual cost of services provided to the general fund by the utility. As indicated in
Section 3, City transfers from the water fund are higher than other comparable utilities.

Analysis of Flint Water Rates | 25
Figure 1.6: FY 2017 Transfer to Other City Funds (Monthly per Typical* Customer)
Total: $7.54 *Monthly cost determined by proportionally allocating the transfer component of the water bill ($7.54) to each category based on the
2017 budget
**The typical customer uses 5 hundred cubic feet (CCF), or 3,740 gallons of water per month
Capital Costs (Current)
Current capital costs are based on the level of capital investment and the way in which that
investment has been financed historically. While our analysis has been unable to confirm exactly
how much has been invested in each component of the system, investment has likely been below
what is needed to maintain the water distribution system. Conversely, loan documents from the
Michigan Department of Environmental Quality’s Drinking Water Revolving Fund loan program
indicate that approximately $43 Million was borrowed from 2001 to 2006 to maintain Flint Water
Treatment Plant. While much of this debt has since been refinanced (mitigating the near term impact
on rates) these loans still remain outstanding and continue to represent a revenue requirement for
the City.
Current capital costs also include the City’s debt obligation to the Karegnondi Water Authority, with
payments starting in FY 2017.
Capital Costs (Future)
While current capital relates to past decisions regarding the level of investment in the Flint water
system, future capital relates to projects the City may undertake going forward. Future capital costs
will be driven by ongoing improvements to the system as well as improvements related to Flint’s
future water supply. Ongoing capital costs may include items such as emergency repairs, meter
replacement, main replacement, and valve and hydrant maintenance.

26 | State of Michigan Department of Treasury
As of the date of this report, the evaluation of future water supply options is still ongoing. Currently,
the City is operating under an emergency agreement with the Great Lakes Water Authority (GLWA).
Going forward, the City will need to select a primary source of either treated or untreated water and
a back-up source of the same. Currently, the three options being considered are: treating KWA raw
water at the Flint Treatment Plant (Flint Treatment), treated water purchased from the Genesee
County Drain Commission (GCDC Treatment), and a new contract for treated water from GLWA
(GLWA Treatment).
Under the Flint Treatment option, potential back-up sources are a raw water impoundment at the
City of Flint, an expansion of GCDC’s raw water impoundment, or a hybrid option involving a Flint
raw water impoundment with the Flint River as a secondary back-up. Under the GCDC option, it is
anticipated that the GCDC’s raw water impoundment would be expanded to accommodate Flint.
Finally, under the GLWA option, GCDC treated water would serve as a back-up to GLWA treated
water.
These options and their estimated costs are explained in further detail on Section 3.
In addition to the capital costs associated with future water supply, are costs related to the City’s
aging distribution system. While there is great uncertainty with regard to the exact level of
investment required to upgrade the distribution system, it will be a large contributor to the City’s
capital costs going forward. As of the date of this report, the exact level and timing of distribution
system investment is still being refined. Consequently it has not been included in the projections
indicated.
Collection Rates
Historically, the City had relatively normal levels of collection (i.e. in the 90%+ range). However, with
collection rates in recent years have deteriorated significantly. Lower than anticipated collection
rates have short term cash flow impacts, and—if they persist—could have longer term rate
implications. Generally, utilities will budget revenues based on their expected usage and customer
growth. If however, that level of usage does not produce budgeted level of revenues expected,
shortfalls between revenues and expenditures may occur. In the short term, this can increase
reliance on reserves to make up the difference. In the longer term, replenishing these reserves may
mean higher rate increases. In other words, customers who pay their bills end up covering the costs
for those who don’t, though the impact on rates is not immediate.
Non-Revenue Water
Non-revenue water is water which is produced, either via treatment or purchase, but not billed to
City customers. Some sources of water loss relate to legitimate functions of the water utility such as
distribution system flushing and firefighting. The distribution system is believed to be a large source

Analysis of Flint Water Rates | 27
of non-revenue water in the City of Flint. Non-revenue water in the distribution system can occur via
breakages in pipes, leaky joints, malfunctioning customer water meters and water theft.
As Figure 1.7 indicates the City has historically billed about 50 to 60 percent of what it purchased
from DWSD. A common target for municipal utilities is closer to 90 percent (i.e. only 10 percent non-
revenue). Ultimately, purchasing more water than is necessary to serve customers puts upward
pressure on customer bills.
Figure 1.7: Total Water Purchased and Sold (Million Gallons)
Declining Water Consumption
Figures 1.9 and 1.10 indicate trends in water consumption and water customers for the City of Flint,
as well as the total budgeted expenditures. Note that both annual consumption and customers have
declined over the past 7 years. Generally, the majority of the water utility’s costs do not vary with
usage or the number of customers. This is due to the fact that a water system must be overbuilt to
serve projected customers to ensure 24/7 water service. Such a system cannot be scaled up and
down with water usage. Consequently, despite the significant decline in City water customers and
water consumption, the cost to operate the City’s water system has not declined at a similar rate.
Historically the result has been a decreasing number of customers and usage over which to recover
an increasing level of costs. In other words, even if costs had remained flat, customer rates would
need to increase to account for the decline in customers and usage.

28 | State of Michigan Department of Treasury
Figure 1.9: Annual Billed Water Usage vs. Total Budget
*Purchases from DWSD ceased in FY 2015, Flint River used as primary source
Figure 1.10: Water Customers vs. Total Budget
*Purchases from DWSD ceased in FY 2015, Flint River used as primary source.

Analysis of Flint Water Rates | 29
2. UTILITY BENCHMARKING
2.1 COMMUNITIES FOR COMPARISON
As part of this analysis, the Michigan Department of Treasury asked for a comparison of the Flint
water utility to other similar utilities. RFC and the Michigan Department of Treasury worked together
to develop a list of utilities that seemed most comparable in size, location, and utility function.
Ultimately, RFC researched and surveyed 12 water utilities across Michigan, Indiana, and Ohio in
addition to the Flint water utility. We communicated directly with representatives of several cities’
water utilities, in addition to collecting data from city websites, ordinances, budget reports, and
financial reports11. The water utilities considered in this benchmarking analysis include:
1. Ann Arbor, MI
2. Burton, MI
3. Canton, OH
4. Dayton, OH
5. Dearborn, MI
6. Kalamazoo, MI
7. Lansing, MI
8. Saginaw, MI
9. South Bend, IN
10. Troy, MI
11. Wyoming, MI
12. Youngstown, OH
11 Data used in the making of the following charts and graphs can be found in Appendix A.

30 | State of Michigan Department of Treasury
Typical Bill Comparison
Figure 2.1 below displays a typical monthly bill by community. All bill calculations assume that the
typical customer has a 5/8” meter and uses 5 hundred cubic feet (CCF), or 3,740 gallons, of water per
month. Most utilities have had rate increases in the last two years, with the exception of South Bend,
where water rates have not been adjusted since 2006.
Figure 2.1: Typical* Bill Comparison ($ Per Month)
*The typical customer uses 5 hundred cubic feet (CCF), or 3,740 gallons of water per month
Figure 2.2: Effective Typical* Customer Rates ($ per 1,000 gallons)
*The typical customer uses 5 hundred cubic feet (CCF), or 3,740 gallons of water per month

Analysis of Flint Water Rates | 31
Population Trends
Figure 2.2 below charts the percent change in population for the surveyed communities between
2010 and 201412. While Burton has the largest percent decrease in population over the time period
surveyed, Flint has seen a similar percentage decrease in population. Additionally, while Flint is only
the sixth largest city in the group, the city recognized the largest numerical drop in population.
Figure 2.2: Change in Population by Community (2010-2014)
*Average excluding Flint, MI
12 Population data is from the US Census Bureau and can be accessed at http://factfinder.census.gov/faces/nav/jsf/pages/index.xhtml
-4.00%
-3.00%
-2.00%
-1.00%
0.00%
1.00%
2.00%
3.00%
4.00%
5.00%

32 | State of Michigan Department of Treasury
Miles of Pipe per Customer
Table 2.1 below indicates the feet of pipe per customer by utility surveyed. For example, on
average, each customer account in Flint is responsible for approximately 96 feet of water pipe
within the system. This number is a good indicator of how spread out the system is. The utilities
with higher feet of pipe to customer account ratios will have higher per customer system costs,
because of less population density.
Table 2.1: Utility Summary Data
Community Number of
Customer Accounts Miles of Pipe in
System Feet of Pipe per
Customer Saginaw, MI 18,018 411 120.44 Troy, MI 27,637 540 103.17 Burton, MI 6,289 120 100.75 Flint, MI 29,805 540 95.66 Kalamazoo, MI 46,220 808 92.30 Ann Arbor, MI 26,816 441 86.83 Wyoming, MI 22,485 363 85.24 Average* 82.55 Canton, OH 44,829 664 78.21 Lansing, MI 55,003 750 72.00 South Bend, IN 43,273 585 71.38 Dearborn, MI 32,600 370 59.93 Dayton, OH 121,210 807 35.15 Youngstown, OH N/A *Average excluding Flint, MI
N/A: data was not provided or is unavailable
Analysis of Flint Water Rates | 33
2.2 OPERATING AND CAPITAL COST COMPARISON
Operating Costs
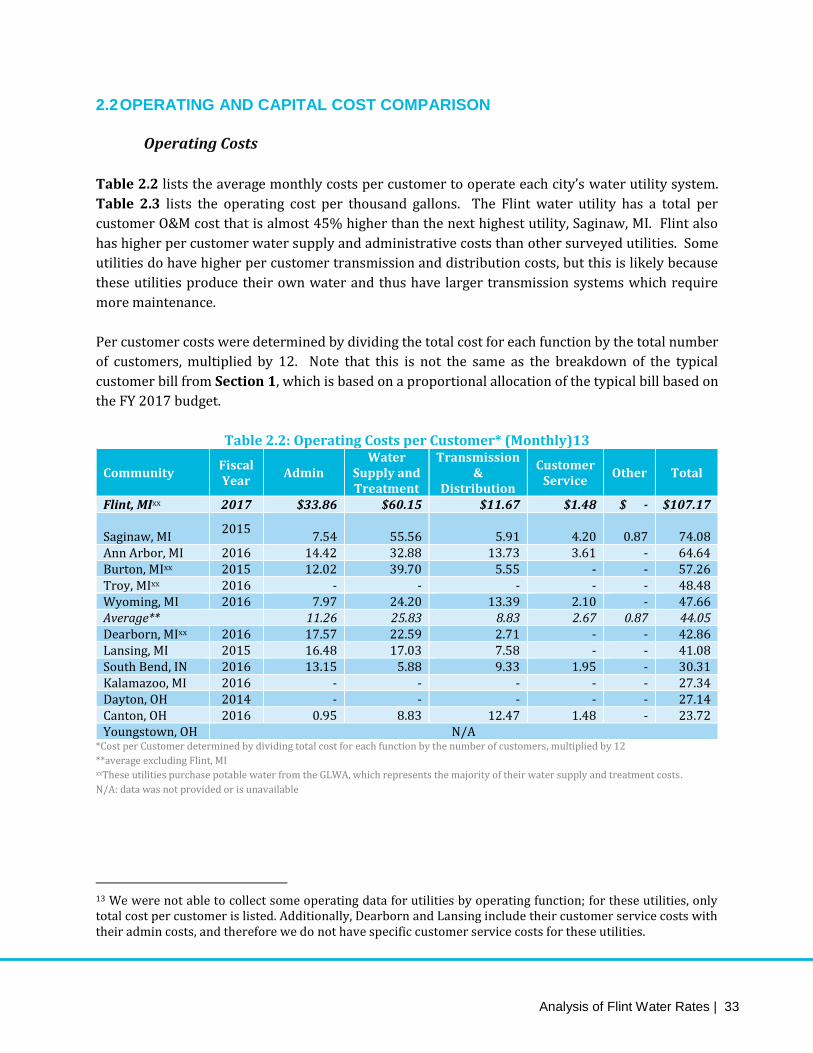
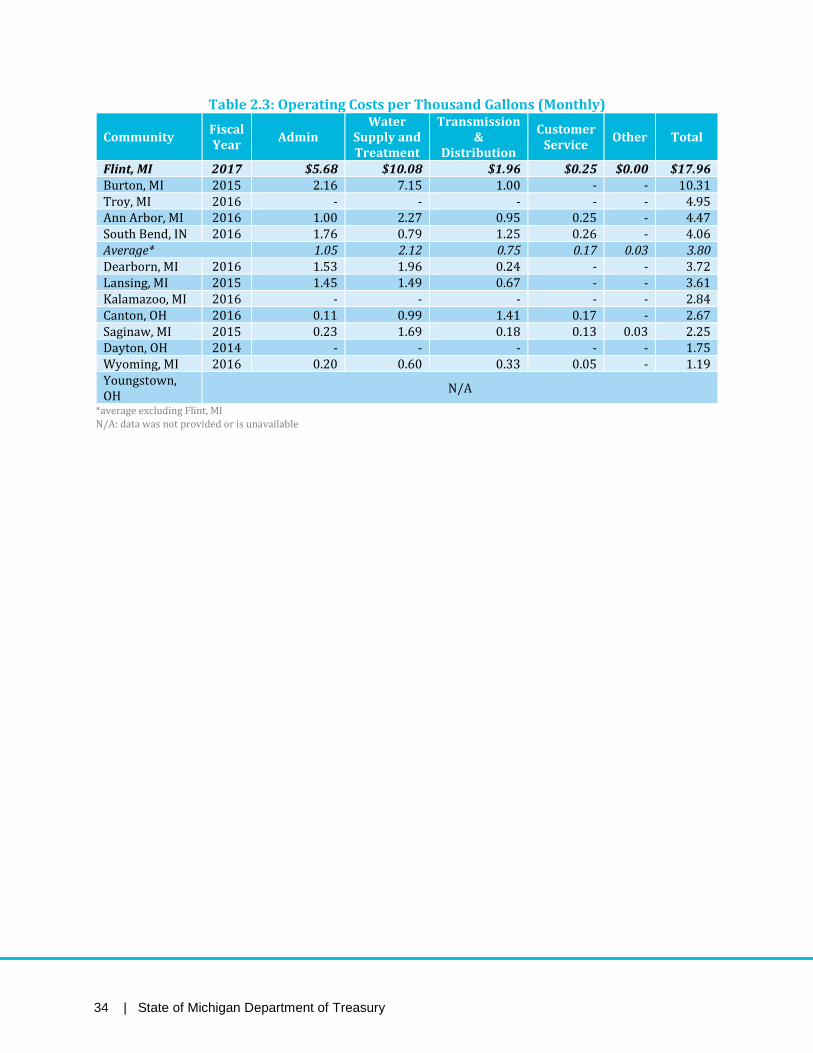
Table 2.2 lists the average monthly costs per customer to operate each city’s water utility system.
Table 2.3 lists the operating cost per thousand gallons. The Flint water utility has a total per
customer O&M cost that is almost 45% higher than the next highest utility, Saginaw, MI. Flint also
has higher per customer water supply and administrative costs than other surveyed utilities. Some
utilities do have higher per customer transmission and distribution costs, but this is likely because
these utilities produce their own water and thus have larger transmission systems which require
more maintenance.
Per customer costs were determined by dividing the total cost for each function by the total number
of customers, multiplied by 12. Note that this is not the same as the breakdown of the typical
customer bill from Section 1, which is based on a proportional allocation of the typical bill based on
the FY 2017 budget.
Table 2.2: Operating Costs per Customer* (Monthly)13
Community Fiscal Year
Admin Water
Supply and Treatment
Transmission &
Distribution
Customer Service
Other Total
Flint, MIxx 2017 $33.86 $60.15 $11.67 $1.48 $ - $107.17
Saginaw, MI 2015
7.54 55.56 5.91 4.20 0.87 74.08
Ann Arbor, MI 2016 14.42 32.88 13.73 3.61 - 64.64 Burton, MIxx 2015 12.02 39.70 5.55 - - 57.26 Troy, MIxx 2016 - - - - - 48.48 Wyoming, MI 2016 7.97 24.20 13.39 2.10 - 47.66 Average** 11.26 25.83 8.83 2.67 0.87 44.05 Dearborn, MIxx 2016 17.57 22.59 2.71 - - 42.86 Lansing, MI 2015 16.48 17.03 7.58 - - 41.08 South Bend, IN 2016 13.15 5.88 9.33 1.95 - 30.31 Kalamazoo, MI 2016 - - - - - 27.34 Dayton, OH 2014 - - - - - 27.14 Canton, OH 2016 0.95 8.83 12.47 1.48 - 23.72 Youngstown, OH N/A
*Cost per Customer determined by dividing total cost for each function by the number of customers, multiplied by 12
**average excluding Flint, MI xxThese utilities purchase potable water from the GLWA, which represents the majority of their water supply and treatment costs.
N/A: data was not provided or is unavailable
13 We were not able to collect some operating data for utilities by operating function; for these utilities, only total cost per customer is listed. Additionally, Dearborn and Lansing include their customer service costs with their admin costs, and therefore we do not have specific customer service costs for these utilities.
34 | State of Michigan Department of Treasury
Table 2.3: Operating Costs per Thousand Gallons (Monthly)
Community Fiscal Year
Admin Water
Supply and Treatment
Transmission &
Distribution
Customer Service
Other Total
Flint, MI 2017 $5.68 $10.08 $1.96 $0.25 $0.00 $17.96 Burton, MI 2015 2.16 7.15 1.00 - - 10.31 Troy, MI 2016 - - - - - 4.95 Ann Arbor, MI 2016 1.00 2.27 0.95 0.25 - 4.47 South Bend, IN 2016 1.76 0.79 1.25 0.26 - 4.06 Average* 1.05 2.12 0.75 0.17 0.03 3.80 Dearborn, MI 2016 1.53 1.96 0.24 - - 3.72 Lansing, MI 2015 1.45 1.49 0.67 - - 3.61 Kalamazoo, MI 2016 - - - - - 2.84 Canton, OH 2016 0.11 0.99 1.41 0.17 - 2.67 Saginaw, MI 2015 0.23 1.69 0.18 0.13 0.03 2.25 Dayton, OH 2014 - - - - - 1.75 Wyoming, MI 2016 0.20 0.60 0.33 0.05 - 1.19 Youngstown, OH
N/A
*average excluding Flint, MI
N/A: data was not provided or is unavailable
Analysis of Flint Water Rates | 35
Health Care Costs
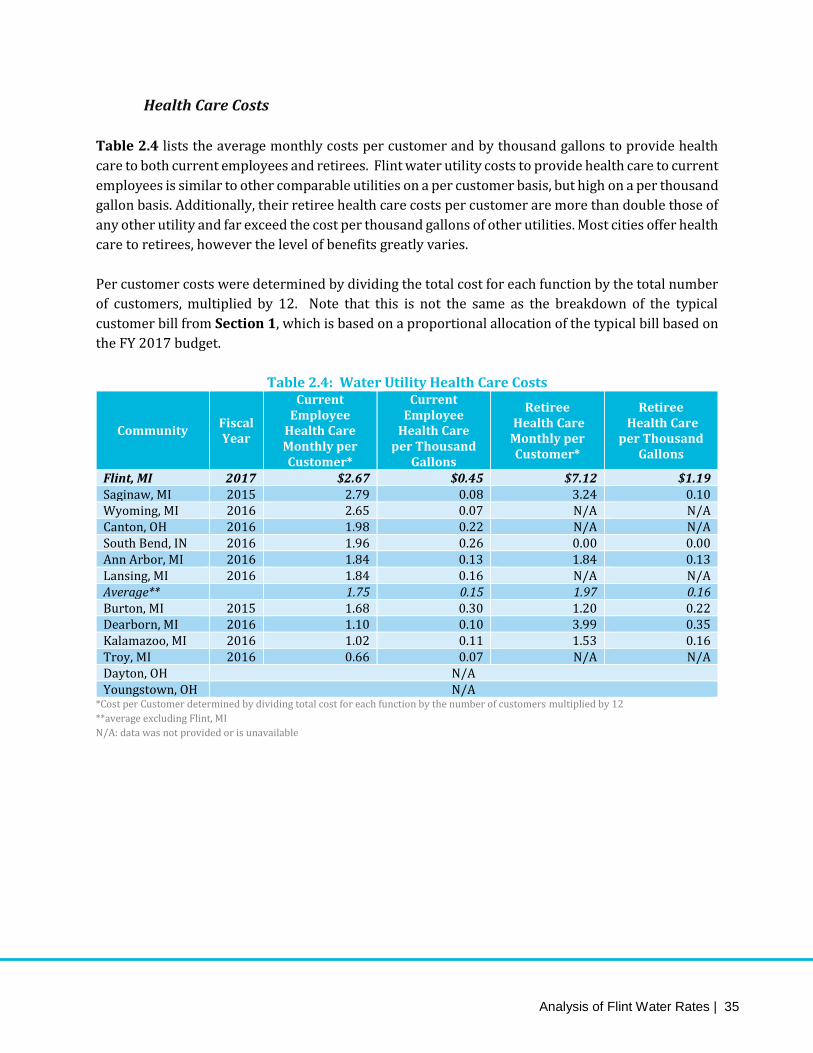
Table 2.4 lists the average monthly costs per customer and by thousand gallons to provide health
care to both current employees and retirees. Flint water utility costs to provide health care to current
employees is similar to other comparable utilities on a per customer basis, but high on a per thousand
gallon basis. Additionally, their retiree health care costs per customer are more than double those of
any other utility and far exceed the cost per thousand gallons of other utilities. Most cities offer health
care to retirees, however the level of benefits greatly varies.
Per customer costs were determined by dividing the total cost for each function by the total number
of customers, multiplied by 12. Note that this is not the same as the breakdown of the typical
customer bill from Section 1, which is based on a proportional allocation of the typical bill based on
the FY 2017 budget.
Table 2.4: Water Utility Health Care Costs
Community Fiscal Year
Current Employee
Health Care Monthly per Customer*
Current Employee
Health Care per Thousand
Gallons
Retiree Health Care Monthly per Customer*
Retiree Health Care
per Thousand Gallons
Flint, MI 2017 $2.67 $0.45 $7.12 $1.19 Saginaw, MI 2015 2.79 0.08 3.24 0.10 Wyoming, MI 2016 2.65 0.07 N/A N/A Canton, OH 2016 1.98 0.22 N/A N/A South Bend, IN 2016 1.96 0.26 0.00 0.00 Ann Arbor, MI 2016 1.84 0.13 1.84 0.13 Lansing, MI 2016 1.84 0.16 N/A N/A Average** 1.75 0.15 1.97 0.16 Burton, MI 2015 1.68 0.30 1.20 0.22 Dearborn, MI 2016 1.10 0.10 3.99 0.35 Kalamazoo, MI 2016 1.02 0.11 1.53 0.16 Troy, MI 2016 0.66 0.07 N/A N/A Dayton, OH N/A Youngstown, OH N/A
*Cost per Customer determined by dividing total cost for each function by the number of customers multiplied by 12
**average excluding Flint, MI
N/A: data was not provided or is unavailable

36 | State of Michigan Department of Treasury
Transfers to Other Funds
Table 2.5 lists the average monthly costs per customer, costs per thousand gallons of water pumped,
and costs per utility employee to pay for each utility’s intercity transfers. Depending on the city, each
utility is required to transfer varying amounts of money to other funds. Usually, the utility transfers
money to a General Fund in the form of Payment in Lieu of Taxes or administrative charges. Dayton
water utility transfers money each year to the sewer utility.
Per customer costs were determined by dividing the total cost for each function by the total number
of customers, multiplied by 12. Note that this is not the same as the breakdown of the typical
customer bill from Section 1, which is based on a proportional allocation of the typical bill based on
the FY 2017 budget.
Table 2.5: Water Utility Transfer Costs
Community Fiscal Year Monthly per Customer*
Per Thousand Gallons
Per Employee
Flint, MI 2017 $17.91 $3.00 $113,358 Saginaw, MI 2015 7.24 0.22 25,647 South Bend, IN 2016 6.88 0.92 49,609 Wyoming, MI 2016 5.80 0.14 42,280 Ann Arbor, MI 2016 3.85 0.27 22,921 Lansing, MI 2015 3.41 0.30 27,095 Average** 3.15 0.23 21,184 Dayton, OH 2014 2.84 0.18 19,033 Dearborn, MI 2016 1.18 0.10 9,785 Troy, MI 2016 1.09 0.11 16,450 Kalamazoo, MI 2016 1.05 0.11 12,672 Canton, OH 2016 0.88 0.10 4,567 Burton, MI 2015 0.43 0.08 2,970 Youngstown, OH N/A
*Cost per Customer determined by dividing total cost for each function by the number of customers multiplied by 12
**average excluding Flint, MI
N/A: data was not provided or is unavailable

Analysis of Flint Water Rates | 37
Capital Costs
Tables 2.6 and 2.7 list the average monthly costs per customer, costs per thousand gallons of water,
and costs per mile of pipe to pay for each utility’s capital improvements. Most cities surveyed fund
capital projects through a combination of cash from water sales and bond issuances. The Flint water
utility has a total per customer capital cost higher than all other utilities surveyed, with the exception
of Wyoming, MI. Wyoming serves a large number of wholesale customers however, who bear a larger
burden of the capital costs, as opposed to the residential retail customers. Flint’s capital costs per
thousand gallons of water pumped are far higher than any of the other utilities surveyed.
Table 2.6: Water Utility Total Capital Costs
Community Fiscal Year
Monthly per Customer
Per Thousand Gallons
Per Mile of Pipe
Flint, MI 2017 $19.92 $3.34 $13,195 Wyoming, MI 2016 23.20 0.58 17,241 Lansing, MI 2016 19.69 1.73 17,331 Saginaw, MI 2015 14.46 0.44 7,608 Burton, MI 2016 11.93 2.15 7,502 Dearborn, MI 2016 11.06 0.96 11,689 Average* 10.46 0.86 7,969 Troy, MI 2016 10.25 1.05 6,296 Kalamazoo, MI 2016 7.59 0.79 5,208 Canton, OH 2016 6.45 0.73 5,226 South Bend, IN 2016 5.53 0.74 4,909 Ann Arbor, MI 2016 3.91 0.27 2,855 Dayton, OH 2014 1.00 0.06 1,797 Youngstown, OH N/A
*average excluding Flint, MI
N/A: data was not provided or is unavailable
Table 2.7: Water Utility Capital Costs by Rate Funding and Debt Funding
Community Fiscal Year
Monthly per
Customer
Per Thousand
Gallons
Per Mile of Pipe
Monthly per
Customer
Per Thousand
Gallons
Per Mile of Pipe
Rate Funded Capital Debt Funded Capital Flint, MI 2017 $0.00 $0.00 $0.00 $19.92 $3.34 $13,195 Wyoming, MI 2016 5.56 0.14 4,132 17.64 0.44 13,109 Lansing, MI 2016 17.13 1.50 15,072 2.57 0.23 2,259 Saginaw, MI 2015 6.94 0.21 3,650 7.52 0.23 3,959 Burton, MI 2015 8.51 1.53 5,354 3.42 0.62 2,149 Dearborn, MI 2016 10.86 0.94 11,486 0.19 0.02 202 Average* 5.94 0.55 4,590 4.52 0.31 3,379 Troy, MI 2016 10.25 1.05 6,296 - - - Kalamazoo, MI 2016 4.51 0.47 3,094 3.08 0.32 2,114 Canton, OH 2016 - - - 6.45 0.73 5,226 South Bend, IN 2016 1.58 0.21 1,405 3.95 0.53 3,504 Ann Arbor, MI 2016 - - - 3.91 0.27 2,855 Dayton, OH 2014 - - - 1.00 0.06 1,797 Youngstown, OH N/A
*average excluding Flint, MI
N/A: data was not provided or is unavailable
38 | State of Michigan Department of Treasury
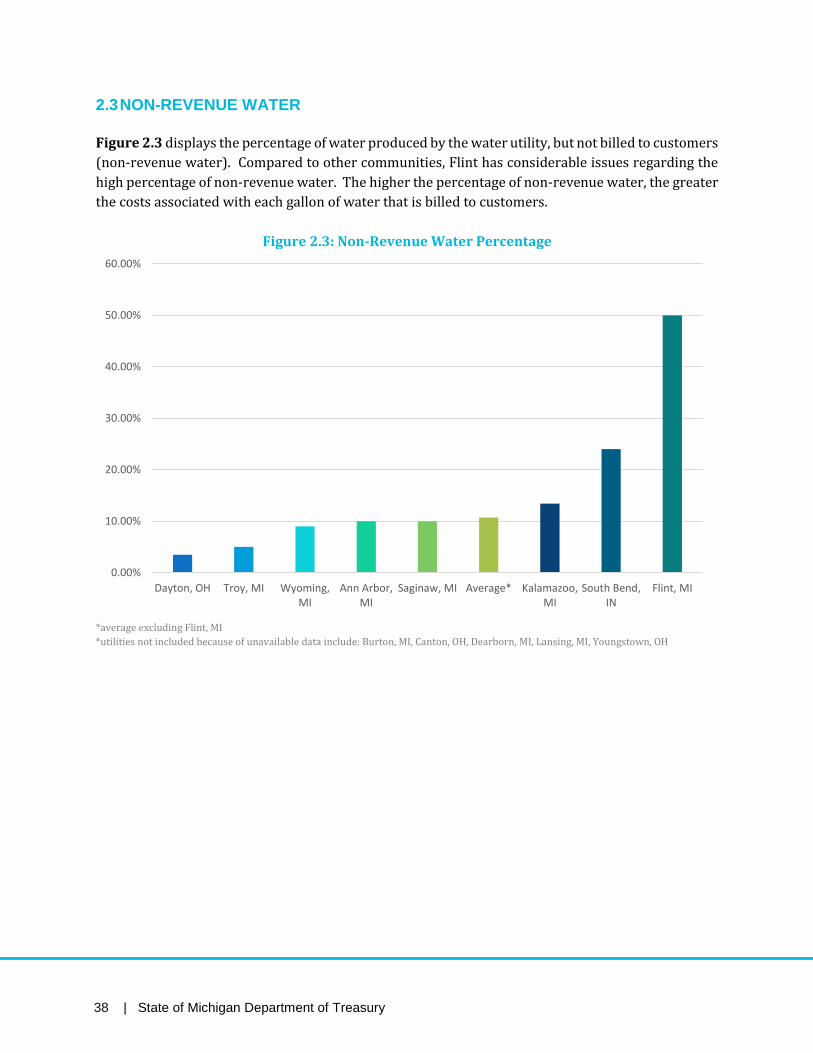
2.3 NON-REVENUE WATER
Figure 2.3 displays the percentage of water produced by the water utility, but not billed to customers
(non-revenue water). Compared to other communities, Flint has considerable issues regarding the
high percentage of non-revenue water. The higher the percentage of non-revenue water, the greater
the costs associated with each gallon of water that is billed to customers.
Figure 2.3: Non-Revenue Water Percentage
*average excluding Flint, MI
*utilities not included because of unavailable data include: Burton, MI, Canton, OH, Dearborn, MI, Lansing, MI, Youngstown, OH
0.00%
10.00%
20.00%
30.00%
40.00%
50.00%
60.00%
Dayton, OH Troy, MI Wyoming,MI
Ann Arbor,MI
Saginaw, MI Average* Kalamazoo,MI
South Bend,IN
Flint, MI

Analysis of Flint Water Rates | 39
2.4 FLINT RATES WITH COSTS AT PEER UTILITY LEVEL
Our analysis indicates that the largest driver is the difference in water supply and treatment costs
between the City and peer utilities. This is likely due to the historical requirement that the City
operate and maintain its treatment plant in addition to purchasing water from DWSD. Other
significant drivers of the difference include retiree health care, transfers, and higher capital costs. Figures 2.4 and 2.5 indicate the key cost drivers on a per customer and per thousand gallon basis.
Per customer costs was determined by dividing the total cost for each function by the total number
of customers, multiplied by 12. Note that this is not the same as the breakdown of the typical
customer bill from Section 1, which is based on a proportional allocation of the typical bill based on
the FY 2017 budget.
Figure 2.4: Key Cost Drivers of Flint Rates vs. Comparable Communities
(Cost per Customer*)
*Cost per Customer determined by dividing total cost for each function by the number of customers multiplied by 12
**Water Supply and Treatment for Flint includes water purchased from GLWA and the operation of the Flint Water Treatment Plant
$-
$10.00
$20.00
$30.00
$40.00
$50.00
$60.00
$70.00
Water Supply & Treatment Retiree Health Care Transfers Capital
Flint Cost per Customer Avg. of Surveyed Utilities Cost per Customer

40 | State of Michigan Department of Treasury
Figure 2.5: Key Cost Drivers of Flint Rates vs. Comparable Communities (Cost per Thousand Gallons)
*Water Supply and Treatment for Flint includes water purchased from GLWA and the operation of the Flint Water Treatment Plant
Figure 2.6 shows both the typical Flint monthly bill, that of peer utilities and the average of just the
per utilities. Figure ES.9 indicates the effective customer rate per 1,000 gallons. The typical Flint
customer uses 5 hundred cubic feet (CCF), or 3,740 gallons of water per month. If Flint’s cost
structure were similar to that of peer utilities, the typical bill would be substantially lower than the
current bill. Note that while Burton was included (to represent as an additional Genesee County
community), it is a much smaller utility (<7,000 customers) whose system and costs are not
necessarily comparable to either Flint or the other peer utilities. Given that a water system has
some base level of costs to provide service, systems with very few customers tend to have much
higher rates. Burton, like Flint, faces the GLWA costs, but has the additional challenges associated
with smaller utilities.
$-
$2.00
$4.00
$6.00
$8.00
$10.00
$12.00
Water Supply &Treatment
Retiree Health Care Transfers Capital
Flint Cost per 1,000 Gallons Avg. of Surveyed Utilities Cost per 1,000 Gallons

Analysis of Flint Water Rates | 41
Table 2.6: Typical* Flint Monthly Bill at Comparable Levels of Peer Utilities
*The typical customer uses 5 hundred cubic feet (CCF), or 3,740 gallons of water per month
Figure ES.8: Effective Typical* Customer Rates ($ per 1,000 gallons)
*The typical customer uses 5 hundred cubic feet (CCF), or 3,740 gallons of water per month
**Average bill does not include Flint

42 | State of Michigan Department of Treasury
3. PROJECTION OF FUTURE WATER COSTS
In addition to examining the principal cost drivers of Flint’s water rates, and how those compare to
other similar utilities, RFC was tasked with forecasting the potential direction of future water costs.
This involves identifying the gap between projected revenues at current rates and projected future
expenditures and projecting the level of rates which would be necessary to close that gap.
3.1 DISCUSSION OF WATER SUPPLY AND BACK-UP OPTIONS
One significant contributor to the direction of future water rates is the decision regarding the City’s
future water supply.
As of the date of this report, the evaluation of future water supply options is still ongoing. Currently,
the City is operating under an emergency agreement with the Great Lakes Water Authority (GLWA).
Going forward, the City will need to select a primary source of either treated or untreated water and
a back-up source of the same. Currently the three options being considered are treating KWA raw
water at the Flint Treatment Plant (Flint Treatment), treated water purchased from the Genesee
County Drain Commission (GCDC Treatment), and a new contract for treated water from GLWA
(GLWA Treatment).
Flint Treatment Option
Under the original plan for raw water delivery to the Flint water plant, raw water was to be delivered
by KWA to a connection point with the 72-inch line that is currently being used to deliver GLWA
water. Now that this pipeline is currently being used to deliver finished water from GLWA as part of
the reconnection in the fall of 2015, a new line will need to be completed to connect the KWA raw
water delivery line to the Flint treatment plant. The new line would be completed in spring of 2017
at the earliest. This would be followed by a period of raw water testing until the plant operation
would be approved for full use by the DEQ and EPA. On April 25th, and its contracted engineers toured
the facility. Recommendations for further upgrades could result. The cost of a new line to KWA is
currently estimated to cost between $9 and $12 Million.
Under the Flint Treatment option, potential back-up sources are a raw water impoundment at the
City of Flint ($25 Million), a hybrid option involving a Flint Raw water impoundment with the Flint
River as a secondary back-up (cost unknown at this time), or an expansion of GCDC’s raw water
impoundment. The expansion of GCDC’s raw water impoundment is estimated to cost $19 Million.
Flint’s share of this potential cost is unknown at this time.
Analysis of Flint Water Rates | 43
Genesee County Option
Under this option, Flint would receive treated water from the Genesee County Drain Commission
(GCDC) treatment plant, which comes online in 2017. The GCDC plant would require an expansion,
which could be completed by July of 2018. The cost to expand the GCDC plant is estimated to be $30
Million. Flint’s potential share of this cost is unknown at this time.
Under the GCDC option, it is anticipated the GCDC’s raw water impoundment would be expanded to
accommodate Flint. The estimated cost of this expansion is $19 Million. Flint’s potential share of this
cost is unknown at this time.
GLWA Option
The option to stay on the Great Lakes Water Authority would require a new long-term contract with
GLWA and a 12-mile pipe to connect GLWA with Flint after KWA comes online for an estimated cost
of $18 million. That section of pipe will be used by GCDC to deliver treated water to the Genesee
customers of the GCDC. Flint remains obligated for the $7 million annual bond payments for the KWA
system.
Under the GLWA option, GCDC treated water would serve as a back-up to GLWA treated water. The
annual cost of back-up service from GCDC is unknown at this time.
3.2 SUFFICIENCY OF EXISTING RATES TO COVER WATER UTILITY COSTS
The projections indicated are based on the following assumptions:
1. The City will continue to purchase treated water from GLWA through FY 2017.
2. The City will begin purchasing and treating KWA raw water starting in FY 2018.
3. KWA commodity rate increases will be 5 percent per year.
4. Current staffing levels and associated costs are representative of what will be needed to run
the water treatment plant.
5. Power and chemical costs are assumed to increase significantly under full treatment plant
operations.
6. Water usage and customers will continue to decline for the next 5 years at the average rate
of the past 5 years.
7. No rate increase will occur in FY 2017.
8. A permanent connection will be made between the Flint WTP the KWA raw water supply line,
at a cost of $9 Million.
9. Back-up supply will be provided via treated water from GCDC.
10. Annual operating and capital costs for back-up service from GCDC are unknown.
11. At least half of the City’s FY 2017 CIP annual CIP expenditures will be necessary going forward
to maintain the water system.
12. The CIP projects included in the City’s FY 2017 CIP will be financed at 30 years for 2.75%
interest and include 2 years capitalized interest.
44 | State of Michigan Department of Treasury
At present, the revenue generated by the City’s current rates are not sufficient to meet the projected
operating and capital costs. By the end of FY 2022, a funding gap of approximately $22.7 Million is
projected to exist.
3.3 COST PER TYPICAL CUSTOMER PROJECTION
The current typical bill is $53.84 per month. Based on the information currently available the typical
bill is projected to rise to $110.11 per month by FY 2022. It is important to note that the bills are not
based on proposed rate increases, rather they are indicative of the potential direction of future
typical customer costs if no action is taken regarding the issues raised in this report. Key factors
driving the uncertainty of future rates are:
1. Future Water Supply Decisions and Costs;
2. Future Back-Up Supply Decisions and Costs;
3. The availability of alternative funding sources for operations and capital;
4. The rate of decline in customers and customer demand; and
5. Future regulatory requirements.
3.4 CONCLUSION REGARDING COST PROJECTIONS
While the gap at current rates is not insignificant, the water supply options currently being weighed
by the City will further impact the direction of water costs. As discussed above, the typical customer
cost projections are not proposed or even projected rate increases. Rather they indicate what could
happen to typical customer costs in the absence of any action being taken on the issues identified in
this report. Moving forward, the objective of all parties involved will be to identify cost savings and
State and Federal subsidies to shift the projected future costs for the typical customer downward.

Analysis of Flint Water Rates | 45
LIST OF TABLES
Figure ES.1: Flint Water Costs* (per Typical** Customer) Five-Year Projection ................. 4
Figure ES.2: Flint Water Costs* (per Typical Customer**) Five- Year Range ....................... 5
Figure ES.3: DWSD/GLWA Effective* Rates to City of Flint .................................................. 7
Figure ES.4: City of Flint Financial History Timeline from FY 2012 Water Forum
Presentation ............................................................................................................................. 7
Figure ES.5: Flint Water Bill, Typical* Customer (Historical) ................................................ 8
Figure ES.6: Annual Billed Water Usage vs. Total Budget .................................................... 9
Figure ES.7: FY 2017 Principal Cost Drivers* of Flint Water Rates .....................................10
($ Monthly Per Typical** Customer) .......................................................................................10
Table ES.1: Flint and Comparable Communities ..................................................................11
Figure ES. 8: Key Cost Drivers of Flint Rates vs. Comparable Communities .....................11
(Monthly Cost per Customer*)................................................................................................11
Figure ES.9: Typical* Flint Monthly Bill at Comparable Levels of Peer Utilities .................12
Figure ES.10: Effective Typical* Customer Rates ($ per 1,000 gallons) ..............................13
Figure ES.11: Water Utility Funding Gap at Existing Rates .................................................14
Figure 1.1: Typical* Water Bill (Historical) ............................................................................17
Figure 1.2: DWSD/GLWA Effective Rates to City of Flint .....................................................18
Figure 1.3: FY 2017 Principal Cost Drivers* of Flint Water Rates ........................................20
($ Monthly Per Typical** Customer) .......................................................................................20
Figure 1.4: FY 2017 Operating Costs by Type* .....................................................................22
(Monthly per Typical** Customer) ..........................................................................................22
Figure 1.5: FY 2017 Operating By Function ..........................................................................23
(Monthly per Typical** Customer) ..........................................................................................23
Figure 1.6: FY 2017 Transfer to Other City Funds ................................................................25
(Monthly per Typical* Customer) ...........................................................................................25
Figure 1.7: Total Water Purchased and Sold (Million Gallons) ............................................27
Figure 1.9: Annual Billed Water Usage vs. Total Budget .....................................................28
Figure 1.10: Water Customers vs. Total Budget ...................................................................28
Figure 2.1: Typical* Bill Comparison ($ Per Month) ..............................................................30
Figure 2.2: Effective Typical* Customer Rates ($ per 1,000 gallons)...................................30
Figure 2.2: Change in Population by Community (2010-2014) .............................................31
Table 2.1: Utility Summary Data .............................................................................................32
Table 2.2: Operating Costs per Customer* (Monthly) ...........................................................33
Table 2.3: Operating Costs per Thousand Gallons (Monthly) ..............................................34
Table 2.4: Water Utility Health Care Costs ...........................................................................35
Table 2.5: Water Utility Transfer Costs .................................................................................36
Table 2.6: Water Utility Total Capital Costs ..........................................................................37
Table 2.7: Water Utility Capital Costs by Rate Funding and Debt Funding ........................37
Figure 2.3: Non-Revenue Water Percentage .........................................................................38
Figure 2.4: Key Cost Drivers of Flint Rates vs. Comparable Communities ........................39
(Cost per Customer*) ..............................................................................................................39

46 | State of Michigan Department of Treasury
Figure 2.5: Key Cost Drivers of Flint Rates vs. Comparable Communities ........................40
(Cost per Thousand Gallons) .................................................................................................40
Table 2.6: Typical* Flint Monthly Bill at Comparable Levels of Peer Utilities .....................41
Figure ES.8: Effective Typical* Customer Rates ($ per 1,000 gallons) ................................41
Table A.1: Population Change ...............................................................................................47
Table A.2: Utility Characteristics ...........................................................................................47
Table A.3: Operating Expenses by Division ..........................................................................48
Table A.4: Health Care Expenses ...........................................................................................48
Table A.5: Transfers by Type .................................................................................................49
Table A.6: Capital Expenditures.............................................................................................49
Figure B.1: FY 2017 Principal Cost Drivers of Flint Water Rates .........................................50
Figure B.2: FY 2017 Operating and Capital Costs By Type ..................................................50
Figure B.3: FY 2017 Operating and Capital Costs by Function ...........................................51
Figure B.4: FY 2017 Transfer to Other City Funds ................................................................51
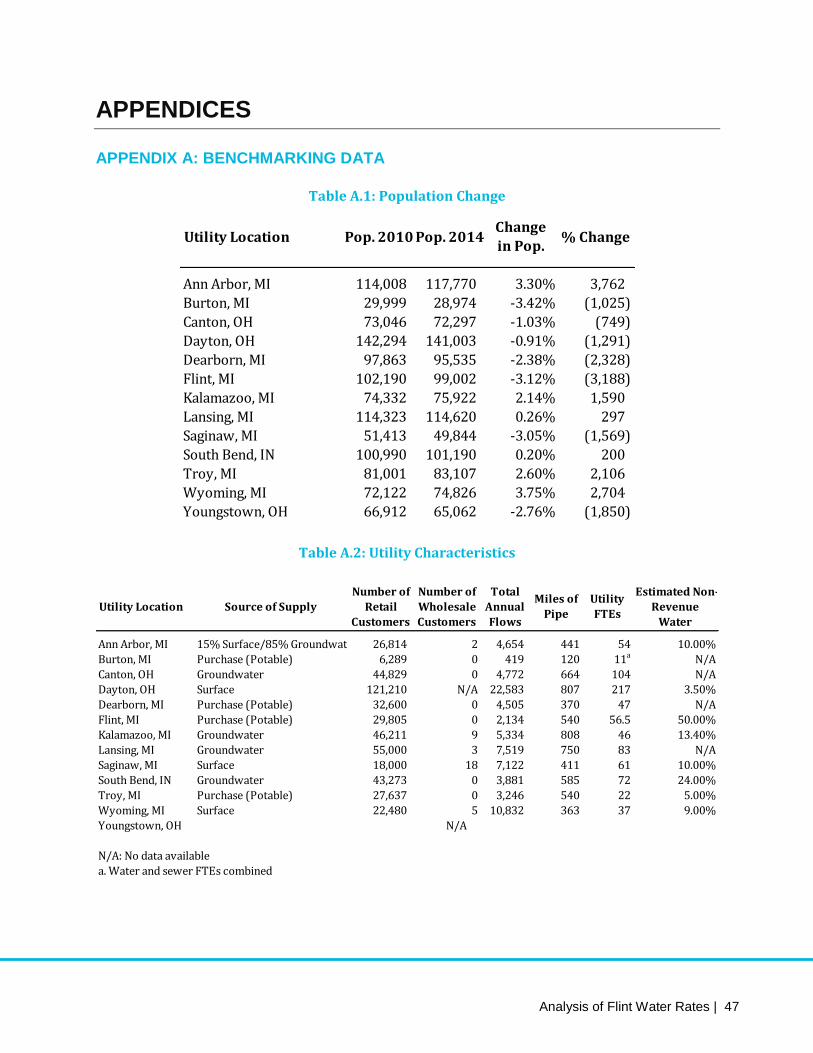
Analysis of Flint Water Rates | 47
APPENDICES
APPENDIX A: BENCHMARKING DATA
Table A.1: Population Change
Table A.2: Utility Characteristics
Utility Location Pop. 2010 Pop. 2014Change
in Pop.% Change
Ann Arbor, MI 114,008 117,770 3.30% 3,762
Burton, MI 29,999 28,974 -3.42% (1,025)
Canton, OH 73,046 72,297 -1.03% (749)
Dayton, OH 142,294 141,003 -0.91% (1,291)
Dearborn, MI 97,863 95,535 -2.38% (2,328)
Flint, MI 102,190 99,002 -3.12% (3,188)
Kalamazoo, MI 74,332 75,922 2.14% 1,590
Lansing, MI 114,323 114,620 0.26% 297
Saginaw, MI 51,413 49,844 -3.05% (1,569)
South Bend, IN 100,990 101,190 0.20% 200
Troy, MI 81,001 83,107 2.60% 2,106
Wyoming, MI 72,122 74,826 3.75% 2,704
Youngstown, OH 66,912 65,062 -2.76% (1,850)
Utility Location Source of Supply
Number of
Retail
Customers
Number of
Wholesale
Customers
Total
Annual
Flows
Miles of
Pipe
Utility
FTEs
Estimated Non-
Revenue
Water
Ann Arbor, MI 15% Surface/85% Groundwater 26,814 2 4,654 441 54 10.00%
Burton, MI Purchase (Potable) 6,289 0 419 120 11a N/A
Canton, OH Groundwater 44,829 0 4,772 664 104 N/A
Dayton, OH Surface 121,210 N/A 22,583 807 217 3.50%
Dearborn, MI Purchase (Potable) 32,600 0 4,505 370 47 N/A
Flint, MI Purchase (Potable) 29,805 0 2,134 540 56.5 50.00%
Kalamazoo, MI Groundwater 46,211 9 5,334 808 46 13.40%
Lansing, MI Groundwater 55,000 3 7,519 750 83 N/A
Saginaw, MI Surface 18,000 18 7,122 411 61 10.00%
South Bend, IN Groundwater 43,273 0 3,881 585 72 24.00%
Troy, MI Purchase (Potable) 27,637 0 3,246 540 22 5.00%
Wyoming, MI Surface 22,480 5 10,832 363 37 9.00%
Youngstown, OH
N/A: No data available
a. Water and sewer FTEs combined
N/A

48 | State of Michigan Department of Treasury
Table A.3: Operating Expenses by Division
Table A.4: Health Care Expenses
Utility Location AdminWater Supply
& Treatment
Water
Production
Customer
ServiceOther Total O&M
Ann Arbor, MI 4,638,805$ 10,581,913$ 4,418,515$ 1,161,173$ -$ 20,800,406$
Burton, MI 906,831 2,996,264 418,520 - - 4,321,615
Canton, OH 510,378 4,747,465 6,708,088 795,893 - 12,761,824
Dayton, OH - - - - - 39,479,606
Dearborn, MI 6,871,794 8,836,945 1,059,887 - - 16,768,626
Flint, MI 12,111,931 21,513,515 4,175,329 530,870 - 38,331,645
Kalamazoo, MI - - - - - 15,164,000
Lansing, MI 10,875,024 11,239,888 5,002,312 - - 27,117,224
Saginaw, MI 1,630,847 12,013,088 1,277,663 909,038 187,666 16,018,302
South Bend, IN 6,831,058 3,053,527 4,845,160 1,010,000 - 15,739,745
Troy, MI - - - - - 16,078,710
Wyoming, MI 2,150,737 6,529,948 3,612,527 567,170 - 12,860,382
Youngstown, OH
N/A: No data available
N/A
Utility LocationEmployee
Health Care
Retiree
Health Care
Ann Arbor, MI 592,091$ 592,061$
Burton, MI 126,605 90,575
Canton, OH 1,066,541 N/A
Dayton, OH N/A N/A
Dearborn, MI 429,091 1,560,421
Flint, MI 953,880 2,546,991
Kalamazoo, MI 563,040 849,515
Lansing, MI 1,212,249 N/A
Saginaw, MI 602,519 701,527
South Bend, IN 1,015,608 0
Troy, MI 219,271 N/A
Wyoming, MI 714,840 N/A
Youngstown, OH N/A N/A
N/A: No data available

Analysis of Flint Water Rates | 49
Table A.5: Transfers by Type
Table A.6: Capital Expenditures
Utility LocationFranchise
fee(s)
Payment in
lieu of taxes
(PILOT)
Indirect Cost
Allocation
Direct
Charges for
Services
Other Total
Ann Arbor, MI -$ 841,713$ 396,017$ -$ -$ 1,237,730$
Burton, MI - - - 32,667 - 32,667
Canton, OH - - 475,000 - - 475,000
Dayton, OH - - - - 4,130,215 4,130,215
Dearborn, MI - - - 459,900 - 459,900
Flint, MI - 740,150 2,772,395 1,762,164 1,130,000 6,404,709
Kalamazoo, MI - 582,900 - - - 582,900
Lansing, MI - 2,248,922 - - - 2,248,922
Saginaw, MI - - 993,240 432,984 138,257 1,564,481
South Bend, IN - 2,039,744 641,062 891,022 - 3,571,828
Troy, MI - - - 361,900 - 361,900
Wyoming, MI - - 1,564,347 - - 1,564,347
Youngstown, OH
N/A: No data available
N/A
Utility LocationRate Funded
CapitalDebt Service Total
Ann Arbor, MI -$ 1,259,094$ 1,259,094$
Burton, MI 642,421 257,847 900,268
Canton, OH - 3,470,000 3,470,000
Dayton, OH - 1,450,412 1,450,412
Dearborn, MI 4,250,000 74,845 4,324,845
Flint, MI - 7,125,359 7,125,359
Kalamazoo, MI 2,500,000 1,708,140 4,208,140
Lansing, MI 11,304,000 1,694,000 12,998,000
Saginaw, MI 1,500,000 1,627,000 3,127,000
South Bend, IN 821,797 2,049,681 2,871,478
Troy, MI 3,400,000 - 3,400,000
Wyoming, MI 1,500,000 4,758,560 6,258,560
Youngstown, OH
N/A: No data available
N/A
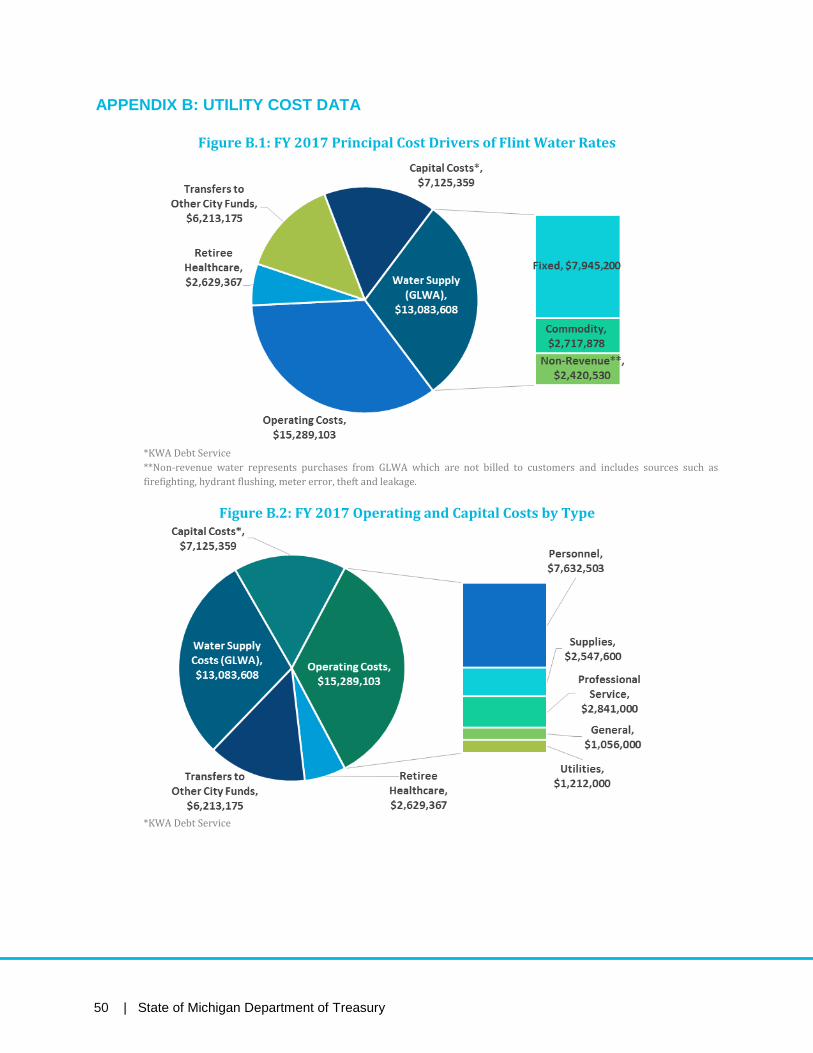
50 | State of Michigan Department of Treasury
APPENDIX B: UTILITY COST DATA
Figure B.1: FY 2017 Principal Cost Drivers of Flint Water Rates
*KWA Debt Service
**Non-revenue water represents purchases from GLWA which are not billed to customers and includes sources such as
firefighting, hydrant flushing, meter error, theft and leakage.
Figure B.2: FY 2017 Operating and Capital Costs by Type
*KWA Debt Service
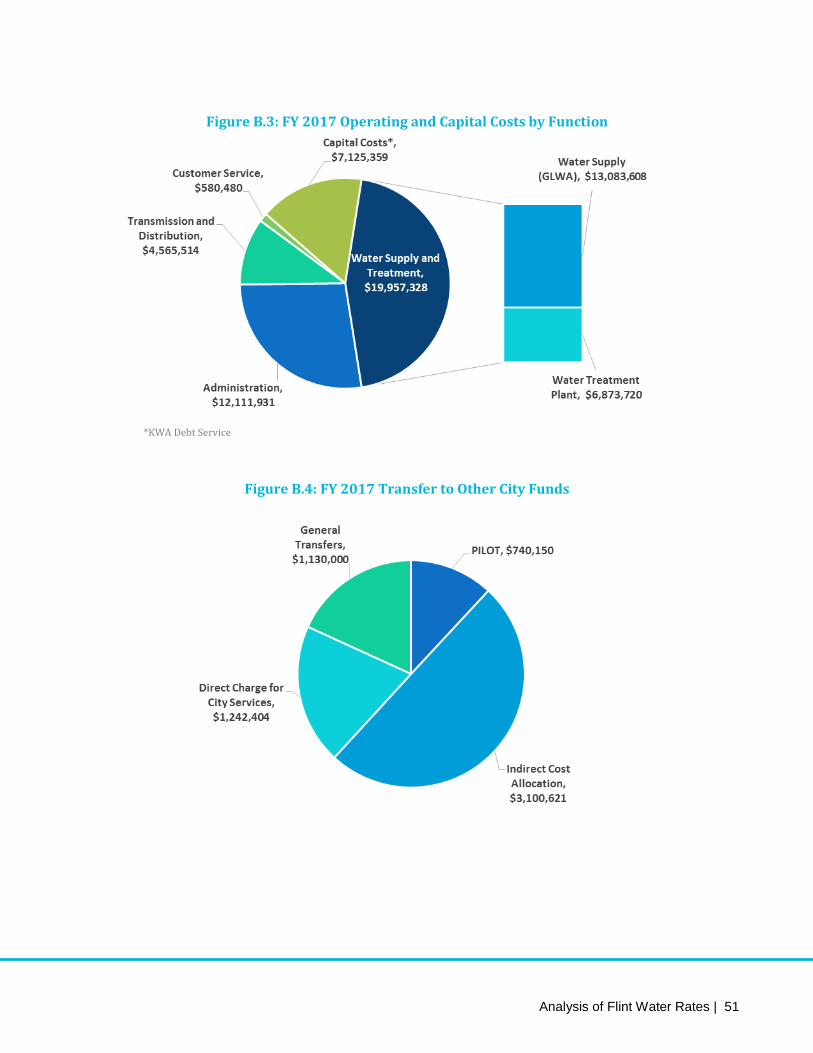
Analysis of Flint Water Rates | 51
Figure B.3: FY 2017 Operating and Capital Costs by Function
*KWA Debt Service
Figure B.4: FY 2017 Transfer to Other City Funds

52 | State of Michigan Department of Treasury
GLOSSARY OF TERMS Annual Operating Revenue Requirement: The total revenues required on an annual basis that are
adequate to meet all expenses and capital requirements of the utility.
Back-Up Supply Costs: The annual cost (capital, or operating) of ensuring redundancy to reduce the
risk of service interruption in the Flint water system.
Budget: An estimate of proposed expenditures for a given period or purpose and a statement of the
means of financing them.
Capital Costs: The costs of repairing and replacing the capital infrastructure needed to deliver safe
and reliable water service.
Commodity Charge: A charge per unit of volume for all water used.
CCF: hundred cubic feet, the basis upon which the City of Flint bills for the volume of water used. One
CCF=748 gallons.
Customer Service: The costs directly associating with serving customers, irrespective of the amount
of water use. Such costs generally include meter reading, billing, account and collecting expense, and
maintenance and capital costs related to meters and associated services.
Debt: An obligation resulting from the borrowing of money or from the purchase of goods and
services for the purpose of constructing utility long-lived fixed assets.
Debt Service: The amounts of money necessary to pay interest and principal requirements for a
given series of years.
Department of Environmental Quality (DEQ): Department of Michigan State government.
Responsible for enforcement of environmental regulations relating to Michigan’s air, land and water
resources.
Drinking Water Revolving Fund (DWRF): A financing program offering low-interest loans issued
by the Michigan Department of Environmental Quality to assist with the construction of water
pollution control facilities.
Detroit Water and Sewerage Department (DWSD): Water utility that provided wholesale water
service to the City of Flint until May of 2014.
Fixed Service Charge: A fixed charge that is billed at regular intervals to a customer, regardless of
water usage.
Fixed Costs: Costs that do not vary regardless of a change in usage or number of customers.
Analysis of Flint Water Rates | 53
Flint Water Advisory Task Force (FWATF): Composed of five members with experience and
backgrounds in public policy, public utilities, environmental protection, public health, and health
care—was appointed by Governor Rick Snyder on October 21, 2015.
Flint Water Interagency Coordinating Committee (FWICC): Group tasked with working on long-
term solutions to the Flint water situation and ongoing public health concerns affecting residents.
FWICC’s membership includes the Mayor of the City of Flint, three experts from the state, three
members representing Genesee County, three representatives from the city of Flint and three subject
matter experts.
Genesee County Drain Commission (GCDC): The water utility serving residents in Genesee County.
Great Lakes Water Authority (GLWA): Formed in January 2016, the GLWA is the current wholesale
water provider to the City of Flint.
Karegnondi Water Authority (KWA): consists of Genesee County Drain Commissioner, Lapeer
County Drain Commissioner, Lapeer City, Sanilac County Drain Commissioner and the City of Flint.
The purpose of the Authority is to provide and distribute raw water to the region of the State of
Michigan commonly referred to as the I-69 corridor.
KWA Subcommittee of the FWICC: Subcommittee of FWICC tasked with coordinating the rate
analysis in this report.
Monthly Cost Per Customer: The total dollar amount for a specific capital or operating expense of
the utility, divided by the number of customer divided by 12. A way of standardizing costs over time
and between utilities for comparison.
Non-Revenue Water: Water which is produced, either via treatment or purchase, but not billed to
water customers. Some sources of water loss relate to legitimate functions of the water utility such
as distribution system flushing and firefighting. Non-revenue water can also occur via breakages in
pipes, leaky joints, malfunctioning customer water meters and water theft.
Operating Costs: The costs incurred to run the utility on a daily basis. These include personnel costs
and the materials and supplies necessary to operate the water system.
Payment in Lieu of Taxes (PILOT): A payment made to the City by the utility instead of taxes.
Personnel Costs: The costs associated with salaries and benefits of current water utility employees.
Professional Services: Work contracted out to a third party to assist in operating the water utility.
Professional services are utilized in situations where the City lacks the staff or expertise to perform
a particular task, or for tasks where it would not be feasible to maintain full-time staff.
54 | State of Michigan Department of Treasury
Raw Water: Water that is obtained directly from the supply sources (e.g. wells, reservoirs, rivers,
etc.) that has not been treated to potable water standards.
Regulatory Requirements: A variety of ongoing rules and requirements from the Environmental
Protection Agency (EPA) that the utility must adhere to, in order to ensure the safety of the water
system.
Retiree Healthcare Costs: The costs associated with providing healthcare coverage to retired City
employees.
Revenue Requirements: The total annual operating and maintenance expense and capital-related
costs incurred in meeting various aspects of providing water utility service.
Transfers: Monies transferred from the water utility to other funds (typically the City’s General
Fund) to recognize the costs incurred by those funds to serve the water utility.
Transmission and Distribution Costs: The costs associated with maintaining the City’s network of
450 miles of water mains.
Treated Water: Water that has been obtained from supply sources and treated to produce potable
water standards.
Treatment Costs: The costs associated with the operation and maintenance of the City’s water
treatment plant, which has historically been maintained as a back-up to GLWA supply.
Typical Monthly Bill: The bill that results from a customer who has a 5/8” water meter and uses 5
CCF (3,740 gallons) of water per month. A way of standardizing bills over time and between different
utilities for comparison.
Water Supply Costs: The costs associated with bringing water to the City of Flint for treatment
and/or distribution.
Wholesale Service: Service in which water is sold to a customer at one or more major points of
delivery for resale within the wholesale customer’s service area.
Variable Costs: Costs that tend to vary with the quantity of water produced, including the costs of
chemicals, a large part of power costs, and other elements that follow or change almost directly with
the amount of water produced.