state of latinos in nevada - march 21, 2014
TRANSCRIPT

8/11/2019 State of Latinos in Nevada - March 21, 2014
http://slidepdf.com/reader/full/state-of-latinos-in-nevada-march-21-2014 1/24
State of Latinos in NevadaMarch 21, 2014
Dr. Nancy E. Brune, Executive Director
Victoria Carreón, Director of Research and Policy
1

8/11/2019 State of Latinos in Nevada - March 21, 2014
http://slidepdf.com/reader/full/state-of-latinos-in-nevada-march-21-2014 2/24
Latinos in Nevada
• Latinos in Nevada harder hit in the recession
• It has been hard for Latinos to bounce back because ofthe lack of infrastructure of opportunity
• Where Latinos lag behind
Education
Good jobs
Health
• Institutional weaknesses compared to our
Intermountain West neighbors
2

8/11/2019 State of Latinos in Nevada - March 21, 2014
http://slidepdf.com/reader/full/state-of-latinos-in-nevada-march-21-2014 3/24
Latino population has been growing in the
Intermountain West
3

8/11/2019 State of Latinos in Nevada - March 21, 2014
http://slidepdf.com/reader/full/state-of-latinos-in-nevada-march-21-2014 4/24
Most Latinos are U.S. citizens
4

8/11/2019 State of Latinos in Nevada - March 21, 2014
http://slidepdf.com/reader/full/state-of-latinos-in-nevada-march-21-2014 5/24
Undocumented immigrants are
overrepresented in labor force
5
HighestRate

8/11/2019 State of Latinos in Nevada - March 21, 2014
http://slidepdf.com/reader/full/state-of-latinos-in-nevada-march-21-2014 6/24
Latinos were hardest hit by
economic downturn
• After the recession,Nevada’s Latino
unemployment rate was
highest in the region 6
• Before the recession,Nevada’s Latino
unemployment rate was
similar to other states

8/11/2019 State of Latinos in Nevada - March 21, 2014
http://slidepdf.com/reader/full/state-of-latinos-in-nevada-march-21-2014 7/24
Need for food stamps
increased after recession
7
• After the recession,Nevada’s Latino food
stamp rate is 5 times
greater
• Before the recession,Nevada’s Latino food
stamp rate was lowest in
region

8/11/2019 State of Latinos in Nevada - March 21, 2014
http://slidepdf.com/reader/full/state-of-latinos-in-nevada-march-21-2014 8/24
Effects of recession reflected in
issues of concern
8

8/11/2019 State of Latinos in Nevada - March 21, 2014
http://slidepdf.com/reader/full/state-of-latinos-in-nevada-march-21-2014 9/24
Lack of infrastructure of opportunity
has made it difficult to rebound
• Economic recession revealed the lack of infrastructure ofopportunity and a lack of economic resiliency
• Challenges for Latinos
Low levels of educational proficiency
Low graduation rates
Low college attainment rates
• Results
Not getting jobs
Lower pay
Not represented in high –wage sectors
• Nevada Latinos fall short compared to Intermountain Westpeers
9

8/11/2019 State of Latinos in Nevada - March 21, 2014
http://slidepdf.com/reader/full/state-of-latinos-in-nevada-march-21-2014 10/24
Low proficiency in math & reading
10
• Nevada whites- 2nd lowestperformance in region
• Nevada Latinos- 3rd lowest
performance
• Nevada whites- lowestperformance in region
• Nevada Latinos- 3rd lowest
performance

8/11/2019 State of Latinos in Nevada - March 21, 2014
http://slidepdf.com/reader/full/state-of-latinos-in-nevada-march-21-2014 11/24
Nevada graduation rates lag
behind other states
11
• Nevada is the lowest in region for all groups for high
school and college graduation

8/11/2019 State of Latinos in Nevada - March 21, 2014
http://slidepdf.com/reader/full/state-of-latinos-in-nevada-march-21-2014 12/24
Industry Arizona California Colorado Nevada
New
Mexico Texas Utah
All Sectors 65% 57% 67% 69% 73% 61% 68%
Construction 72% 72% 77% 72% 85% 71% 79%
Manufacturing 54% 45% 61% 67% 66% 58% 65%
Retail Trade 77% 70% 83% 80% 86% 75% 78%
Mgmt. of Companies
& Enterprises 54% 49% 57% 51% 67% 51% 56%
Accommodation &Food Services 86% 86% 88% 85% 92% 87% 97%
Latino Wages as Percent of Non-Latino Wages: 2012
Latinos are paid less within
every industry
12
• On average, Latinos make 69¢ for every dollar non-Latinos earn
• Nevada is better than large states in most areas
• Biggest wage disparities in management of companies
• Best industry is accommodation/food services, which could reflect union effect

8/11/2019 State of Latinos in Nevada - March 21, 2014
http://slidepdf.com/reader/full/state-of-latinos-in-nevada-march-21-2014 13/24
Latinos are underrepresented in
high skilled jobs
13
Latinos Over-Represented
Latinos Under-Represented
8/11/2019 State of Latinos in Nevada - March 21, 2014
http://slidepdf.com/reader/full/state-of-latinos-in-nevada-march-21-2014 14/24
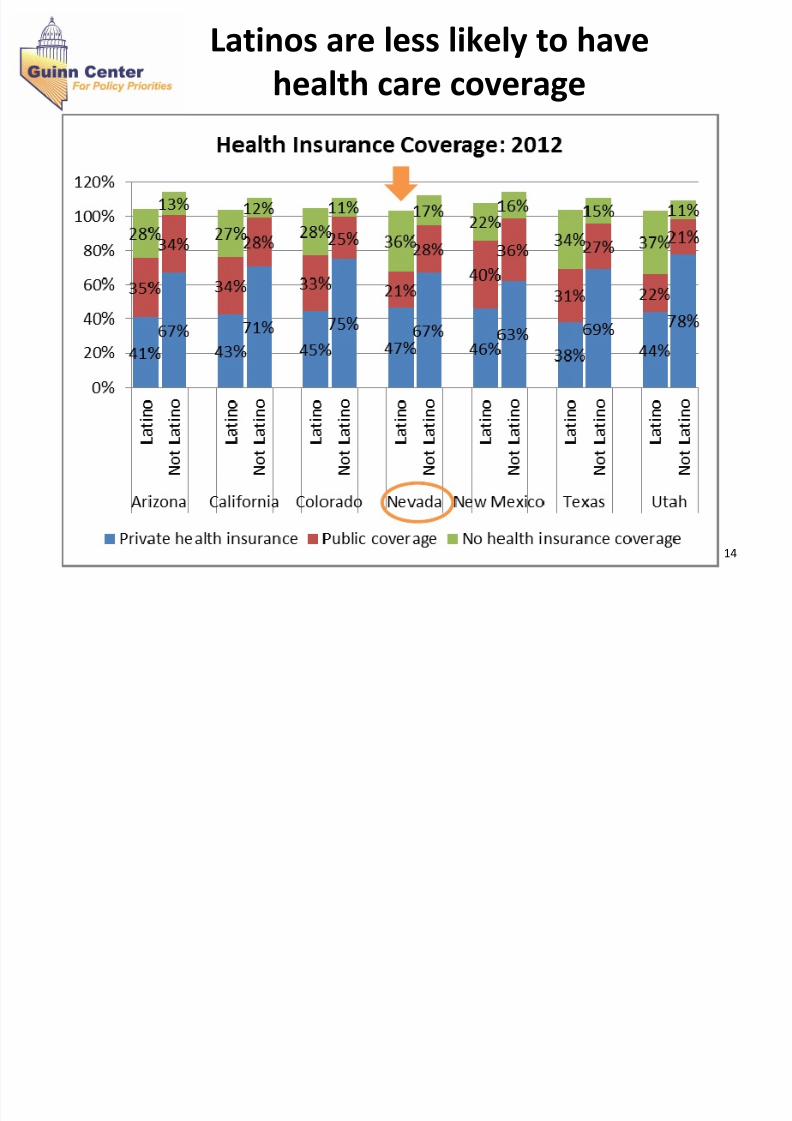
Latinos are less likely to have
health care coverage
14

8/11/2019 State of Latinos in Nevada - March 21, 2014
http://slidepdf.com/reader/full/state-of-latinos-in-nevada-march-21-2014 15/24
Institutional weaknesses compared to
our Intermountain West neighbors
15•
Low federal funding per capita

8/11/2019 State of Latinos in Nevada - March 21, 2014
http://slidepdf.com/reader/full/state-of-latinos-in-nevada-march-21-2014 16/24
Institutional weaknesses compared to
our Intermountain West neighbors
16
• Fewer Latino-serving community based
organizations
3 in Nevada
9 in Colorado, 11 in New Mexico, 14 in Arizona
• Nevada has no Hispanic Serving Institutions
7 in Colorado, 10 in Arizona, 23 in New Mexico
Nevada has 5 emerging institutions

8/11/2019 State of Latinos in Nevada - March 21, 2014
http://slidepdf.com/reader/full/state-of-latinos-in-nevada-march-21-2014 17/24
Policy Implications
• Latinos are a growing part of the population
• Implications of low education levels and low wage levelsof Latinos
Lower consumer demand and purchasing power
Lower tax revenues
Difficult to diversify economy if workers do not have 21st century skills
Long term fiscal impact for increased use of social services
• Public investment and quality services are both important
• Key role for nonprofit agencies
17

8/11/2019 State of Latinos in Nevada - March 21, 2014
http://slidepdf.com/reader/full/state-of-latinos-in-nevada-march-21-2014 18/24
Natural and Built EnvironmentArts & Culture
Additional Information for
Break-out Groups
18

8/11/2019 State of Latinos in Nevada - March 21, 2014
http://slidepdf.com/reader/full/state-of-latinos-in-nevada-march-21-2014 19/24
Natural Environment: Parks
19
CityAcreage(Max 40)
Services andInvestment (Max 40)
Access(Max 40)
Park Score(Max 100)
Albuquerque 27 17 32 63.5
Denver 17 25 30 60
Houston 23 10 14 39
Las Vegas 17 26 14 47.5
Los Angeles 27 6 18 42.5Phoenix 34 14 14 51.5

8/11/2019 State of Latinos in Nevada - March 21, 2014
http://slidepdf.com/reader/full/state-of-latinos-in-nevada-march-21-2014 20/24
Built Environment:
Transportation to Work
Public Transit
20
8/11/2019 State of Latinos in Nevada - March 21, 2014
http://slidepdf.com/reader/full/state-of-latinos-in-nevada-march-21-2014 21/24
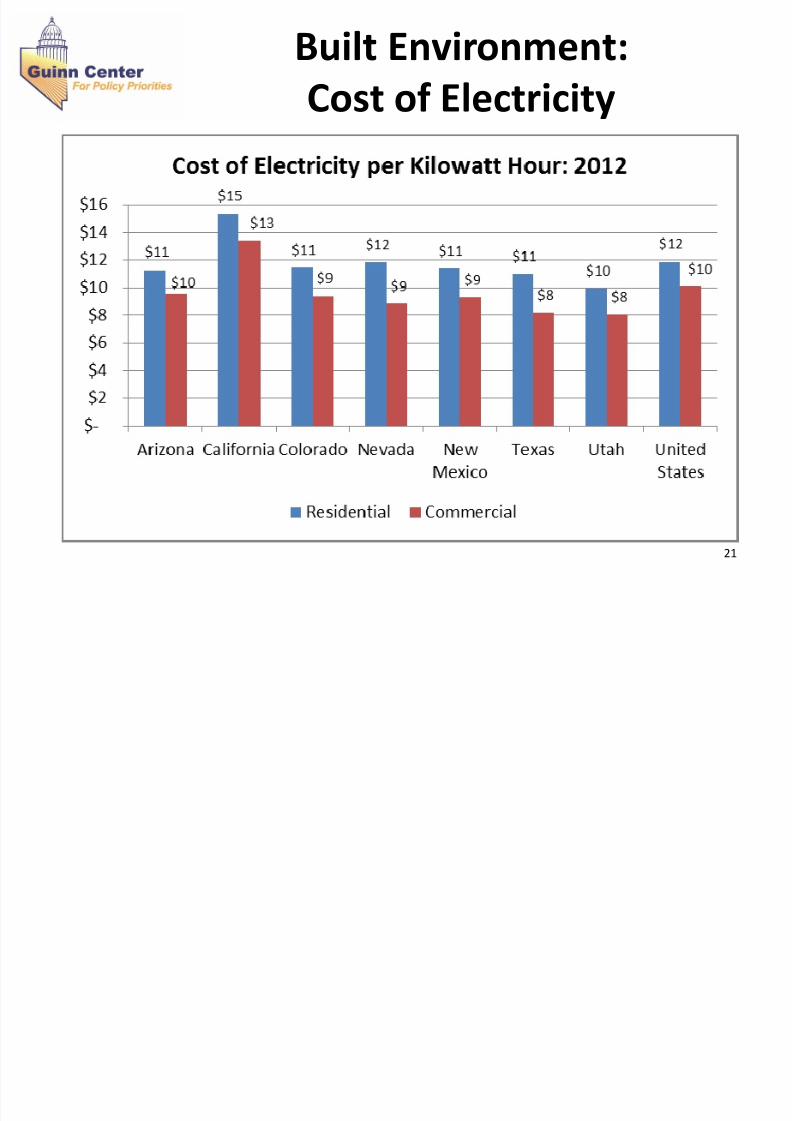
Built Environment:
Cost of Electricity
21
8/11/2019 State of Latinos in Nevada - March 21, 2014
http://slidepdf.com/reader/full/state-of-latinos-in-nevada-march-21-2014 22/24
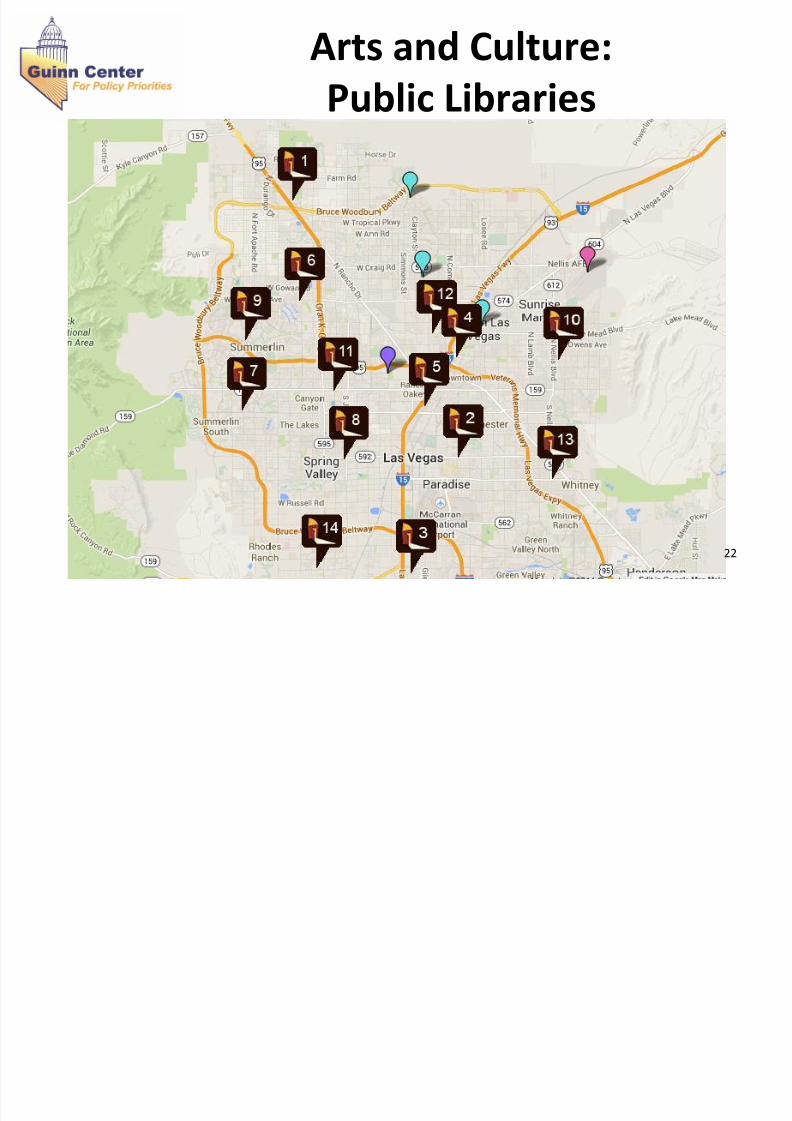
Arts and Culture:
Public Libraries
22

8/11/2019 State of Latinos in Nevada - March 21, 2014
http://slidepdf.com/reader/full/state-of-latinos-in-nevada-march-21-2014 23/24
Arts and Culture:
Cultural Vitality Rankings
CityArts
Establishments
Employment in
ArtsEstablishments
Arts Non-Profits
Nonprofit Community
Celebrations, Festivals,Fairs, Parades
Non-Profit
ArtsExpenses
Non-Profit
ArtsContributions
ArtistJobs
Denver 17 16 16 28 11 11 12
Houston 58 24 48 20 17 28 42
Las Vegas 11 22 61 51 61 60 8
Los Angeles 1 6 33 53 20 10 3
Phoenix 43 47 54 56 57 56 32
Salt Lake City 18 20 35 11 30 25 33
Cultural Vitality Rankings of Metropolitan Areas
with Population of More Than 1 Million
23

8/11/2019 State of Latinos in Nevada - March 21, 2014
http://slidepdf.com/reader/full/state-of-latinos-in-nevada-march-21-2014 24/24
Arts and Culture:
Funding for the Arts
24