state of indiana department of education 2016 … · 2016-2017 cte dashboard report state of...
TRANSCRIPT

2016-2017 CTE DASHBOARD REPORT
STATE OF INDIANA
AREA CAREER AND TECHNICAL EDUCATION - DISTRICT 35
Area District #35 - Vigo County School Corp.
DEPARTMENT OF EDUCATION
1/22/2018 7:52:23 AM

Average Wage
2016-2017 CTE DASHBOARD REPORT : DISTRICT 35INDIANA DEPARTMENT OF EDUCATION
AREA CAREER AND TECHNICAL EDUCATION
Hoosier Hot Jobs for the Region 1
Area District #35 - Vigo County School Corp.
Hot JobRank Growth Projection
1 $48,159*Preschool, Primary, Secondary, and Special Education School Teachers 8.20%
2 $59,173Registered Nurses 12.51%
3 $64,343*Postsecondary Teachers 14.49%
4 $88,991General and Operations Managers 11.21%
5 $40,785Heavy and Tractor-Trailer Truck Drivers 11.97%
6 $36,091First-Line Supervisors of Retail Sales Workers 13.91%
7 $194,388Physicians and Surgeons, All Other 17.65%
8 $38,989Licensed Practical and Licensed Vocational Nurses 18.67%
9 $41,271First-Line Supervisors of Office and Administrative Support Workers 11.49%
10 $38,070Maintenance and Repair Workers, General 9.71%
11 $51,874Sales Representatives, Wholesale and Manufacturing, Except Technical 12.99%
12 $45,299Industrial Machinery Mechanics 28.57%
13 $127,711Pharmacists 11.62%
14 $52,135Accountants and Auditors 11.25%
15 $35,769Industrial Truck and Tractor Operators 7.95%
16 $32,817Bookkeeping, Accounting, and Auditing Clerks 9.87%
17 $50,541First-Line Supervisors of Production and Operating Workers 7.48%
18 $57,639Electricians 13.78%
19 $82,215Physical Therapists 25.00%
20 $74,448Financial Managers 9.48%
21 $74,309Medical and Health Services Managers 16.19%
22 $69,415Industrial Engineers 10.64%
23 $41,264Police and Sheriff’s Patrol Officers 7.24%
24 $88,544Industrial Production Managers 4.93%
25 $58,255First-Line Supervisors of Mechanics, Installers, and Repairers 9.70%
Page 2 of 23
1. Data taken from Hoosier Hot 50 Jobs, Visit HoosierHot50.com for more information.
1/22/2018 7:52:23 AM

2016-2017 CTE DASHBOARD REPORT : DISTRICT 35INDIANA DEPARTMENT OF EDUCATION
Enrollments and Demographics
Enrollments By Year
14-15 15-16 16-17
7,000
6,500
6,000
5,500
5,000
4,500
4,000
3,500
3,000
2,500
2,000
1,500
1,000
500
0
6,298 6,3036,033
Gender Trends
Male Female
14-15 15-16 16-17
3,500
3,000
2,500
2,000
1,500
1,000
500
0
3,378 3,3413,213
2,920 2,9622,820
Free/Reduced Participation By Year
14-15 15-16 16-17
3,500
3,000
2,500
2,000
1,500
1,000
500
0
3,372 3,3453,194
Special Populations Participation by Year
14-15 15-16 16-17
1,500
1,400
1,300
1,200
1,100
1,000
900
800
700
600
500
400
300
200
100
0
1,3571,315 1,303
Page 3 of 231/22/2018 7:52:23 AM

2016-2017 CTE DASHBOARD REPORT : DISTRICT 35INDIANA DEPARTMENT OF EDUCATION
Corp ID School Name Conducting School Home School
Conducting vs Home Enrollment
C1125 CLAY COMMUNITY SCHOOLS 1,076 1,076
8030 VIGO COUNTY SCHOOL CORP 4,957 4,957
6,033 6,033Total
Home School - Every Enrollment where the student is from that schoolConducting School - Every Enrollment where the class is taught
Overall CTE Grad Rate (4S1 State)Overall Statewide High School Grad RateActual District Grad Rate (4S1 ACTED)
2016-2017
110
100
90
80
70
60
50
40
30
20
10
0
94.5587.19
94.12
Graduation Rates-CTE Students vs. All graduates2
Page 4 of 23
Data received from InTERS and DOE.2
1/22/2018 7:52:23 AM

2016-2017 CTE DASHBOARD REPORT : DISTRICT 35INDIANA DEPARTMENT OF EDUCATION
CTE StudentPerformance
IndicatorsIndicator Description
Indiana Career and Technical EducationStudent Performance Indicators-Secondary
1S1 AcademicAchievement in
Reading/Lang Arts
Number of CTE concentrators who have passed the English/ Language Arts portion of theGraduation Qualifying Exam (GQE)
1S2 AcademicAchievement in
Mathematics
Number of CTE concentrators who have passed the Mathematics portion of the GraduationQualifying Exam (GQE)
2S1 Technical SkillAttainment
Number of CTE concentrators and completers who passed state-approved technical skillassessments defined for Indiana Career Pathways.
5S1 Placement Number of CTE concentrators who left secondary education and were placed in postsecondaryeducation or advanced training, military service or employment in second quarter after leaving
secondary education.
3S1 SchoolCompletion
Number of CTE concentrators who earned a regular secondary school diploma.
4S1 StudentGraduation Rate
Number of CTE concentrators who were included as graduates in the state’s calculation.
6S1 NontraditionalParticipation
Number of CTE participants from underrepresented gender groups who participated in a programleading to employment in nontraditional fields.
6S2 NontraditionalCompletion
Number of CTE completers from underrepresented gender groups who participated in a programleading to employment in nontraditional fields.
Page 5 of 231/22/2018 7:52:23 AM

2016-2017 CTE DASHBOARD REPORT : DISTRICT 35INDIANA DEPARTMENT OF EDUCATION
Additional CTEStudent Performance
IndicatorsIndicator Description
3EXT Cluster Match Number of CTE concentrators who graduated last year and are enrolled in postsecondary duringthe current year in the same major or career cluster/pathway as they were in high school.
6EXT Remediation Number of CTE concentrators who graduated last year and who enrolled in postsecondaryremedial mathematics, writing, or reading courses upon entering postsecondary education.
4EXT IndustryCertification/ Licensing
Number of CTE concentrators students who graduated last year with a state orindustry-recognized certificate, license or credential.
1EXT Enrollment inPrograms/Pathways
Number of CTE concentrators who enrolled in one or more courses in a CTE program or IndianaCollege and Career Pathway.
2EXT PostsecondaryEnrollment
Number of CTE concentrators who graduated last year and are enrolled in postsecondary duringthe current year.
5EXT Dual Credits Number of CTE concentrators who graduated last year with transcripted postsecondary credits(dual credits).
1S2/LT Number of CTE concentrators who failed math in 10th grade and passed in a subsequent year.
Completion Rate Number of CTE concentrators enrolled in CTE in one of the last four years who also completed aprogram during those four years.
1S1/LT Number of CTE concentrators who failed language arts in 10th grade and passed in asubsequent year.
CTE Completer: A CTE Completer is a CTE Concentrator who has taken the state-specified pathway assessmentin a state approved College and Career Pathway (revised January 2012).
CTE Concentrator: A CTE Concentrator is an Indiana student who has earned at least six (6) credits in CTE pathwaycourses in a state approved College and Career Pathway (revised January 2012).
Term Secondary Concentrator and Participant Definitions
Page 6 of 231/22/2018 7:52:23 AM

2016-2017 CTE DASHBOARD REPORT : DISTRICT 35INDIANA DEPARTMENT OF EDUCATION
Multiple Year Core Indicator Results
Core Indicator State AUL14-15
LocalAUL 14-15
ACTED14-15
State AUL15-16
Local AUL15-16
ACTED15-16
State AUL16-17
Local AUL16-17
ACTED16-17
State AUL17-18
Local AUL17-18
65.50%1S1 62.62% 81.56% 70.00% 67.12% 83.07% 70.00% 69.13% 84.49% 78.00% 77.03%Academic Achievement Lang
71.00%1S2 68.58% 82.98% 80.00% 77.58% 87.69% 80.00% 79.91% 89.50% 88.00% 89.04%Academic Achievement Math
88.00%2S1 89.60% 90.88% 89.00% 90.00% 85.67% 89.00% 90.00% 88.85% 89.00% 90.00%Technical Skill Attainment
94.00%3S1 94.50% 99.77% 96.00% 96.50% 100.00% 96.00% 97.95% 99.73% 95.00% 95.00%Completion
94.25%4S1 94.30% 95.57% 95.00% 94.30% 94.96% 95.00% 94.77% 94.12% 95.00% 94.77%Graduation (NCLB)
90.00%5S1 94.78% 55.94% 90.00% 90.00% 99.68% 90.00% 91.35% 58.33% 95.00% 95.00%Placement
31.00%6S1 29.66% 16.49% 29.50% 29.66% 15.18% 29.50% 29.81% 16.99% 29.50% 29.81%Non-Trad Participation
25.00%6S2 16.87% 11.71% 20.00% 16.87% 13.23% 20.00% 16.95% 11.34% 20.00% 16.95%Non-Trad Completion
N/A7X 38.10% 62.05% N/A 38.10% 70.78% N/A 38.10% 72.09% N/A 38.10%COMPLETION RATE
N/A8X 79.73% 74.23% N/A 79.73% 77.42% N/A 79.73% 64.06% N/A 79.73%Academic Achievement Lang
N/A9X 79.43% 72.34% N/A 79.43% 76.00% N/A 79.43% 61.70% N/A 79.43%Academic Achievement Math /
NEED AN IMPROVEMENT PLAN
NEED AN IMPROVEMENT PLAN (year 2)
NEED AN IMPROVEMENT PLAN (year 3)
Page 7 of 231/22/2018 7:52:23 AM

2016-2017 CTE DASHBOARD REPORT : DISTRICT 35INDIANA DEPARTMENT OF EDUCATION
Disaggregated Core Indicator Results
1S1Academic
AchievementNew-Lang
Arts
1S2Academic
AchievementNew-Math
2S1Technical
SkillsAttainment
3S1Completion
4S1Graduation
(NCLB)
5S1 Post
GraduateFollow Up
6S1 Non-Trad
Participation
6S2Non-Trad
Completion
Disaggregate
Overall Total 84.49% 89.50% 88.85% 99.73% 94.12% 58.33% 16.99% 11.34%
Male 79.10% 88.12% 90.57% 99.51% 92.35% 53.54% 6.29% 6.41%
Female 91.25% 91.25% 86.55% 100% 96.27% 63.44% 39.78% 20.73%
American Indian 100% 100% -- 100% 100% 0% 50% --
Asian or PacificIslander
-- -- -- -- -- 66.67% 33.33% 100%
African American 57.14% 50% 60% 100% 92.31% 61.54% 11.94% 0%
Hispanic, NotAfrican American
85.71% 75% 80% 100% 100% 28.57% 7.50% 12.50%
Hawaiian -- -- -- -- -- -- -- --
White - NotHispanic
85.80% 91.36% 89.84% 99.69% 93.77% 58.31% 17.45% 11.37%
Multi-Race or Other 80% 93.33% 100% 100% 100% 65.52% 14.74% 12.50%
Disabled 54.55% 75.64% 88.52% 100% 88.16% 52.56% 10.79% 7.69%
EconomicallyDisadvantaged
76.67% 83.98% 86.33% 99.45% 89.94% 56.54% 15.15% 9.84%
Single Parent -- -- -- -- -- -- -- --
DisplacedHomemaker
-- -- -- -- -- -- -- --
Limited EngProficiency
-- -- -- -- -- -- -- --
Non Traditional 93.33% 93.33% 87.50% 100% 90.32% 57.58% 100% 100%
Other EducationalBarrier
-- -- -- -- -- -- -- --
Page 8 of 231/22/2018 7:52:23 AM

2016-2017 CTE DASHBOARD REPORT : DISTRICT 35INDIANA DEPARTMENT OF EDUCATION
2016-2017 Final Student Indicator Results by School
School
1S1Academic
AchievementNew-Lang
Arts
1S2Academic
AchievementNew-Math
2S1Technical
SkillsAttainment
3S1Completion
4S1Graduation
(NCLB)
5S1 Post Graduate
Follow Up(All/EDU/EMP)
6S1Non-Trad
Participation
6S2Non-Trad
CompletionEnrolled *
State Agreed Upon Level 29.50% 20.00%70.00% 80.00% 89.00% 96.00% 95.00% 90.00%--
BOOKER T WASHINGTON ALTERNATIVE HIGH SCHOOL 100% --0% 0% -- 100% -- 100%37
CLAY CITY JR-SR HIGH SCHOOL 30.19% --100% 100% -- 100% 100% 50%201
HONEY CREEK MIDDLE SCHOOL -- ---- -- -- -- -- --114
MCLEAN HIGH SCHOOL -- --100% 0% -- 100% -- 50%25
NORTHVIEW HIGH SCHOOL 32.35% 16%88.46% 94.34% 71.88% 100% 89.29% 39.34%875
OTTER CREEK MIDDLE SCHOOL -- ---- -- -- -- -- --94
SARAH SCOTT MIDDLE SCHOOL -- ---- -- -- -- -- --49
TERRE HAUTE NORTH VIGO HS 13.11% 12.62%84.66% 92.02% 89.84% 100% 97.47% 65.17%1951
TERRE HAUTE SOUTH VIGO HS 11.74% 9.09%84.17% 86.67% 92.16% 100% 93.22% 60.19%1720
WEST VIGO HIGH SCHOOL 21.13% 9.09%77.27% 81.82% 93.75% 95.65% 86.96% 50%812
WEST VIGO MIDDLE SCHOOL -- ---- -- -- -- -- --43
WOODROW WILSON MIDDLE SCHOOL -- ---- -- -- -- -- --112
Page 9 of 231/22/2018 7:52:23 AM
* Enrollment counts are for all students for the report year, and only give a guide to the enrollment levels as they relate to the Federal Indicators. (They do not represent the denominators used in each of the Federal Indicators.)

2016-2017 CTE DASHBOARD REPORT : DISTRICT 35INDIANA DEPARTMENT OF EDUCATION
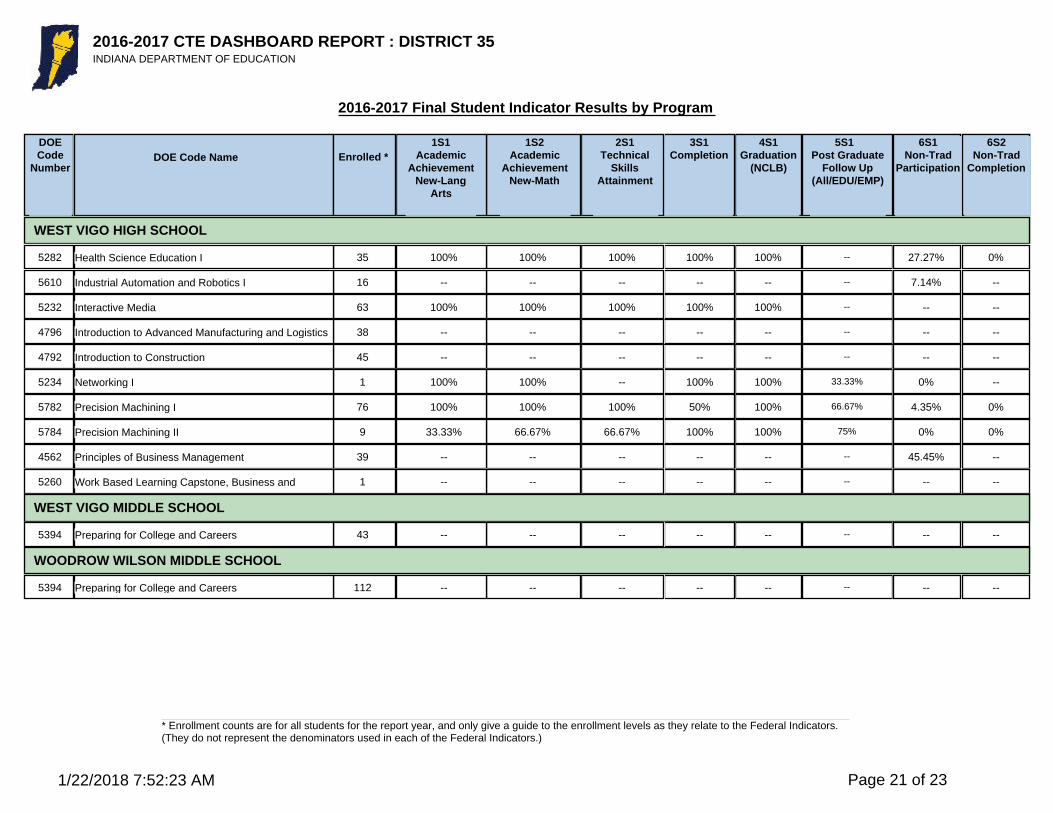
2016-2017 Final Student Indicator Results by Program
1S1Academic
AchievementNew-Lang
Arts
1S2Academic
AchievementNew-Math
2S1Technical
SkillsAttainment
3S1Completion
4S1Graduation
(NCLB)
5S1 Post Graduate
Follow Up(All/EDU/EMP)
6S1Non-Trad
Participation
6S2Non-Trad
Completion
DOECode
NumberDOE Code Name Enrolled *
STATE AGREED UPON LEVEL
70.00% 80.00% 89.00% 96.00% 95.00% 90.00% 29.50% 20.00%--
BOOKER T WASHINGTON ALTERNATIVE HIGH SCHOOL
5330 -- -- -- -- -- -- -- --Adult Roles and Responsibilities 13
5360 -- -- -- -- -- -- -- --Advanced Child Development 6
5362 -- -- -- -- -- -- -- --Child Development 8
5412 0% 0% -- 100% -- 100% -- --Early Childhood Education I --
5364 -- -- -- -- -- -- -- --Interpersonal Relationships 8
4562 -- -- -- -- -- -- 100% --Principles of Business Management 2
CLAY CITY JR-SR HIGH SCHOOL
5002 100% 100% -- 100% 100% -- 40% --Agribusiness Management 12
5088 -- -- -- -- -- 0% -- --Agriculture Power, Structure and Technology --
5362 -- -- -- -- -- -- -- --Child Development 30
5408 -- -- -- -- -- -- -- --Education Professions I 4
5282 -- -- -- -- -- -- 50% --Health Science Education I 2
5902 -- -- -- -- -- -- -- --Interdisciplinary Cooperative Education 8
5056 -- -- -- -- -- -- 25% --Introduction to Agriculture, Food and Natural 14
4792 -- -- -- -- -- -- -- --Introduction to Construction 7
4802 -- -- -- -- -- -- 11.11% --Introduction to Engineering Design non PLTW 21
Page 10 of 231/22/2018 7:52:23 AM
* Enrollment counts are for all students for the report year, and only give a guide to the enrollment levels as they relate to the Federal Indicators. (They do not represent the denominators used in each of the Federal Indicators.)

2016-2017 CTE DASHBOARD REPORT : DISTRICT 35INDIANA DEPARTMENT OF EDUCATION
2016-2017 Final Student Indicator Results by Program
1S1Academic
AchievementNew-Lang
Arts
1S2Academic
AchievementNew-Math
2S1Technical
SkillsAttainment
3S1Completion
4S1Graduation
(NCLB)
5S1 Post Graduate
Follow Up(All/EDU/EMP)
6S1Non-Trad
Participation
6S2Non-Trad
Completion
DOECode
NumberDOE Code Name Enrolled *
CLAY CITY JR-SR HIGH SCHOOL
4784 -- -- -- -- -- -- -- --Introduction to Manufacturing 11
4798 -- -- -- -- -- -- -- --Introduction to Transportation 15
5180 -- -- -- -- -- -- 54.55% --Natural Resources 12
5342 -- -- -- -- -- -- -- --Nutrition and Wellness 21
5394 -- -- -- -- -- -- -- --Preparing for College and Careers 36
5260 -- -- -- -- -- 66.67% -- --Work Based Learning Capstone, Business and --
5974 -- -- -- -- -- -- -- --Work Based Learning Capstone, Multiple Pathways 4
HONEY CREEK MIDDLE SCHOOL
5394 -- -- -- -- -- -- -- --Preparing for College and Careers 114
MCLEAN HIGH SCHOOL
5330 -- -- -- -- -- -- -- --Adult Roles and Responsibilities 25
5608 100% 0% -- 100% -- 100% -- --Advanced Manufacturing I --
5606 -- -- -- -- -- 0% -- --Advanced Manufacturing II --
NORTHVIEW HIGH SCHOOL
5330 -- -- -- -- -- -- -- --Adult Roles and Responsibilities 18
5008 0% 100% -- 100% 100% -- 53.13% --Animal Sciences 41
5510 50% 75% -- 100% 100% 14.29% 7.69% --Automotive Services Technology I 15
5546 66.67% 75% 33.33% 100% 66.67% 30% 0% 0%Automotive Services Technology II 4
Page 11 of 231/22/2018 7:52:23 AM
* Enrollment counts are for all students for the report year, and only give a guide to the enrollment levels as they relate to the Federal Indicators. (They do not represent the denominators used in each of the Federal Indicators.)

2016-2017 CTE DASHBOARD REPORT : DISTRICT 35INDIANA DEPARTMENT OF EDUCATION
2016-2017 Final Student Indicator Results by Program
1S1Academic
AchievementNew-Lang
Arts
1S2Academic
AchievementNew-Math
2S1Technical
SkillsAttainment
3S1Completion
4S1Graduation
(NCLB)
5S1 Post Graduate
Follow Up(All/EDU/EMP)
6S1Non-Trad
Participation
6S2Non-Trad
Completion
DOECode
NumberDOE Code Name Enrolled *
NORTHVIEW HIGH SCHOOL
5362 -- -- -- -- -- -- -- --Child Development 81
5236 100% 100% -- 100% 80% -- -- --Computer Science II: Programming 9
5580 77.78% 88.89% 62.50% 100% 88.89% 50% 0% 0%Construction Trades I 15
5578 100% 100% 100% 100% 100% 57.14% 33.33% 33.33%Construction Trades II 3
5802 100% 100% 0% 100% 25% -- 0% --Cosmetology I 3
5806 -- -- -- -- -- 11.11% -- --Cosmetology II --
5408 100% 100% -- 100% 100% 66.67% -- --Education Professions I 12
5102 100% 100% -- 100% 100% -- 70% --Food Science 24
5282 100% 100% -- 100% 100% 50% 22.50% --Health Science Education I 41
5284 100% 100% 100% 100% 100% 57.14% 21.43% 23.08%Health Science Education II: Nursing 14
5366 -- -- -- -- -- -- -- --Human Development and Wellness 11
5902 -- -- -- -- -- 0% -- --Interdisciplinary Cooperative Education 38
5364 -- -- -- -- -- -- -- --Interpersonal Relationships 50
4524 -- -- -- -- -- -- -- --Introduction to Accounting 15
5056 -- -- -- -- -- -- 40% --Introduction to Agriculture, Food and Natural 38
4792 -- -- -- -- -- -- -- --Introduction to Construction 42
4794 -- -- -- -- -- -- -- --Introduction to Design Processes 10
4802 -- -- -- -- -- -- 0% --Introduction to Engineering Design non PLTW 13
5380 -- -- -- -- -- -- -- --Introduction to Fashion and Textiles 45
Page 12 of 231/22/2018 7:52:23 AM
* Enrollment counts are for all students for the report year, and only give a guide to the enrollment levels as they relate to the Federal Indicators. (They do not represent the denominators used in each of the Federal Indicators.)

2016-2017 CTE DASHBOARD REPORT : DISTRICT 35INDIANA DEPARTMENT OF EDUCATION
2016-2017 Final Student Indicator Results by Program
1S1Academic
AchievementNew-Lang
Arts
1S2Academic
AchievementNew-Math
2S1Technical
SkillsAttainment
3S1Completion
4S1Graduation
(NCLB)
5S1 Post Graduate
Follow Up(All/EDU/EMP)
6S1Non-Trad
Participation
6S2Non-Trad
Completion
DOECode
NumberDOE Code Name Enrolled *
NORTHVIEW HIGH SCHOOL
4784 -- -- -- -- -- -- -- --Introduction to Manufacturing 44
4798 -- -- -- -- -- -- -- --Introduction to Transportation 42
5342 -- -- -- -- -- -- -- --Nutrition and Wellness 101
5394 -- -- -- -- -- -- -- --Preparing for College and Careers 98
4562 100% 100% 100% 100% 100% -- 53.85% --Principles of Business Management 14
5975 -- -- -- -- -- -- -- --Work Based Learning Capstone, Advanced 1
5260 -- -- -- -- -- -- -- --Work Based Learning Capstone, Business and 3
5480 -- -- -- -- -- -- -- --Work Based Learning Capstone, Family and 2
5207 -- -- -- -- -- -- -- --Work Based Learning Capstone, Health Science 11
5974 -- -- -- -- -- -- -- --Work Based Learning Capstone, Multiple Pathways 16
5892 -- -- -- -- -- -- -- --Work Based Learning Capstone, Trade and Industry 1
OTTER CREEK MIDDLE SCHOOL
5394 -- -- -- -- -- -- -- --Preparing for College and Careers 94
SARAH SCOTT MIDDLE SCHOOL
5394 -- -- -- -- -- -- -- --Preparing for College and Careers 49
TERRE HAUTE NORTH VIGO HS
5268 100% 100% 85.71% 100% 100% 76.92% 42.86% 28.57%Administrative and Office Management 16
5330 -- -- -- -- -- -- -- --Adult Roles and Responsibilities 46
Page 13 of 231/22/2018 7:52:23 AM
* Enrollment counts are for all students for the report year, and only give a guide to the enrollment levels as they relate to the Federal Indicators. (They do not represent the denominators used in each of the Federal Indicators.)

2016-2017 CTE DASHBOARD REPORT : DISTRICT 35INDIANA DEPARTMENT OF EDUCATION
2016-2017 Final Student Indicator Results by Program
1S1Academic
AchievementNew-Lang
Arts
1S2Academic
AchievementNew-Math
2S1Technical
SkillsAttainment
3S1Completion
4S1Graduation
(NCLB)
5S1 Post Graduate
Follow Up(All/EDU/EMP)
6S1Non-Trad
Participation
6S2Non-Trad
Completion
DOECode
NumberDOE Code Name Enrolled *
TERRE HAUTE NORTH VIGO HS
5360 -- -- -- -- -- -- -- --Advanced Child Development 77
5276 100% 100% 100% 100% 100% 60% -- --Anatomy & Physiology 113
5514 83.33% 100% 100% 100% 100% 66.67% 5% 0%Automotive Collision Repair I 77
5544 50% 100% 100% 100% 80% 50% 0% 0%Automotive Collision Repair II 15
5510 50% 100% 100% 100% 100% 50% 15.38% 25%Automotive Services Technology I 83
5546 85.71% 100% 85.71% 100% 100% 100% 11.11% 14.29%Automotive Services Technology II 11
5258 -- -- -- -- -- -- 22.22% 0%Banking and Investment Capstone 11
5593 -- -- -- -- -- -- 0% --Building & Facilities Maintenance I 9
5362 100% 100% 100% 100% 100% 100% -- --Child Development 86
4820 100% 100% 100% 100% 100% 66.67% 10% 12.50%Civil Engineering and Architecture PLTW 10
4801 -- -- -- -- -- -- -- --Computer Science I 38
5236 -- -- -- -- -- -- -- --Computer Science II: Programming 7
5230 -- -- -- -- -- -- -- --Computer Tech Support 16
5440 50% 83.33% 100% 100% 100% 60% -- --Culinary Arts and Hospitality I 129
5458 -- -- -- -- -- -- 26.67% --Culinary Arts and Hospitality II: Hospitality 18
5412 100% 100% 100% 100% 100% 50% 0% 0%Early Childhood Education I 27
5406 66.67% 88.89% 100% 100% 100% 60% 0% 0%Early Childhood Education II 7
5408 100% 100% 100% 100% 100% 33.33% -- --Education Professions I 2
5404 100% 100% 100% 100% 100% 33.33% -- --Education Professions II 2
Page 14 of 231/22/2018 7:52:23 AM
* Enrollment counts are for all students for the report year, and only give a guide to the enrollment levels as they relate to the Federal Indicators. (They do not represent the denominators used in each of the Federal Indicators.)

2016-2017 CTE DASHBOARD REPORT : DISTRICT 35INDIANA DEPARTMENT OF EDUCATION
2016-2017 Final Student Indicator Results by Program
1S1Academic
AchievementNew-Lang
Arts
1S2Academic
AchievementNew-Math
2S1Technical
SkillsAttainment
3S1Completion
4S1Graduation
(NCLB)
5S1 Post Graduate
Follow Up(All/EDU/EMP)
6S1Non-Trad
Participation
6S2Non-Trad
Completion
DOECode
NumberDOE Code Name Enrolled *
TERRE HAUTE NORTH VIGO HS
5684 60% 40% 80% 100% 100% 25% 4.92% 0%Electronics and Computer Technology I 70
5694 83.33% 100% 100% 100% 100% 60% 0% 0%Electronics and Computer Technology II 10
4828 -- -- -- -- -- 100% -- --Engineering Design and Development PLTW --
5966 100% 100% 100% 100% 100% -- 33.33% 0%Entrepreneurship and New Ventures Capstone 6
5420 -- -- -- -- -- -- -- --Fashion and Textile Careers I 18
5282 100% 80% 100% 100% 100% 60% 23.53% --Health Science Education I 55
5284 95.24% 90.48% 75% 100% 95.45% 67.21% 8.33% 12.50%Health Science Education II: Nursing 24
5286 83.33% 88.89% 82.35% 100% 100% -- 15% 17.65%Health Science II: Special Topics 20
5336 100% 100% 100% 100% 100% 60% -- --Human and Social Services I 75
5610 100% 100% 100% 100% 100% -- 15.15% 33.33%Industrial Automation and Robotics I 41
5232 100% 100% 100% 100% 100% 50% -- --Interactive Media 74
5364 -- -- -- -- -- -- -- --Interpersonal Relationships 30
4524 -- -- -- -- -- -- -- --Introduction to Accounting 82
4796 -- -- -- -- -- -- -- --Introduction to Advanced Manufacturing and Logistics 2
4790 -- -- -- -- -- -- -- --Introduction to Communication 14
4792 -- -- -- -- -- -- -- --Introduction to Construction 31
5438 -- -- -- -- -- -- -- --Introduction to Culinary Arts and Hospitality 119
4812 -- -- -- -- -- -- 6.67% --Introduction to Engineering Design PLTW 21
5380 -- -- -- -- -- -- -- --Introduction to Fashion and Textiles 31
Page 15 of 231/22/2018 7:52:23 AM
* Enrollment counts are for all students for the report year, and only give a guide to the enrollment levels as they relate to the Federal Indicators. (They do not represent the denominators used in each of the Federal Indicators.)

2016-2017 CTE DASHBOARD REPORT : DISTRICT 35INDIANA DEPARTMENT OF EDUCATION
2016-2017 Final Student Indicator Results by Program
1S1Academic
AchievementNew-Lang
Arts
1S2Academic
AchievementNew-Math
2S1Technical
SkillsAttainment
3S1Completion
4S1Graduation
(NCLB)
5S1 Post Graduate
Follow Up(All/EDU/EMP)
6S1Non-Trad
Participation
6S2Non-Trad
Completion
DOECode
NumberDOE Code Name Enrolled *
TERRE HAUTE NORTH VIGO HS
4798 -- -- -- -- -- -- -- --Introduction to Transportation 5
5234 100% 100% 100% 100% 100% 100% 0% --Networking I 3
5782 100% 100% 100% 100% 100% -- 6.06% --Precision Machining I 34
5784 100% 100% 100% 100% 100% 100% 0% --Precision Machining II 3
4562 -- -- -- -- -- -- 40.54% 100%Principles of Business Management 51
4814 -- -- -- -- -- -- 25% --Principles of Engineering PLTW 13
5914 100% 100% -- 100% 100% -- -- --Principles of Marketing 51
5986 80% 80% 0% 100% 100% 77.78% -- --Radio and Television I 92
5992 77.78% 88.89% 100% 100% 100% 100% -- --Radio and Television II 15
5984 -- -- -- -- -- -- -- --Sports and Entertainment Marketing 16
5918 100% 100% 50% 100% 100% 58.82% -- --Strategic Marketing 17
5601 -- -- -- -- -- 100% 20% --Supply Chain Management and Logistics 5
5776 100% 100% 100% 100% 60% 100% 5.17% 33.33%Welding Technology I 82
5778 62.50% 87.50% 100% 100% 100% 33.33% 9.09% 0%Welding Technology II 17
5260 83.33% 100% 100% 100% 100% 0% -- --Work Based Learning Capstone, Business and 17
5892 -- -- -- -- -- -- -- --Work Based Learning Capstone, Trade and Industry 1
TERRE HAUTE SOUTH VIGO HS
5268 -- -- -- -- -- 0% 0% --Administrative and Office Management 2
Page 16 of 231/22/2018 7:52:23 AM
* Enrollment counts are for all students for the report year, and only give a guide to the enrollment levels as they relate to the Federal Indicators. (They do not represent the denominators used in each of the Federal Indicators.)

2016-2017 CTE DASHBOARD REPORT : DISTRICT 35INDIANA DEPARTMENT OF EDUCATION
2016-2017 Final Student Indicator Results by Program
1S1Academic
AchievementNew-Lang
Arts
1S2Academic
AchievementNew-Math
2S1Technical
SkillsAttainment
3S1Completion
4S1Graduation
(NCLB)
5S1 Post Graduate
Follow Up(All/EDU/EMP)
6S1Non-Trad
Participation
6S2Non-Trad
Completion
DOECode
NumberDOE Code Name Enrolled *
TERRE HAUTE SOUTH VIGO HS
5330 -- -- -- -- -- -- -- --Adult Roles and Responsibilities 31
5608 -- -- -- -- -- -- 10% --Advanced Manufacturing I 14
5606 50% 100% 100% 100% 100% 100% 0% 0%Advanced Manufacturing II 4
5276 100% 100% 100% 100% 100% 66.67% -- --Anatomy & Physiology 63
5640 66.67% 66.67% 100% 100% 100% 75% 27.27% 22.22%Architectural Drafting and Design I 56
5652 60% 80% 100% 100% 83.33% 50% 15.38% 22.22%Architectural Drafting and Design II 16
5510 66.67% 66.67% 66.67% 100% 60% 60% 2.78% 0%Automotive Services Technology I 53
5546 75% 75% 75% 100% 100% 100% 20% 0%Automotive Services Technology II 5
5593 -- -- -- -- -- -- 20% --Building & Facilities Maintenance I 24
5362 -- -- -- -- -- -- -- --Child Development 137
4820 100% 100% 100% 100% 100% 0% 0% --Civil Engineering and Architecture PLTW 3
4810 100% 100% 100% 100% 100% -- -- --Computer Integrated Manufacturing PLTW --
4801 100% 100% -- 100% 100% -- -- --Computer Science I 69
5236 100% 100% -- 100% 100% 25% -- --Computer Science II: Programming 7
5580 75% 50% 100% 100% 50% 25% 6.67% 10%Construction Trades I 18
5578 75% 87.50% 100% 100% 88.89% 66.67% 12.50% 12.50%Construction Trades II 9
5440 100% 100% 100% 100% 66.67% -- -- --Culinary Arts and Hospitality I 52
5458 -- -- -- -- -- -- 50% --Culinary Arts and Hospitality II: Hospitality 2
5412 50% 0% 100% 100% 100% 100% 4.76% 0%Early Childhood Education I 43
Page 17 of 231/22/2018 7:52:23 AM
* Enrollment counts are for all students for the report year, and only give a guide to the enrollment levels as they relate to the Federal Indicators. (They do not represent the denominators used in each of the Federal Indicators.)

2016-2017 CTE DASHBOARD REPORT : DISTRICT 35INDIANA DEPARTMENT OF EDUCATION
2016-2017 Final Student Indicator Results by Program
1S1Academic
AchievementNew-Lang
Arts
1S2Academic
AchievementNew-Math
2S1Technical
SkillsAttainment
3S1Completion
4S1Graduation
(NCLB)
5S1 Post Graduate
Follow Up(All/EDU/EMP)
6S1Non-Trad
Participation
6S2Non-Trad
Completion
DOECode
NumberDOE Code Name Enrolled *
TERRE HAUTE SOUTH VIGO HS
5406 100% 75% 100% 100% 100% 0% 0% 0%Early Childhood Education II 5
5408 100% 100% 100% 100% 100% 100% -- --Education Professions I 12
5404 100% 100% 100% 100% 100% 75% -- --Education Professions II 3
5684 66.67% 66.67% 100% 100% 100% 33.33% 3.70% 0%Electronics and Computer Technology I 68
5694 66.67% 100% 100% 100% 75% 50% 0% 0%Electronics and Computer Technology II 9
5210 100% 100% 25% 100% 100% -- -- --Emergency Medical Services 10
4828 100% 100% 100% 100% 100% 75% 0% 0%Engineering Design and Development PLTW 2
5966 -- -- -- -- -- -- 50% --Entrepreneurship and New Ventures Capstone 2
5420 -- -- -- -- -- -- -- --Fashion and Textile Careers I 11
5550 100% 100% 100% 100% 100% 50% -- --Graphic Design and Layout 33
5572 100% 100% 100% 100% 100% 100% 0% 0%Graphic Imaging Technology 2
5282 100% 100% 100% 100% 100% 80% 10.26% 0%Health Science Education I 39
5336 83.33% 100% -- 100% 100% 60% -- --Human and Social Services I 63
5366 -- -- -- -- -- -- -- --Human Development and Wellness 77
5612 -- -- -- -- -- -- 50% --Industiral Automation and Robotics II 2
5610 -- -- -- -- -- -- 13.51% --Industrial Automation and Robotics I 41
5232 100% 100% -- 100% 100% -- -- --Interactive Media 19
5364 -- -- -- -- -- -- -- --Interpersonal Relationships 107
4796 -- -- -- -- -- 0% -- --Introduction to Advanced Manufacturing and Logistics 18
Page 18 of 231/22/2018 7:52:23 AM
* Enrollment counts are for all students for the report year, and only give a guide to the enrollment levels as they relate to the Federal Indicators. (They do not represent the denominators used in each of the Federal Indicators.)

2016-2017 CTE DASHBOARD REPORT : DISTRICT 35INDIANA DEPARTMENT OF EDUCATION
2016-2017 Final Student Indicator Results by Program
1S1Academic
AchievementNew-Lang
Arts
1S2Academic
AchievementNew-Math
2S1Technical
SkillsAttainment
3S1Completion
4S1Graduation
(NCLB)
5S1 Post Graduate
Follow Up(All/EDU/EMP)
6S1Non-Trad
Participation
6S2Non-Trad
Completion
DOECode
NumberDOE Code Name Enrolled *
TERRE HAUTE SOUTH VIGO HS
4792 -- -- -- -- -- -- -- --Introduction to Construction 27
5438 -- -- -- -- -- -- -- --Introduction to Culinary Arts and Hospitality 89
4812 -- -- -- -- -- -- 9.52% 0%Introduction to Engineering Design PLTW 26
5380 -- -- -- -- -- -- -- --Introduction to Fashion and Textiles 20
5350 -- -- -- -- -- -- -- --Introduction to Housing and Interior Design 19
4836 -- -- 100% -- -- -- -- --Mechanical Drafting and Design I 40
4838 66.67% 100% 100% 100% 100% 100% -- --Mechanical Drafting and Design II 4
5962 -- -- -- -- -- -- -- --Merchandising 8
5782 100% 100% 100% 100% 100% 0% 8.06% 11.11%Precision Machining I 64
5784 50% 50% 100% 100% 100% 80% 0% 0%Precision Machining II 4
4562 -- -- -- -- -- -- 50% 100%Principles of Business Management 25
4814 -- -- -- -- -- -- 33.33% 0%Principles of Engineering PLTW 4
5914 -- -- -- -- -- -- -- --Principles of Marketing 65
5986 0% 0% -- 100% 100% 62.50% -- --Radio and Television I 38
5992 100% 100% 100% 100% 100% 100% -- --Radio and Television II 3
5984 -- -- -- -- -- -- -- --Sports and Entertainment Marketing 19
5918 100% 100% 100% 100% 100% 100% -- --Strategic Marketing 26
5776 100% 100% 100% 100% 100% 37.50% 7.35% 0%Welding Technology I 93
5778 83.33% 83.33% 100% 100% 100% 50% 0% 0%Welding Technology II 9
Page 19 of 231/22/2018 7:52:23 AM
* Enrollment counts are for all students for the report year, and only give a guide to the enrollment levels as they relate to the Federal Indicators. (They do not represent the denominators used in each of the Federal Indicators.)

2016-2017 CTE DASHBOARD REPORT : DISTRICT 35INDIANA DEPARTMENT OF EDUCATION
2016-2017 Final Student Indicator Results by Program
1S1Academic
AchievementNew-Lang
Arts
1S2Academic
AchievementNew-Math
2S1Technical
SkillsAttainment
3S1Completion
4S1Graduation
(NCLB)
5S1 Post Graduate
Follow Up(All/EDU/EMP)
6S1Non-Trad
Participation
6S2Non-Trad
Completion
DOECode
NumberDOE Code Name Enrolled *
TERRE HAUTE SOUTH VIGO HS
5260 -- -- -- -- -- -- -- --Work Based Learning Capstone, Business and 3
5480 -- -- -- -- -- -- -- --Work Based Learning Capstone, Family and 2
5892 -- -- -- -- -- -- -- --Work Based Learning Capstone, Trade and Industry 1
WEST VIGO HIGH SCHOOL
5330 -- -- -- -- -- -- -- --Adult Roles and Responsibilities 25
5360 -- -- -- -- -- -- -- --Advanced Child Development 30
5608 -- -- -- -- -- 100% 20% --Advanced Manufacturing I 16
5340 -- -- -- -- -- -- -- --Advanced Nutrition and Wellness 27
5276 -- -- -- -- -- 60% -- --Anatomy & Physiology 33
5510 0% 0% -- 100% 0% 0% 26% --Automotive Services Technology I 90
5546 50% 50% 100% 100% 50% 0% 0% --Automotive Services Technology II 7
5362 -- -- -- -- -- -- -- --Child Development 64
5230 -- -- -- -- -- -- -- --Computer Tech Support 16
5412 100% 100% 100% 100% 100% 20% 0% 0%Early Childhood Education I 37
5406 100% 100% 100% 100% 100% 66.67% 0% 0%Early Childhood Education II 13
5408 -- -- -- -- -- -- -- --Education Professions I 6
5550 50% 100% 100% 100% 100% -- -- --Graphic Design and Layout 67
5572 100% 80% 100% 100% 83.33% 50% 53.19% 100%Graphic Imaging Technology 58
Page 20 of 231/22/2018 7:52:23 AM
* Enrollment counts are for all students for the report year, and only give a guide to the enrollment levels as they relate to the Federal Indicators. (They do not represent the denominators used in each of the Federal Indicators.)
2016-2017 CTE DASHBOARD REPORT : DISTRICT 35INDIANA DEPARTMENT OF EDUCATION
2016-2017 Final Student Indicator Results by Program
1S1Academic
AchievementNew-Lang
Arts
1S2Academic
AchievementNew-Math
2S1Technical
SkillsAttainment
3S1Completion
4S1Graduation
(NCLB)
5S1 Post Graduate
Follow Up(All/EDU/EMP)
6S1Non-Trad
Participation
6S2Non-Trad
Completion
DOECode
NumberDOE Code Name Enrolled *
WEST VIGO HIGH SCHOOL
5282 100% 100% 100% 100% 100% -- 27.27% 0%Health Science Education I 35
5610 -- -- -- -- -- -- 7.14% --Industrial Automation and Robotics I 16
5232 100% 100% 100% 100% 100% -- -- --Interactive Media 63
4796 -- -- -- -- -- -- -- --Introduction to Advanced Manufacturing and Logistics 38
4792 -- -- -- -- -- -- -- --Introduction to Construction 45
5234 100% 100% -- 100% 100% 33.33% 0% --Networking I 1
5782 100% 100% 100% 50% 100% 66.67% 4.35% 0%Precision Machining I 76
5784 33.33% 66.67% 66.67% 100% 100% 75% 0% 0%Precision Machining II 9
4562 -- -- -- -- -- -- 45.45% --Principles of Business Management 39
5260 -- -- -- -- -- -- -- --Work Based Learning Capstone, Business and 1
WEST VIGO MIDDLE SCHOOL
5394 -- -- -- -- -- -- -- --Preparing for College and Careers 43
WOODROW WILSON MIDDLE SCHOOL
5394 -- -- -- -- -- -- -- --Preparing for College and Careers 112
Page 21 of 231/22/2018 7:52:23 AM
* Enrollment counts are for all students for the report year, and only give a guide to the enrollment levels as they relate to the Federal Indicators. (They do not represent the denominators used in each of the Federal Indicators.)

2016-2017 CTE DASHBOARD REPORT : DISTRICT 35INDIANA DEPARTMENT OF EDUCATION
District Ranking by Indicator
5S1 Post
GraduateFollow Up
6S1Non-Trad
Participation
6S2Non-Trad
Completion
StateRank
1S1Academic
AchievementNew-Lang
Arts
1S2Academic
AchievementNew-Math
2S1Technical
SkillsAttainment
3S1Completion
4S1Graduation(NCLB) (*)
49 368 20 26 6 30 4137
Technical Skills Assessment Results by Assessment Type
Dual Credit AssessmentIndiana State Certified Nursing Assistant (CNA)National Healthcare Foundation Skills Assessment (NCHSE)Home Builders Institute Basic CarpentryNational Institute for Metalworking Skills (NIMS)-Level 1Home Builders Institute Basic Principles of ConstructionNational Institute For Metalworking Skills, Inc. (NIMS) CertificationASE Certification- BrakesCulinary Arts Pre-PacASE Certification-Automotive Service Excellence
2016-2017
120
100
80
60
40
20
0
97.55
78.2681.25 80 80
66.67
100
50
100
0
Page 22 of 231/22/2018 7:52:23 AM

2016-2017 CTE DASHBOARD REPORT : DISTRICT 35INDIANA DEPARTMENT OF EDUCATION
Placement By School
EmployedPost
SecondaryNot PlacedSchool Code School DOD
DOD +Employed
DOD + PostSecondary
Employed +Post
Secondary
DOD +Employed +
Post Sec-- --BOOKER T WASHINGTON ALTERNATIVE HIGH SCHOOL -- --8611 -- -- 100.00% --
-- 50.00%CLAY CITY JR-SR HIGH SCHOOL -- 50.00%0897 -- -- -- --
-- 50.00%MCLEAN HIGH SCHOOL -- --8612 -- -- 50.00% --
9.84% 60.66%NORTHVIEW HIGH SCHOOL -- 14.75%0933 -- -- 14.75% --
30.90% 34.83%TERRE HAUTE NORTH VIGO HS -- 10.11%8441 -- -- 24.16% --
25.00% 39.81%TERRE HAUTE SOUTH VIGO HS -- 13.89%8457 -- -- 21.30% --
20.00% 50.00%WEST VIGO HIGH SCHOOL -- 10.00%8453 -- -- 20.00% --
DOD - --
Employed - 12.24%
Post Secondary - 24.48%
DOD + Employed - --DOD + PostSec - --
Empl. + PostSec - 21.61%
DOD+Emp.+PS - --
Not Placed - 41.67%
Placement Results
Page 23 of 231/22/2018 7:52:23 AM