state of arkansas assessment coordination … · · 2018-03-28the review includes the valuation...
TRANSCRIPT

STATE OF ARKANSAS
ASSESSMENT COORDINATION DEPARTMENT
900 WEST CAPITOL AVENUE
SUITE 320
LITTLE ROCK, ARKANSAS 72201-1815
PHONE (501) 324-9240
FAX (501) 324-9242
Bear Chaney Director
March 28, 2018
RE: Review of Arkansas’ Valuation of Minerals for Property Tax Purposes
In mid-2017, the Arkansas Assessment Coordination Department (ACD) contracted with
Resource Technologies Corporation (RTC), a nationally-recognized minerals valuation
consultant, to review the valuation of minerals and related equipment for property tax
purposes in Arkansas. The review includes the valuation of oil, natural gas and “hard”
minerals such as sand, gravel, stone and coal.
The engagement includes both RTC’s review of Arkansas’ current procedures and
methodologies utilized to value minerals and related equipment as well as RTC’s
recommendations for improving and/or changing the current valuation procedures and
methodologies. RTC’s review and recommendations will be presented in two phases:
(1) oil and natural gas; and (2) sand, gravel, stone, coal and other hard minerals.
RTC has provided to ACD the review and recommendations report addressing the valuation of oil and natural gas and related equipment. The report, “Report and Evaluation of Arkansas Mineral Valuation Methods Oil & Gas part”, is available on the ACD website at http://www.arkansas.gov/acd/pdfs/report-evaluation-arkansas-mineral-valuation-methods-oil.pdf. In the near future ACD will schedule and communicate the time and location for a public
meeting during which RTC will discuss their review and recommendations and answer
questions concerning the report. Please keep in mind that no discussions have been
had and no decisions have been made regarding the recommendations.
Please contact ACD if you have any questions.

Recommendations for Improvementof Arkansas’
Oil and Gas Assessed Valuations
Professional Services Contract #4600040158
Prepared For:
Bear Chaney, DirectorArkansas Assessment Coordination Department1614 West Third StreetLittle Rock, Arkansas 72201
Prepared By:
Jeffrey R. Kern, ASA, CMA, MRICSCertified General Appraiser (AR) CG-3341
David FalkensternProfessional Geologist
Resource Technologies CorporationPost Office Box 242State College, Pennsylvania 16804
Report Date: March 13, 2018

Resource Technologies Corporation www.resourcetec.com
TABLE OF CONTENTS
1.0 INTRODUCTION. . . . . . . . . . . . . . . . . . . . . . . . . . . . . . . . . . . . . . . . . . . . . . . . . . . 1
2.0 SUMMARY OF OIL AND GAS WELL VALUATION . . . . . . . . . . . . . . . . . . . . . . . . 22.1 Oil and Gas Taxes in the U.S.. . . . . . . . . . . . . . . . . . . . . . . . . . . . . . . . . . . . 72.2 Common Methodologies . . . . . . . . . . . . . . . . . . . . . . . . . . . . . . . . . . . . . . . . 72.3 Improvements to Arkansas Methodology. . . . . . . . . . . . . . . . . . . . . . . . . . . 10
3.0 DIVISION ORDERS. . . . . . . . . . . . . . . . . . . . . . . . . . . . . . . . . . . . . . . . . . . . . . . . 113.1 Oil and Gas Leasehold Interest . . . . . . . . . . . . . . . . . . . . . . . . . . . . . . . . . . 11
4.0 AD VALOREM VALUATION OF GAS WELLS. . . . . . . . . . . . . . . . . . . . . . . . . . . 134.1 Valuation Approach . . . . . . . . . . . . . . . . . . . . . . . . . . . . . . . . . . . . . . . . . . . 134.2 Income Stream Length . . . . . . . . . . . . . . . . . . . . . . . . . . . . . . . . . . . . . . . . 154.3 Gas Pricing . . . . . . . . . . . . . . . . . . . . . . . . . . . . . . . . . . . . . . . . . . . . . . . . . 164.4 Decline Factor . . . . . . . . . . . . . . . . . . . . . . . . . . . . . . . . . . . . . . . . . . . . . . . 164.5 Expenses. . . . . . . . . . . . . . . . . . . . . . . . . . . . . . . . . . . . . . . . . . . . . . . . . . . 174.6 Impact on Gas Well Valuation . . . . . . . . . . . . . . . . . . . . . . . . . . . . . . . . . . . 18
5.0 AD VALOREM VALUATION OF OIL WELLS. . . . . . . . . . . . . . . . . . . . . . . . . . . . 205.1 Oil Pricing . . . . . . . . . . . . . . . . . . . . . . . . . . . . . . . . . . . . . . . . . . . . . . . . . . 205.2 Oil Decline Factor . . . . . . . . . . . . . . . . . . . . . . . . . . . . . . . . . . . . . . . . . . . . 215.3 Impact on Oil Well Valuation . . . . . . . . . . . . . . . . . . . . . . . . . . . . . . . . . . . . 22
6.0 BUSINESS EQUIPMENT USED IN THE PRODUCTION OF MINERALS . . . . . 246.1 Minimum Equipment Value . . . . . . . . . . . . . . . . . . . . . . . . . . . . . . . . . . . . . 25
Appendix A-1: Development of Oil and Gas Discount Rate . . . . . . . . . . . . . . . . . . . . . . . 34

Resource Technologies Corporation www.resourcetec.com
1.0 INTRODUCTION
Resource Technologies Corporation (RTC) was engaged by the Arkansas AssessmentCoordination Department (ACD) to review the procedures that the state uses to developproperty tax values for active minerals, specifically oil and gas wells. RTC’s recommendationconcerning the assessment of active wells in the State of Arkansas follows.
Tax assessment in Arkansas is conducted at the County level. The ACD publishesannual recommendations (in methods and values) to the counties. In general, the system usedis based on the income approach to value, wherein the taxable value of a mineral is based onthe estimated present worth of an expected future income stream. The Counties assessroyalty, working, and operator ownership interests. This procedure, in one form or another, isused by other states, oil and natural gas companies, and banks and is the basis of most textsconcerning the valuation of mineral deposits. Therefore, RTC is not recommending awholesale change in procedure but an improvement of the existing system in line with currentstaffing levels at the state and County assessment offices.
The income approach is intended to be market responsive, based on current prices,costs, up-to-date financial information, and contemporaneous production data. However, theArkansas system was developed over the past 30 years for various minerals and has not beensignificantly updated since its inception. For example, the system for oil and gas wasdeveloped in the 1980's and has not been updated since. The valuation of gas wells, however,only considers an income stream of one year. This needs to be improved to be more in linewith accepted present value methods.
The goal of the recommendations below is to make the system market responsive, fair,and equitable.
Should you have any questions, please contact me at your convenience.
Sincerely,
Jeffrey R. Kern, ASA, CMA, MRICSPresident, Senior Appraiser (AR #CG-3341)Resource Technologies Corporation
Recommendations for Improvement of Oil & Gas Assessed ValuationsMarch 13, 2018 Page 1 of 37

Resource Technologies Corporation www.resourcetec.com
Exhibit 2.0-1: Oil and Gas Shale Plays (EIA)
Exhibit 2.0-2: Natural Gas Production
2.0 SUMMARY OF OIL AND GAS WELL VALUATION
Oil and gas shale plays (see Exhibit 2.0-1) have revolutionized the energy industry overthe past 10 years. The amount of oil and gas produced has disrupted U.S. electricity marketsand global oil supplies. It has already led to a couple of oil and gas booms in a short period oftime. To put it simply, the U.S. has more natural gas than it knows what to do with.
The Fayetteville Shale, in north-central Arkansas, rapidly developedbetween years 2007-2010 but has seen adrop in production recently (see Exhibits2.0-2 and 2.0-3). Despite experiencefrom gas production in the Arkoma Basin,the rapid development in the FayettevilleShale led to stress on infrastructure,employment levels, and a steep learningcurve for area residents and Countyassessment offices about the oil and gasindustry.
Recommendations for Improvement of Oil & Gas Assessed ValuationsMarch 13, 2018 Page 2 of 37

Resource Technologies Corporation www.resourcetec.com
Exhibit 2.0-3: Gas Production (MMcf), Arkansas in Red (Texas scale on right)
Exhibit 2.0-4 shows the top five gas producers in Arkansas since 2014. Even thoughproduction has fallen every year, Southwest Energy dominates the Northern Arkansas gasmarket. Exhibit 2.0-5 shows the assessed values in Northern Arkansas since 2014.
Exhibit 2.0-4: Top 5 Gas Producers (Mcf - AOGC)
Operator 2014 2015 2016 % of overallTotal 2016
SEECO, LLC (Southwest Energy) 749,832,929 695,374,693 558,311,483 68.08%
XTO Energy, Inc. 156,570,116 138,762,901 116,416,724 14.19%
BHP Billiton Petroleum (Fayetteville), LLC 140,227,746 109,581,131 89,424,597 10.90%
Stephens Production Company 23,017,878 18,169,914 15,304,300 1.87%
Lime Rock Resources III-A, L.P. 13,422,693 12,164,932 11,411,040 1.39%
Exhibit 2.0-5: Northern Arkansas Assessed Values
County Name (Play) 2014 2015 2016
Van Buren (Fayetteville) $194,920,240 $165,093,370 $145,395,798
Cleburne (Fayetteville) $114,052,275 $129,559,750 $131,601,358
Conway (Fayetteville) $138,124,097 $132,171,539 $126,782,242
White (Fayetteville) $129,160,450 $113,285,540 $108,966,540
Faulkner (Fayetteville) $ 37,082,150 $ 37,538,180 $ 52,925,720
Sebastian (Fayetteville) $ 16,146,570 $ 15,628,990 $ 14,472,350
Recommendations for Improvement of Oil & Gas Assessed ValuationsMarch 13, 2018 Page 3 of 37
Resource Technologies Corporation www.resourcetec.com
Exhibit 2.0-5: Northern Arkansas Assessed Values
County Name (Play) 2014 2015 2016
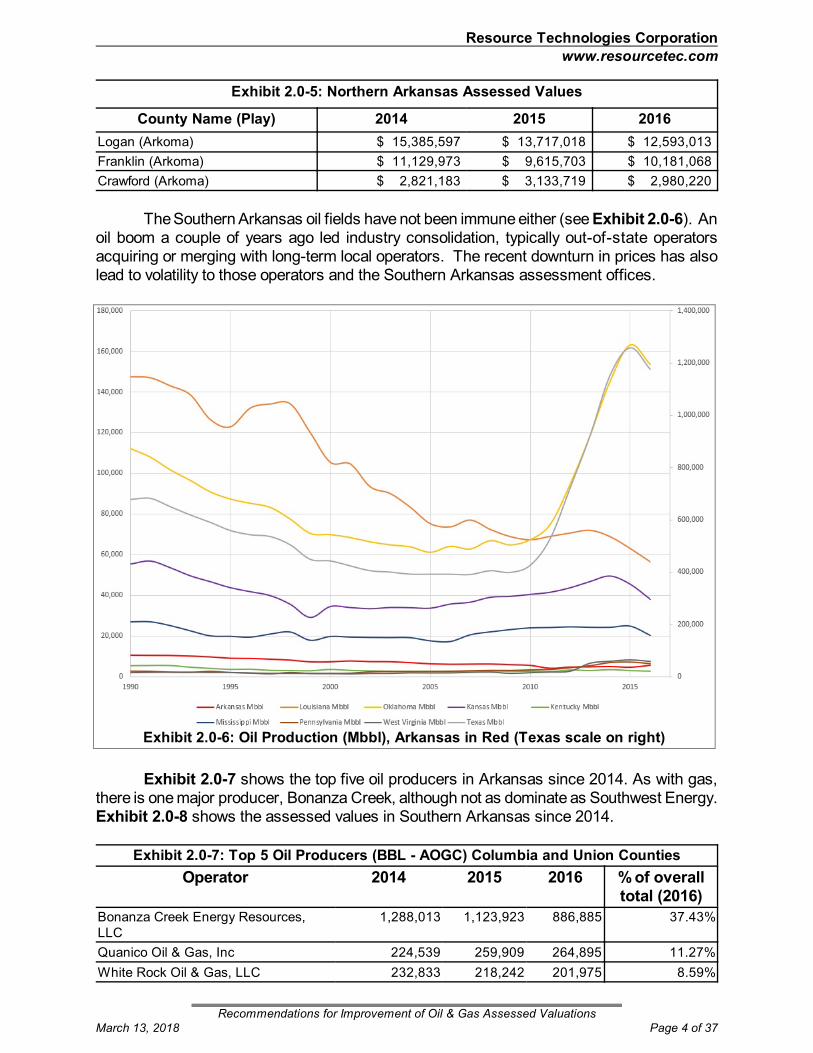
Exhibit 2.0-6: Oil Production (Mbbl), Arkansas in Red (Texas scale on right)
Logan (Arkoma) $ 15,385,597 $ 13,717,018 $ 12,593,013
Franklin (Arkoma) $ 11,129,973 $ 9,615,703 $ 10,181,068
Crawford (Arkoma) $ 2,821,183 $ 3,133,719 $ 2,980,220
The Southern Arkansas oil fields have not been immune either (see Exhibit 2.0-6). Anoil boom a couple of years ago led industry consolidation, typically out-of-state operatorsacquiring or merging with long-term local operators. The recent downturn in prices has alsolead to volatility to those operators and the Southern Arkansas assessment offices.
Exhibit 2.0-7 shows the top five oil producers in Arkansas since 2014. As with gas,there is one major producer, Bonanza Creek, although not as dominate as Southwest Energy. Exhibit 2.0-8 shows the assessed values in Southern Arkansas since 2014.
Exhibit 2.0-7: Top 5 Oil Producers (BBL - AOGC) Columbia and Union Counties
Operator 2014 2015 2016 % of overalltotal (2016)
Bonanza Creek Energy Resources,LLC
1,288,013 1,123,923 886,885 37.43%
Quanico Oil & Gas, Inc 224,539 259,909 264,895 11.27%
White Rock Oil & Gas, LLC 232,833 218,242 201,975 8.59%
Recommendations for Improvement of Oil & Gas Assessed ValuationsMarch 13, 2018 Page 4 of 37
Resource Technologies Corporation www.resourcetec.com
Exhibit 2.0-7: Top 5 Oil Producers (BBL - AOGC) Columbia and Union Counties
Operator 2014 2015 2016 % of overalltotal (2016)
Exhibit 2.0-9: ACD Yearly and Average Pricing
Petro-Chem Operating Company, Inc. 225,281 214,638 198,817 8.46%
Breitburn Operating, LP 91,547 137,714 86,523 3.68%
Exhibit 2.0-8: Southern Arkansas Assessed Value
County Name 2014 2015 2016
Columbia $ 78,016,230 $ 88,190,435 $ 62,254,800
Union $ 53,696,901 $ 58,523,535 $ 41,303,247
Ouachita $ 15,014,281 $ 19,589,701 $ 17,692,164
Lafayette $ 12,276,496 $ 13,098,904 $ 10,505,556
Miller $ 5,274,889 $ 5,809,858 $ 5,336,452
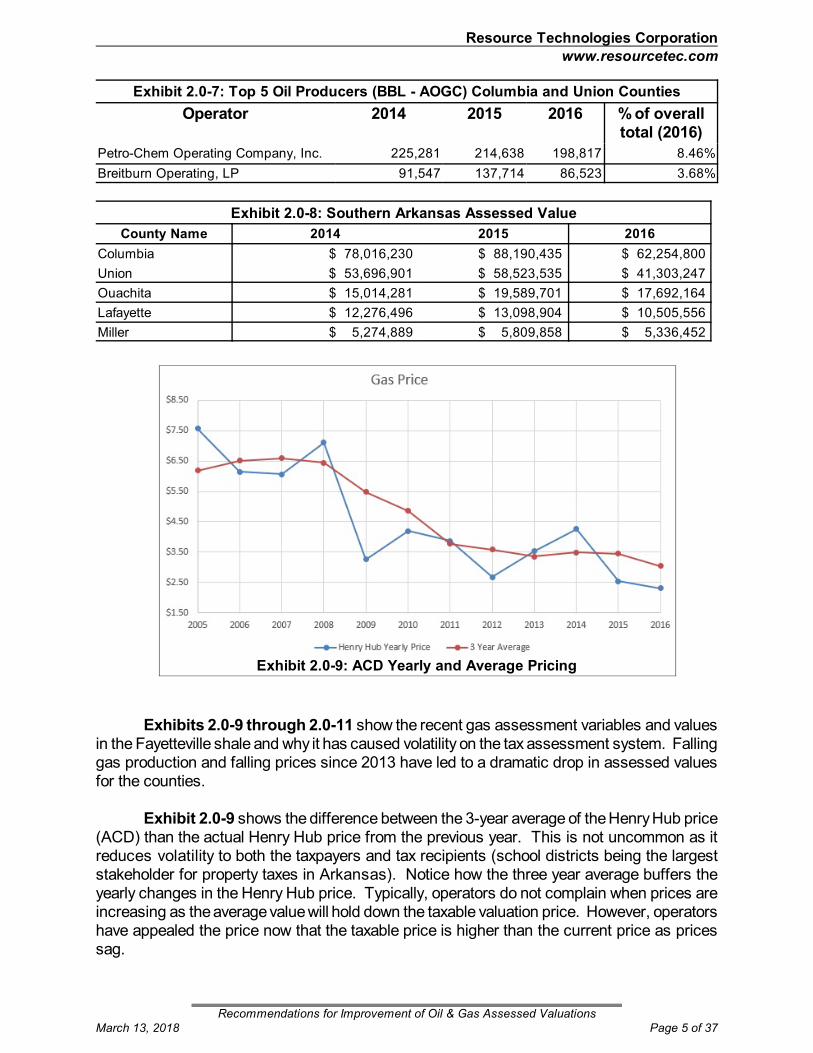
Exhibits 2.0-9 through 2.0-11 show the recent gas assessment variables and valuesin the Fayetteville shale and why it has caused volatility on the tax assessment system. Fallinggas production and falling prices since 2013 have led to a dramatic drop in assessed valuesfor the counties.
Exhibit 2.0-9 shows the difference between the 3-year average of the Henry Hub price(ACD) than the actual Henry Hub price from the previous year. This is not uncommon as itreduces volatility to both the taxpayers and tax recipients (school districts being the largeststakeholder for property taxes in Arkansas). Notice how the three year average buffers theyearly changes in the Henry Hub price. Typically, operators do not complain when prices areincreasing as the average value will hold down the taxable valuation price. However, operatorshave appealed the price now that the taxable price is higher than the current price as pricessag.
Recommendations for Improvement of Oil & Gas Assessed ValuationsMarch 13, 2018 Page 5 of 37

Resource Technologies Corporation www.resourcetec.com
Exhibit 2.0-10: Gas Production in the Fayetteville Shale
Exhibit 2.0-11: Assessed Value
Exhibit 2.0-10 is a graph of the production since 2013 showing declines in all the majorFayetteville Counties. In Exhibit 2.0-11, notice the drop in assessed values attributed to fallingproduction and falling prices. Additionally the entire state switched from a five-year cyclicalvaluation to an annual valuation. In Van Buren and White Counties, the dramatic drop inassessed values is compounded because they were at the end of the cycle. This means theybasically had a five year price correction in one year.
Recommendations for Improvement of Oil & Gas Assessed ValuationsMarch 13, 2018 Page 6 of 37

Resource Technologies Corporation www.resourcetec.com
2.1 Oil and Gas Taxes in the U.S.
Many states tax oil and gas either as a severance tax or property tax or both (seeExhibit 2.1-1). Severance taxes appear more common than ad valorem taxes but many statesdo assess property taxes to active oil and gas.
Exhibit 2.1-1: Summary of States’ Oil and Gas ValuationState Severance Ad Valorem
Alaska* depends on production equipment and flowlines
Arkansas 1-5% (depends on production) minerals and equipment
Idaho* 2.50% equipment and flowlines
Kentucky 4.5% minerals
Louisiana* 12.50% surface equipment
Montana* depends on production equipment and flowlines
North Dakota* 5.00% none
Oklahoma 7.00% equipment
Pennsylvania none none
Texas 7.5% Gas/4.6% Oil and Condensate minerals and equipment
Utah* 5.00% minerals and equipment
Virginia 1.00% minerals, equipment and flowlines
West Virginia 5.00% minerals
Wyoming* 6.00% GPT and equipment*2016 Oil and Gas Taxation Comparison for State of Idaho, Idaho Department of Lands (2017) Covenant ConsultingGroup
2.2 Common Methodologies
Exhibit 2.1-1, above, shows which states tax oil and gas. Below is a summary of howsome states do the actual calculation to value an oil and gas well for ad valorem tax purposes. All of the states use a variation of the income approach/discounted cash flow to value oil andgas wells. Factors considered are:
• Unit sale price of the oil/gas• Royalty rate (usually each owner’s interest is reported by operator)• Cost to produce• Projected annual production• Projected number of years of production• Year when the production will begin (most states don’t use the approach untilproduction has started)• Capitalization/discount rate.
! Arkansas:" Present Value of discounted cash flow
- Price: 3-year average- Production: as reported to AOGC- Discount Rate: 15%, not updated- Decline Rate: 0.70 for new oil wells; 0.80 for stripper wells; n/a for gas- Income Stream Length: Gas - 1 Year; Oil - 14 Years- Expenses: 13%.
Recommendations for Improvement of Oil & Gas Assessed ValuationsMarch 13, 2018 Page 7 of 37

Resource Technologies Corporation www.resourcetec.com
! Texas:" Present value of discounted cash flow (see Exhibit 2.2-1)
- Price: Current price, escalates moving forward in the income stream- Discount rate: Updated yearly by State Comptroller, 16.7% for 2016- Decline Rate: 0.80- Income Stream Length: Texas stops the income stream when expenses
are greater than income from well, usually 7-8 years in examples- Expenses: As reported by operator, escalates with time.
! West Virginia" Yield Capitalization Method
- Price: 3-year weighted average of each well’s net receipts reported tostate
- Production: 3-year weighted average of each well’s net receipts reportedto state
- Discount Rate: Updated yearly, 15.8% for 2018- Decline Rate: Calculated for each formation, updated every 5 years (see
Exhibit 2.2-2)- Income Stream Length: Capitalized- Expenses: Published yearly, updated every 5 years (see Exhibit 2.2-3)- Value includes equipment.
Exhibit 2.2-1: Texas Cash Flow Example
Recommendations for Improvement of Oil & Gas Assessed ValuationsMarch 13, 2018 Page 8 of 37

Resource Technologies Corporation www.resourcetec.com
Exhibit 2.2-3: WV Oil and Gas Expenses
Exhibit 2.2-2: WV Decline Rate
! Kentucky" Present value of discounted cash flow
- Price: Each well’s net receipts reported to state - Production: Each well’s net receipts reported to state - Discount Rate: 15.35%, to be updated yearly- Decline Factor: 0.96 - to represent a well’s decline in database
calculations, current production is multiplied by 0.96 to estimate next
Recommendations for Improvement of Oil & Gas Assessed ValuationsMarch 13, 2018 Page 9 of 37

Resource Technologies Corporation www.resourcetec.com
year’s production. The process is repeated 12 times for the length of theincome stream.
- Income Stream Length:12 years- Expenses: 35% for gas, 45% for gas net income valued.- Capped at $20,000
2.3 Improvements to Arkansas Methodology
RTC has identified the following areas that can be improved and maintained by thestate and individual counties that will lead to a more accurate and equitable mass appraisal:
• Division Orders• Valuation of Gas Wells• Valuation of Oil Wells• Oil and Gas Equipment Valuation.
Our research shows that minor changes to the current system can make theassessment market responsive and adhere to accepted valuation procedures but still operatewithin the given reporting, staffing, and database procedures. This allows for an accurateassessment of each ownership interest in the well but also allows for collection of data that isalready familiar to County staff and computer systems.
Recommendations for Improvement of Oil & Gas Assessed ValuationsMarch 13, 2018 Page 10 of 37

Resource Technologies Corporation www.resourcetec.com
3.0 DIVISION ORDERS
Problems Late arriving division orders
An inordinate amount of County time typing division orders into CAMA systems
Yearly data entry of 100,000s division (partial ownership) orders
Solutions Notes
Discontinue use of division orders. County would send100% of tax bill to well operator. Operator and ownerswould reconcile taxes depending on lease terms.
See below
If the above suggestion is not implemented, we suggest the following:
A statewide due date of April 1st to County assessors. If late, as a penalty, the well will be billed at 110% of theassessed value to the operator.
A requirement that data files are in a standard formatcompatible for direct digital import with CAMA systems.
State takes central control of oil and gas databases. Not recommended at this time if theabove recommendat ions areimplemented. Having the state takecontrol of the counties databasewould require significant effort of datatransfer back and forth.
3.1 Oil and Gas Leasehold Interest
The typical argument for maintaining division orders and sending tax bills to individualroyalty/working owners is that it maintains a record of ownership.
However, an oil or gas lease is not a traditional “lease” in the landlord/tenant sense1. Rather, it is a conveyance of real estate (the mineral rights estate), which when production isobtained (Arkansas only taxes producing wells) creates a fee simple determinable interest inthe lessee. The lessor’s reservation of a royalty under an oil and gas lease creates an estatein land and not a personal property interest. The royalty payment itself to the lessee, whetherin cash or in-kind, is personal property.
In other words, when the lessee (Operator) starts production they have created a newproperty estate which is taxable. The royalty payment to the lessor constitutes personalproperty. There is no attempt to “return” the property (gas) to the lessor after a period of rental- for all intents and purposes, an oil and gas lease, after production has started, is a sale.
Leases have been considered a method of transfer of ownership by industry,courts, and financial institutions. Minerals are frequently severed (sold) apart from the feeestate of land as a mineral estate. Leases are bought and sold and used for basis for
1 Informational Notice - Realty Transfer Tax and Person Income Tax 2012-04, Pennsylvania
Department of Revenue.
Recommendations for Improvement of Oil & Gas Assessed ValuationsMarch 13, 2018 Page 11 of 37

Resource Technologies Corporation www.resourcetec.com
mortgages. Case in point, Southwest Energy recently issued a press release indicating theyare “Actively pursue strategic alternatives for the Fayetteville Shale E&P and related midstreamgathering assets;”2. This is interpreted to mean that Southwest’s Fayetteville Shale assets areon the market to be sold, with major portion of the assets being leases held by SouthwestEnergy.
This has been the major tenant in coal, oil, and gas lease cases and the understandingin mortgages. That has been the finding of all the prior court decisions -- a mineral lease is thesale of the mineral because the lease allows for the total depletion of the asset. Some leasesmay have special conditions restricting or limiting but most allow for the total exhaustion of theasset - they are considered to be a sale. Arkansas case law is in agreement with this view3:
LEASEHOLD INTERESTSThe rule in Arkansas, prior to 1982, was that a leasehold interest (that interest held by a lessee)was in the nature of an easement. The Arkansas Supreme Court held in 1965 that an "oil and gaslease does not of itself constitute constructive severance of the two estates (surface and mineral),but conveys only an interest and easement in the land itself and no title passes until the oil andgas are reduced to possession." Garvan v. Kimsey, 239 Ark. 295, 297, 389 S.W.2d 870 (1965).Thus, the lessee has no title to the minerals until they are actually in his possession.
The Arkansas court seems to have abandoned the view that leases grant only an easement. InHillard v. Stephens, 276 Ark. 545, 637 S.W.2d 581 (1982), in discussing a gas lease the courtstated "The gas lease constitutes a present sale of all the gas in place at the time such lease isexecuted; and as the gas leaves the well head, the entire ownership thereof is in the lessee...."
Where the leasehold interest (working interest) in a common lease or mineral venture is owned bymultiple parties under a joint operating agreement, the designated operator has a "fiduciary duty"to the non-operators. Texas Oil & Gas Corporation v. Hawkins Oil & Gas, Inc., 282 Ark. 268, 668S.W.2d 16 (1984). A fiduciary is a person who undertakes to act in the interest of another person.As a fiduciary, the operator in an oil and gas prospect, has a duty of utmost fair dealing and goodfaith to the non-operators. The operator may not act selfishly or in his own.
ROYALTY INTERESTIn Arkansas, as elsewhere, a royalty interest is a right to a share of the mineral produced accruingto the owner of the royalty. The royalty interest before production is part of the land and, therefore,subject to conveyance but becomes personal property when produced. Shreveport-EI Dorado PipeLine Co. v. Bennett, 172 Ark. 804, 290 S.W. 929 (1927). The royalty owner typically has no rightto explore or develop minerals, or to execute leases. A conveyance reserving to the grantor theright to execute oil and gas leases and receive a bonus for execution generally creates anonparticipating royalty interest in the grantee. In most instruments, it is entitled "Non-ParticipatingRoyalty Deed."
This means, for all intents and purposes, the execution of gas lease is a sale. Arkansasdoes not tax non-producing mineral estates even if the are leased, so all taxes are based onproducing minerals. Therefore, we suggest removing the requirement to submit divisionorders. As the owner of the entire mineral estate, the tax burden is the producer’s soleresponsibility.
2 Southwestern Energy Announces Plans to Reposition Portfolio to Increase Shareholder Value;News Release, February 8, 2018.
3 The Arkansas Leasing Manual (2008) Charles A. Morgan, pg 8-9.
Recommendations for Improvement of Oil & Gas Assessed ValuationsMarch 13, 2018 Page 12 of 37

Resource Technologies Corporation www.resourcetec.com
4.0 AD VALOREM VALUATION OF GAS WELLS
Problems 3-year average pricing (2016 last available data for January 1, 2018 tax bills)
1-year income stream valuation (KY uses 12; WV uses 40; AR uses 14 forOil, TX uses economic life)
Expenses on a percentage basis
Suggestions Notes
Move to a present worth valuationwith multiple years of income
Currently: A one year income stream is used. Thethree-year average price (see below) is used to calculatevalue of one year of production. Production trendsdescribing future years of production beyond year 1 arenot accounted for.
Income Stream Length: 10 years 10 years is suggested as it represents a fair andequitable valuation method compatible with currentwellife.
Production: from AOGC Currently Used
Price: 3-year weighted average of theHenry Hub Spot price
ACD currently uses the straight average of the last threeyears. This method has been accepted in court. Moving to a weighted average will make the systemmore market responsive.
Deductions:$1 per MCF per well for expenses
Can be updated yearly - typical production costspublically reported by operators4
Decline Factor: 0.90 To be updated yearly (See Section 4.4)
Discount Rate: 14.96% To be updated yearly based on current economicfactors (Appendix A)
The discussion in the sections below explain how and why the recommended variableswere chosen. While it is recognized that not every well will fit the model, for a mass appraisalwith over 13,000 active wells, these values represent a realistic, fair, and equitable method toarrive at the assessed value for the entire state. As a mass appraisal, there is no intention ofproviding site or well-specific evaluations. Some wells may end before 10 years and some mayproduce profitably for more than 10 years. Similarly, some wells will have a greater declinefactor than 90% of the previous years’ production especially new wells allowed to flow at naturalformation properties. However, most wells’ production is influenced more by today’s currentgas market rather than geological properties.
4.1 Valuation Approach
Typically, three approaches – cost, market, and income – are available to estimate thevalue of any property. In one form or another, these approaches are based on the “principleof substitution”. That is, a purchaser of property would typically pay no more for one propertythan for another of similar utility.
4Southwestern Energy Company, Form 10-K, (2016) United States Securities and Exchange
Commission.
Recommendations for Improvement of Oil & Gas Assessed ValuationsMarch 13, 2018 Page 13 of 37

Resource Technologies Corporation www.resourcetec.com
Mineral properties, petroleum producing properties, mining operations, and relatedoperations, are purchased for the production of future income. Willing purchasers and buyersassess the income potential of the property before consummating a transfer of the property.It is the object of an appraisal to mimic or model the behavior of the marketplace.
An oil or gas well is an income producing addition to a property. A yearly income streamis generated in the future by the production and sale of oil/gas until the well isplugged/abandoned. The Income Approach to Valuation - capitalization or discounted cashflow of the net income that the well can produce is the appropriate method to value the well.
Calculating the value of a well by discounted cash flow is an accepted method and, inone form or another, is used by other states, oil and natural gas companies, and banks and isthe basis of most texts concerning the valuation of mineral deposits.
Nearly every text and treatise concerning appraisals recognizes that the existing use(active oil or gas property) may very well be the Highest and Best Use for a property – themarket determines the needs and desires that cause properties to be put to specific uses. These documents all recognize the income approach as a valid approach to the appraisal ofincome producing properties – most state that the comparative sales technique is the mostdifficult to apply to income properties. All of these texts state succinctly that: income producingproperties (as oil and gas wells and related operating facilities) must be appraised by theincome approach – as these properties serve only one purpose; the exploitation and depletionof the asset.
According to Stermole and Stermole in Economic Evaluation and Investment DecisionMethods5:
“Comparable sales often is a poor approach to valuation of natural resource properties. The valueof mineral, petroleum, and timber rights varies significantly with sizes of reserves, projected productprice at different future points in time related to production, and future salvage value of the assetsto name some of the significant parameters to be considered. Usually at least several of theseparameters differ significantly for different properties, making comparable sales a very poor approachto valuation of natural resource properties. Different size and quality of natural resource reservesaffects the timing and cost of production, which generally makes it imperative to go to discountedcash flow valuation of natural resource investments rather than trying to utilize the comparable salesapproach.”
The essential factors to be considered in the valuation of a working income stream arelisted below. The rates used to calculate the present value of the future cash flow arediscussed in the following sections.
! Projected number of years of production! Unit sale price of oil/gas! Projected annual production/decline rate! Cost to produce
5Stermole, Franklin J. and Stermole, John M., Economic Evaluation and Investment Decision
Making, Thirteenth Edition, Colorado School of Mines, Investment Evaluations Corporation, Golden, CO,2012.
Recommendations for Improvement of Oil & Gas Assessed ValuationsMarch 13, 2018 Page 14 of 37

Resource Technologies Corporation www.resourcetec.com
! Capitalization/discount rate.
4.2 Income Stream Length
It is well settled that a gas well should be valued considering multiple years ofdiscounted cash flow as a well will produce income until it is plugged. Traditionally, a gaswells’ life has been dictated by the natural decline of gas flow that the reservoir formation canachieve. However, RTC and ACD have separately determined that most wells’ production isinfluenced more by today’s current gas market rather than geological properties and flow islimited by the operator (See Section 4.4).
A review of the current active wells in Northern Arkansas (see Exhibits 4.2-1 and 4.2-2) shows a significant number of wells producing gas longer than the 10-year mark. Thenumbers drop after 2007 (10 years old) and significantly drop after 2002 (15 years old) but thisis probably more a reflection of when the Fayetteville shale wells were drilled rather than wellproductivity. For the mass appraisal of the state, we suggest an income stream length of 10years. It appears most wells produce for at least 10 years, and it is prudent to limit the incomestream rather than extending the predicted life to 30 or more years because some wells maybe closed sooner. Valuing wells to 10 years captures 75% of the value compared to 30 yearsat a 15% discount rate. A one-year income stream captures 13% of the total value.
Exhibit 4.2-1: Wells with Production in2016
Year Drilled Count
2001 57
2002 43
2003 264
2004 288
2005 269
2006 467
2007 636
2008 899
2009 992
2010 908
2011 906
2012 774
2013 625
2014 608
Exhibit 4.2-2: Wells Per Operator
OPERATOR Count
SEECO, Inc. (SWN) 3971
XTO Energy, Inc. 1874
BHP Billiton Petroleum(Fayetteville), LLC
954
Stephens Production Company 705
Forest Oil Corporation 482
Hanna Oil and Gas Company 210
Foundation Energy Management,LLC
210
Eagle Rock Mid-ContinentOperating, LLC
100
It must be noted that every state’s method to value wells (a decline rate to an end of life),assumes no new production will come on line to replace the production in wells that areclosing. That is, only currently active production is valued the overall income stream. Thismeans, after 10 years, the state is assumed to have no gas production - overall valuation isunderestimated. However, valuing wells that are yet to be drilled is probably not within the
Recommendations for Improvement of Oil & Gas Assessed ValuationsMarch 13, 2018 Page 15 of 37

Resource Technologies Corporation www.resourcetec.com
Exhibit 4.3-1: Henry Hub Spot Price
realm of ad valorem taxation. It is a trade off because on the other hand since it is recalculatedevery year all remaining wells are assumed to offer 10 years of remaining life which mayoverestimate the value of some individual wells.
4.3 Gas Pricing
While one year pricing makes the value more market responsive, it makes the value more volatile. The SEC requires publically traded oil and gas companies to report value andproven and probable reserves based on the average price from the previous year. However,as the oil and gas market has been volatile over the last 10 years (see Exhibit 4.3-1), yearlyswings up and down probably don’t represent the long-term value of the asset. Currently, ACDuses the average of the last three years Henry Hub average. We suggest using a three-yearweighed average of the Henry Hub spot price. This will make the assessed value more marketresponsive while retaining appropriate value for in-place gas reserves at active wells for taxingbodies (see Exhibit 4.3-2).
Exhibit 4.3-2: ACD Average Market Pricing (Tax Year 2017-2013)
Calendar Year Henry Hub AveragePrice
3 Year Average 3 Year Weighted Average(suggested)
2016 $2.31 $3.04 $2.71
2015 $2.54 $3.44 $3.28
2014 $4.26 $3.49 $3.75
2013 $3.53
2012 $2.67
4.4 Decline Factor
Throughout this report we refer to “Decline Factor”: this is the factor used to predict theyearly decline of an oil or gas well. The Decline Factor is multiplied by previous years’production to estimate next year’s production. Most state taxing authorities use this methodfor calculation purposes. This differs slightly from the development of a “Decline Rate/Curve”traditionally used by the industry where a harmonic or hyperbolic decline curve is fitted to the
Recommendations for Improvement of Oil & Gas Assessed ValuationsMarch 13, 2018 Page 16 of 37

Resource Technologies Corporation www.resourcetec.com
Exhibit 4.4-1: Most Common Decline Factor is 0.80-0.90
natural formation characteristics of the reservoir. For the mass appraisal of wells across anentire state, this difference is insignificant.
Additionally, as stated above we don’t believe wells are being produced to the formationproperties but rather production is restricted at the well head; Exhibit 4.4-1 shows a histogramof the Decline Factor for Northern Arkansas gas wells which shows this. The vast majority ofwells exhibit a decline factor of 0.80-0.90 with the weighted average (by production) at 0.96. For the valuation, RTC suggests using an annual decline factor of 0.90 (the equivalent ofdeclining by 10% or producing 10% less than the previous year for each year of operation).
4.5 Expenses
Southwest Energy, responsible for almost 70% of the Northern Arkansas gas market,is also the only publically listed U.S. company operating in the area. An examination ofproduction expenses from Southwest Energy’s publically available documents shows costsremained constant at less than $1/MCF even as other operational data changed significantly(see Exhibit 4.5-1).
Exhibit 4.5-1: Southwest Energy Data (2016 Annual Report - Fayetteville Shale)
Year RealizedPrice ($/MCF)
ProductionCosts ($/MCF)
Production(Bcfe)
Gross ProductionValue (1-Year)
Reserves (Bcfe - Total)
MarketCap
(Ycharts)
WellSpuds
2016 1.80 0.87 375 $348,750,000 2,997 $5.46B 4
2015 2.12 0.91 465 $562,650,000 3,281 $2.60B 155
2014 3.86 0.92 494 $1,452,360,000 5,069 $9.62B 465
Recommendations for Improvement of Oil & Gas Assessed ValuationsMarch 13, 2018 Page 17 of 37

Resource Technologies Corporation www.resourcetec.com
Typically, production costs include6:
“Production costs” Costs incurred to operate and maintain wells and related equipment and facilities,including depreciation and applicable operating costs of support equipment and facilities and othercosts of operating and maintaining those wells and related equipment and facilities. They becomepart of the cost of oil and gas produced. Examples of production costs (sometimes called liftingcosts) are (a) costs of labor to operate the wells and related equipment and facilities; (b) repairs andmaintenance; © materials, supplies, and fuel consumed and supplies utilized in operating the wellsand related equipment and facilities; (d) property taxes and insurance applicable to proved propertiesand wells and related equipment and facilities; and (e) severance taxes. Some support equipmentor facilities may serve two or more oil and gas producing activities and may also serve transportation,refining, and marketing activities. To the extent that the support equipment and facilities are usedin oil and gas producing activities, their depreciation and applicable operating costs becomeexploration, development or production costs, as appropriate. Depreciation, depletion, andamortization of capitalized acquisition, exploration, and development costs are not production costsbut also become part of the costs of oil and gas produced along with production (lifting) costsidentified above.
Oil and gas wells require a minimum cost to operate. Generally, this ranges from$20,000 and to $48,000 per year. Theoretically, wells producing less revenue than theminimum cost to operate are typically shut-in. For example, at $3.00/MCF, a well would haveto produce a least 7,000 MCF to be profitable. However, a review of well production inNorthern Arkansas show a full 14% of gas well are operating below this threshold. Therefore,we do not suggest that the State model the economic life of a well to closure, but rather havethe operator report when the well is closed, or no production for the year.
4.6 Impact on Gas Well Valuation
Exhibit 4.6-1 shows the predicted assessed value compared to the actual assessedvalue for the last three years. Notice that the suggested method has a higher value (due to amultiple year income stream) but is also more market responsive. The assessed value wouldhave been higher with higher prices and production in 2014 but would fall sharply in a decliningmarket in 2016.
6United States Securities and Exchange Commission, Form 10-K (2016), Bonanza Creek Energy,
Inc. Pg 14.
Recommendations for Improvement of Oil & Gas Assessed ValuationsMarch 13, 2018 Page 18 of 37

Resource Technologies Corporation www.resourcetec.com
Exhibit 4.6-1: Estimated Assessed Value
One other component to keep in mind is Arkansas Law puts a 10% cap on anyincreases to the assessed value of any real property. Increases in yearly production areaccounted for as they are considered new discoveries. However, because we suggest movingto a multi-year income stream to value gas properties rather than just one year, it is conceivablethat individual well values could increase significantly without any increases in production. Itwill be necessary to allow the new methodology to set the value without the cap (legislatively)or it may take multiple years for the new values to work their way into the system at 10% peryear.
Recommendations for Improvement of Oil & Gas Assessed ValuationsMarch 13, 2018 Page 19 of 37

Resource Technologies Corporation www.resourcetec.com
5.0 AD VALOREM VALUATION OF OIL WELLS
Problems Multiple arbitrary valuation break points based on production
Some confusion about at what age stripper wells begin
Solutions (same procedure as gas) Notes
Move to a continuous present valuation of aproducing income stream
Will eliminate multiple valuation break pointsdepending on the production of a well and willharmonize production in unitized fields. Actualproduction will be used rather than midpoints ofa production range.
Income Stream Length: 10 years Down from 14 to match gas
Production: from AOGC Currently used
Price: 3 year weighed average of Arkansasmarket price BBL
ACD currently tracks Arkansas market pricing
Deduction of ~ $8.00 per BBL per well forexpenses7
Current expenses are $10,000 + 10% of theworking income. Other deductions can betaken for water floods and enhanced recovery.
Decline Factor: 0.95% per year, per well To be updated yearly, see Exhibit 5.2-1 - switch to stripper well status not necessary.
Discount Rate: 14.96% To be updated yearly (see Appendix A).
Oil production in Southern Arkansas started in the 1920's and has been relatively steadyfor the last 30 years (see Exhibit 2.0-4). Exhibit 5.0-1 shows the most common operators inSouthern Arkansas. Bonanza Creek is a publically traded company and reported productioncosts around $8/BBL.
Exhibit 5.0-1: Most Common Operators in Southern Arkansas
Operator Well Count
Bonanza Creek Energy Resources, LLC 291
ArklaTx Operating Company, Inc 224
Langley, Jerry Oil Company LLC 160
LBOC, LLC 113
Webb Brothers Well Service, Inc. 109
McGowan Working Partners, Inc. 94
Four R Operating Company, LLC 90
Quantum Resources Management, LLC 77
5.1 Oil Pricing
The Southern Arkansas Fields experienced pricing over $80/bbl between 2011-2014which led to increased assessed values (see Exhibit 5.1-1). However, the oil price droppedfrom $82.73 to $39.81 from 2014 to 2015 leading to a significant reduction in assessed value
7United States Securities and Exchange Commission, Form 10-K, (2016) Bonanza Creek Energy,
pg 38.
Recommendations for Improvement of Oil & Gas Assessed ValuationsMarch 13, 2018 Page 20 of 37

Resource Technologies Corporation www.resourcetec.com
Exhibit 5.1-1: Southern Arkansas Assessed Value (Active Oil)
(see Exhibit 5.1-2). The 2016 assessed value to BBL was $70.70 (three-year average). Aswith the natural gas valuation, it is suggested to move to a three-year weighed average for theassessed price.
Exhibit 5.1-2: Oil Pricing
CalendarYear
AR Market 3 Year Average 3 Year Weighted Average(Suggested)
Bonanza CreekEnergy
2016 $33.89 $52.14 $44.00 $35.42
2015 $39.81 $70.70 $62.41 $40.98
2014 $82.73 $86.48 $85.74 $81.95
2013 $89.57
2012 $87.13
5.2 Oil Decline Factor
Exhibit 5.2-1 shows a histogram of decline factor in oil wells from Columbia and UnionCounties. The average decline factor was less volatile than currently used (0.70 or 0.80). Themode was actually 0.90-1.00, meaning year to year, most oil wells don’t produce that muchdifferent volume of oil. In fact, a significant number of wells produced more oil than the yearbefore indicating production is more market dependant than geologically determinative. Wesuggest using 0.95 for the decline factor of oil wells. The high number of wells in the 0.01range represent wells with active status wells that did not produce - they are not valued as thereis no production.
Recommendations for Improvement of Oil & Gas Assessed ValuationsMarch 13, 2018 Page 21 of 37

Resource Technologies Corporation www.resourcetec.com
Exhibit 5.2-1: Oil Decline Factor
Moving all wells to a 0.95 decline factor will also harmonize the value of pooled wells too. Currently, when multiple wells are pooled the overall value is less than if the wells were valuedindividually. This is because the current system varies the decline factor with production levelsrather than age of the well. Wells with production above 10 barrels per day have a declinefactor of 0.70 for the first few years. All other wells have a decline factor of 0.80. When thewells are pooled, the higher summed production leads to a 0.70 decline factor instead of 0.80.
5.3 Impact on Oil Well Valuation
Exhibits 5.3-1 and 5.3-2 show the assessed value and the suggested value based onthe new methodology. As with the gas methodology, the new values will be more marketresponsive with changing gas prices. Columbia is significantly higher in 2014 and is movingto the 0.90 decline rate in 2015 rather than having decline rates based on production (not wellage) that change through the income stream.
Recommendations for Improvement of Oil & Gas Assessed ValuationsMarch 13, 2018 Page 22 of 37

Resource Technologies Corporation www.resourcetec.com
Exhibit 5.3-1: Columbia County and Union CountyAssessed Values and Predicted Suggested Values
Exhibit 5.3-2: Assessed and Suggested/Predicted Values
County 14Production
15Production
16Production
14 Assessed
15 Assessed
16 Assessed
14 Predicted
15Predicted
16Predicted
Columbia 2,234,149 2,059,731 1,685,127 $78,016,230 $88,190,435 $62,254,800 $149,164,597 $96,245,337 $52,103,370
Union 715,750 714,521 664,592 $53,696,901 $58,523,535 $41,303,247 $47,787,574 $33,387,522 $20,548,886
Recommendations for Improvement of Oil & Gas Assessed ValuationsMarch 13, 2018 Page 23 of 37

Resource Technologies Corporation www.resourcetec.com
6.0 BUSINESS EQUIPMENT USED IN THE PRODUCTION OF MINERALS
In Arkansas, by law (Arkansas Statutes 26-3-201 and 26-26-903), everyperson/business is asked to self-report a list of personal property (cars, boats, etc.) and realproperty they own to be assessed. Similarly, businesses are asked to report the same asBusiness Personal Assessments. For oil and gas operations, the following, basically allequipment onsite up to the wellhead should be reported for assessment:
Personal Property:• Christmas trees, pump jacks, well components, line heaters, wellhead/
suction/vacuum compressors • separation and dehydration equipment • gathering lines and production lines• artificial lift equipment and their power sources• electrical power systems that are easily removed• compressors that are easily moveable and located in the field (between the
wellhead and booster stations)• everything inside the casing of a well including but not limited to, tubing, pipe,
pumps, rods, gas-lift equipment, and packers inside the casing• meters• machinery, equipment, and fixtures that are attached components of processing
or manufacturing facilities, items that are free standing or which are bolted downbut are readily removed without damage are tangible personal property (TPP)
• compressors at compressor stations other than leased compressors,
Real Property:• pump stations, booster stations • storage facilities – tanks, standing alone or in batteries• casing (in place)• enhanced production-injection and recovery systems which cannot be moved,
intact• vapor recovery systems• production platforms with supports permanently embedded in the sea bed • water disposal systems (same guidelines as storage facilities)• gathering lines that are totally underground except for road or water crossings,
etc.• underground storage facilities.
Another good source to see all possible oil and gas equipment is from the ArkansasDepartment of Finance and Administration8.
Generally, the distinction between personal and real property is how easily theequipment can be moved9. Personal property is taxed in Arkansas (cars, boats, etc), and oil
8 https://www.dfa.arkansas.gov/images/uploads/exciseTaxOffice/AllowableMarketingCosts.pdf
9Audit Procedures for Oil and Gas Well Servicing, Texas Comptroller of Public Accounts.
Recommendations for Improvement of Oil & Gas Assessed ValuationsMarch 13, 2018 Page 24 of 37

Resource Technologies Corporation www.resourcetec.com
and gas personal property should be as well. Real property that adds value to overall propertyshould be included in the ad valorem assessment of the whole parcel.
To assess the personal and real property equipment and fixtures assembled on an oiland gas site, ACD currently recommends County Assessors use Oklahoma’s BusinessPersonal Property Valuation Schedule for Petroleum. While the entire document is titled“personal property” some fixtures are better defined as real property (underground storagetanks, for example).
The Oklahoma document directly discusses storage tanks, piping, and compressors. It references other valuation sources (Hadco to value oil and gas production and explorationequipment10, Marshall and Swift for piping). These materials are competent andcomprehensive data sources and we see no reason to change this suggestion. Otherwise, theState/County would be spending time repeating their efforts while chasing the same sales dataon a yearly basis.
As discussed above, oil and gas operators should report all equipment (real or personal)up to the wellhead. Past the wellhead, ACD suggests $1 foot valuation for well casing. Wesee no reason that the well casing should be treated differently than other real property onsiteand should be listed by the operator to be taxed in accordance with 26-26-903. Casing isbetter suited to be valued as real property. Casing is mentioned in the Oklahoma documentfor Petroleum, but there is no value is listed. However, Marshal and Swift does address wellcasing (Section 14, Page 41). The average value for Oil and Gas wells is $130/per foot ofdepth.
6.1 Minimum Equipment Value
In the absence of a credible report from an operator verifying the equipment onsite, thecounty assessor should assign a value to the equipment that is known to be necessary for oiland gas production. Exhibit 6.1-1 shows a typical Fayetteville Shale gas pad; wellheads,flowlines, separators, storage tanks, and entrance into a regional network can all be seen. Thewell pad area is removed from the surface assessment but the value of the equipment shouldbe added back into the assessment. The value can be calculated as a function of the depthand number of wells on the lease. It should be noted, this does not include the cost to drill andcomplete the well on the equipment left in-place.
For simplicity and to encourage accurate reporting by operators, it is suggested thatassessors assign a value of least $1,000,000 per pad to model the value of the equipmentonsite. If the wells cannot be differentiated by pad, $1,000,000 per well is suggested.
10 http://www.hadcointernational.com/
Recommendations for Improvement of Oil & Gas Assessed ValuationsMarch 13, 2018 Page 25 of 37

Resource Technologies Corporation www.resourcetec.com
Exhibit 6.1-1: Typical Fayetteville Shale Gas Pad
The discussion below shows some of the research used to develop the estimatedequipment value. It is recognized that every well is different, and this value may be high forsome plays. However, this value is only to be used in the absence of a self-reported list onsiteby operators.
Source 1: OGOC, an Oil and Gas services company from Longview, TX, has an example ofwell drilling and completion on their website11. While every well is different, it is a good exampleof all the stages needed from drilling to completion to production onsite to produce oil and gasas well as the associated costs.
In this example, the well was 13,150 feet, cost $3.2 million to drill and complete, andcontains $982,250 worth of equipment onsite for production.
11 https://www.ogoc.com/documents/Example-1-H-AFE.pdf
Recommendations for Improvement of Oil & Gas Assessed ValuationsMarch 13, 2018 Page 26 of 37

Resource Technologies Corporation www.resourcetec.com
Recommendations for Improvement of Oil & Gas Assessed ValuationsMarch 13, 2018 Page 27 of 37

Resource Technologies Corporation www.resourcetec.com
Recommendations for Improvement of Oil & Gas Assessed ValuationsMarch 13, 2018 Page 28 of 37
Resource Technologies Corporation www.resourcetec.com
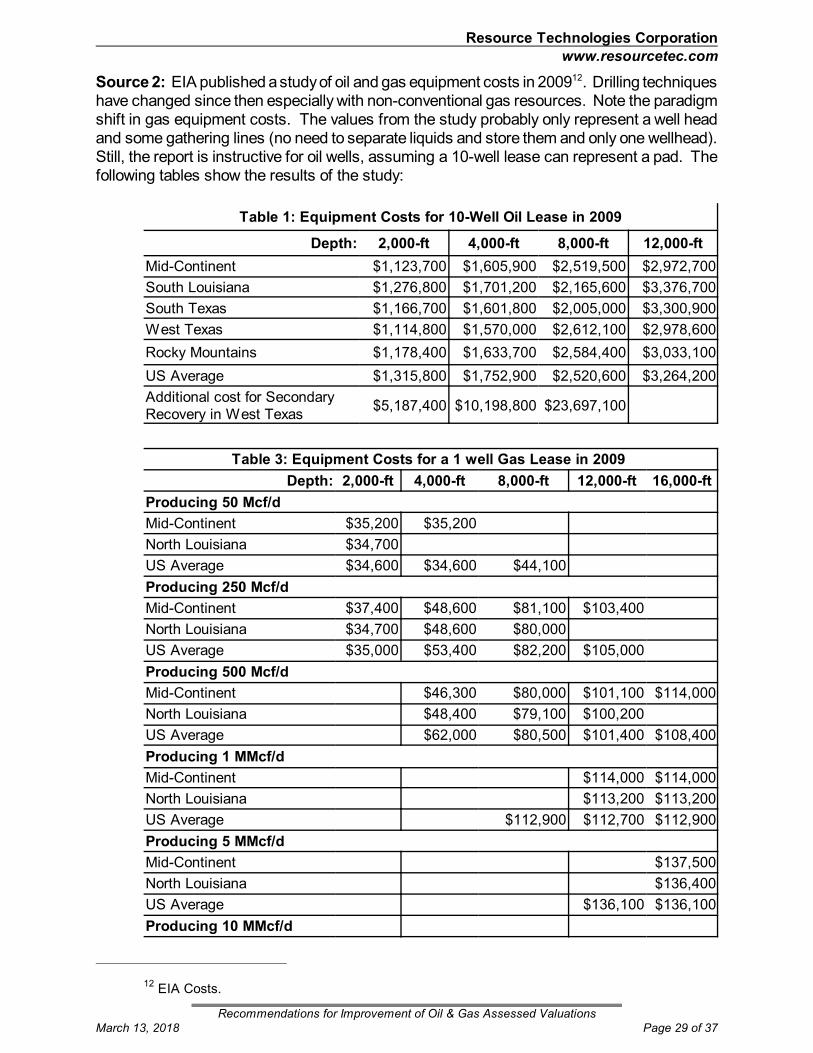
Source 2: EIA published a study of oil and gas equipment costs in 200912. Drilling techniqueshave changed since then especially with non-conventional gas resources. Note the paradigmshift in gas equipment costs. The values from the study probably only represent a well headand some gathering lines (no need to separate liquids and store them and only one wellhead). Still, the report is instructive for oil wells, assuming a 10-well lease can represent a pad. Thefollowing tables show the results of the study:
Table 1: Equipment Costs for 10-Well Oil Lease in 2009
Depth: 2,000-ft 4,000-ft 8,000-ft 12,000-ft
Mid-Continent $1,123,700 $1,605,900 $2,519,500 $2,972,700
South Louisiana $1,276,800 $1,701,200 $2,165,600 $3,376,700
South Texas $1,166,700 $1,601,800 $2,005,000 $3,300,900
West Texas $1,114,800 $1,570,000 $2,612,100 $2,978,600
Rocky Mountains $1,178,400 $1,633,700 $2,584,400 $3,033,100
US Average $1,315,800 $1,752,900 $2,520,600 $3,264,200
Additional cost for SecondaryRecovery in West Texas
$5,187,400 $10,198,800 $23,697,100
Table 3: Equipment Costs for a 1 well Gas Lease in 2009
Depth: 2,000-ft 4,000-ft 8,000-ft 12,000-ft 16,000-ft
Producing 50 Mcf/d
Mid-Continent $35,200 $35,200
North Louisiana $34,700
US Average $34,600 $34,600 $44,100
Producing 250 Mcf/d
Mid-Continent $37,400 $48,600 $81,100 $103,400
North Louisiana $34,700 $48,600 $80,000
US Average $35,000 $53,400 $82,200 $105,000
Producing 500 Mcf/d
Mid-Continent $46,300 $80,000 $101,100 $114,000
North Louisiana $48,400 $79,100 $100,200
US Average $62,000 $80,500 $101,400 $108,400
Producing 1 MMcf/d
Mid-Continent $114,000 $114,000
North Louisiana $113,200 $113,200
US Average $112,900 $112,700 $112,900
Producing 5 MMcf/d
Mid-Continent $137,500
North Louisiana $136,400
US Average $136,100 $136,100
Producing 10 MMcf/d
12 EIA Costs.
Recommendations for Improvement of Oil & Gas Assessed ValuationsMarch 13, 2018 Page 29 of 37

Resource Technologies Corporation www.resourcetec.com
Table 3: Equipment Costs for a 1 well Gas Lease in 2009
Depth: 2,000-ft 4,000-ft 8,000-ft 12,000-ft 16,000-ft
North Louisiana $168,200
Notes from the study:The costs provided in this report are for representative lease operations with equipment and operating
procedures designed by EIA staff engineers. Costs are estimated for representative 10-well oil leases
producing by artificial lift; 1 flowing gas well per gas lease; or 10-well coal bed methane leases dewatering
by artificial lift. The design criteria took into account the predominant methods of operation in each
region. Individual items of equipment were priced by using price lists and by communicating with the
manufacturers or suppliers of the items in each region. The leading supply, service, and contracting
companies (active in one or more of the regions) were contacted every year (1976 through 2009) for local
June prices for their component of equipment or operating function. The objective of this process is to
acquire prices that are representative for each region. The annual operating costs measure the change in
direct costs incident to the production of oil and gas and exclude changes in indirect costs such as
depreciation and ad valorem and severance taxes.
Costs were determined for new equipment. Tubing costs are included for the oil wells but not for the gas
wells. Care must be exercised when combining these equipment costs with drilling costs to obtain total
lease development and equipment costs because most drilling and completion cost estimates also include
tubing costs. Drilling and completion costs are not included for producing wells, but are included for
secondary recovery injection wells.
Items Tracked
Table 8 indicates the more significant cost items tracked from year to year, beginning in most cases with
the year 1976. Freight and taxes are also a part of the equipment cost, as is the labor to install the
equipment. Maintenance costs include replacement costs of some of the more common wear items.
Table 8: Items tracked for Oil, Gas, or Coal Bed Methane Lease
Equipment and Operating Costs
Automobile Costs Oil transfer pumps
Communications costs - land Oilfield chemicals
Communications costs - offshore Oilfield maintenance - land
Electric lease power Oilfield maintenance - marine
Electric motors and controllers Packers
Electric labor - field Perforating
Electric materials - field Pipe coating
Fences Plastic tanks
Field structures - small Pumping engines - gas
Fishing tools Pumping motors - electric
Miscellaneous fittings Pumping unit bases
Gas compressors Pumping units
Gas lift equipment Slick line work - offshore
Gas sales meters Speciality tubing
Gross national product deflator Submersible pumps
Helicopter service Submersible hydraulic pumps
Hot oil service Sucker rods
Insulation Tubular goods - lease
Recommendations for Improvement of Oil & Gas Assessed ValuationsMarch 13, 2018 Page 30 of 37

Resource Technologies Corporation www.resourcetec.com
Table 8: Items tracked for Oil, Gas, or Coal Bed Methane Lease
Equipment and Operating Costs
Insurance - offshore Tublar goods - well
Labor statistics - oil field Tugs and barges
Labor - clerical Valves, pumps, misc. - land
Labor - supervisory Water filter cases
Labor - technical Water filters
Large engine for hydraulic pumping Water injection pumps
Lease processing and storageequipment
Well costs - secondary recovery
Lubricants Well servicing - land
Marine food services Well servicing - offshore
Natural gas prices Wellheads
Source 3: More recently, the EIA commissioned IHS to do a study13 of upstream oil and gas
costs. The report is a comprehensive investigation of costs from drilling to exploration in
multiple plays. The following images from the report show the breakdown of each stage of the
well, and total estimated costs:
13 Trends in U.S. Oil and Natural Gas Upstream Costs, IHS Oil and Gas Upstream Cost StudyCommissioned by EIA March 2016.
Recommendations for Improvement of Oil & Gas Assessed ValuationsMarch 13, 2018 Page 31 of 37

Resource Technologies Corporation www.resourcetec.com
Findings from the IHS report:Cost Distribution:
1. Drilling – Within onshore basins drilling comprises about 30-40% of total well costs. These costs
are comprised of activities associated with utilizing a rig to drill the well to total depth and include:
a. Tangible Costs such as well casing and liner, which have to be capitalized and depreciated
over time, and
b. Intangible Costs, which can be expensed and include drill bits, rig hire fees, logging and
other services, cement, mud and drilling fluids, and fuel costs.
2. Completion – Within onshore basins completion comprises 55-70% of total well costs. These costs
include:
a. Well perforations, fracking, water supply and disposal. Typically this work is performed
using specialized frack crews and a workover rig or coiled tubing and include:
b. Liners, tubing, Christmas trees and packers, and
c. Frack-proppants of various types and grades, frack fluids which may contain chemicals and
gels along with large amounts of water, fees pertaining to use of several large frack
pumping units and frack crews, perforating crews and equipment and water disposal.
3. Facilities – Within onshore basins facilities construction comprises 7-8% of total well cost. These
costs include:
a. Road construction and site preparation,
b. Surface equipment, such as storage tanks, separators, dehydrators and hook –up to
gathering systems, and
c. Artificial lift installations.
4. Operation – These comprise primarily the lease operating expenses. Costs can be highly variable,
depending on product, location, well size and well productivity. Typically, these costs include:
a. Fixed lease costs including artificial lift, well maintenance and minor workover activities.
These accrue over time, but are generally reported on a $/boe basis.
b. Variable operating costs to deliver oil and natural gas products to a purchase point or
pricing hub. Because the facilities for these services are owned by third party
Recommendations for Improvement of Oil & Gas Assessed ValuationsMarch 13, 2018 Page 32 of 37

Resource Technologies Corporation www.resourcetec.com
c. midstream companies, the upstream producer generally pays a fee based on the volume
of oil or natural gas. These costs are measured by $/Mcf or MMbtu or $/bbl and include
gathering, processing, transport, and gas compression.
(1) Rig related costs are dependent on drilling efficiency, well depths, rig day rates, mud use and
diesel fuel rates. Rig day rates and diesel costs are related to larger market conditions and overall
drilling activity rather than well design. Rig related costs can range from $0.9 MM to $1.3 MM
making up 12%to 19% of a well’s total cost.
(2) Casing costs are driven by the casing markets, often related to steel prices, the dimensions of
the well, and by the formations or pressures that affect the number of casing strings. Within a play,
well depths are often the most variable characteristic for casing with ranges of up to 5,000 feet.
Operators may also choose to run several casing strings to total depth or run a liner in lieu of the
final casing string. Casing costs can range from $0.6 MM to $1.2 MM, making up 9% to 15% of
a well’s total cost.
(3) Frack pumping costs can be highly variable, but are dependent on horsepower needed and
number of frack stages. The amount of horsepower is determined by combining formation pressure,
rock hardness or brittleness and the maximum injection rate. Pumping pressure (which includes a
safety factor) must be higher than the formation pressure to fracture the rock. Higher pressure
increases the cost. The number of stages, which often correlates with lateral length, is important
since this fracturing process, with its associated horsepower and costs, must be repeated for each
stage. These total costs (for all stages) can range from $1.0 MM to $2.0 MM, making up 14% to
41% of a well’s total cost.
(4) Completion fluid costs are driven by water amounts, chemicals used and frack fluid type (such
as gel, cross-linked gel or slick water). The selection of fracking fluid type is mostly determined by
play production type, with oil plays primarily using gel and natural gas plays primarily using slick
water. Water sourcing costs are a function of regional conditions relating to surface access, aquifer
resources and climate conditions. Water disposal will normally be done by re-injection, evaporation
from disposal tanks, recycling or removal by truck or pipeline, each with an associated cost.
Typically about 20-30 percent of the fluids flow back from the frack and require disposal. Operators
typically include the first 30-60 days of flow back disposal in their capital costs. These costs can
range from $0.3 MM to $1.2 MM making up 5% to 19% of well’s total cost.
(5) Proppant costs are determined by market rates for proppant, the relative mix of natural, coated
and artificial proppant and the total amount of proppant. Proppant transport from the sand mine
or factory to the well site and staging make up a large portion of the total proppant costs. Operators
use more proppant when selecting less costly proppant mixes, which are comprised of mostly
natural sand as opposed to artificial proppants. A higher mix of artificial proppants has often been
used for very deep wells experiencing high formation pressures. Overall the amount of proppant
used per well is increasing in every play. These costs can range from $0.8 MM to $1.8 MM making
up to 6% to 25% of the well’s total.
This report estimates costs at every stage of the well. The equipment that stays onsite
to maintain production is installed among the different stages, and is shown as “tangible” costs.
Assuming a typical well in an unconventional gas well now costs $6 million to drill and
complete, at least 1/6 of those costs are easily distributed to the tangible costs. This leads to
the assigned value of $1,000,000 per pad which can be use in the absence of operator
reported data.
Recommendations for Improvement of Oil & Gas Assessed ValuationsMarch 13, 2018 Page 33 of 37

Resource Technologies Corporation www.resourcetec.com
Appendix A-1: Development of Oil and Gas Discount Rate
One of the primary economic factors in oil and gas property appraisals is the discount
rate used to compute the present value of the likely future income stream. The process of
discounting converts the value of cash projected to be received in the future to the current price
investors would pay for the right to receive the income. This appraisal method is widely used
throughout the oil and gas industry and, in fact, is the basis for the scheme used by ACD to
annually assess the value of oil and gas property throughout the State.
Each year the valuer should calculate a discount rate based on current market
conditions (overall mean weighted average cost of capital (WACC) of a sample of petroleum
companies). However, the discount rate in Arkansas has not been updated recently.
There are three generally accepted methods for estimating a discount rate:
! WACC Studies
! Market Survey Methods
! Oil and Gas Property Sales Analysis.
Currently, there are a number of states and other publically available sources that use
the above methods to publish yearly data on oil and gas company financials that can form the
basis of the yearly ACD discount rate for oil and gas. These sources are:
1. The Texas Comptroller of Public Accounts Property Tax Assistance Division (PTAD)
compiles a comprehensive annual study of discount rates to be applied to oil and gas
values as well as their methodology (2017 Property Value Study - Discount Rate
Range for Oil and Gas Properties, and Manual for Discounting Oil and Gas Income)14,
15. Texas discusses four separate discount rate sources and methods:
a. WACC Method: PTAD compiled a WACC study based on 18 oil and gas
companies (see Exhibit A-1). The study, published in September 2017,
showed a range of 13.7 to 20.46 with an average of 14.64 used as a WACC.
Exhibit A-1: Company Financial Data Used for PTAD WACC Study
Company
Name
Total Capital
(000)
Total Equity
(000)
Total Long-
Term Debt
(000)
Equity % Of
Capital
Debt % Of
Capital
Beta
Factor
After Tax
Cost of
Equity, %
Before Tax
Cost of
Equity, %
Cost Of
Debt %
Before Tax
WACC %
Anadarko $53,716,176 $38,435,176 $15,281,000 71.55 28.45 1.55 12.12 18.65 4.70 14.68
Apache $32,627,036 $24,083,036 $8,544,000 73.81 26.19 1.45 11.52 17.73 4.22 14.19
Cabot $12,386,434 $10,865,904 $1,520,530 87.72 12.28 1.05 9.12 14.04 5.62 13.00
14https://comptroller.texas.gov/taxes/property-tax/docs/96-1166.pdf.
15https://comptroller.texas.gov/taxes/property-tax/docs/96-1703.pdf.
Recommendations for Improvement of Oil & Gas Assessed ValuationsMarch 13, 2018 Page 34 of 37

Resource Technologies Corporation www.resourcetec.com
Exhibit A-1: Company Financial Data Used for PTAD WACC Study
Company
Name
Total Capital
(000)
Total Equity
(000)
Total Long-
Term Debt
(000)
Equity % Of
Capital
Debt % Of
Capital
Beta
Factor
After Tax
Cost of
Equity, %
Before Tax
Cost of
Equity, %
Cost Of
Debt %
Before Tax
WACC %
Chevron $257,916,305 $222,630,305 $35,286,000 86.32 13.68 1.15 9.72 14.96 3.01 13.32
Cimarex $14,224,978 $12,737,039 $1,487,939 89.54 10.46 1.50 11.82 18.19 4.37 16.74
Conoco
Phillips
$88,222,684 $62,036,684 $26,186,000 70.32 29.68 1.35 10.92 16.81 4.50 13.15
Devon $34,039,410 $23,885,410 $10,154,000 70.17 29.83 1.65 12.72 19.57 4.65 15.12
Encana $15,621,020 $11,423,020 $4,198,000 73.13 26.87 1.65 12.72 19.57 5.20 15.71
Energen $6,122,187 $5,594,744 $527,443 91.38 8.62 1.60 12.42 19.11 5.15 17.91
EOG $65,284,160 $58,304,381 $6,979,779 89.31 10.69 1.45 11.52 17.73 3.37 16.19
Exxon
Mobil
$403,330,480 $374,398,480 $28,932,000 92.83 7.17 0.95 8.52 13.11 3.27 12.41
Hess $26,451,230 $19,716,230 $6,694,000 74.54 25.31 1.60 12.42 19.11 5.62 15.68
Marathon $21,250,570 $14,661,570 $6,589,000 68.99 31.01 1.75 13.32 20.50 4.95 15.68
Murphy $7,783,403 $5,360,653 $2,422,750 68.87 31.13 1.55 12.12 18.65 5.34 14.51
Noble $23,506,170 $16,495,170 $7,011,000 70.17 29.83 1.40 11.22 17.27 4.48 13.45
Occidental $64,255,622 $54,436,622 $9,819,000 84.72 15.28 1.15 9.72 14.96 3.21 13.16
Pioneer $33,290,219 $30,562,219 $2,728,000 91.81 8.19 1.45 11.52 17.73 3.70 16.58
Range $12,300,692 $8,491,880 $3,808,812 69.04 30.96 1.15 9.72 14.96 5.56 12.05
TOTAL $1,172,328,782 $994,118,529 $178,169,253 1,424.22 375.62 25.40 203.22 312.65 80.92 263.55
ENTRIES 18 18 18 18 18 18 18
AVERAGE 79.12 20.87 1.41 11.29 17.37 4.50 14.64
STANDARD DEVIATION 9.57 9.57 0.23 1.38 2.13 0.87 1.66
b. The Society of Petroleum Evaluation Engineers (SPEE) conducts an annual
opinion poll market survey (https://secure.spee.org/store) (Market Survey). The
survey is available for a fee. It is also included in the PTAD publication. It is
based on responses from petroleum company executives, industry consultants,
and energy banks concerning property acquisitions and divestitures. The survey
provides perspectives into the discount rates used to analyze properties in the
market. In 2016, the SPEE surveyed 32 sources showing a WACC range of 9.0
to 15.70 with an average of 11.20.
c. The only substantive publically available survey of oil and gas property sales and
net income was completed by R.J. Miller and Associates in 2006 for the
California Independent Petroleum Association. It is also included in the PTAD
publication. It involved more than 250 western U.S. producing oil and gas sales
that occurred between 1998 and 2006. While the survey is dated, it is still
considered by various agencies including the Texas Comptroller.
d. PTAD also reviewed their appraisals of almost 6,000 individual properties as
PTAD will vary discount rates for individual properties based on a number of
factors from the base discount rate. The average discount rate was 17.26 with
a range from 16.36 to 18.16.
2. The West Virginia Department of Tax and Revenue/Property Tax Division publishes an
annual Weighted Average Cost of Capital (WACC Method) report for all species of
Recommendations for Improvement of Oil & Gas Assessed ValuationsMarch 13, 2018 Page 35 of 37

Resource Technologies Corporation www.resourcetec.com
property including producing oil and gas. The report is a band of investments that relies
more on U.S. financial data overall than individual data. For 2017, the State used a
value of 15.80 for a WACC.
3. Duff and Phelps produces summary reports for major industry sectors (WACC
Method). The most recent Duff and Phelps report shows a range of 8.6 to 12.8 with a
segment average of 10.10. This report is based on the analysis of 32 publically traded
oil and gas companies.
4. Aswath Damodaran -The Stern School of Business, New York University publishes a
series of online data sets (http://pages.stern.nyu.edu/~adamodar/). The data sets are
updated quarterly and have been available since 1998. The data is separated by
industry with companies for industry sectors listed within the database. Of interest is
the set “Cost of Capital by Sector (U.S.)”. The 2017 data to be used for 2018
valuations shows an estimated WACC of 12.09 based on the following (WACC
Method):
Industry Name: Oil/Gas (Production & Exploration)
Number of Firms: 331
Beta: 1.26
Cost of Equity: 8.80%
E/(D+E): 70.47%
Std Dev in Stock: 78.88%
Cost of Debt: 6.91%
Tax Rate: 2.18%
After-tax Cost of Debt: 5.25%
D/(D+E): 29.53%
Cost of Capital: 12.09%
By including 330 companies, this statistic is a much broader review of the industry than
those reviews with narrow focus limited to Exploration and Production. The wider the
view, the lower the overall likely risk.
The ACD process is meant to be a mass appraisal; there is no intention of providing site
or well-specific evaluations. The ACD does not collect the well-specific data needed to
undertake a detailed evaluation including adjustments of the discount rate based on the
property. Therefore, a straight forward process of annually gathering typical rates used
throughout the national industry is most appropriate.
Additionally, RTC suggests (as with PTAD) to add two percentage points to the overall
mean WACC to establish the base discount rate for each oil and gas property to account for:
Recommendations for Improvement of Oil & Gas Assessed ValuationsMarch 13, 2018 Page 36 of 37

Resource Technologies Corporation www.resourcetec.com
1. the inherent risk associated with oil and gas production from an individual
property rather than a company-wide portfolio of producing properties
2. additional smaller oil and gas companies operating in the state in addition to the
above studies
Exhibit A-2 shows the 2017 calculation of the discount rate that can be used for tax
year 2018:
Exhibit A-2: ACD Discount Rate Calculation
Source Average Min Max
Texas Comptroller Study - Calculated WACC (18 companies) 14.64 12.05 17.91
SPEE (32 companies) (via Texas Comptroller) 11.70 9.00 15.70
West Virginia 15.80 N/A N/A
Duff and Phelps (138 companies) 10.57 8.60 12.80
Damodaran (331 companies) 12.09 N/A N/A
Average 12.96
Additional 2 Percentage Points 14.96
A yearly review of these sources by ACD can be used to update the discount rate used
for oil and gas valuation in the future.
Recommendations for Improvement of Oil & Gas Assessed ValuationsMarch 13, 2018 Page 37 of 37