state of alaska department of natural resources division...
TRANSCRIPT

STATE OF ALASKA
DEPARTMENT OF NATURAL RESOURCES
DIVISION OF GEOLOGICAL AND GEOPHYSICAL SURVEYS
Bill Sheffield - Governor
Esther Wunnicke - Commissioner
Ross G. Schaff - State Geologist
A p r i l 1983
This report is a preliminary publication of DGGS. The author is solely responsible for its content and will appreciate candid comments on the accuracy of the data as well as suggestions to improve the report.
Report of Investigations 83-9 GEOLOGY AND MINERALIZATION OF THE
SILVER FOX MINE, FAIRBANKS MINING DISTRICT, ALASKA
BY G.E. Sherman

STATE OF ALASKA Department of Natural Resources
DIVISION OF GEOLOGICAL & GEOPHYSICAL SURVEYS
According to Alaska Statute 41, the Alaska Division of Geological and Geophysical Surveys is charged with conducting 'geological and geophysical surveys to determine the potential of Alaska lands for production of metals, minerals, fuels, and geothermal resources; the locations and supplies of ground waters and construction materials; the potential geologic hazards to buildings, roads, bridges, and other installations and structures; and shall conduct other surveys and investigations as will advance knowledge of the geology of Alaska.'
In addition, the Division shall collect, eval- uate, and publish data on the underground, surface, and coastal waters of the state. It shall also file data from water-well-drilling logs.
DGGS performs numerous functions, all under the direction of the State Geologist---resource investiga- tions (including mineral, petroleum, and water re- sources), geologic-hazard and geochemical investiga- tions, and information services.
Administrative functions are performed under the direction of the State Geologist, who maintains his office in Anchorage (3001 Porcupine Dr., 99501, ph 274-9681).
This report is for sale by DGGS for $5. It may be inspected at any of the four DGGS information offices: Alaska National Bank of the North Bldg., Geist Rd. and University Ave., Fairbanks; 3601 C St. (10th Floor), Anchorage; 230 So. Franklin St. (4th Floor), Juneau; and the State Office Bldg., Ketchikan. Mail orders should be addressed to DGGS, P.O. Box 80007, College, AK 99708.


CONTENTS
Page
Abstract ............................................................... 1 ............................................................ Introduction 1 ............................................................ Purpose 1
Location and description of study area ............................. 1 Previous work ................................................ 2 Method of study .................................................... 3 Acknowledgments .................................................... 3
Geologic setting ........................................................ 3 Regional geology ................................................... 3 Metamorphic rocks .................................................. 5 Intrusive rocks .................................................... 5 Quartz diorite ..................................................... 5 ................................................... Quartz monzonite 6 Intrusive relationships ............................................ 7
Alteration and mineralization ........................................... 7 Characteristic alteration types .................................... 7 ...................................................... Sulfide veins 9 Quartz stockwork in quartz diorite ................................. 14 Quartz veins in quartz monzonite ................................. 18
Proposed sequence of hydrothermal events ................................ 19 Geochemical sampling .................................................... 20
Introduction .................................................. 20 Determination of threshold ..................................... 2 1 Significance of anomalous values ................................... 22 General comments on anomalies ...................................... 3 1 Magnetic survey .................................................... 32
Suggestions and recommendations ...................................... 32 Sulfide-vein potential ............................................. 34 Low-grade gold potential ........................................... 34 ..................... Potential for molybdenum and copper production 36
Comparison with other molybdenum stockworks ............................. 37 Conclusions ............................................................. 38 References cited ........................................................ 38 Appendix A - Q-A-P diagram and modes for typical intrusive rocks in
the Silver Fox Mine area. Fairbanks mining district. Alaska ........ 40 ....................... Appendix B - Summary of rock and mineral analyses 42 Appendix C - Geochemical soil-sample analyses ........................... 4 4 Appendix D - Corrected geomagnetic data from the geochemial-survey
grid ............................................................ 5 1
FIGURES
Figure 1 . Location of study area. Fairbanks mining district. Alaska ................................................. 2
2 . Geologic sketch map of a portion of the Fairbanks mining district. Alaska .................................. 4
3 . Contour diagram of poles of joints and faults; base contour and contour interval is 1 percent ................... 6
iii

Page
Map of trench in the Fox Creek pluton (loc. 1, pl. 1) ......... 8 Photomicrograph of sericitic alteration of plagioclase, Flume Creek pluton, Fairbanks mining district, Alaska....... 9
Pit map showing quartz veins and the associated potassium-feldspar and biotite in the Fox Creek pluton (loc. 2, pl. l), Fairbanks mining district, Alaska.......... 10
Alteration map of a portion of the study area, Silver Fox Mine, Fairbanks mining district, Alaska... .................. 11
Photomicrograph of chalcopyrite exsolution blebs in sphalerite, Silver Fox Mine, Fairbanks mining district, Alaska.. .................................................... 12
Paragenetic sequence of sulfide veins in the quartz diorite, Silver Fox Mine, Fairbanks mining district, Alaska..... ..... 12
Pit map of an area in the quartz diorite where three parallel veins existed prior to mining (loc. 3, pl. l ) , Silver Fox Mine, Fairbanks mining district, Alaska....... .............. 14
Pit map of a sulfide-bearing shear zone in the quartz diorite (loc. 4, pl. l), Silver Fox Mine, Fairbanks mining district, Alaska................... ................................... 15
Contour diagram of poles of joints and faults, Silver Fox Mine, Fairbanks mining district, Alaska..................... 16
General characteristics of the quartz-molybdenite stockwork exposed underground, Silver Fox Mine, Fairbanks mining district, Alaska............................................ 17
Photomicrograph of potassium-feldspar flooding in the quartz- molybdenum stockwork, Silver Fox Mine, Fairbanks mining district, Alaska. ........................................... 20
Cumulative probability plot of copper distribution, Silver Fox Mine, Fairbanks mining district, Alaska................. 22
Cumulative probability plot of lead distribution, Silver Fox Mine, Fairbanks mining district, Alaska... .............. 23
Log-cumulative probability plot of zinc distribution, Silver Fox Mine, Fairbanks mining district, Alaska................. 24
Log-cumulative probability plot of molybdenum distribution, Silver Fox Mine, Fairbanks mining district, Alaska.......... 25
Contour map of the copper distribution over the survey grid shown on plate 1, Silver Fox Mine, Fairbanks mining dis- trict, Alaska............................................... 26
Contour map of the lead distribution over the survey grid shown on plate 1, Silver Fox Mine, Fairbanks mining dis- ............. trict, Alaska.................................. 27
Contour map of the molybdenum distribution over the survey grid shown on plate 1, Silver Fox Mine, Fairbanks mining district, Alaska............................................ 28
Contour map of the silver distribution over the survey grid shown on plate 1, Silver Fox Mine, Fairbanks mining dis- trict, Alaska............................................... 29
Contour map of the zinc distribution over the survey grid shown on plate 1, Silver Fox Mine, Fairbanks mining dis- .............................................. trict, Alaska. 30
Contour map of the geomagnetic values over the survey grid shown on plate 1, Silver Fox Mine, Fairbanks mining dis- .......................................... trict, Alaska..... 33
iv
25. Pit map of the reticulated-vein system in the quartz diorite (loc. 5, pl. l ) , Silver Fox Mine, Fairbanks mining district, Alaska...................................................... 35
TABLES
Table 1. Atomic-absorption analyses of grab and chip samples from sulfide veins in the quartz diorite......................... 13
2. Atomic-absorption analyses of samples from the underground ............................ quartz-molybdenite stockwork.... 17 3. Atomic-absorption analyses of quartz veins from the Fox Creek
pluton ...................................................... 18 4. Atomic-absorption analyses of samples from the reticulated-
vein system in quartz diorite............................... 35 5. Comparison of a typical calc-alkalic stockwork molybdenum
deposit with the Silver Fox Mine, Fairbanks mining district, ............................................ Alaska.......... 37
PLATES
Plate 1. Bedrock geology and sample locations, Silver Fox Mine......... pocket 2 . Geologic mine map, Silver Fox Mine............................ pocket 3 . Sequence of major hydrothermal events, Silver Fox Mine........ pocket


GEOLOGY AND MINERALIZATION OF THE SILVER FOX MINE, FAIRBANKS MINING DISTRICT, ALASKA
BY Gary E. Sherman
ABSTRACT
The Silver Fox Mine is located approximately 17 mi north of Fairbanks, Alaska, in a quartz diorite-granodiorite pluton that is in contact with two quartz monzonite stocks to the north. Alteration and mineralization events have produced a quartz-molybdenite stockwork, argentiferous galena-sphalerite- pyrite fissure veins, and minor gold-stibnite mineralization.
A model was developed that suggests that thermal collapse of the system ---associated with mineralization---caused overprinting of high-temperature phases by lower temperature phases.
The Silver Fox Mine appears to represent a weakly developed molybdenum- porphyry system of the granodiorite type as described by Mutschler and others (1981); grade is estimated to be far lower than that of currently economic stockworks. Potential for exploitation of the sulfide and gold veins is low because of discontinuous strike lengths and narrow widths, but small-scale mining of the high-grade lead-silver veins may be possible.
INTRODUCTION
Purpose
The purpose of this study was to examine both the structural and geologic controls of mineralization that occurs on the Silver Fox Mine property. A basic model was constructed to depict the sequence of alteration and min- eralizing events. The presence of molybdenum in a quartz stockwork exposed underground has been related to a possible porphyry system (Mowatt, 1974). This possibility was examined in terms of alteration and geologic setting to determine if evidence supporting such a supposition was present. A qualita- tive evaluation of the production potential of the mine was made on the basis of information gained from the study.
Field work was conducted primarily during the summer of 1979 and spring of 1980.
Location and Description of Study Area
The Silver Fox Mine claims are located 2 mi east of the Elliot Highway, approximately 17 mi north of Fairbanks (fig. 1). The claim block consists of four federal and 13 state lode claims totalling 520 acres (pl. 1).
Rolling hills characterize the topography of the area, and elevations range from 1,300 to 2,200 ft above sea level. Most development work has been done on the divide between Fox and Flume Creeks. Underground workings consist of approximately 600 ft of headings and drifts and one shaft approximately 25 ft deep. Surface excavations are limited to pits and trenches in mineralized areas.
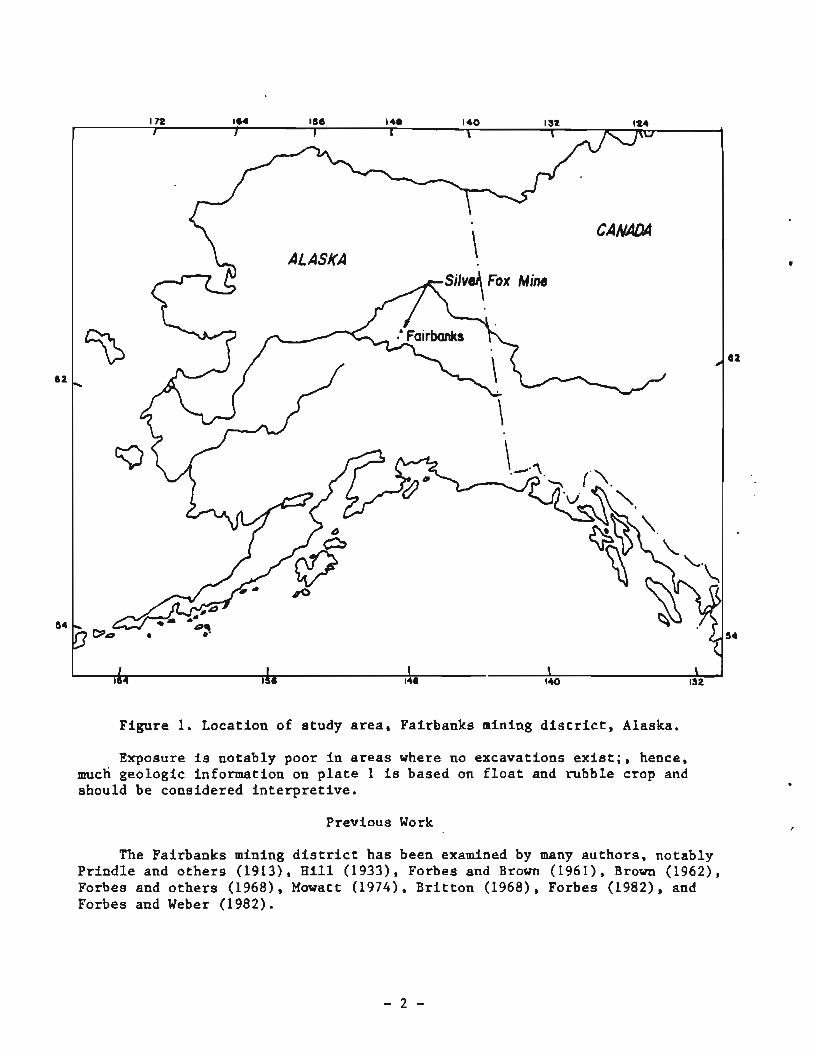
Figure 1. Location of s tudy a r e a , Fairbanks mining d i s t r i c t , Alaska.
Exposure i s notably poor i n a r e a s where no excavations e x i s t ; , hence, much geologic information on p l a t e 1 is based on f l o a t and rubble crop and should be considered i n t e r p r e t i v e .
Previous Work
The Fairbanks mining d i s t r i c t has been examined by many au thors , notably P r i n d l e and o t h e r s (1913), H i l l (19331, Forbes and Brown (1961), Brown (1962), Forbes and o t h e r s (1968), Mowatt (1974), B r i t t o n (1968), Forbes (1982), and Forbes and Weber (1982).

Some authors briefly examined the Silver Fox property in the course of broader regional studies. Britton's (1969) study of the intrusive rocks of the Pedro Dome area provided a petrographic background of the rocks in the Silver Fox Mine area. Various government agencies have also visited the property, but most of that information has not been published. Mowatt (1974) provided the most detailed description of the mineralization of the property prior to this study.
Method of Study
Rock samples were collected for thin section to study alteration assemblages, and polished sections of the galena-sphalerite-pyrite veins were analyzed to determine paragenesis. Chip and grab samples of vein and wallrock material and soil samples taken over a regular grid were analyzed for several trace elements. A magnetometer survey was conducted over the same grid to define any distinct geomagnetic signatures.
Acknowledgments
This study was funded in part by fellowships from the U.S. Department of Health, Education, and Welfare (now Health and Human Services) and the University of Alaska (Fairbanks) School of Mineral Industry.
I wish to thank my graduate committee, particularly T.E. Smith for his continued assistance throughout the project and for his thoughtful review of the manuscript. Special thanks are due Tury Anderson, former owner of the Silver Fox Mine, for sharing his knowledge of the area. Lastly, I would like to thank my wife, Vicki, for her continued support both in the field and otherwise.
GEOLOGIC SETTING
Regional Geology
The main rock unit throughout the Fairbanks mining district is the Birch Creek schist, also called the Yukon-Tanana metamorphic complex (Foster and others, 1973). Within the area of interest, the Birch Creek schist can be divided into two broad groups consisting of a greenschist facies and an epidote-amphibolite facies.
The greenschist facies is more common and consists of micaceous quartzite, garnet-mica schist, quartz-mica schist, and phyllitic schist with subordinate greenschist and rare, impure tremolitic marble. Metamorphic grade decreases to the northwest. The epidote-amphibolite facies consists of calc-silicate marble, eclogitic rock, garnet amphibolite, epidote amphibolite, garnet-mica schist, and graphitic and micaceous quartzite. These rocks are exposed along a band from Dome Creek through Juniper Creek to the east. The epidote-amphibolite facies rocks are in low angle thrust(?) contact with the greenschist facies to the southeast (fig. 2).
Recent work by DGGS and the Mineral Industry Research Laboratory, University of Alaska, Fairbanks, has resulted in subdivision of the

VABMpOphir
Tb - Tertiary basalt TKE Tertiary - Cretaceous intrusive8 eat- Epidote-amphibolite facies gf- Greenschist facies
k Thrust foult Antiform
y Synform
\lap. - .
g f
- w - Figure 2. Geologic sketch map of a portion of the Fairbanks mining district,
Alaska.
metamorphic rocks into three groups consisting of a) the Fairbanks schist terrane comprised of micaceous schists and quartzites, b) the Goldstream terrane that consists of amphibolites and pelitic schist, and c) an eclogitic sequence that contains the rocks described previously under the epidote- amphibolite facies.
Within the Fairbanks schist terrane, a distal volcanogenic package consisting of white felsic schist, graphite schist, and marble has been recognized and named the Cleary sequence. This sequence <lays a major role in the distribution of gold-stibnite mineralization in the district. The rocks are generally exposed on northeast-trending antiforms in the district. They are present in the Silver Fox Mine area, along the Cleary antiform.
Metamorphic rocks in the Fairbanks mining district have undergone two periods of deformation; the first produced small-scale isoclinal recumbent folds that trend northwest, and the second produced long-wavelength folds with northeast-trending axes. Igneous rocks of the Silver Fox Mine are localized along the Cleary antiform, a product of the second fold event.
Intrusive rocks in the Fairbanks mining district range in composition from granite to quartz diorite. Igneous rocks in the Livengood Quadrangle are Cretaceous in age (Chapman and others, 1971). Quartz diorite-granodiorite intrusives in the Pedro Dome area have been dated at 90.7 5 5.1 million years, while the quartz monzonites are 93 5 5 million years old (Britton, 1969).

Minor volcanic rocks, specifically olivine basalts, are present near Fairbanks Creek, Alder Creek, and Kokomo Creek (fig. 2).
Metamorphic Rocks
Metamorphic rocks in the area of the Silver Fox Mine consist primarily of quartz-muscovite and muscovite-quartz schist. Minor quartz-biotite hornfels occur in contact zones of the intrusive rocks. Because no contacts with the Birch Creek schist were observed, the width of the contact aureole is unknown.
Mineralized intrusives of the mine occupy the southern flank of the Cleary antiform (pl. 1). No mineralization was found in the metamorphic rocks of the Silver Fox Mine except for some minor quartz veins (with stibnite lenses) with gold values from 0.3 to 20 ppm (Forbes and others, 1968).
Intrusive Rocks
The petrography of the intrusive rocks of the Pedro Dome area is described by Britton (1969). In this study, thin sections were examined primarily to gain an understanding of the hydrothermal alteration associated with the mineralizing process.
Quartz Diorite
The quartz diorite stock, which trends roughly east-west, makes up the largest mass of intrusive rock on the property (pl. 1). It hosts most of the mineralization, including galena-sphalerite-pyrite fissure veins and a molybdenum-bearing quartz-stockwork system.
The quartz diorite is typically fine-grained and equigranular; plagio- clase is the most abundant mineral. Quartz is anhedral to subhedral or occurs as micrographic intergrowths with potassium feldspar. Biotite is more common than hornblende and is often seen as a secondary rim around the latter. Accessory minerals include apatite, sphene, epidote, and magnetite.
A granodiorite variant of the quartz diorite (sample 14-19, pl. 1) has a porphyritic texture with quartz and zoned plagioclase as phenocrysts. The matrix consists of quartz, plagioclase, and micrographic intergrowths of potassium feldspar.
Jointing within the quartz diorite is common and at least two distinct sets were noted. Figure 3 is a contour diagram of a lower-hemisphere plot of the poles of 157 joints and faults. Note that the most common orientation is a northeasterly set that dips southeast and a northwesterly set that dips northeast. These may represent a conjugate set of fractures and faults that formed during the cooling of the stock after intrusion. Faulting is common within the quartz diorite, although displacements tend to be less than 1 it.
A stockwork vein system composed of quartz 2 molybdenite, calcite, scheelite, and zeolites is exposed underground in the quartz diorite. The density of the stockwork fracture system varies, but it is more fully developed in the westernmost part of the workings. Surface exposures of the stockwork system are generally lacking.

Figure 3. Contour diagram of poles of joints and faults; base contour and contour interval is 1 percent.
Quartz monzonite
Two bodies of quartz monzonite are present on the property (pl. 1). Because the eastern stock is poorly exposed, the location of the eastern contact with the Birch Creek schist is unknown. The western body is better delineated because of the large number of excavations in the immediate area. Britton (1969) named these stocks the Flume and Fox Creek plutons, respectively. Although similar in appearance, there are significant differ- ences between the plutons.
Two textural variations were noted in the Flume Creek pluton, but their contact relations were not established because of poor exposure. One variant is a coarse, equigranular quartz monzonite dominated by potassium feldspar. The other variant is a fine-grained, porphyritic quartz monzonite of similar bulk composition that may represent a dike or contact zone rather than a different phase of the main intrusive.
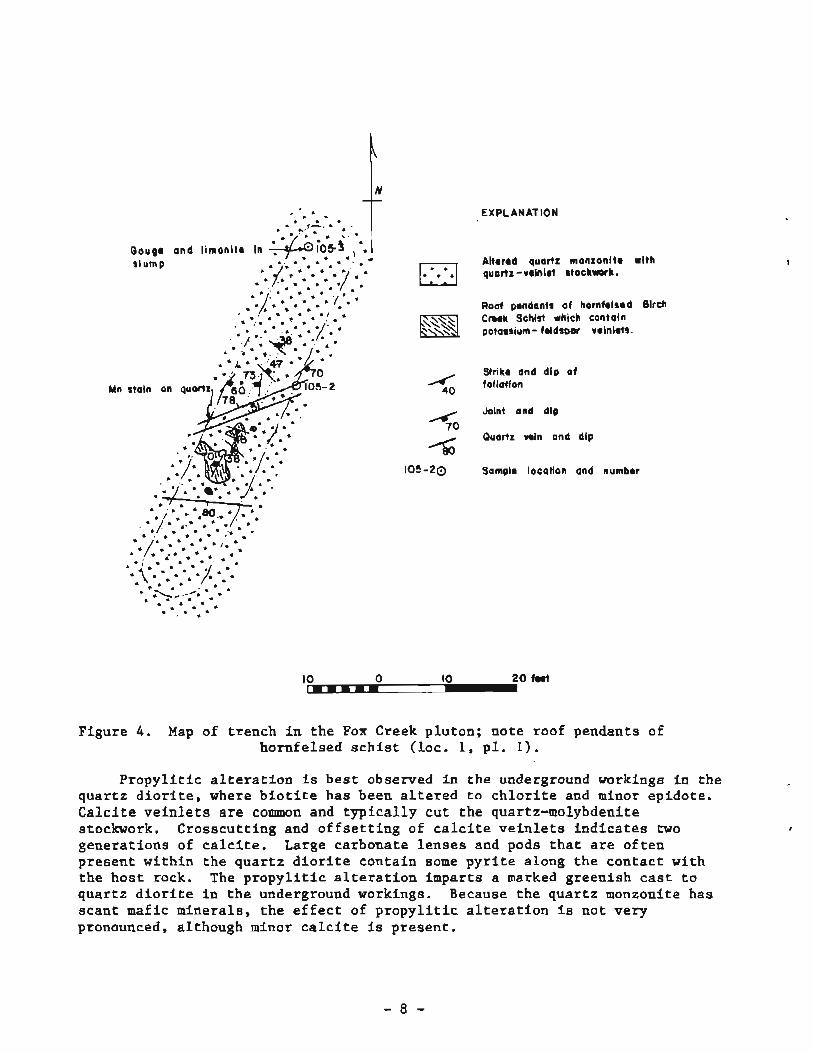
The Fox Creek pluton is composed of coarse-grained, nearly equigranular quartz monzonite, whose margins are cut by numerous dikes. Roof pendants of hornfelsed schist are common, which indicates that the upper portion or hood zone of the intrusive is presently exposed (fig. 4). Large quartz veins are present in the stock; the attendant alteration will be discussed later. Because much of the stock is highly altered, structural relationships are obscured. Appendix A lists modal analyses of the intrusive rocks.
Intrusive Relationships
Field evidence suggests the quartz diorite was emplaced before the quartz monzonite, which may have been intruded into zones of weakness along the contacts (Britton, 1969). One xenolith of quartz diorite was found in the quartz monzonite of the Flume Creek pluton. No dikes of quartz monzonite appear to crosscut the quartz diorite; instead, the contact consists of relatively fresh quartz monzonite adjacent to grus from the weathered quartz diorite.
According to Britton (1969), quartz monzonite dikes cut quartz diorite in a road cut along the Twin Creek pluton. If the intrusives in the Pedro Dome region have a common genetic origin, this would also confirm the intrusive sequence suggested for the Silver Fox Mine.
ALTERATION AND MINERALIZATION
Characteristic Alteration Types
The intrusive rocks exhibit potassic, sericitic, argillic, and propylitic alteration. Potassic alteration is typically represented by potassium- feldspar veinlets or flooding and is generally restricted to the quartz diorite, although it is present in two locations within the Fox Creek pluton. Some potassium-feldspar veinlets display distinct envelopes of sericite and chloritized biotite.
Pervasive sericitization is present at several locations within the Flume Creek pluton. Typically, this alteration ranges from minor dusting of the plagioclase to near total destruction of the original mineralsa(fig. 5).
Kaolinite is found in nearly all samples but is rarely pervasive. Such clay alteration is generally more common in the quartz monzonite. In the Fox Creek pluton, the large quantities of clay that are present are apparently related to large, often obscured, quartz veins such as those shown in figure 6. Much of the argillic alteration is confined to calcic cores of plagioclase grains, and may be supergene in origin.
. * * * . . *.'
Gouge and limonite in . slump
Mn stain on quartz
, * * * * *
EXPLANATION
Altered quortz monzonite with quortz -veinlet atockwork.
Roof pendants of hornfelsed Birch Cnek Schist which contain potoasium- feldspor veinletr.
Strike and dip of foliation
Joint and dip
Quartz vein and dip
Sample locotion and number
Figure 4. Map of trench in the Fox Creek pluton; note roof pendants of hornfelsed schist (loc. I, pl. I).
Propylitic alteration is best observed in the underground workings in the quartz diorite, where biotite has been altered to chlorite and minor epidote. Calcite veinlets are common and typically cut the quartz-molybdenite stockwork. Crosscutting and offsetting of calcite veinlets indicates two generations of calcite. Large carbonate lenses and pods that are often present within the quartz diorite contain some pyrite along the contact with the host rock. The propylitic alteration imparts a marked greenish cast to quartz diorite in the underground workings. Because the quartz monzonite has scant mafic minerals, the effect of propylitic alteration is not very pronounced, although minor calcite is present.

Figure 5. Photomicrograph of sericitic alteration of plagioclase, Flume Creek pluton, Fairbanks mining district, Alaska.
Figure 7 is an alteration map of the study area. Contacts are based on samples collected from the few available exposures and are therefore considered approximate. The area of potassic alteration appears to be con- fined primarily to the quartz diorite; however, potassium-feldspar-bearing veinlets do occur within the quartz monzonite in the contact area of a roof pendant (fig. 4) and as small grains in a quartz veinlet (sample 46-6, pl. 1). The contact of the sericitic zone is based on samples that show pervasive alteration. While the sericitic zone appears to overlap the potassic zone, actual evidence of overprinting was not observed. Although the alteration map is based on few samples, it does provide an approximate areal distribution of the assemblages.
Feldspar in both quartz monzonite bodies often shows considerable argillization. This has been related to veinlet control in only a few cases. Much of the argillic alteration in the quartz monzonite may be of supergene origin, excluding the obvious hypogene alteration that accompanies the large quartz veins in the Fox Creek pluton.
Sulfide Veins
Sulfide veins were the major target at the time of initial discovery and development of the property. Galena in the veins is argentiferous, and early reports indicated assays of 168 ounces per ton (Anonymous, 1913). However, analyses of samples in this study revealed values considerably lower. Table 1 lists the analyses of several grab and chip samples from various fresh and oxidized veins (locations shown on pl. 1 ) .

A5 Strike ond dip of foult
:Gke and dip of quartz
4, Strike and dip of joint
, + +
+ + + Pit boundory
+ -
+
+ * , . +' S*+ .+
+ r
Figure 6. Pit map showing quartz veins and the associated potassium-feldspar and biotite in the Fox Creek pluton (loc. 2, pl. I ) , Fairbanks mining district, Alaska.
Argentiferous galena, sphalerite, pyrite + chalcopyrite, and arsenopyrite are present in the veins. In polished section, chalcopyrite is present.as emulsion exsolutions (fig. 8) within the sphalerite, which may indicate a minimum temperature of formation of 350°C. Much of the sphalerite does not contain chalcopyrite, which suggests that deposition of sphal-erite continued after initlal deposition of the sulfide. Pyrite and arsenopyrite are highly
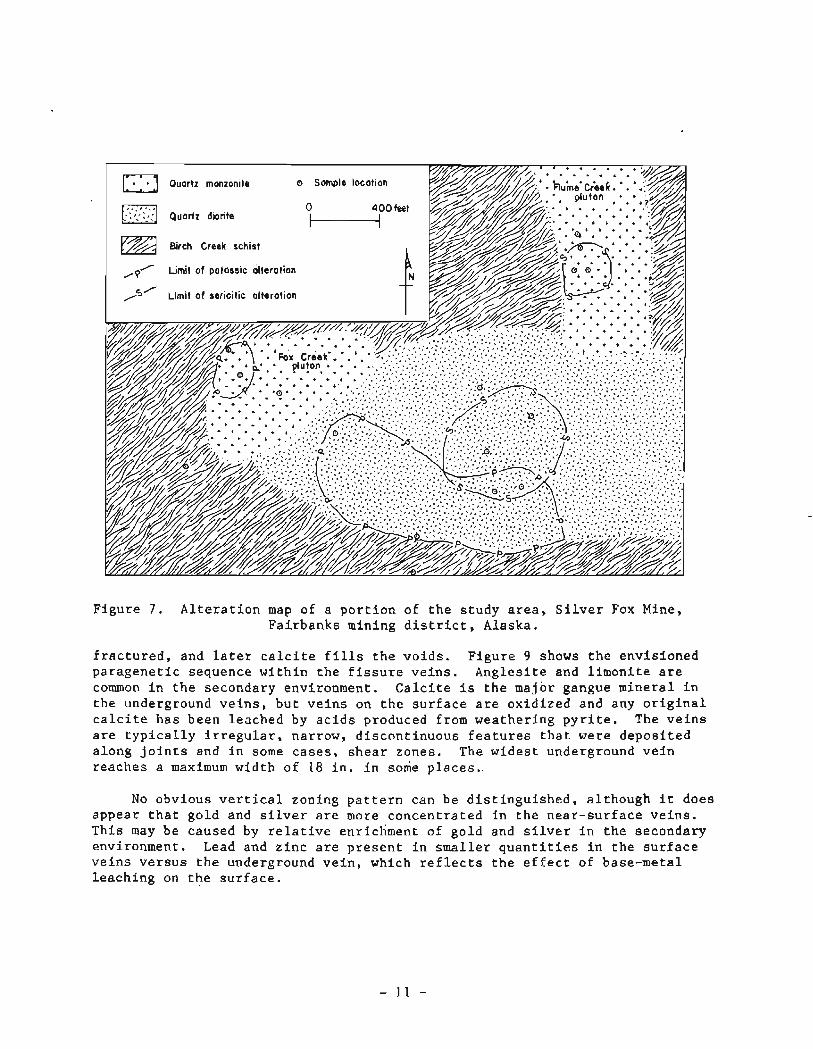
Figure 7 . A l t e r a t i o n map of a po r t ion of t h e s tudy a r e a , S i l v e r Fox Mine, Fairbanks mining d i s t r i c t , Alaska.
f r a c t u r e d , and l a t e r c a l c i t e f i l l s t h e voids . F igure 9 shows t h e envisioned paragenet ic sequence wi th in t h e f i s s u r e ve ins . Angles i te and l imoni te a r e common i n t h e secondary environment. C a l c i t e i s t h e major gangue minera l i n t he underground v e i n s , bu t v e i n s on t h e su r f ace a r e oxidized and any o r i g i n a l c a l c i t e has been leached by a c i d s produced from weathering p y r i t e . The ve ins a r e t y p i c a l l y i r r e g u l a r , narrow, discont inuous f e a t u r e s t h a t were deposi ted along j o i n t s and i n some cases , shea r zones. The wides t underground v e i n reaches a maximum width of 18 i n . i n some places. .
NO obvious v e r t i c a l zoning p a t t e r n can be d i s t i ngu i shed , a l though i t does appear t h a t gold and s i l v e r a r e more concentrated i n t h e near-surface ve ins . This may be caused by r e l a t i v e enrichment of gold and s i l v e r i n t h e secondary environment. Lead and z i n c a r e p re sen t i n smal le r q u a n t i t i e s i n t h e su r f ace ve ins ve r sus t h e underground ve in , which r e f l e c t s t h e e f f e c t of base-metal l eaching on t h e su r f ace .

0 0.5 mm - Figure 8. Photomicrograph of chalcopyrite exsolution blebs in sphalerite,
Silver Fox Mine, Fairbanks mining district, Alaska.
pyrite ---------- ? -----?
arsenopyrite ----------
chalcopyrite ---------- sphalerite ----------?-----?
galena ---------
calcite ?---?---?---?---?---?------------------
Figure 9. Paragenetic sequence of sulfide veins in the quartz diorite. Exten- sive fracturing occurred after deposition of the pyrite and arsenopyrite, and minor fracturing may have occurred after deposition of the sphalerite and chalcopyrite; Silver Fox Mine, Fairbanks mining district, Alaska.
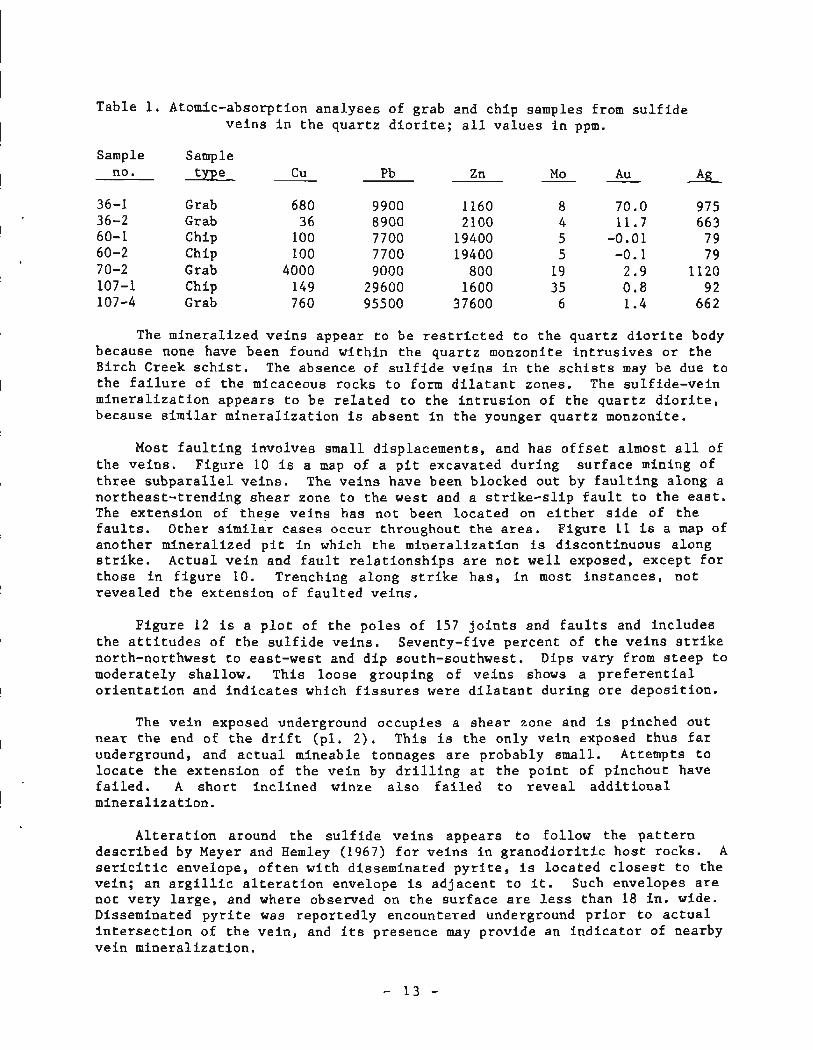
Table 1. Atomic-absorption analyses of grab and chip samples from sulfide veins in the quartz diorite; all values in ppm.
Sample Sample no. type Cu ~b Zn MO AU Ag
36-1 Grab 680 9900 1160 8 70.0 975 36-2 Grab 3 6 8900 2100 4 11.7 663 60-1 Chip 100 7700 19400 5 -0.01 7 9 60-2 Chip 100 7700 19400 5 -0.1 79 70-2 Grab 4000 9000 800 19 2.9 1120 107-1 Chip 149 29600 1600 35 0.8 9 2 107-4 Grab 760 95500 37600 6 1.4 662
The mineralized veins appear to be restricted to the quartz diorite body because none have been found within the quartz monzonite intrusives or the Birch Creek schist. The absence of sulfide veins in the schists may be due to the failure of the micaceous rocks to form dilatant zones. The sulfide-vein mineralization appears to be related to the intrusion of the quartz diorite, because similar mineralization is absent in the younger quartz monzonite.
Most faulting involves small displacements, and has offset almost all of the veins. Figure 10 is a map of a pit excavated during surface mining of three subparallel veins. The veins have been blocked out by faulting along a northeast-trending shear zone to the west and a strike-slip fault to the east. The extension of these veins has not been located on either side of the faults. Other similar cases occur throughout the area. Figure 11 is a map of another mineralized pit in which the mineralization is discontinuous along strike. Actual vein and fault relationships are not well exposed, except for those in figure 10. Trenching along strike has, in most instances, not revealed the extension of faulted veins.
Figure 12 is a plot of the poles of 157 joints and faults and includes the attitudes of the sulfide veins. Seventy-five percent of the veins strike north-northwest to east-west and dip south-southwest. Dips vary from steep to moderately shallow. This loose grouping of veins shows a preferential orientation and indicates which fissures were dilatant during ore deposition.
The vein exposed underground occupies a shear zone and is pinched out near the end of the drift (pl. 2). This is the only vein exposed thus far underground, and actual mineable tonnages are probably small. Attempts to locate the extension of the vein by drilling at the point of pinchout have failed. A short inclined winze also failed to reveal additional mineralization.
Alteration around the sulfide veins appears to follow the pattern described by Meyer and Hemley (1967) for veins in granodioritic host rocks. A sericitic envelope, often with disseminated pyrite, is located closest to the vein; an argillic alteration envelope is adjacent to it. Such envelopes are not very large, and where observed on the surface are less than 18 in. wide. Disseminated pyrite was reportedly encountered underground prior to actual intersection of the vein, and its presence may provide an indicator of nearby vein mineralization.

EXPLA NA TI0 N
Stike and dip of quartz vein,
Strike and dip o f faul t and angk o f plungr of slick6m1de
Strike of shear zone '+u and dip
str ike ond dip of sulfide vein
Two sulfids veins were in t hk area prior to mining {now covered by s h p )
'-.
Ent in quartz diorite wolkock is hi@y fractured -
Well-defined faul t wi th lef t-lateral movment
Figure 10. Pit map of an area in the quartz diorite where three parallel veins existed prior to mining (loc. 3, pl. l ) , Silver Fox Mine, Fairbanks mining district, Alaska.
Quartz Stockwork in the Quartz Diorite
A variable density stockwork-vein system is exposed in the underground workings of the mine. The presence of molybdenum in this system was first reported by Mowatt (1974). Molybdenite occurs as disseminated crystals up to 318 in. in diameter and as smeared coatings along contacts between the quartz stockwork and wallrock. No molybdenite was observed on the east side of the mineralized shear in the westernmost drift of the mine (pl. 2). This may represent a faulted block because, as recognized by Mowatt (1974), fracturing

h EXPLANATION
Quartz diorite
Str~ke and dip of fault
Strike and d ~ p of qua1
/fi P Shear zone and dip d ,
channel-sample location 107-1
of highly altered quartz
-1. - , ' [ / * Small quartz veinlets form stockuork !hrou~hout uallrock \;' I-.',\ .-' ' _ -
I C
, ,
' , - - 5
Mornive quanz diorite, only slightly "I*er*d ,
'tz vein
and no.
Figure 11. Pit map of a sulfide-bearing shear zone in the quartz diorite; extension of shear beyond pit has not been located (loc. 4, pl. 1); Silver Fox Mine, Fairbanks mining district, Alaska.
and intensity of the stockwork increases west of the shear zone. No quantita- tive estimation of displacement can be made because of lack of visible offset features. The absence of molybdenite east of the shear and the change in the stockwork character seem to indicate that a 'deeper' portion of the intrusive system has been exposed.
The mineralogy of the quartz stockwork is simple, consisting of quartz, molybdenite, scheelite and 2 potassium-feldspar. Pyrite occurs irregularly within the wallrock, and makes up as much as 15 percent of the total rock composition in several cases.
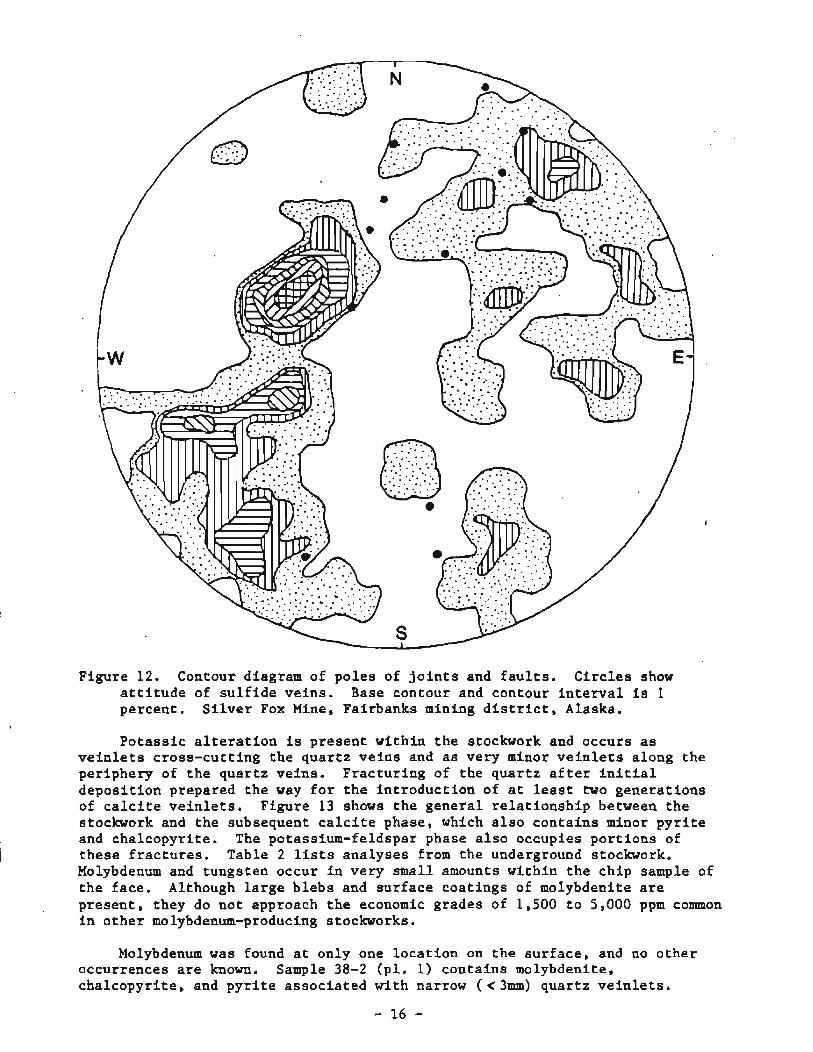
Figure 12. Contour diagram of poles of joints and faults. Circles show attitude of sulfide veins. Base contour and contour interval is 1 percent. Silver Fox Mine, Fairbanks mining district, Alaska.
Potassic alteration is present within the stockwork and occurs as veinlets cross-cutting the quartz veins and as very minor veinlets along the periphery of the quartz veins. Fracturing of the quartz after initial deposition prepared the way for the introduction of at least two generations of calcite veinlets. Figure 13 shows the general relationship between the stockwork and the subsequent calcite phase, which also contains minor pyrite and chalcopyrite. The potassium-feldspar phase also occupies portions of these fractures. Table 2 lists analyses from the underground stockwork. Molybdenum and tungsten occur in very small amounts within the chip sample of the face. Although large blebs and surface coatings of molybdenite are present, they do not approach the economic grades of 1,500 to 5,000 ppm common in other molybdenum-producing stockworks.
Molybdenum was found at only one location on the surface, and no other occurrences are known. Sample 38-2 (pl. 1) contains molybdenite, chalcopyrite, and pyrite associated with narrow (<3mm) quartz veinlets.

' ' Quartz diorite host . ' ' \ 1 1 ,
' ' I
- and K- feldspar -' ,- - '
Figure 13. . General characteristics of the quartz-molybednite stockwork ex- posed underground, Silver Fox Mine, Fairbanks mining district, Alaska.
Table 2. Atomic-absorption aialyses of samples from the underground quartz-molybdenite stockwork; all values in ppm.
Sample Sample no. type - cu ~b - Zn - Mo - Au - k W - 60-3 Grab 14 146 8 1 11 -0.1 2 - 6 0-4 Grab 13 490 93 9 -0.1 1 - 107-3 Chip 9 - - 8 - - 3 5
- No analysis requested The surface in the area of this sample is moderately iron-stained, and in
thin section limonite is pervasive, which suggests that pyrite was present prior to weathering. Because trenching in this area did not reveal further mineralization, the relationship of this occurrence to udderground exposures is uncertain. The chalcopyrite grains in this sample are 2 to 3 mm in size, which contrasts sharply with the underground stockwork in which megascopic chalcopyrite is virtually absent. A geochemical analysis of this sample

yielded 1,900 pprn copper, 1,040 pprn lead, and 120 pprn molybdenum (sample 38-2, app. B). No lead minerals were observed in the grab sample.
The genesis of this stockwork appears to be related to early cooling after initial emplacement of the pluton. In this model, residual magmatic fluids carrying silica, molybdenum, and tungsten entered tension cracks formed by the cooling process. Molybdenite deposited along the walls of the quartz veins was sheared and smeared during subsequent movement along the veins.
Quartz Veins in the Quartz Monzonite
The quartz monzonite bodies are cut by quartz veins of varying size. The Flume Creek pluton contains only small (<2mm) quartz veinlets, while the Fox Creek pluton contains quartz veins approaching 2 ft in width. Alteration associated with these large quartz veins consists primarily of argillization of the wallrock. In some areas, this alteration is so intense that the entire region consists of kaolinite.
Mineralization in these areas is weakly developed, and commonly consists of gold and stibnite. Gold concentrations from analyses in this study were low. Table 3 lists analyses from quartz veins in the Fox Creek pluton. Analysis of these veins (samples 39-1 and 39-1.1, pl. 1) for gold revealed values ranging from 0.3 to 0.5 ppm. Sample 105-2 (fig. 4) contains only 5 ppb, thus indicating the gold content of the exposed quartz veins in the quartz monzonite is low. Local stibnite-bearing lenses and pods within the contact zone contain up to 27 pprn gold (Forbes and others, 1968). Stibnite is apparently the only sulfide common in the quartz monzonite; no galena or pyrite were found in any of the veins.
Although excavations in the Flume Creek pluton are few, there appears to be no mineralization in the stock.
Table 3. Atomic-absorption analyses of quartz veins from the Fox Creek pluton; all values in ppm.
Sample Sample no. 39-1
type Grab
39-1.1 Grab 3 3 620 210 4 5 0.3 4 105-2 Chip 4 6 0 9 4 0.005 0.2 105-3 Gouge 2 1 6 8 3 9 43 0.015 0.2
A geochemical survey revealed a molybdenum anomaly over the Birch Creek schist near the contact with the Fox Creek pluton. The significance of this anomaly is discussed in a later section.
Excavations within the quartz monzonite are less numerous than those in the quartz diorite, and thus it is difficult to accurately assess the po- tential of these areas. On the basis of areas that are exposed, it appears that the quartz monzonite is more weakly mineralized, even though it has been modified by hydrothermal activity.

. .
PROPOSED SEQUENCE OF HYDROTHERMAL EVENTS
A model (based on field and laboratory evidence) of the various magmatic and hydrothermal events is shown on plate 3. The inferred sequence is:
Stage 1.: Initial emplacement of the quartz diorite-granodiorite stock. The more mafic variant is the common rock type at the Silver Fox Mine.
Stage 2: Initial cooling of the intrusion with attendant development of tensional fractures caused by shrinkage.
Stage 3: Late magmatic fluids containing silica, molybdenum, 2 copper, 2 tungsten were introduced along the stockwork fracture system that resulted from stage 2. Molybdenite was deposited along the contacts of the stockwork and as disseminations within the quartz veins. Scheelite is present as fracture fillings and disseminations. Sericitization of the wallrock may have occurred at this time.
Stage 4 : Further cooling of the intrusive and movement along the quartz- filled stockwork fractures resulted in smearing of molybdenite along the contacts. This movement also resulted in fracturing of the quartz veins.
Stage 5: A carbonate phase was introduced along dilatant fractures, replaced some quartz, and filled the small-scale fractures in the stockwork to form calcite veinlets.
Stage 6: Additional faulting resulted in the uplift of 'molybdenum-rich' stockwork against 'molybdenum-poor' stockwork.
tage 7: Further thermal collapse of the system made the environment suitable for deposition of lead, zinc, iron, arsenic 2 copper sulfides along joint planes and shear zones. This resulted in veins of argentiferous galena, sphalerite, pyrite 2 chalcopyrite, and arsenopyrite. Because these veins are crosscut by calcite stringers, stages 5 and 6 may be reversed or a later calcite event occurred with ore deposition.
Stage 8: Renewed activity and differentiation at depth resulted in the formation of the late-stage quartz monzonite magma that was emplaced along the contact area of the,quartz diorite.
Stage 9: Residual fluids rich in silica, alumina, and potash accumulated within the chamber.
Stage 10: A potassic-fluid phase was introduced along dilatant fractures at depth, invaded the area of the quartz-molybdenite stockwork, and entered preferential zones within the quartz monzonite. These fractures offset the quartz veins of the stockwork. In some areas, potassium-feldspar alteration of the stockwork resulted in remnant quartz cut by calcite veinlets surrounded by orthoclase laths (fig. 1 4 ) . The potassium-feldspar flooding was not pervasive, and most of the original quartz stockwork was unaffected.
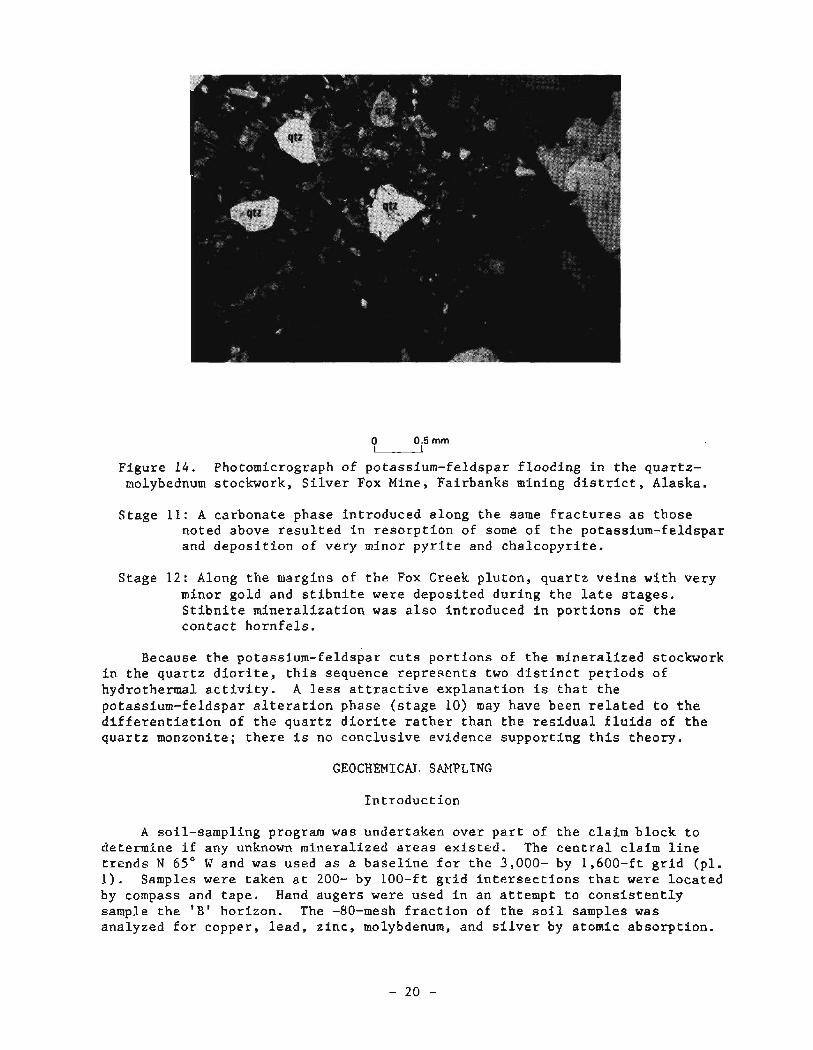
Figure 14. Photomicrograph of potassium-feldspar flooding in the quartz- molybednum stockwork, Silver Fox Mine, Fairbanks mining district, Alaska.
Stage 11: A carbonate phase introduced along the same fractures as those noted above resulted in resorption of some of the potassium-feldspar and deposition of very minor pyrite and chalcopyrite.
Stage 12: Along the margins of the Fox Creek pluton, quartz veins with very minor gold and stibnite were deposited during the late stages. Stibnite mineralization was also introduced in portions of the contact hornfels.
Because the potassium-feldspar cuts portions of the mineralized stockwork in the quartz diorite, this sequence represents two distinct periods of hydrothermal activity. A less attractive explanation is that the potassium-feldspar alteration phase (stage 10) may have been related to the differentiation of the quartz diorite rather than the residual fluids of the quartz monzonite; there is no conclusive evidence supporting this theory.
GEOCHEMICAL SAMPLING
Introduction
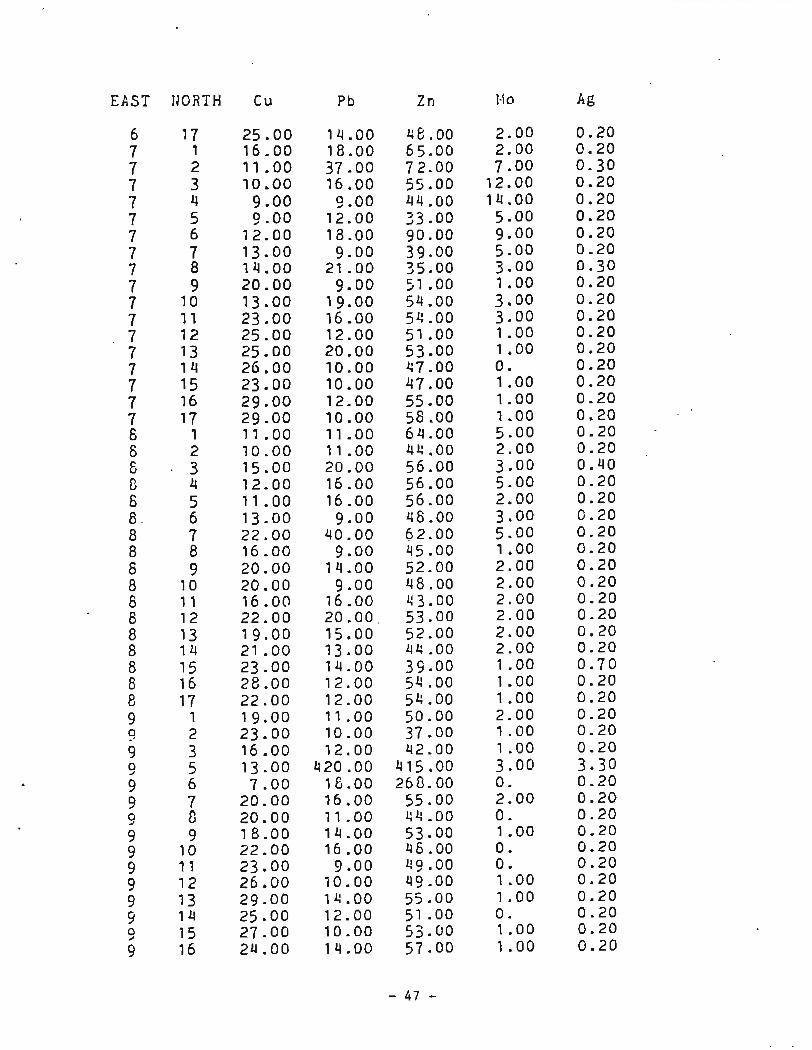
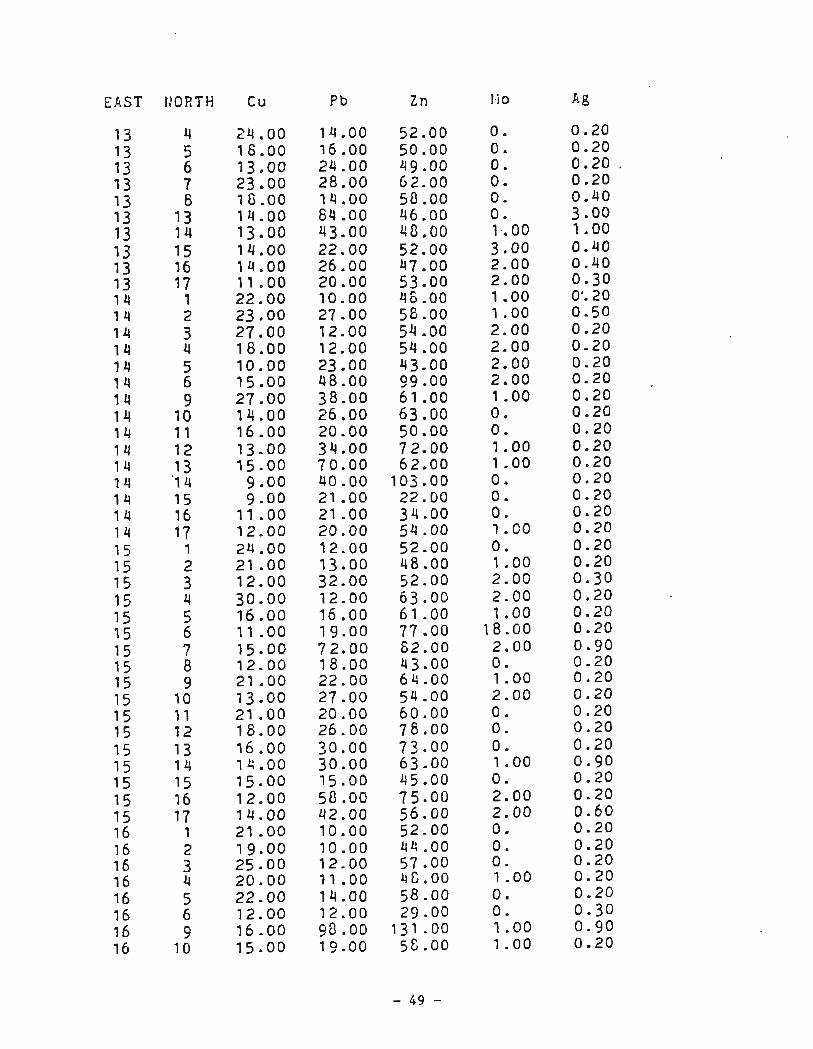
A soil-sampling program was undertaken over part of the claim block to determine if any unknown mineralized areas existed. The central claim line trends N 65' W and was used as a baseline for the 3,000- by 1,600-ft grid (pl. 1). Samples were taken at 200- by 100-ft grid intersections that were located by compass and tape. Hand augers were used in an attempt to consistently sample the 'B' horizon. The -80-mesh fraction of the soil samples was analyzed for copper, lead, zinc, molybdenum, and silver by atomic absorption.
Permafrost and contamination were the two main problems encountered in the sampling program. The presence of permafrost on most north-facing slopes made sampling of the 'B' horizon difficult. At a few locations, only the upper portion of the 'A' horizon was accessible; hence, analyses for these samples may not be comparable with the rest of the survey.
Contamination from the large number of excavations on the property also presents a problem in the treatment of the data. Dispersion from open mineralized areas caused elevated values downslope. These were recognized by their proximity to mineralized areas and confirmed in one case by trenching. Appendix C contains the data used to determine threshold and contour the elemental distribution.
Samples suspected of contamination and those which were verified as such were eliminated from the data set in determining threshold values because they do not represent the true distribution of elements in the undisturbed soil.
Determination of Threshold
Proper identification of threshold is necessary to define anomalous areas and to effectively separate them from the background population. Where possible, the method of Sinclair (1976) was applied to the modified data set to define areas of interest. Cumulative probability plots were constructed to determine the nature of the individual elemental populations.
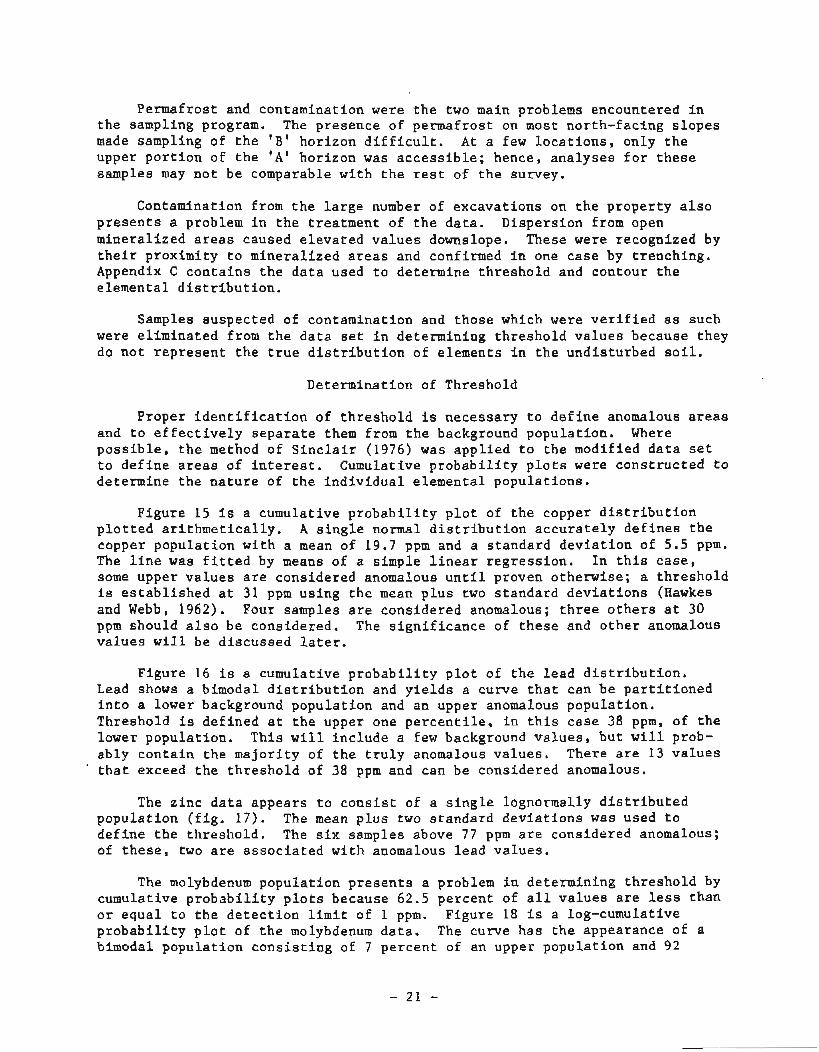
Figure 15 is a cumulative probability plot of the copper distribution plotted arithmetically. A single normal distribution accurately defines the copper population with a mean of 19.7 pprn and a standard deviation of 5.5 ppm. The line was fitted by means of a simple linear regression. In this case, some upper values are considered anomalous until proven otherwise; a threshold is established at 31 pprn using the mean plus two standard deviations (Hawkes and Webb, 1962). Four samples are considered anomalous; three others at 30 pprn should also be considered. The significance of these and other anomalous values will be discussed later.
Figure 16 is a cumulative probability plot of the lead distribution. Lead shows a bimodal distribution and yields a curve that can be partitioned into a lower background population and an upper anomalous population. Threshold is defined at the upper one percentile, in this case 38 ppm, of the lower population. This will include a few background values, but will prob- ably contain the majority of the truly anomalous values. There are 13 values that exceed the threshold of 38 pprn and can be considered anomalous.
The zinc data appears to consist of a single lognormally distributed population (fig. 17). The mean plus two standard deviations was used to define the threshold. The six samples above 77 pprn are considered anomalous; of these, two are associated with anomalous lead values.
The molybdenum population presents a problem in determining threshold by cumulative probability plots because 62.5 percent of all values are less than or equal to the detection limit of 1 ppm. Figure 18 is a log-cumulative probability plot of the molybdenum data. The curve has the appearance of a bimodal population consisting of 7 percent of an upper population and 92
d = 31 ppm
'j?= 19.7 ppm I \ 8 - 5.5 ppm
Figure 15. Cumulative p r o b a b i l i t y p l o t of copper d i s t r i b u t i o n , S i l v e r Fox Mine, Fairbanks mining d i s t r i c t , Alaska.
percent of a lower populat ion. Actual ly , t h r e e popula t ions e x i s t : a ) an upper anomalous, b) a lower background, and c) a t runcated background popula t ion t h a t is below t h e d e t e c t i o n l i m i t . Although t h e curve i n f i g u r e 18 i s def ined by only e i g h t p o i n t s , p a r t i t i o n i n g appears f e a s i b l e . Taking t h e upper one p e r c e n t i l e of t h e lower popula t ion y i e l d s a 4 ppm threshold . Thus def ined, 32 samples a r e anomalous i n molybdenum.
I n t h e case of t h e s i l v e r d i s t r i b u t i o n , no t much can be s a i d because 96 percent of t h e v a l u e s f a l l a t o r below t h e d e t e c t i o n l i m i t of 0.2 ppm. I n t h i s case , anything above 0.2 ppm is considered anomalous because it . represen t s only 9.5 percent of t h e t o t a l populat ion. This r e s u l t s i n 23 anomalous samples.
S ign i f i cance of Anomalous Values
I n d i scuss ing t h e anomalies recognized dur ing t h e s tudy, t h e g r i d l i n e s t h a t run N 65' W have been des ignated a s ' E , ' and t h e l i n e s t h a t run N 25' E have been l abe led 'N ' f o r r e fe rence only.
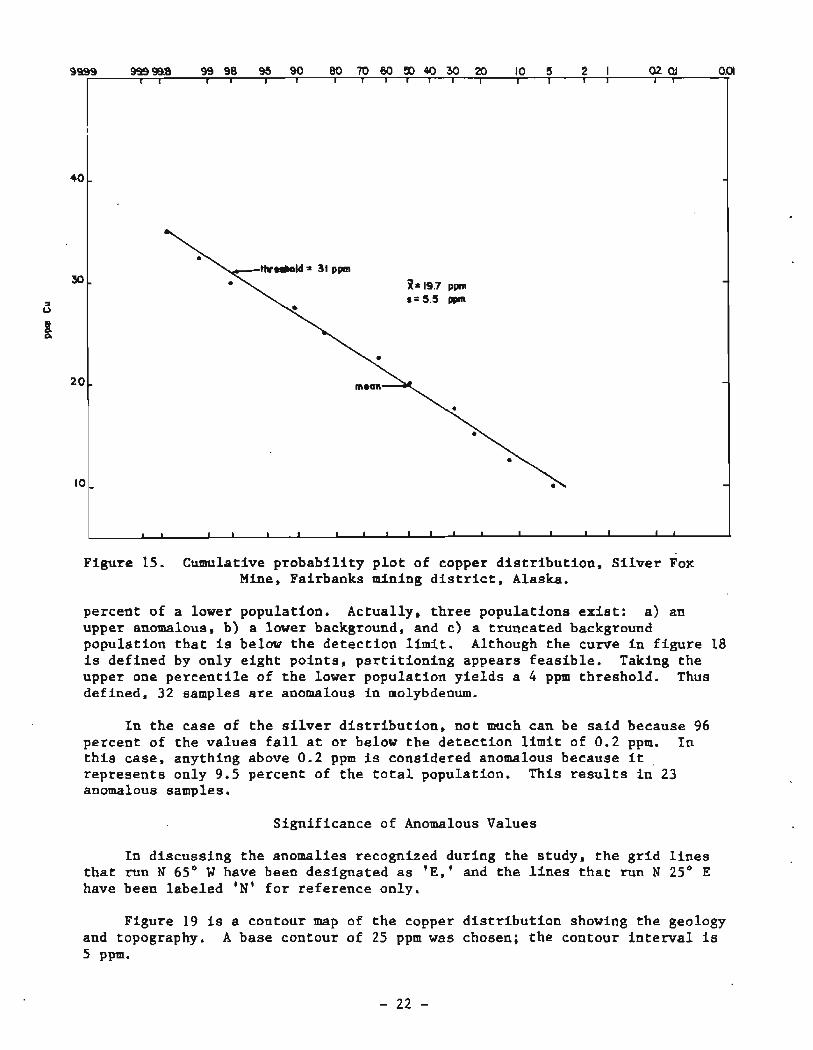
Figure 19 i s a contour map of t h e copper d i s t r i b u t i o n showing t h e geology and topography. A base contour of 25 ppm was chosen; t h e contour i n t e r v a l is 5 PPm.

anomalous
\
Figure 16. Cumulative p r o b a b i l i t y p l o t of l ead d i s t r i b u t i o n , S i l v e r Fox Mine, Fairbanks mining d i s t r i c t , Alaska.
The anomaly a t 12E-9N is b a r e l y above th resho ld , wi th t h e maximum va lue reaching 36 ppm. No o t h e r elements reach anomalous propor t ions i n t h i s a rea . However, t h e sample does occur ad jacen t t o a p a r t i a l l y minera l ized p i t and may be a f a l s e anomaly. On l i n e 2E sample 16N, a va lue of 31 ppm was obtained. This sample occurs away from a l l known excavations and is probably a t r u e anomaly. The sample s i t e occurs wi th in t h e Birch Creek s c h i s t . No minera l i za t ion o t h e r than s t i b n i t e and gold has been recognized i n these rocks on t h e S i l v e r Fox Mine property. On l i n e 10E-14N, a sample wi th 33 ppm copper w a s c o l l e c t e d . This i s no t much above threshold , bu t no apparent source of contamination e x i s t s , and t h e anomaly should be i n v e s t i g a t e d f u r t h e r .
No obvious t r e n d s a r e apparent i n t h e copper d i s t r i b u t i o n except t h a t most va lues above 25 ppm occur over t h e quar tz d i o r i t e . No such va lues a r e p resen t over t h e Fox Creek pluton. This was a n t i c i p a t e d because no s u l f i d e minera l i za t ion of n o t e has been exposed i n t h e quar tz monzonite.
F igure 20 shows t h e r e l a t i o n s h i p of t h e l ead d i s t r i b u t i o n t o t h e geology. Five anomalies occur over t h e survey a r e a , and a l l bu t one occur i n t h e quar tz d i o r i t e . Sample 5E-7N con ta ins 70 ppm lead and is surrounded by lower anomalous va lues . This sample occurs wi th in t h e con tac t h o r n f e l s zone of t h e Fox Creek pluton. The a r e a i s charac te r i zed by q u a r t z - b i o t i t e s c h i s t c u t by

Figure 17. Log-cumulative probability plot of zinc distribution, Silver Fox Mine, Fairbanks mining district, Alaska.
9999 99.9998 99 98 95 90 80 60 !!O 40 3 20 I0 5 2 I I I I I I I I 1 1 1 1 1 I Q2 OJ OX) I
quartz monzonite dikes that range from 2 to 10 cm in width. Molybdenum and silver are also anomalous at this site (figs. 21, 22). Anomalies centered at 13E-13N and 15E-7N are apparently the result of dispersion from mineralized pits and the mine dump. Trenching at 13E-13N revealed no mineralization or alteration of the quartz diorite. The moderate anomalies, at 16E-13N and 16E-14N may be true anomalies, although these sample sites are directly downslope from the mineralized area of location 1 (pl. 1). Trenching may be warranted to confirm the above.
2.0,
The anomaly at 15E-16N should be investigated because it is away from mineralized areas and is probably not the result of contamination. Sample 13E-9N (68 ppm) occurs near the road and may be contaminated because mineralized material is scattered about the general vicinity. Trenching of the above sites could easily verify the presence of mineralization.
I I I I I 1
-
Lead is similar to copper in that it tends to be more concentrated within the quartz diorite. The anomalies of prime interest are those at 5E-7N and 1SE-16N because they are least likely to be the result of contamination. The soil survey was successful in outlining the dispersion trains of known mineralized areas, although the periphery of some of these anomalies may warrant closer inspection.

Figure 18. Log-cumulative probability plot of molybenum distribution, Silver Fox Mine, Fairbanks mining district, Alaska.
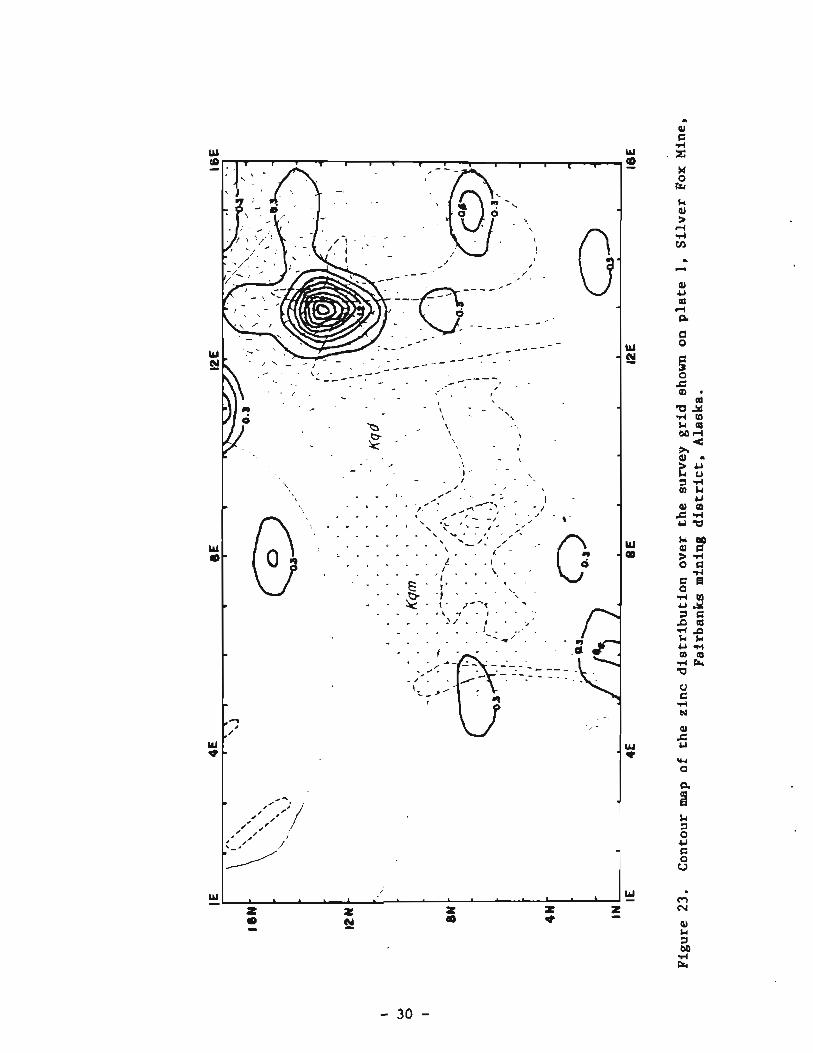
Figure 23 shows the zinc distribution over the survey grid. Of the four areas anomalous in zinc, two were rejected as false because they occur at the same locations as false lead anomalies. Anomalies centered at 14E-6N and 14E-14N are associated with known mineralization and coincide closely with the lead anomalies in the same area (fig. 20).
The anomalous area centered at llE-6N contains a high of 86 ppm zinc, but is adjacent to a mineralized pit and is probably the result of dispersion. Sample 7E-6N contains 90 ppm zinc and is associated with an excavation area subject to runoff and erosion. Although no specific zinc mineralization occurs within the pit--in quartz monzonite---the validity of the anomaly should be considered suspect. A small lead anomaly of 40 ppm occurs primarily within the pit area upslope from the zinc anomaly on line 7E.
Zinc tends to be anomalous within the quartz diorite. The anomaly within the quartz monzonite is undoubtedly due to dispersion from the pit. Correla- tion of zinc and lead anomalies is fairly good; three of the four zinc anomalies are associated with lead.
Figure 21 shows the molybdenum distribution over the survey grid. Two anomalous areas are present, the largest spanning lines 3E through 8E and 1N through 8N. Sample 4E-2N and 5E-6N contain 42 ppm and 44 ppm molybdenum, respectively. The area encompassed by the large anomaly is typically under-
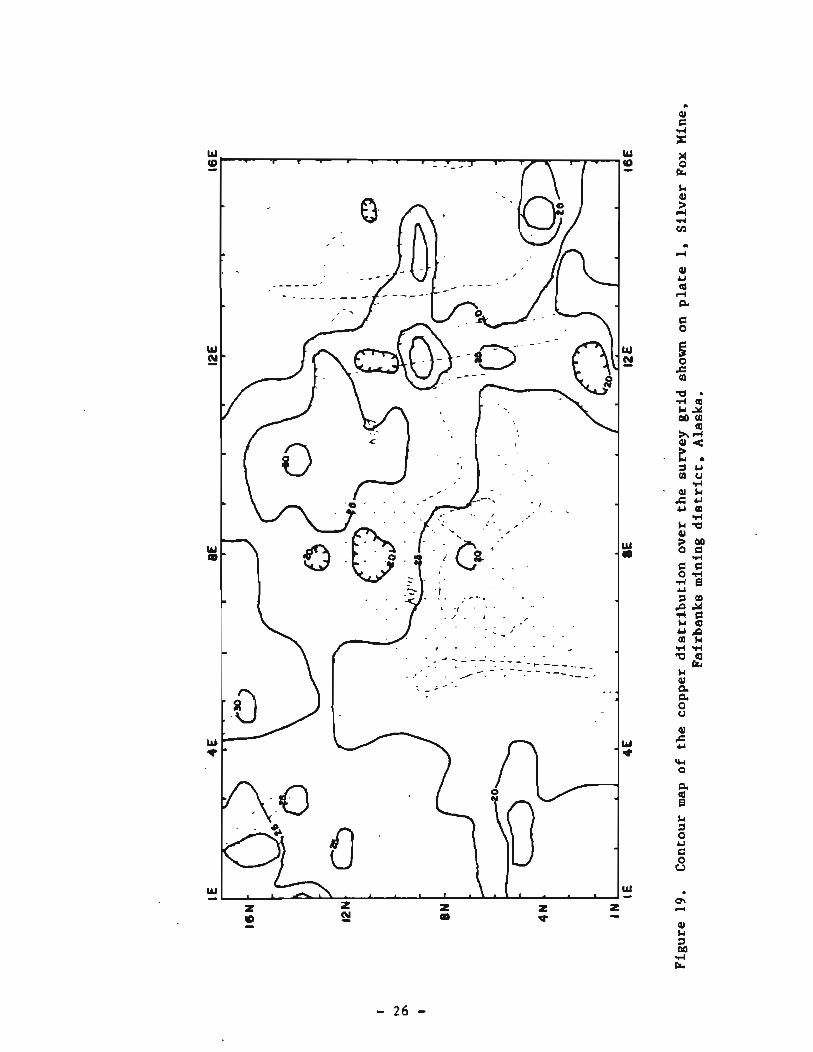
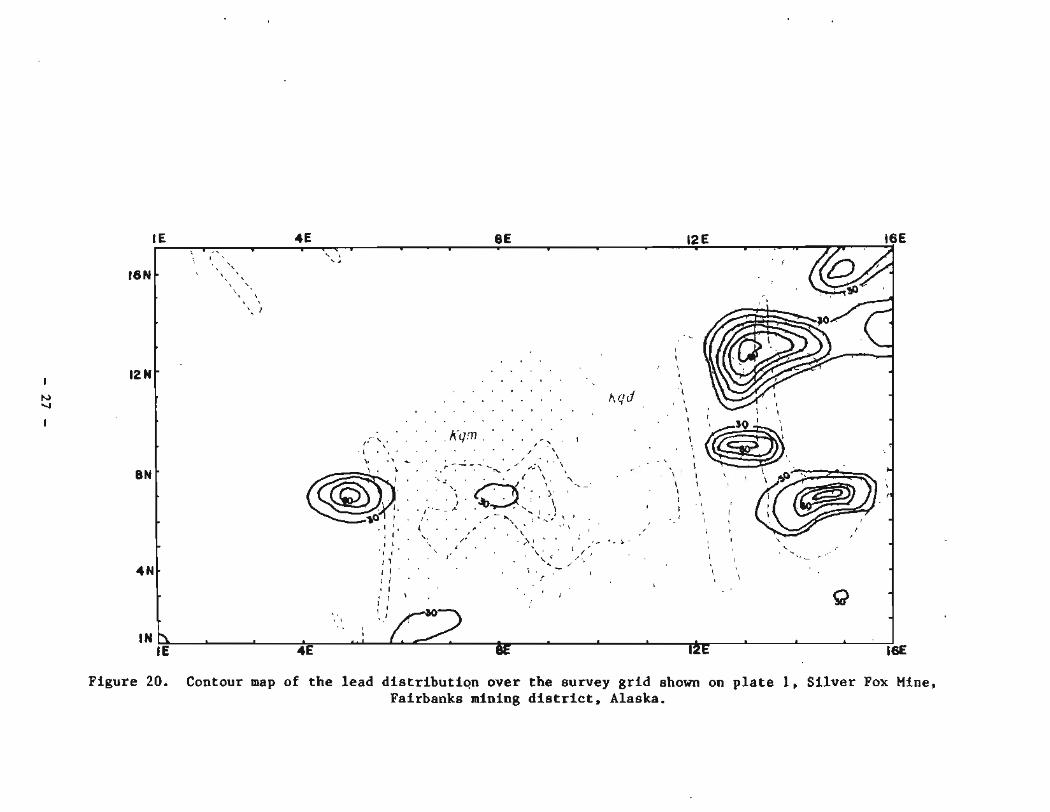
Figure 20. Contour map of the lead distr ibut ion over the survey grid shown on p l a t e 1, S i l v e r Fox Mine, Fairbanks mining d i s t r i c t , Alaska.

w, I I . . . . . . w, Z z Z X Z (D Q t - - G

Figure 22. Contour map of the s i l v e r d i s tr ibut ion over the survey gr id shown on p la te 1 , S i l v e r Fox Mine, Fairbanks mining d i s t r i c t , Alaska.
rd a r rl m L.c a Mrl
lain by the contact quartz-biotite hornfels that is cut by quartz monzonite dikes. A hand-dug hole in the region of 5E-6N revealed no mineralization, but rocks that match the above description were present. This anomalous area may be relatively enriched in molybdenum within the contact zone of the quartz monzonite.
The other anomaly of note occurs at 15E-6N and contains 18 pprn molybdenum. This sample is similar to others in that it occurs adjacent to a mineralized area and hence may be the result of dispersion.
The concentration of molybdenum along lines 3E through BE is interesting. A random grab sample of quartz monzonite (102-3, pl. 1) showed 'background' values of 14 pprn copper, 2 pprn molybdenum, and 15 pprn tungsten. Sample 102-3 is located approximately 350 ft from the 44 pprn molybdenum high and indicates that significant molybdenum enrichment must be present below the anomalous area. Sample 103-3 is from a quartz vein in schist that occurs within the contact zone. This sample contains 32 pprn copper, 134 pprn molybdenum, 360 ppb gold, and 115 pprn antimony. This sample lies within the anomalous zone and further illustrates the enrichment in the bedrock.
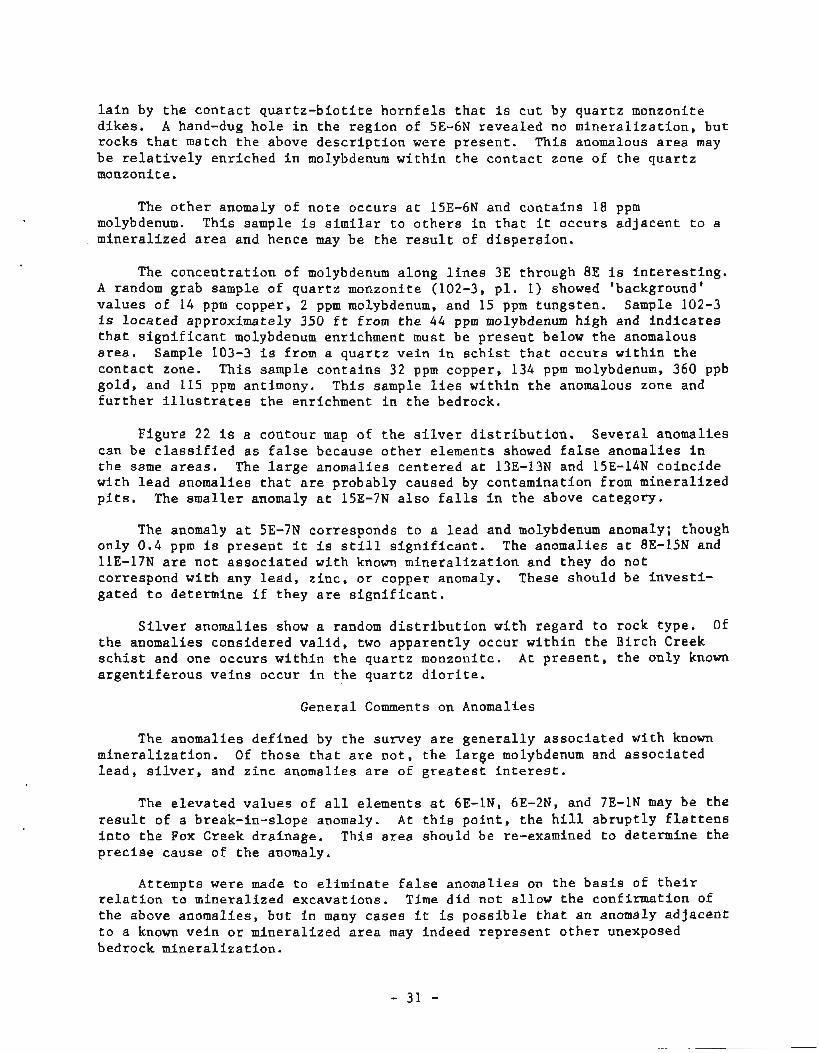
Figure 22 is a contour map of the silver distribution. Several anomalies can be classified as false because other elements showed false anomalies in the same areas. The large anomalies centered at 13E-13N and 15E-14N coincide with lead anomalies that are probably caused by contamination from mineralized pits. The smaller anomaly at 15E-7N also falls in the above category.
The anomaly at 5E-7N corresponds to a lead and molybdenum anomaly; though only 0.4 pprn is present it is still significant. The anomalies at BE-15N and llE-17N are not associated with known mineralization and they do not correspond with any lead, zinc, or copper anomaly. These should be investi- gated to determine if they are significant.
Silver anomalies show a random distribution with regard to rock type. Of the anomalies considered valid, two apparently occur within the Birch Creek schist and one occurs within the quartz monzonite. At present, the only known argentiferous veins occur in the quartz diorite.
General Comments on Anomalies
The anomalies defined by the survey are generally associated with known mineralization. Of those that are not, the large molybdenum and associated lead, silver, and zinc anomalies are of greatest interest.
The elevated values of all elements at 6E-IN, 6E-2N, and 7E-1N may be the result of a break-in-slope anomaly. At this point, the hill abruptly flattens into the Fox Creek drainage. This area should be re-examined to determine the precise cause of the anomaly.
Attempts were made to eliminate false anomalies on the basis of their relation to mineralized excavations. Time did not allow the confirmation of the above anomalies, but in many cases it is possible that an anomaly adjacent to a known vein or mineralized area may indeed represent other unexposed bedrock mineralization.

Magnetic Survey
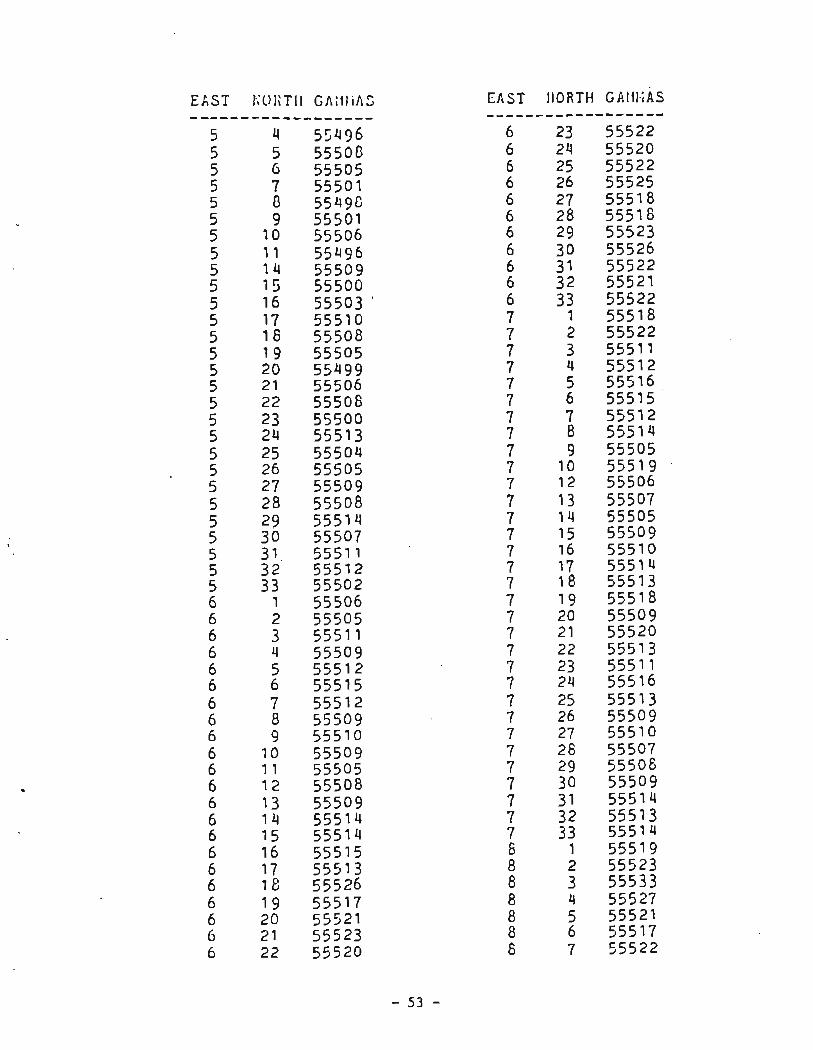
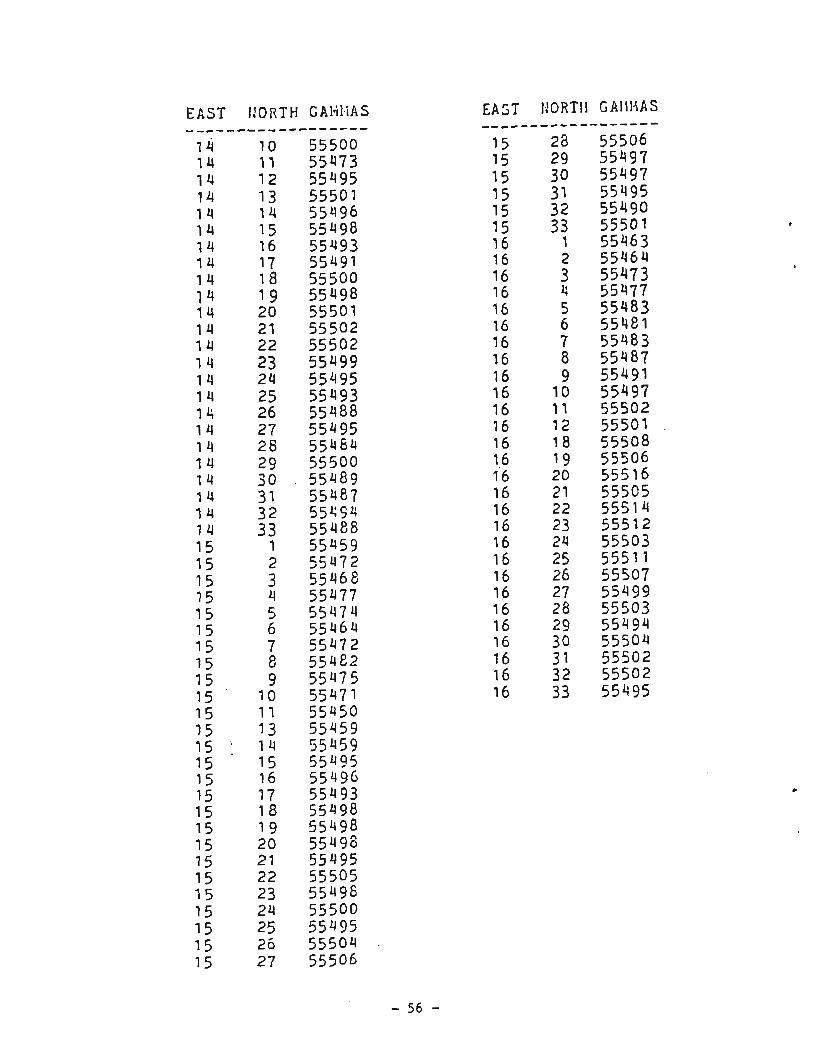
A magnetic survey was conducted in conjunction with the geochemical sampling program to determine if any unique geomagnetic signature was present over the sample area. Readings were taken on the N 25' E lines at 50-ft intervals using a proton precession magnetometer (app. D).
The total magnetic field data was converted to vertical magnetic field (2) data using an inclination of 77 degrees as determined from the College Observatory. Drift variations were corrected using the records from the College Observatory, located approximately 15 mi from the mine site.
Figure 24 is a computer-generated magnetic contour map. The most striking trend is the concentration of values that are less than the 55,500-gamma base contour in the southeastern portion of the sample area. Although the entire mineralized area is not characterized by these relatively lower values, areas 'A' and 'B' are regions of relative magnetic lows and both occur in mineralized pits. Sulfide minerals tend to have a low magnetic susceptibility and can sometimes be located by means of a detailed survey (Telford and others, 1976). The altered rocks of the mineralized pits may also have caused lower readings because of the destruction of higher susceptibility mafic minerals. Thus, these two relative magnetic lows may result from combined characteristics of the sulfide minerals and the altered wallrock. The 200-ft spacing causes an uneven data interval in the roughly east-west direction. Hence, the width of the low regions was probably exaggerated during contouring. Examination of the data for line 10E (area 'A') shows a low of 55,380 gammas at point 12N. Values north and south of this are also low but increase away from the 55,380 minimum. These two anomalous lows are therefore the result of alteration and possible sulfide- mineral accumulations.
The anomalous high in the northwestern region of the sample area is unexplained because it apparently occurs within the Birch Creek schist. No data were collected for line 2E; hence, the contouring process may have exaggerated the width of the anomaly.
In terms of a porphyry model, a magnetic high in the peripheral regions of the phyllic zone might be expected. The relative high that occurs adjacent to the low on line 10E falls in the loosely defined potassic alteration zone, although it is quite close to the sericitic zone.
In general, it does not appear that the magnetic features can be related to a classical porphyry system. The lows appear to represent altered mineralized areas in which the ferromagnesian minerals have been generally depleted.
SUGGESTIONS AND RECOMMENDATIONS
The following speculations on the mineral potential of the Silver Fox Mine area are made in the context of current knowledge of the area from this and previous studies.


Sulfide-vein Potential
Sulfide veins are exposed at locations 3, 4, and 5 on the surface (pl. 1) and in the underground workings (pl. 2). Of these locations, 3 and 4 have been mined out by surface methods to the near-practical limit. The underground vein has been exposed by drifting during development work (as shown on pl. 2) and no stoping has been done. Location 5 contains sulfides in an irregular reticulating-vein system, and further excavation is required to determine if they could be successfully mined at a small scale. Presently the underground vein appears to be the only one readily amenable to mining.
Several factors affect the mineability of the sulfide veins. The narrow vein width requires relatively high-grade ore for a profitable mining venture. Two chip samples across a hypothetical mining width of 3 ft were taken under- ground to evaluate the expected mineable grade. Table 1 lists the results of these samples. In a mining operation of this nature, precious metals would be of primary interest because tonnages will probably be low and lead-zinc production on an economic scale is not possible. Gold values range from 0.1 to 1.9 ppm and silver ranges from 2.3 to 6.6 ounces per ton, making the value per ton of ore less than $100 at present prices. This value per ton is probably not high enough to maintain the small-scale mining operation that would be required given the apparently low tonnages.
Because the veins are often joint fillings, they tend to be discontinuous and subject to local pinching and swelling. Faulting is a major consideration in the feasibility of an operation where grade and tonnage are critical factors. Figure 10 shows a map of location 3 (pl. 1) where three subparallel veins existed prior to opencast mining. These veins were isolated both laterally and vertically by faulting, and cut off to the west by a shear zone and to the east by a steeply dipping fault. The extension of these veins has not been located on either side of the faults. If this situation can be considered typical, mine planning and development would be difficult, especially in view of the vein width and grades involved.
Sulfide veins presently exposed appear marginal as a target for under- ground development. It is not likely that underground development would be profitable. High-grading of surface exposures may be profitable in a very limited sense because pit development below a depth of 18 to 20 ft becomes uneconomical in terms of mining a 4 to 12 in. vein. Further exploration may reveal veins that could warrant underground development, but structural constraints will probably adversely affect any mining effort unless widths and grades are considerably greater than those currently exposed.
Low-grade Gold Potential
Forbes and others (1968) sampled the reticulated-vein system in the quartz diorite (fig. 25) and suggested that this area may be amenable to bulk mining for gold. Six channel samples were taken over the mineralized area to obtain a representative analysis of the vein system. Table 4 lists these results and those from three grab samples of the vein material.

0 Qua& diode
,/ Strike ond dip of f d t Y ./pit bcwdory
/ auat r"e i"
0 Grob ample
I
Approximote bowlory of the
Figure 25. Pit map of the reticulated-vein system in the quartz diorite (loc. 5, pl. l), Silver Fox Mine, Fairbanks mining district, Alaska.
Table 4. Atomic-absorption analyses of samples from the reticulated-vein system in quartz diorite. All values in ppm unless otherwise noted.
Sample Sample no. type Cu Pb Zn - - Mo - Sb A u k -
grab 362 5.6% 2400 228 4.5 500 1050 channel (8 ft) 103 2.35% 3100 121 0.8 79 246 channel (10 ft) 54 3110 3800 24 0.3 24 7 0 channel (13 ft) 63 3110 5 200 20 0.1 2 1 4 7 channel (10.5 ft) 112 2185% 1400 99 0.8 91 224 channel (15.5 ft) 69 9410 3800 132 0.5 3 2 95 grab 155 6.30% 1200 520 7.5 226 560 grab 78 3890 4100 77 0.7 3 8 118
Weighting the samples on a foot-assay product basis yields an average of 0.014 ounce per ton gold, 1.34 ounce per ton silver, 0.012 percent copper, 1.259 percent lead, 0.358 percent zinc, 0.008 percent molybdenum, and 0.025 percent antimony. Using values of $500 per ounce for gold and $10 per ounce for silver, the material has a precious-metal value of approximately $20 per ton, a value not high enough to sustain mining. Grab samples of sulfide veins were not included in these averages and although they will add to the overall grade of the material, the effect is probably not enough to bring the grade up to an economic level. Potential for high-grading the veins is present, although bulk mining of the entire reticulated system does not appear feasible.
Potential for Molybdenum and Copper Production
Any estimates of the potential for molybdenum and copper production are based on limited observations, specifically in that portion of the mineralized stockwork exposed underground and the one occurrence of chalcopyrite and molybdenite at location 38-2 (pl. 1).
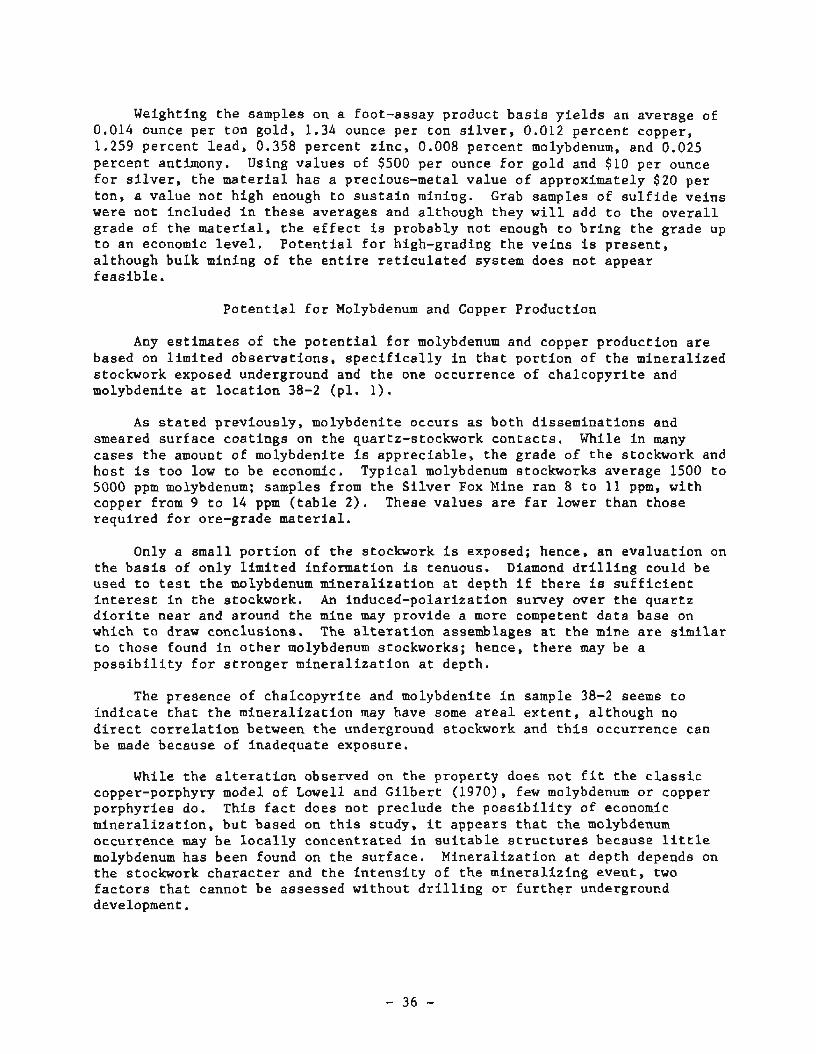
As stated previously, molybdenite occurs as both disseminations and smeared surface coatings on the quartz-stockwork contacts. While in many cases the amount of molybdenite is appreciable, the grade of the stockwork and host is too low to be economic. Typical molybdenum stockworks average 1500 to 5000 ppm molybdenum; samples from the Silver Fox Mine ran 8 to 11 ppm, with copper from 9 to 14 ppm (table 2). These values are far lower than those required for ore-grade material.
Only a small portion of the stockwork is exposed; hence, an evaluation on the basis of only limited information is tenuous. Diamond drilling could be used to test the molybdenum mineralization at depth if there is sufficient interest in the stockwork. An induced-polarization survey over the quartz diorite near and around the mine may provide a more competent data base on which to draw conclusions. The alteration assemblages at the mine are similar to those found in other molybdenum stockworks; hence, there may be a possibility for stronger mineralization at depth.
The presence of chalcopyrite and molybdenite in sample 38-2 seems to indicate that the mineralization may have some areal extent, although no direct correlation between the underground stockwork and this occurrence can be made because of inadequate exposure.
While the alteration observed on the property does not fit the classic copper-porphyry model of Lowell and Gilbert (1970), few molybdenum or copper porphyries do. This fact does not preclude the possibility of economic mineralization, but based on this study, it appears that the molybdenum occurrence may be locally concentrated in suitable structures because little molybdenum has been found on the surface. Mineralization at depth depends on the stockwork character and the intensity of the mineralizing event, two factors that cannot be assessed without drilling or further underground development.

COMPARISON WITH OTHER MOLYBDENUM STOCKWORKS
Stockwork-molybdenum deposits have been classified into calc-alkalic, high-potassium calc-alkalic (Climax type), and alkalic (Westra and Keith, 1981). Calc-alkaline deposits tend to be small, low-grade deposits exhibiting low fluorine and tin levels. Alkalic deposits include the Climax type and are generally higher grade, larger tonnage deposits located in a back-arc spreading environment. Typical host rocks for the alkalic-type deposits include rhyolite, quartz latite, granite, monzonite, syenite, and leucogranite.
The calc-alkaline-type deposits have been divided on the basis of host into stock and plutonic types. These deposits have also been termed granodiorite-molybdenum systems by Mutschler and others (1981). In terms of alteration and mineralization, these systems show a closer relationship to Cordilleran porphyry-copper deposits than to alkalic molybdenum stockworks.
The Silver Fox Mine system can be classified as a calc-alkalic molybdenum stockwork. Table 5 compares some of the aspects of a typical calc-alkalic stockwork to that of the Silver Fox Mine.
Table 5. Comparison of a typical calc-alkalic stockwork molybdenum deposit with the Silver Fox Mine, Fairbanks mining district, Alaska.
Aspect Typical deposit Silver Fox Mine
Host rock
Alteration
Tectonic setting
Porphyry textures
Flourine
Quartz diorite granodiorite
Quartz diorite to quartz monzonite
Potassic, phyllic, Potassic, weak phyllic, argillic, propylitic poorly defined argillic,
propylitic
Convergent plate margin
Continental crust
Yes Yes
Low Low to absent, no macroscopic evidence
Tin Trace Absent (?)
Tungsten Scheelite Scheelite
Molybdenum grade 0.1 to 0.25% <O. 1%
Associated minerals
Pyrite with minor chalcopyrite, galena, sphalerite, and pyrrhotite
Pyrite, major sulfide veins of galena, sphalerite, and pyrite

CONCLUSIONS
The mineralization at the Silver Fox Mine is the result of two mineralizing events, the first associated with the quartz diorite intrusive, and the second with the quartz monzonite. The mineralization in the quartz diorite appears to represent a collapsing hydrothermal system as evidenced by the presence of high and low temperature phases in close proximity. Cooling of the quartz diorite resulted in deposition of molybdenite through fissure- vein sulfides as the stability fields changed as a function of temperature. The differentiation of the quartz monzonite resulted in the potassium-feldspar alteration phase that affected both the quartz diorite and the quartz monzonite.
Alteration assemblages are similar to those in porphyry systems although they tend to be weakly developed. The stockwork mineralization and alteration is considered the result of a weakly developed porphyry system that thermally collapsed on itself. Because the portion of the intrusive exposed appears to be the hood zone, the character of the alteration and mineralization at depth may be quite different. Thus, additional underground information is necessary to definitively evaluate the occurrence. Diamond drilling would resolve the nature of the stockwork character at depth.
At the present time, the potential of the mine is limited to high-grading of surface exposures of the sulfide veins and possibly the development of the vein underground. The principle deterrents to mining are the narrow, discontinuous nature of the veins and the relatively low tonnages.
REFERENCES CITED
Anonymous, 1913, Tanana Magazine, quartz edition. Britton, J.M., 1969, Petrology and petrography of the Pedro Dome plutons,
Alaska: Fairbanks, University of Alaska M.S. thesis, 41 p. Brown, J.M., 1962, Bedrock geology and ore deposits of the Pedro Dome area,
Fairbanks mining district, Alaska: Fairbanks, University of Alaska M.S. thesis, 137 p.
Chapman, R.M., Weber, F.R., and Taber, B., 1971, Preliminary geologic map of the Livengood Quadrangle, Alaska: U.S. Geological Survey Open-file Report 71-66, 2 sheets. a
Clark, K.F., 1972, Stockwork molybdenum deposits in the western Cordillera of North America: Economic Geology, v. 67, p. 731-758.
Forbes, R.B., 1982, Bedrock geology and petrology of the Fairbanks mining district, Alaska: Alaska Division of Geological and Geophysical Surveys Open-file Report 169, 68 p.
Forbes, R.B., and Brown, J.M., 1961, A preliminary map of bedrock geology of the Fairbanks mining district, Alaska: Alaska Division of Mines and Minerals Report 194-1.
Forbes, R.B., Pilkington, H.D., and Hawkins, D.B., 1968, Gold gradients and anomalies in the Pedro Dome-Cleary Summit area: U.S. Geological Survey Open-file Report, 43 p.
Forbes, R.B., and Weber, F.R., 1982, Bedrock geologic map of the Fairbanks mining district, Alaska: Alaska Division of Geological and Geophysical Surveys Open-file Report 170, 2 pl.

Foster, H.L., Weber, F.R., Forbes, R.B., and Brabb, E.E., 1973, Regional geology of the Yukon-Tanana Upland, Alaska, in Arctic Geology: American Association of Petroleum Geologists Memoir 19, p. 388-395.
Hawkes, H.E., and Webb, J.S., 1962, Geochemistry in Mineral Exploration: Harper and Row, New York.
Hill, J.M., 1933, Lode deposits of the Fairbanks district, Alaska: U.S. Geological Survey Bulletin 849-B, p. 29-163.
Lowell, J.D., and Gilbert, J.M., 1970, Lateral and vertical alteration- mineralization zoning in porphyry ore deposits: Economic Geology, v. 65, p. 373-408.
Meyer, C., and Hemley, J.J., 1967, Wall-rock alteration, in Barnes, H.L., ed., Geochemistry of hydrothermal ore deposits: New ~ork,Holt, Rinehart, and Winston, p. 166-235.
Mowatt, T.C., 1974, Petrologic studies in the Fairbanks district: Molybdenum mineralization at the Silver Fox Mine: Alaska Department of Geological and Geophysical Surveys Open-file Report 46, 29 p.
Mutschler, F.E., Wright, E.G., Ludington, S., and Abbot, J.T., 1981, Granite molybdenum systems: Economic Geology, v. 76, p. 874-897.
Prindle, L.M., Katz, F.J., and Smith, P.S., 1913, A geologic reconnaissance of the Fairbanks Quadrangle, Alaska: U.S. Geological Survey Bulletin 525, 200 p.
Sinclair, A.J., 1976, Applications of probability graphs in mineral explora- tion: B.C., Canada, Association of Exploration Geochemists, v. 4, 95 p.
Swainbank, R., 1971, Geochemistry and petrology of eclogitic rocks in the Fairbanks area, Alaska: Fairbanks, University of Alaska Ph.D thesis.
Telford, W.M., Geldart, L.P., Sheriff, R.E., and Keys, D.A., 1976, Applied geophysics: New York, Cambridge University Press, 860 p.
Westra, G., and Keith, S.B., 1981, Classification and genesis of stockwork molybdenum deposits: Economic Geology, v. 76, p. 844-873.

APPENDIX A
Q-A-P diagram and modes for typ ica l intrusive rocks i n the Si lver Fox Mine area, Fairbanks mining d i s t r i c t , Alaska.

S a m ~ l e & Q u a r t z K-fe ldsoar ~ l a g i o c l a s e
G r -- G r a n i t e Qm -- Quartz monzonite Gd -- G r a n o d i o r i t e Qd --. Quar tz d i o r i t e

APPENDIX B
Summary of rock and mineral analyses.

Sample C Cu P b I n 1.1 o Au I i g \'I Sb ........................................................ 36-1 680 9900 1160 8 7 0 975 - - 36-2 36 6900 2100 4 11.7 663 - - 36-3 130 6100 3500 20 13.3 345 - -
36-3.1 310 6800 1030 26 -0.1 85 - - 36-3.2 390 8900 1190 9 10.9 660 - - 36-3.3 230 9700 2500 18 1.3 135 - -
36-4 43 G700 340 51 1.6 41 - - 36-4.1 690 10100 1800 260 7.2 165 - -
38-1 130 9700 240 16 2.4 195 - - 38-2 1900 1040 330 130 -0.1 9 - - 39-1 G60 7900 152 170 0.5 49 - -
39-1 - 1 33 620 210 45 0.3 4 -. - 60-1 100 7700 19400 5 -0.1 79 - - 60-2 260 6500 39000 3 1.9 228 - - 60-3 14 146 8 1 11 -0.1 2 - - 60-4 13 490 93 9 -0.1 1 - 70-2 4000 9000 800 1 9 2.9 1120 - -
102-3 14 - - 2 - - 15 - 103-3 3 2 - - 134 0.36 - - 175 105-2 4 6 0 9 4 -0.1 0.2 - - 105-3 21 6 8' 3 9 43 -0.1 0.2 - - 107-1 149 29600 1600 35 0.83 91.9 - - 107-3 9 - - 8 - - 35 - 107-4 760 95500 37600 6 1.4 662 - - 112-1 362 5.65 2400 228 4 - 5 500 - 1050 112-2 103 2.35s 3100 121 0.8 79 - 246 112-3 54 3110 3800 24 0 3 24 - 7 0 112-4 63 3110 5200 20 0.1 21 - 47 112-5 112 2.95% 1400 99 0.8 91 - 224 112-6 6 9 9410 3800 132 0.5 32 - 95 112-7 155 6.3s 1200 520 7 . 5 226 - 560 112-8 7 8 3890 4100 77 0.7 38 - 118 ------------------------------------------------------------
"-" i n d i c a t e s no a n s l y s i s r e q u e s t e d .
A l l v s l u e s i n ' ppm.

APPENDIX C
Geochemical soil-sample analyses (all values in ppm).

i-i 0

EAST NORTH Cu

E A S T I JORTH
EAST i!Ol?iH

EAST fJORTli C u P b Zn

APPENDIX D
Corrected geomagnetic data from the geochemical-survey grid (all values in gammas).

EAST JIORTH CAI-il.lhS EAST 1JORTH GAI*il iAS ------------------ 3 1 9 55544 3 20 55550
EAST f ~ O ~ i T i 1 G A i l l i A S ------------------ 5 4 55436 5 5 55508 5 55505 5 7 55501 5 8 5549C

EAST iJDZTI4 CIiI*;I.IAS ------------------ 8 8 55520 8 9 55516 8 10 55515 8 11 55513 8 12 55508 8 13 55510 8 14 55503 8 15 55504 8 16 55513 8 17 55503
8 18 55514
EAST NORTH GIiI.II.iAS

EAST NORTI! G/tlil.IXS
EAST - -- - - 14 1 4 1 4 14 1 4 1 4 1 4 1 4 1 4 1 4 1 4 1 4 1 4 1 4 1 4 1 4 1 4 1 4 1 4 1 4 1 4 1 4 1 4 14 1 5 1 5 75 15 1 5 1 5 15 15 1 5 15 1 5
EAST 1,!ORTI1 GAIl l ' rAS ------------------ 15 28 55506 15 29 55497 15 30 55497 7 5 31 55495 15 32 55490 15 33 55501 16 1 55463 16 2 55464