state highway administration research report · the questionnaire data was utilized to better...
TRANSCRIPT

.
STATE HIGHWAY ADMINISTRATION
RESEARCH REPORT
EXPLORING TRAVELERS’ BEHAVIOR IN RESPONSE TO DYNAMIC MESSAGE SIGNS (DMS) USING A DRIVING
SIMULATOR
Mansoureh Jeihani Anam Ardeshiri
MORGAN STATE UNIVERSITY
Project Number SP209B4K FINAL REPORT
October 2013
MD-13-SP209B4K
Martin O’Malley, Governor Anthony G. Brown, Lt. Governor
James T. Smith Jr., Secretary Melinda B. Peters, Administrator

The contents of this report reflect the views of the authors who are responsible for the facts and the accuracy of the data presented herein. The contents do not necessarily reflect the official views or policies of the Maryland State Highway Administration. This document is disseminated under the sponsorship of the U.S. Department of Transportation, University Transportation Centers Program, in the interest of information exchange. The U.S. government assumes no liability for the contents or use thereof. This report does not constitute a standard, specification or regulation.

Form DOT F 1700.7 (8-72) Reproduction of form and completed page is authorized.
Technical Report Documentation Page1. Report No. MD-13-SP209B4K
2. Government Accession No. 3. Recipient's Catalog No.
4. Title and Subtitle Exploring Travelers’ Behavior in Response to Dynamic Message Signs (DMS) Using a Driving Simulator
5. Report Date October 2013
6. Performing Organization Code
7. Author/s Mansoureh Jeihani, Anam Ardeshiri
8. Performing Organization Report No.
9. Performing Organization Name and Address Morgan State University 1700 E. Cold Spring Lane Baltimore, MD 21251
10. Work Unit No. (TRAIS)
12. Sponsoring Organization Name and Address Office of Policy and Research Maryland State Highway Administration 707 N. Calvert St. Baltimore, MD 21202 National Transportation Center Morgan State University 1700 E. Cold Spring Lane Baltimore, MD 21251
11. Contract or Grant No. SP209B4K
13. Type of Report and Period Covered Final Report
14. Sponsoring Agency Code
15. Supplementary Notes
16. Abstract This research studies the effectiveness of a dynamic message sign (DMS) using a driving simulator. Over 100 subjects from different socio-economic and age groups were recruited to drive the simulator under different traffic and driving conditions and various travel-related DMS messages. The subjects drove between a specified pair of origin and destination while choosing their own route in a fairly realistic 12 × 12 mi2 (20 × 20 km2) network that included road signs, traffic signals, three-dimensional buildings and trees, and other roadside objects. Their driving behavior, including changes in driving speed, route choice and diversion, and travel time perception in the presence of DMS were studied. In addition to the driving simulatorexperiment, a stated preference analysis was conducted through three sequential survey questionnaires. The questionnaire data was utilized to better understand drivers’ perceptions of the efficiency-related attributes. The study concluded that DMS is a safe device, since drivers did not reduce their speed significantly to read the DMS contents. Furthermore, quantitative information provided by DMS affected drivers’ route choice significantly and drivers were quite sensitive to travel time change. However, the diversion rate due to a second DMS with qualitative information was much less than what the subjects stated in the survey. 17. Key Words: Dynamic Message Sign, Route Choice, ATIS, Driving Simulator
18. Distribution Statement: No restrictions This document is available from the Research Division upon request.
19. Security Classification (of this report) None
20. Security Classification (of this page) None
21. No. of Pages 46
22. Price

ii
TABLE OF CONTENTS EXECUTIVE SUMMARY .............................................................................................................1 INTRODUCTION ...........................................................................................................................2 LITERATURE REVIEW ................................................................................................................4
Route Choice/Diversion Analysis ........................................................................................4 Dynamic Message Signs ......................................................................................................5
METHODOLOGY ..........................................................................................................................7 Route Choice Simulator .......................................................................................................7 Network Creation .................................................................................................................8 Scenario Design .................................................................................................................10 Survey Questionnaires .......................................................................................................12 Recruitment Process...........................................................................................................13 Participants’ Characteristics ...............................................................................................14
RESEARCH FINDINGS AND DISCUSSION .............................................................................17 Attitude Analysis ...............................................................................................................17 Stated Preference Analysis ................................................................................................18 Revealed Preference Analysis ............................................................................................21 Speed Analysis ...................................................................................................................24 Simulation Sickness ...........................................................................................................28 Aggregate Route Choice Analysis .....................................................................................29 Disaggregate Route Choice Analysis .................................................................................32 Travel Time Analysis .........................................................................................................34 Route Diversion .................................................................................................................35
CONCLUSIONS AND LIMITATIONS .......................................................................................37 REFERENCES ..............................................................................................................................39

iii
List of Figures Figure 1. UC-win/Road Driving Simulator. ....................................................................................8 Figure 2. Schematic Features of UC-win/Road Driving Simulator .................................................8 Figure 3. Study Network Plan View in the UC-win/Road Simulator. .............................................9 Figure 4. Study Map and Alternatives. ..........................................................................................10 Figure 5. Driver’s View of the DMS1 for the Study Scenarios. ....................................................11 Figure 6. Driver’s View of the DMS2 for the Study Scenarios. ....................................................12 Figure 7. Human Subject Recruitment and Experiment Process. ..................................................14 Figure 8. Distribution of Number of Scenarios Driven per Subject. .............................................16 Figure 9. DMS Attention Level Based on Drivers’ DMS Exposure .............................................17 Figure 10. DMS Attention Level Based on Drivers’ Attitude toward DMS. ................................18 Figure 11. Average Stated Willingness to Divert Due to Five Qualitative DMS Contents ...........19 Figure 12. Stated Travel Time Anticipation for the Three Alternatives (Min) .............................19 Figure 13. Stated Willingness to Choose I-95 for Five DMS1 Scenarios based on △TT (TT95 –
TT295). .........................................................................................................................20 Figure 14. Stated Willingness to Divert to MD 295 Due to Four Qualitative DMS2 Contents. ...20 Figure 15. Route Choice Probability of I-95 for the Five Scenarios of △TT (TT95 – TT295). .......22 Figure 16. Choice Probability of I-95 Based on Drive Frequency for Five DMS Scenarios ........23 Figure 17. Choice Probability of I-95 Based on △TT for Two Drive Frequency Categories. ......23 Figure 18. Choice Probability of I-95 Based on △TT Scenarios and Drivers’ Familiarity ..........24 Figure 19. Description of the Four Segments for DMS1 Speed Analysis .....................................25 Figure 20. Description of the Four Segments for DMS2 Speed Analysis .....................................26 Figure 21. Aggregate Speed Variation in the Four Segments of the DMS1 Neighborhood .........26 Figure 22. Five Typical Speed Patterns and Disaggregate Distribution for DMS1 .......................27 Figure 23. Aggregate Speed Variation in the Four Segments of the DMS2 Neighborhood .........27 Figure 24. Simulation Sickness Symptoms. ..................................................................................29 Figure 25. Route Choice Distribution for Three Sources of Response ........................................30 Figure 26. Probability of Choosing I-95 for Three Sources of Response. .....................................30 Figure 27. Reliability of DMS Information (1: lowest to 5: highest) ............................................31 Figure 28. PTT versus ATT for the Entire Experiments (Left: Aggregate; Right: Disaggregate) 34 Figure 29. PTT versus ATT for Each Route in Each Scenario ......................................................35

iv
LIST OF TABLES Table 1. Description of the Five Scenarios ....................................................................................11 Table 2. Descriptive Statistics of Socioeconomic Data ................................................................15 Table 3. Distribution of the Five Scenarios ...................................................................................21 Table 4. Operational Specifications of I-95 and MD 295 ..............................................................22 Table 5. DMS1 Compliance Rate Analysis for SP and DS Approaches .......................................32 Table 6. Disaggregate Choice Comparison of SP and DS, First Scenario ....................................33 Table 7. Disaggregate Comparison of SP and DS for All Scenarios Combined ...........................33

v
ACKNOWLEDGEMENTS
The authors would like to thank the Maryland State Highway Administration for its funding support and input throughout the study. The authors also thank Morgan State University’s National Transportation Center for its funding support and continued encouragement of student participation in research projects. Shiva Narooienezhad, Arash Adeli, Shawn Ellerbe, and Christina Nzekwe played an important role in the data collection and their work is appreciated. The authors also thank Ms.Williams and Ms. Jones for their constant support.

1
EXECUTIVE SUMMARY
This research studies the effectiveness of a dynamic message sign (DMS) using a driving simulator. Over 100 subjects from different socio-economic and age groups were recruited to drive the simulator under different traffic and driving conditions and various travel-related DMS messages. The subjects drove between a specified pair of origin and destination while choosing their own route in a fairly realistic 12 × 12 mi2 (20 × 20 km2) network that included road signs, traffic signals, three-dimensional buildings and trees, and other roadside objects. Their driving behavior, including changes in driving speed, route choice and diversion, and travel time perception in the presence of a DMS were studied. In addition to the driving simulator experiment, a stated preference analysis was conducted through three sequential survey questionnaires. The questionnaire data was utilized to better understand drivers’ perceptions of the efficiency-related attributes. The study concluded that a DMS is a safe device, since drivers did not reduce their speed significantly to read the DMS contents. Furthermore, quantitative information provided by the DMS affected drivers’ route choice significantly and drivers were quite sensitive to travel time changes. However, the diversion rate due to a second DMS with qualitative information was much less than what the subjects stated in the survey.

2
INTRODUCTION
Intelligent transportation systems (ITS) play a vital role in traffic congestion management. One of the major elements of ITS that assists drivers to make more informed route decisions is the advanced traveler information system (ATIS). An ATIS aims to actuate the traffic stream in a desired way, most often toward a less congested network, using real-time traffic prediction information. Traveler information can be either personalized, such as in-vehicle information systems (IVIS), or non-personalized, which presents generic information on routing. In the latter case, real-time traffic information can be conveyed to drivers via a dynamic message sign (DMS), which is increasingly being deployed by traffic authorities around the world. A DMS provides quick information to motorists en-route about adverse road conditions, traffic incidents, travel time, speed control, managed lanes, traffic regulations, road construction, etc. A DMS is also known as a variable message sign (VMS) and a changeable message sign (CMS). MUTCD (2009), in chapter 2.L, defined a CMS as “a traffic control device that is capable of displaying one or more alternative messages” and suggested that a “CMS may be used by State and local highway agencies to display safety messages, transportation-related messages, emergency homeland security messages, and America’s Missing: Broadcast Emergency Response (AMBER) alert messages”. General messages that are unrelated to transportation or specific emergency conditions requiring actions from drivers are discouraged; and public advertisements are prohibited from being displayed on a DMS (MUTCD, 2009). The Oregon Department of Transportation (2008) defined a DMS as a traffic control device whose message can be changed manually, electrically, mechanically, or electromechanically to provide traffic information to motorists. The Colorado Department of Transportation (2005) required an effective DMS to fulfill a need, command attention, convey a clear simple meaning, command respect of road users, and give adequate time for proper response. The Florida State Highway System summarized the purposes of a DMS as providing information on a change in current or future traffic conditions, and informing motorists to change travel speeds, change lanes, and divert to a different route (Montes, 2008). Three main components to DMS messages are identified by Montes (2008): the problem, the location of the problem, and the recommended driver action. The State of New York (New York State Thruway Authority, 2011) has different types of VMSs, which are listed as stationary, portable, truck-mounted, and boards. However, there are several use limitations: the signs cannot be similar to an advertising display; the format cannot include animation, rapid flashing, or elements that characterize advertising. Message techniques such as fading, exploding, dissolving, or moving cannot be used; instead, they need to be clear and short and convey a single thought per panel, accurate and up-to-date. The Maryland State Highway Administration (SHA), along with other state agencies, has been using DMSs for traffic and incident management as well as travel time information, and plans to expand their application. Haghani et al. (2013) collected Bluetooth travel-time and route-diversion data and examined the traffic conditions under DMSs in Maryland to determine the accuracy of quantitative messages, to analyze traffic patterns, and to investigate the potential of DMS messages to cause congestion and safety risks. Focusing on Maryland highways, the study concluded that a DMS can be an accurate, effective, and safe device to convey real-time traffic

3
information to drivers and it can constantly operate as a safe, effective traffic management strategy. The key factor that assures a DMS attains its planned performance in traffic management is the level of drivers’ response to the displayed information with the lowest distractive impacts. It is postulated that providing relatively more traffic information in an effective way leads to overall better route choices and, ultimately, a more moderate network (Peeta et al., 2000; Erke et al., 2007; Tian et al., 2011; Jindahra and Choocharukul, 2013). This study aimed to analyze drivers’ behavior in response to a DMS in a simulated driving environment to better identify factors that influence drivers’ reaction to a DMS. The study findings provided a more realistic understanding of the effectiveness of DMS as a traffic management strategy. Both types of stated preference (SP) and driving simulator (DS) data were collected to explore drivers’ behavior. The typical reactions of drivers to a DMS, as a finding of this research, challenged the general speculation that travelers’ route choice is a predefined path prior to the start of a trip. SHA strives to ensure that posted messages are consistently informative, especially regarding incidents, so that drivers can make appropriate decisions regarding the recommended or desired route without significantly reducing their speed in order to read the message displayed. However, drivers respond to DMS messages differently and their reaction to the displayed messages will affect the usefulness of these signs. With this in mind, a study to identify the human factors involved (driver perception, reaction time, etc.) when displaying travel and safety-related messages will help SHA to assess the effectiveness of existing DMS message formats, make changes where necessary, and promote driver education and awareness.
Transportation researchers have been using the evolving DS technology for two decades to investigate drivers’ controlled behavior for various conditions (such as normal, fatigued, and drug-impaired). A DS is a valuable tool to explore the complex process of route decision making, as it varies in the presence of information. This is a novel topic that can enhance the current traffic assignment models based on real-time traffic information. Unlike destination choice and mode choice problems that normally take place under the full concentration of travelers and normal brain performance conditions, route choice problems include high cognitive load. This fact appears difficult to be properly addressed in traditional, questionnaire-based route choice analysis. The DS technique, however, supplies a more real environment to investigate the latent factors of route choice behavior. A comprehensive view of route choice behavior cannot be captured in any experiment but the DS. In a DS, unlike other methods, alternative routes are revealed when a driver chooses a route and also full information about all possible routes is available. In addition, the use of various information provisions and controlled traffic and environmental scenarios is not possible with these methods. Furthermore, drivers as test subjects are not likely to experience the same events and conditions. Therefore, simulation appears to be the best way to study route choice behavior.

4
LITERATURE REVIEW Route Choice/Diversion Analysis Route choice analysis in the presence of information has a long history in transportation planning literature; however, collecting appropriate data has been a major challenge to the transferability of route choice models. Travelers’ attitudes have been collected mostly through stated preference (SP) surveys, which do not necessarily coincide with their actual decisions. A field experiment, a precise but costly option, is not feasible to test various traffic information scenarios and environmental conditions. There are a few route choice studies based on driving simulator (DS) data; however, most of them were not able to fully replicate a transportation network inclusive of all viable alternatives and real traffic information. Koutsopoulos et al. (1994) applied the innovative technique of a DS for route choice analysis with a PC-based driving simulator that used two-dimensional graphics to collect data for building a route choice model, a diversion choice model, and a day-to-day travel pattern model in the presence of information. The focus was on simulator design characteristics with a case study of 10 subjects, each subject conducting 22 trips. An approximate reasoning model was then applied to analyze the simulation data. The experiment was performed on the network with three alternatives to test traffic scenarios with respect to different congestion levels, accidents, and information availability. The drivers at each intersection needed to use a mouse to click on the chosen link to drive on that link. Although a realistic driving condition was not provided, it was concluded that a DS is a useful tool to collect transportation data. Wardman et al. (1997) used the SP method and concluded that the provision of traffic information can highly affect route choice. Developing four competing alternatives, the authors found that the effectiveness of a DMS is dependent on message content, normal travel time, drivers’ characteristics, and past experiences. The study evaluated the effect of queue and delay qualitatively and delay was recognized as a more reliable measure than travel time to influence drivers’ route choices with high sensitivity. Peeta et al. (2000) focused on the effectiveness of DMS content on the route diversion problem. The researchers built behavioral models to predict the probability of individual route diversion under various message types based on a SP survey questionnaire. Drivers’ propensity to divert to a viable alternate route was measured, while the DMS presented various factors such as expected delay, weather and nighttime condition, incident clearance time, and their combinations. The results indicated that the more information in the DMS, the higher the probability to divert. Informing drivers of the location of an accident had no priority over only informing drivers of the accident’s occurrence. “Expected delay” and “best detour strategy” were found to acquire the highest change in driver decision, especially when the messages were supplemented with an incident’s occurrence or location. All explanatory variables in this model had binary values; for instance, age was divided into two groups, older or younger than 40 years old. Although the diversion propensity of responders were obtained under a 5-point Likert scale that ranged from strong unwillingness to strong willingness, a binary outcome variable (divert or not divert) was developed to build a binary logit model. The model was calibrated using 1,984 observations (248 subjects, 8 scenarios per each).

5
Tian et al. (2011) performed a series of driving simulator tests to investigate the strategic thinking ability of travelers. The statistical tests’ results showed that travelers, when planning for a trip in uncertain traffic conditions, think strategically and may take the risky routes. It was also concluded that network complexity decreased the travelers’ ability to consider diversion possibilities during the path when the information was provided. Driving tasks in simulator tests, unlike the PC-based survey, are associated with cognitive loads and impact the subjects’ strategic thinking ability in response to en-route information. In a study to better identify the heterogeneity of route choice behavior, Tawfik et al. (2011) challenged the rational behavior of drivers by monitoring revealed route choices of 50 drivers on a low-fidelity, real-time DS. The research’s virtual network contained two alternatives with an average travel time of 3 to 4 minutes. The study presented statistical models of route switching and demonstrated that inertia, route preference, and network experience significantly affected route choice behavior. Zhong et al. (2012) studied the potential factors on drivers’ guidance compliance behavior using graphical DMS scene simulation within a questionnaire survey to find out a better information release mode. The study found that respondents could not properly judge their route choice style. Using ordinal regression analysis, the authors concluded that age, driving years, annual mileage, income, driving style (risk-based, steady, and conservative), occupation, degree of trust in the DMS, route familiarity, and route choice style were significant factors to explain DMS guidance compliance behavior. Dynamic Message Signs DMS helpfulness under recurrent and non-recurrent traffic conditions has been evaluated widely in the literature. Many studies were conducted on understandability, clarity, and conciseness of DMS messages. Many researchers have investigated the relationship between drivers’ behavior and DMS attributes. Because pursuing drivers in the real world is rather unsafe and impractical, the majority of early studies in this field were based on SP surveys; however, some recent research has applied the DS to collect appropriate data for DMS effectiveness evaluation. Although a SP does not guarantee that drivers’ response in the real world is identical to what they state, it is a valuable and less costly research tool to answer a variety of research questions. Several studies have been performed about letter height, abbreviation types, and multi-phase formats of DMSs. Some DMSs are displayed in more than one phase to convey a long message. Using survey questionnaire, Wang et al. (2009) concluded that lengthy messages, abbreviated messages, and complex wording on DMSs are principal reasons for traffic slowdowns. Dutta et al. (2004) analyzed the understandability of bi-phase temporal messages on a DMS using a mid-level DS to achieve the maximum performance of the DMS. Forty-eight student subjects participated in this experiment, each for 24 trips. The number of message presentations, number and direction of lane changes, natural or physical obstacle between driver and the DMS, and sequencing of the message phases were subject to change in the experiments. A conclusion was that drivers distinctly benefited from repeated bi-phase messages in the case of sight obstruction. Nevertheless, with no obstruction, repeating a message had no statistically significant effect on choosing the correct direction compared to non-repeating messages. Out-of-sequence messages

6
can guide drivers to take corrective action, even when the whole message is not displayed. The study stated that 0.5 second per word is required for drivers to read the entire message. The display time is an important factor to allow drivers to read a DMS. The New York State Thruway Authority guideline (2011) emphasizes that the exposure time of the display must be equal to or greater than the message display time, where it depends on the highway speed. For instance, it takes 4 seconds to read a single-panel message display twice at high speeds with a 1,000-foot readable distance. The guideline, which adhered to the Manual on Uniform Traffic Control Devices (MUTCD), recommended that the sign placement maintain at least a 2,640-foot visible area and a 650-foot legible area for 18-inch character height. The Oregon Department of Transportation (2008) necessitated allowing drivers to read a DMS twice. For instance, 3 seconds is needed to read a 3-line message twice at 55 mph. For one or two words, a minimum of 1.5 seconds is required. Abbreviations are allowed for a DMS, but they need to be understood by the motorists. Graphics are not used for messages; however, arrows and chevrons are allowed, and distances can be expressed in feet or miles. Wang et al. (2006) investigated the effect of using graphic-aided messages on a DMS. They employed a survey questionnaire and video-based simulation techniques to evaluate drivers’ response to a graphical message. Results indicated that graphic-aided messages significantly enhanced preference, response time, and accuracy compared to text-only messages, especially for elderly drivers. Adding graphics on a DMS also highly improved the message comprehension time for drivers with English as a second language. In similar studies, the effect of a commercial electronic VMS (CEVMS) for outdoor advertising on driver safety was evaluated. Molino et al. (2009) demonstrated that drivers pay attention to a CEVMS (alternatively known as an electronic and digital billboard) due to demand increase. The study also stated that the display qualifications, such as background, character size, font, and message content, lead to differences in distraction. Speed, lane position, acceleration, and headway were used as the outcome variables for behavioral analysis. For drivers’ attention and distraction indications, the study measured eye glance behavior, visual occlusion, feature recognition, and head turning.

7
METHODOLOGY Route Choice Simulator This study utilizes UC-win/Road simulator, a product of FORUM8 Co., Ltd. It is an advanced, computer-based driving simulator owned by Morgan State University (MSU). It enables researchers to collect details of drivers’ route choice in addition to several other useful parameters, including geographic positions, distance traveled, lane number, offset from lane center, spot speed, acceleration, brake, yaw/pitch/roll angle, etc. The hardware, as shown in figure 1, consists of the cockpit, three surrounding monitors, ignition key, safety seat belt, automatic transmission, acceleration and brake pedals, push buttons, flash lights, and steering wheel. The UC-win/Road software, which is a virtual reality system, is capable of creating and editing entire network elements, including road alignments, intersection design, traffic signals, cross sections, roadside signs, terrain setup, and traffic generation. Visual option tools support the real-time presentation of traffic flow, weather conditions, spatial environment, and static objects. The visualization of three-dimensional trees and buildings is smooth as the subject vehicle moves along the road. Figure 2 displays a schematic snapshot of the built environment in the UC-win/Road simulator for the current study. It is capable of simulating driving tasks on different road classes, various traffic conditions, motor-vehicle types, traffic information, and weather conditions by building networks with desired features in accordance to the real world. Except for its low-sized cabin, the UC-win/Road simulator is considered high-fidelity in undertaking real transportation network and driving skills. Unlike most of existing driving simulators, a driver can drive anywhere in the network in the UC-win/Road and choose his or her own route to go from an origin to a destination. Conventional stated preference methods in route choice analysis merely relied on travel time as the main attribute. This traditional view undervalued the effect of environmental elements on travelers’ route decisions. Even including spatial-temporal conditions in the paper questionnaire did not assure the generation of real-world sensation for participants. The UC-win/Road simulator fairly addresses driver-vehicle interactions and replicates the driving feeling by simulating a variety of surroundings, the vehicle’s sound, vehicle cockpit, and side and rear mirrors; adjusting 3-D and FBX scenes according to distance from viewpoint; and matching terrain and sky texture to reality (FORUM 8®, 2013). Human subjects in this study were asked to begin a journey from a fixed origin to a known destination, given a predefined traffic information scenario. The simulator recorded the chosen route along with many other useful parameters, such as DMS-displayed travel time, actual travel time, instant speeds, and lane changing.

8
Figure 1. UC-win/Road Driving Simulator.
Figure 2. Schematic Features of the UC-win/Road Driving Simulator. Network Creation A 12×12 mi2 (20×20 km2) network southwest of the Baltimore metropolitan area was created in the DS. The journey started from MD 100, 3.45 miles (5,550 m) west of I-95, toward downtown Baltimore, to the junction of East Pratt Street and Light Street. All roadway objects, including

9
signs, DMSs, trees, and buildings, were loaded to the network in accordance with the online mapping system available in Google® Maps. To ensure gaining real response from the subjects in the DS experiments, the road network, interactive environment, and driver’s workload were designed as close as possible to the actual conditions. Figure 3 displays the study network, including the origin and destination of the journey and the position of two DMSs in the pathway. As shown on the map, there are three viable alternatives to reach the destination. Figure 4 presents the roadway map and alternatives more clearly. Two DMSs mounted on overhead structures are embedded in the network. DMS1 is located on MD 100, 1.39 miles (2,240 m) from the network start point, and DMS2 is located on I-95, 1.56 miles (2,507 m) from the MD 100 entrance ramp. DMS2, which exists in the real world, only targeted those who selected I-95.
Figure 3. Study Network Plan View in the UC-win/Road Simulator.
Origin
Destination
DMS1
DMS2

10
Figure 4. Study Map and Alternatives. Although providing thorough travel time information for drivers is an irrefutable task in an ATIS, traffic condition and travel time prediction are always subject to uncertainty, specifically when drivers receive informative messages that influence their route choices. The network was driven by the research team to ensure that the travel times shown on the two DMSs were close enough to average actual travel times for each scenario. However, due to the visualization restrictions of UC-win/Road, the traffic could not exceed a specific amount. This fact discredited the idea of increasing the travel time by growing traffic volume; instead, a combination of growing volume partly and decreasing the highway capacity by lane closure was deployed to produce different congestion levels for the study scenarios. Scenario Design Both SP and DS data were collected and analyzed in this study under different research scenarios. Driving experiments were performed in the network described in the previous section with all spatial features and alternative roads. Five scenarios were developed in this study to address various traffic regimes and travel time information. Drivers’ route choices were observed under these five scenarios. Table 1 describes the two messages’ contents displayed in each scenario. DMS1 had quantitative messages informing drivers of the travel time to Baltimore through two options, I-95 and MD 295. DMS2 supplied qualitative messages to evaluate route diversion propensity from I-95 to MD 295. △TT, which was the difference between travel time in MD 295 and I-95, showed the travel time (TT) saving when someone chose MD 295 and was

11
calculated for DMS1. It is noteworthy that the scenarios were not selected sequentially for a subject; they were assigned based on the subject’s route choice in the preceding scenario. Figure 5 depicts the driver’s view of DMS1 for each of the five scenarios in the UC-win/Road DS environment. Figure 6 provides similar scenes for DMS2. As can be noticed in table 1 and figure 6, DMS2 was inactive in scenario I. Also, the second and third messages were identical due to the importance of this fully-informative message.
Table 1. Description of the Five Scenarios
Scenario DMS1
Traffic Condition DMS2
Message △TT (TT95 – TT295)
Message
I 95: 15 MIN 295:20 MIN -5 both off-peak Off
II 95: 30 MIN 295:20 MIN 10 95 peak
ACCIDENT AHEAD 2 RIGHT LANES CLOSED
EXIT 49 TO EXIT 50
III 95: 30 MIN 295:30 MIN 0 both peak
ACCIDENT AHEAD 2 RIGHT LANES CLOSED
EXIT 49 TO EXIT 50
IV 95: 25 MIN 295:20 MIN 5 5 min unrealistic
delay for 95 EXPECT DELAY EXIT 49
TO EXIT 50
V 95: 35 MIN 295:20 MIN 15 15 min unrealistic
delay for 95 ACCIDENT AHEAD 2
RIGHT LANES CLOSED
Scenario I Scenario II Scenario III
Scenario IV Scenario V
Figure 5. Driver’s View of DMS1 for the Study Scenarios.

12
Scenario I Scenarios II and III
Scenario IV Scenario V
Figure 6. Driver’s View of DMS2 for the Study Scenarios.
Survey Questionnaires In this study, in addition to the DS experiment, an SP study was conducted through three sequential survey questionnaires. The SP data was utilized to better understand drivers’ perceptions of the efficiency-related attributes. It was also used for validation of the results of the route choice simulator. The three questionnaires address all requirements to develop a behavioral model for drivers’ route choice/diversion. Drivers’ were asked their socio-economic characteristics and general attitudes toward a DMS and an ATIS in the first questionnaire prior to their DS experiment. It focused on gender, age group, education level, job status, driving license type, income level, household size, car ownership, and annual driving mileage. Moreover, in this questionnaire, drivers’ familiarity with a DMS, exposure to a DMS, level of attention paid to a DMS, usage of navigation and radio traffic information, and perceptions of DMS helpfulness were examined. The last part of the first questionnaire inquired the overall willingness of subjects to divert from their main commute route with respect to five qualitative DMS contents, the typical messages that were later displayed on DMS2 in the driving tests. These questions were set up in a random manner so they would be immune from biased response, and the answers were scored on a 5-point Likert scale (from 1 being the lowest to 5 being the highest willingness).

13
The second questionnaire was specific to the study area. A map similar to figure 4 was presented to the subjects and they were asked to respond to a set of scenarios compatible to the DMS1 information in the driving experiments. The questions examined familiarity with the route and its potential alternatives, rank-based priority of the three major alternatives (I-95, MD 295, and Washington Blvd.), travel time anticipation, willingness to choose I-95 for our five DMS1 scenarios, and willingness to divert to MD 295 for four DMS2 scenarios when I-95 was selected. Propensity of drivers’ route choice and diversion were measured on a five-point Likert scale. The third questionnaire concentrated on simulation sickness and the level of change in subjects’ attitudes toward a DMS after the DS experiments. To investigate simulation sickness, subjects were asked about the intensities of nine common symptoms. Subjects were also asked about their level of attention to a DMS in familiar and unfamiliar routes, reliability of DMS travel times, and safety issues of a DMS. In addition to these three questionnaires, subjects were interviewed subsequent to each drive about their perceived travel time and whether they read the DMS information. Recruitment Process Steps were conducted to communicate with the research participants. Flyers were distributed to the public: flyers were placed randomly on cars’ windshields and handed out inside and outside the MSU campus in the Baltimore area. Flyers addressed the research specifications and contact information, and also informed the potential participants that they would be paid $15 per hour of driving. Some online advertisements were also posted. Through the distribution, the research team received emails and phone calls that allowed them to schedule the participants in available time slots. The research team also emailed the first and second survey questionnaires to participants to fill out prior to their drive time, and reminded them the day before their scheduled time through email and phone. When the subjects arrived to drive, they received an overview of the research and they were asked to sign a consent form. The consent form informed them about the research, payment, and possibilities of dizziness or nausea during the drive. Next, the subjects practiced for about 10 minutes to acclimate with the simulator features and its sensitivity (i.e., steering wheel, accelerator, brake pedal, and the entire 3-D environment). The first scenario was prepared for them and they were asked to complete their first experiment. Once they completed scenario I, they took a short break and were provided with refreshments. After the break, they drove one to three more scenarios, depending on their readiness. Subsequent scenarios were programmed to measure inertia of their initial choices. Once they finished driving, they filled out the third survey questionnaire. Finally, they were asked whether they would like to drive more; if yes, the research team scheduled them for further drives. The process of subjects admission is illustrated in figure 7.

14
Figure 7. Human Subject Recruitment and Experiment Process.
The study was able to recruit 102 volunteers who successfully accomplished at least one research scenario along with all the survey questionnaires. The quantity and diversity of participants yielded a quite unbiased, valid data source for route choice analysis that is sufficiently appropriate for generalization of the study’s findings. Moreover, since the subjects were reimbursed for their time partaking in the research, it allowed the research team to recruit subjects randomly. Handling 102 human subjects to fulfill the tasks presented in figure 7 required dedication and disciplined teamwork for a long period. During the drive experiments, some volunteers felt sick, discomfort, or dizziness that caused some of them not to accomplish the test; therefore, they were excluded from the study data. The research team stopped the test for a subject and restarted the scenario after a short break in three cases: 1) if a subject felt nausea when making a turn at intersections, 2) if a subject chose a wrong exit that did not end at the destination (e.g., I-95 south), and 3) if the DS experienced glitches that caused the network to crash. The research team also committed to remind the subjects, specifically the aggressive and fast drivers, to drive as they would in the real world. Participants’ Characteristics This study recruited 102 human subjects from balanced socioeconomic groups. They were randomly selected from people within the MSU campus (students, staff, and faculty members), Baltimore City, and Baltimore County. Table 2 presents the descriptive statistics of the socioeconomic variables of the database. Sixty-four percent of the subjects were male, and the largest age group (36 percent) belonged to young adults between 18 and 25 years old, which were either MSU students or their friends/acquaintances. The sample had a balanced distribution of education level, work status, and income level. Thirty-two percent of the subjects were from families with at least four members and 30 percent belonged to a family of two. Ninety-one percent of the subjects owned at least one car in their families. The average annual mileage
Flyer distribution & online ads
Receiving emails/calls
Emailing 1st & 2nd surveys to
volunteers
Receiving the 2 surveys &
reviewing them
Contact volunteers for
availabilityRemind subjects of their schedule
Research overview +
consent form + 10 min practice
Ask them to drive the 1st
scenario
Interview about perceptions + short break + refreshment
Ask them to drive 1 to 3 more
scenariosAsk to fill the 3rd
surveyCheck all forms & ask for further
participation

15
driven was reported 14,800 for the study sample, which is very close to the 13,476 miles annually for an average American driver (FHWA, 2011). Each participant started the driving test with scenario I. Overall, 577 successful drives were accomplished by the 102 drivers. As explained in the previous section, some individuals did not express interest in participating in more scenarios due to sickness, discomfort, etc. The actual number of scenarios driven per participant ranged from 1 to 12, with an average of 5.7 scenarios. Figure 8 shows the distribution of the number of scenarios driven and indicates that nearly 18 percent of the subjects drove only once, 15 percent twice, and 12 percent three times. The shares consistently decline as the number of scenarios driven increases to 12.
Table 2. Descriptive Statistics of Socioeconomic Data
Characteristics Options Percentages Gender Female 36 Male 64 Age <18 3 18-25 37 26-35 18 36-45 20 46-55 9 56-65 10 >65 3 Education level High school or less 31 College degree 32 Post-graduate 37 Work status Unemployed 28 Work part-time 30 Work full-time 42 Income level < $20K 23 $20K- $30K 18 $30K- $50K 13 $50K- $75K 16 $75K- $100K 13 > $100K 17 Household size 1 20 2 30 3 17 ≥ 4 33 Car ownership 0 9 1 39 2 30 ≥ 3 22 Annual mileage driven ≤ 8,000 29 8,001 - 15,000 35 15,001 - 30,000 25 ≥ 30,000 11

16
Figure 8. Distribution of the Number of Scenarios Driven per Subject.
Selecting more than one choice in the multiple-choice questions is a typical issue in paper questionnaires. The research team experienced this issue for some of the score-based questions that addressed the subjects’ willingness to choose/divert. Also, some records of data were missing, which necessitated that the research team conduct a data cleaning before data analysis. For most of the double-filled cases, the research team used the averages. For the missing values, the pair-wise deletion approach was applied to keep as many as samples for the analysis.
0% 2% 4% 6% 8%
10% 12% 14% 16% 18%
1 2 3 4 5 6 7 8 9 10 11 12
Number of Scenarios Driven

17
RESEARCH FINDINGS AND DISCUSSION Attitude Analysis According to the surveys’ results, 99 percent of the subjects were familiar with a DMS and its applications. Seventy-five percent were occasionally exposed to a DMS, while 24 percent observed it in their everyday commute. Sixty percent of the subjects stated that they always read a DMS, while 30 percent read it on a few occasions (e.g., accident time). Eight percent believed they were not able to read a DMS, and the remaining 2 percent did not pay attention to it. Figure 9 compares DMS attention level for two groups of people with low and high exposures to a DMS. It is understood from this figure that people with a higher exposure rate are relatively more likely to pay attention to and read a DMS than those with less exposure.
Figure 9. DMS Attention Level Based on Drivers’ DMS Exposure.
The majority (72 percent) of the sample sometimes utilized personal navigation systems such as GPS or smart phone, while 10 percent always and 18 percent never used a navigation system. Twenty-six percent of our subjects never, 33 percent rarely, 24 percent occasionally, and 16 percent often listened to a radio for traffic information. Three percent did not find a DMS a useful tool, while 39 percent believed it is potentially helpful and 58 percent believed it is absolutely helpful. Figure 10 compares the opinions of two groups, those who potentially believed versus those who absolutely believed in a DMS’s usefulness. As expected, those with stronger beliefs in DMS performance were more likely to pay attention to it.
0%
20%
40%
60%
80%
100%
Low High1%
11%
28%38%
59% 63%
Always read Few occasions Can't readNo attention
DMS Exposure

18
Figure 10. DMS Attention Level Based on Drivers’ Attitude toward DMS.
Stated Preference Analysis Drivers were asked to rate five typical qualitative DMS contents in the first survey from 1 to 5, wherein 1 indicated the lowest and 5 the highest propensities to change their original route in the morning peak hour. As shown in figure 11, “accident ahead, take the detour” and “accident ahead, 20 min delay, take the detour” messages caused the highest diversion rates in an aggregate level, with willingness higher than 4 on the 5-point Likert scale. Despite more information in the latter message, the former message earned slightly higher willingness to divert. Two possible reasons may explain this response, excluding the data collection bias: (1) interviewees first encountered the latter message and therefore scored it higher, and (2) excessive information in the DMS caused confusion. The second reason also argues that DMS effectiveness is not necessarily harmonized with the amount of information. “Accident ahead, 20 min delay” is the third most influential message with an average rate of 3.8, and “heavy traffic ahead, in 1 mile” is the fourth most influential message with an average rate of 3.6. The least important message in the SP survey was “road work ahead,” with an average willingness of 2.8.
0%
20%
40%
60%
80%
100%
Potentially Absolutely
3% 2%13% 5%
41%
19%
44%
74%Always read Few occasions Can't readNo attention
DMS helpfulness
belief

19
Figure 11. Average Stated Willingness to Divert Due to Five Qualitative DMS Contents. According to the second survey, 32 percent were familiar with the viable alternatives from origin to destination, while 43 percent were somewhat familiar and 25 percent were unfamiliar. In a rank-based question to investigate participants’ route priorities, 64 percent ranked I-95, 22 percent ranked MD 295, and 14 percent ranked Washington Blvd. as their first alternative for this trip. Thirty-nine percent considered themselves fully familiar with this specific route (i.e., did not use GPS, map, etc.). Figure 12 exhibits travel time anticipation for each of the three alternatives for peak and off-peak traffic conditions. Compared to the real travel times, which are available at least for the off-peak period, people overestimated their predictions.
Figure 12. Stated Travel Time Anticipation for the Three Alternatives (Min).
As expressed earlier, the five DMS1 scenarios were addressed in the second questionnaire to investigate the dissimilarities in people’s reactions to the paper SP and DS tests. The charts in figure 13 demonstrate a systematic decline in the probability of choosing I-95 as the △TT (the
4.23
3.57
4.142.76
3.80012345
“Accident ahead, take the
detour”
“Heavy traffic ahead, in 1
mile"
“Accident ahead, 20 min delay, take the
detour"
“Road work ahead”
“Accident ahead, 20 min
delay”
2832
3742
4752
0
10
20
30
40
50
I-95 MD-295 Wash Blvd.
Off-peakPeak
min
Options

20
difference in travel time) increased for peak and off-peak traffic conditions. There are five options of △TT, from -5 to +15. The former boundary indicates that I-95 is 5 minutes faster and the latter boundary indicates that MD 295 is 15 minutes faster. As expected, people showed a greater tendency to choose the shorter path for work trips during peak hours. Figure 14 displays willingness to divert to MD 295 when I-95 is chosen in response to four messages similar to the DMS2 scenario configurations in the DS. “Accident ahead, 2 right lanes closed” caused a near 80 percent diversion rate for both trip purposes. Although the results of this figure are consistent with past studies, they are inconsistent with the subjects’ DS responses. As presented in figure 14, willingness to divert to MD 295 for work trips is 20 percent more likely than for leisure trips in response to “roadwork ahead” sign. The reason may be speed restriction in roadwork areas that reduces prevailing speed if they stay on I-95. Thus, they are more likely to choose a risk-free option. On the other hand, in the case of accidents with no lane closure, they are more likely to divert in their leisure trips than in their work trips.
Figure 13. Stated Willingness to Choose I-95 for Five DMS1 Scenarios Based on △TT (TT95
– TT295).
Figure 14. Stated Willingness to Divert to MD 295 Due to Four Qualitative DMS2
Contents.
0%
10%
20%
30%
40%
50%
60%
70%
80%
-5 0 5 10 15
Work trip AM-peak
Leisure trip off-peak
ΔTT (min)
0%
10%
20%
30%
40%
50%
60%
70%
80%
"EXPECT DELAY EXIT 49 TO EXIT
50"
"ACCIDENT AHEAD CONSIDER ALTERNATIVES"
"ROADWORK AHEAD"
"ACCIDENT AHEAD 2 RIGHT LANES CLOSED"
Work trip AM-peakLeisure trip off-peak

21
Revealed Preference Analysis Of the 577 completed tests by the 102 subjects, which included all five scenarios, I-95 was selected in 59 percent of the tests and MD 295 in 38 percent of the tests. Washington Blvd. accounted for the remaining 3 percent of the choices. However, the selection arrangement for scenario I was 80 percent for I-95, 18 percent for MD 295, and 2 percent for Washington Blvd. Scenario I represented the off-peak traffic conditions with normal travel time displayed on DMS1 and was introduced to all subjects in the first experiment. Table 3 presents the frequency distribution of the five scenarios along with the travel time displayed on DMS1. Scenario I was the most driven scenario since all 102 subjects drove it at least once.
Table 3. Distribution of the Five Scenarios.
Scenario I-95 DMS TT
MD-295 DMS TT Percentage
I 15 20 31% II 30 20 22% III 30 30 16% IV 25 20 16% V 35 20 14%
Figure 15 exhibits the decreasing trend of I-95 choice probability as △TT (the difference in travel time between I-95 and MD 295) increases. While the probability of choosing I-95 decreases only 3 percent shifting from △TT =-5 (I-95 being 5 min faster) to △TT=0 (equal travel times), the choice probability decreased 30 percent when MD 295 became 5 minutes faster than I-95 (△TT=5). The choice probability stabilized again as MD 295 became faster. The results demonstrate the inherent inertia of I-95 choice probability due to its shorter distance, wider lanes, higher speed limit, and lower travel time in the normal traffic conditions. Table 4 compares the two alternatives with respect to their operational specifications. Although I-95 is more attractive from a mobility perspective, MD 295 can be considered a safer route due to its lower posted speed and lower truck percentage.

22
Figure 15. Route Choice Probability of I-95 for the Five Scenarios of △TT (TT95 – TT295).
Table 4. Operational Specifications of I-95 and MD 295.
Criteria I-95 MD 295 Number of lanes 4 2-3 Speed limit (mph) 65 55 Distance (mi)* 13.9 16.2 Normal travel time (min) * 16 22 Truck percentage** 10.0 4.2
* From DMS1 position to downtown Baltimore ** Single-unit and single-/multi-trailer trucks (class 5-13)
Besides DMS content, past experience is among the other factors that affect drivers’ route choices. It is assumed that network familiarity and experience direct drivers toward the most efficient choices. Figures 16 and 17 illustrate the fact that increases in the number of DS experiments lead to a higher compliance rate with the DMS. Figure 16 draws hypothetic lines for each of the five scenarios to show how the probability of choosing I-95 changes when subjects drive more. When I-95 is 5 minutes faster, the choice probability ranges upward from 75 percent for the first drive to near 100 percent for the twelfth drive. When the travel time is equal in both alternatives, a moderate ascending line exhibits the change in choice probability as the drive frequency increases. When MD 295 is 5 minutes faster, interestingly, the I-95 choice probability remains ascending and rises from 40 to 70 percent as the drive frequency increases. This finding indicates the significant effect of perceptive knowledge on route choice behavior, in which the observation showed that, despite the information displayed on the DMS, average travel time on I-95 was 1.5 minutes shorter than MD 295 for this scenario (IV). For the last two scenarios, when I-95 was 10 and 15 minutes slower than MD 295, the choice probability lines descended as the drive frequency increased. Similar outcomes are interpretable in the bar charts of figure 17. The first four drives are consolidated into one category and
82% 79%
49% 44%34%
18% 21%
51% 56%66%
0%
20%
40%
60%
80%
100%
-5 0 5 10 15
29595
ΔTT (min)

23
compared to the fifth through the twelfth drives that were consolidated into the second category, to show the difference in response to each DMS for two groups of low and high drive experiences.
Figure 16. Choice Probability of I-95 Based on Drive Frequency for Five DMS Scenarios.
Figure 17. Choice Probability of I-95 Based on △TT for Two Drive Frequency Categories. Route familiarity is an important component in route choice. Subjects’ familiarity level with the study network was inquired in the second survey and the results were presented in the previous section. Figure 18 compares the choice probability of I-95 for three familiarity groups by each of the five scenarios. The three groups are those familiar, somewhat familiar, and unfamiliar with the area, the route, and alternative routes. The overall conclusion is that familiar drivers constantly select the more efficient alternatives compared to unfamiliar drivers. However, there is a strong uncertainty in the somewhat familiar group that sometimes leads them to follow the DMS information, and sometimes they make the choice based on their own experiences.
0%
20%
40%
60%
80%
100%
1 3 5 7 9 11
Linear (ΔTT = -5)Linear (ΔTT = 0)Linear (ΔTT = 5)Linear (ΔTT = 10)Linear (ΔTT = 15)
Drive frequency
0%
20%
40%
60%
80%
100%
ΔTT = -5 ΔTT = 0 ΔTT = 5 ΔTT = 10 ΔTT = 15
Drives 1~4Drives 5~12

24
Figure 18. Choice Probability of I-95 Based on △TT Scenarios and Drivers’ Familiarity. Speed Analysis Field data was collected in past studies to analyze the effect of DMS on traffic slowdowns. Wang et al. (2009) utilized mobility technology units to calculate vehicles’ speed approaching three types of messages displayed on a DMS: danger warning, informative, and regulatory. The average speed of vehicles in two 5-minute intervals, “pre-display” and “first 5-min of DMS operation,” were compared using a t-test at a 0.10 significance level. Speed reduction was reported in ten of the sixteen cases, while only four were statistically significant. Supplementary analysis of a second pair of 5-minute intervals, “last 5-min of DMS operation” and “post-display,” demonstrated that speed increases occurred in seven of the sixteen cases, only two of them being statistically significant. However, the study’s survey results indicated that 90 percent of the drivers would always or sometimes slow down when approaching an active DMS. There was no significant evidence of speed change when the DMS was off, likely due to drivers’ route familiarity. Haghani et al. (2013) reported an average 3.1 mph speed reduction for all types of active DMS versus inactive ones. The authors conducted a t-test to a pair of 5-minute speed data before and after DMS locations. However, speed reduction occurred only in 17 percent of cases, and speeds increased or were unaffected in the remaining 83 percent of cases. Moreover, the DMS was not considered the only source of speed reduction due to many other unaccountable environmental factors. The study also found no clear indication that traffic slowdown for a DMS with quantitative travel time information is significantly different from a DMS displaying other types of messages. Overall results of this study suggested that a DMS is not likely to cause traffic congestion or to adversely affect traffic safety. The speed analysis in this study is based on four segments of the roadway surrounding each DMS. The analysis was performed for each DMS individually to test the significance of the slowdown when drivers approached a DMS and passed it. The segments are listed as initial, visible, readable, and post-DMS display zones. The four segments’ positions for DMS1 and DMS2 are shown in figures 19 and 20, respectively. S1, the initial speed area, represents the
0%
20%
40%
60%
80%
100%
ΔTT = -5 ΔTT = 0 ΔTT = 5 ΔTT = 10 ΔTT = 15
UnfamiliarSomewhat familiarFamiliar

25
average speed of drivers not influenced by the DMS (i.e., drivers did not observe the DMS in their view). S2, the visible area, represents the average speed of drivers when they noticed the DMS on their way, but could not read its content. S3 represents the average speed when drivers were close enough to read the sign. S4, post-DMS, represents the average speed when drivers passed the DMS. The four parameters were computed by the research team at normal speed ranges. The DS generated driving performance (speed, position, distance along the road, etc.) for many snapshots per second. The average speed was calculated for the entire snapshots within each of the four segments’ length. For DMS1, which was located 7,349 ft (2,240 m) from the beginning of MD 100, the segments were defined as the following distance ranges: 5,216 ft – 6,037 ft (1,590 m – 1,840 m) for S1, 6,037 ft – 6,922 ft (1,840 m –2,110 m) for S2, 6,922 ft –7,349 ft (2,110 m – 2,240 m) for S3, and 7,349 ft – 8,169 ft (2,240 m – 2,490 m) for S4. For DMS2, which was located 11,155 ft (3,400 m) from the beginning of I-95, segments were defined as the following distance ranges: 7,546 ft – 8,366 ft (2,300 m – 2,550 m) for S1, 9,383 ft – 10,695 ft (2,860 m – 3,260 m) for S2, 10,695 ft – 11,158 ft (3,260 m – 3,401 m) for S3, and 11,158 ft – 11,978 (3,401 m – 3,651 m) for S4. The reason for the 1,017-foot (310-m) gap between S1 and S2 in DMS2 is the presence of a horizontal curve along I-95 that might affect the free flow speed in the initial speed zone.
Figure 19. Description of the Four Segments for DMS1 Speed Analysis.

26
Figure 20. Description of the Four Segments for DMS2 Speed Analysis. DMS1 displayed five different quantitative messages. The aggregate speed analysis results showed steady speed increases from pre-display (S1) to visibility (S2) and to legibility (S3) zones, followed by a slight decrease in the post-DMS display zone (S4). Figure 21 illustrates the average speed of the 577 experiments (after data cleaning) for each of the four segments. Although the changes from S2 to S3 and S3 to S4 were small, the trend was unexpected to the researchers. Figure 22 depicts five typical speed patterns as a subject passing through the four segments. Among all, pattern IV was expected by the researchers. Figure 22 also shows the proportion of each pattern among individuals. After pattern III, pattern V (a zigzag speed trend - veering up and down) and pattern IV (the ideal) account for the second and the third highest percentages. By focusing only on the speeds higher than 60 mph, when the posted speed limit is 55 mph, the distribution of the speed data leads to a more interpretable driving behavior. The last row of figure 22 computed the percentage of cases in each pattern with speed restriction of over 60 mph. Compared to the previous general classification, fast drivers complied more with the adaptive patterns (i.e., II and IV) and less with the uncommon pattern III.
Figure 21. Aggregate Speed Variation in the Four Segments of the DMS1 Neighborhood.
52.7
54.1
54.5
53.7
50
51
52
53
54
55
S1 S2 S3 S4
mph

27
Pattern I Pattern II Pattern III Pattern IV Pattern V
8% 6% 44% 16% 26% (5%) * (17%) * (28%) * (25%) * (25%) *
* Percentages among speeds higher than 60 mph
Figure 22. Five Typical Speed Patterns and Disaggregate Distribution for DMS1.
DMS2 was located on I-95 and had two inactive and four qualitative active messages. For this DMS, the majority of drivers followed pattern V, starting with a speed increase from the pre-DMS display to the visibility area, followed by a speed decrease from the visibility to the legibility area, and ultimately another speed increase after passing the DMS line. Figure 23 compares the average speeds of four segments for the two DMS options, active or inactive, on I-95 with a 65 mph posted speed. Although, as expected, the active DMS had a more intense speed fluctuation, the results of a t-test at a 0.05 significance level indicated that the active DMS did not change drivers’ speed significantly compared to the inactive DMS. In other words, none of the four segments’ average speeds at the active DMS were statistically different from their corresponding points at the inactive DMS at α=0.05 (e.g., 60.3 and 59.4 mph). However, unlike DMS1, there was a significant reduction in average speed when drivers entered the active DMS readable area from the visible area (i.e., 60.3 and 57.7 mph) and a significant increase in average speed when they passed the DMS line.
Figure 23. Aggregate Speed Variation in the Four Segments of the DMS2 Neighborhood.
While paper questionnaires suggested a substantial slowdown in traffic stream in the DMS neighborhood (Wang et al. 2009), the DS finding is in line with past studies that collected actual speed data. The post-experiment survey in this study demonstrated that DS subjects had a quite precise perception of their speed variation in the DMS neighborhood. Only 19 percent of the
58.7
60.3
57.7
60.358.8
59.458.9
61.1
56
57
58
59
60
61
62
63
S1 S2 S3 S4
DMS OnDMS Off
mph
28
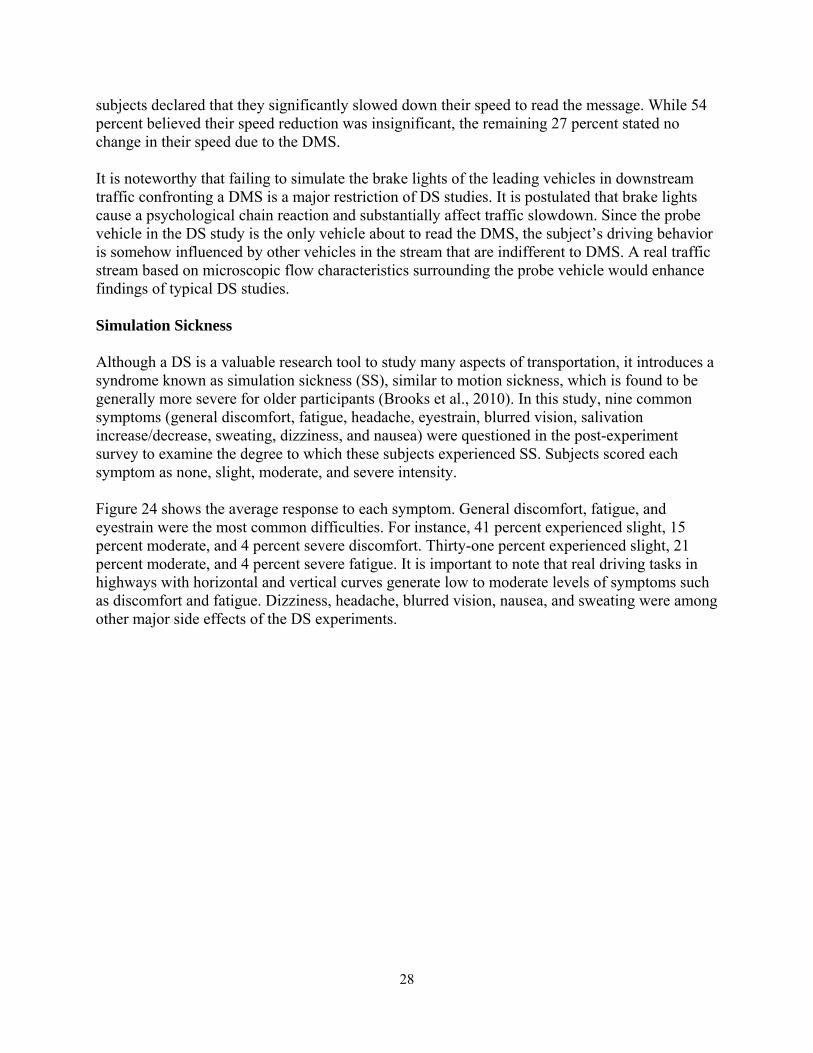
subjects declared that they significantly slowed down their speed to read the message. While 54 percent believed their speed reduction was insignificant, the remaining 27 percent stated no change in their speed due to the DMS. It is noteworthy that failing to simulate the brake lights of the leading vehicles in downstream traffic confronting a DMS is a major restriction of DS studies. It is postulated that brake lights cause a psychological chain reaction and substantially affect traffic slowdown. Since the probe vehicle in the DS study is the only vehicle about to read the DMS, the subject’s driving behavior is somehow influenced by other vehicles in the stream that are indifferent to DMS. A real traffic stream based on microscopic flow characteristics surrounding the probe vehicle would enhance findings of typical DS studies. Simulation Sickness Although a DS is a valuable research tool to study many aspects of transportation, it introduces a syndrome known as simulation sickness (SS), similar to motion sickness, which is found to be generally more severe for older participants (Brooks et al., 2010). In this study, nine common symptoms (general discomfort, fatigue, headache, eyestrain, blurred vision, salivation increase/decrease, sweating, dizziness, and nausea) were questioned in the post-experiment survey to examine the degree to which these subjects experienced SS. Subjects scored each symptom as none, slight, moderate, and severe intensity. Figure 24 shows the average response to each symptom. General discomfort, fatigue, and eyestrain were the most common difficulties. For instance, 41 percent experienced slight, 15 percent moderate, and 4 percent severe discomfort. Thirty-one percent experienced slight, 21 percent moderate, and 4 percent severe fatigue. It is important to note that real driving tasks in highways with horizontal and vertical curves generate low to moderate levels of symptoms such as discomfort and fatigue. Dizziness, headache, blurred vision, nausea, and sweating were among other major side effects of the DS experiments.

29
Figure 24. Simulation Sickness Symptoms.
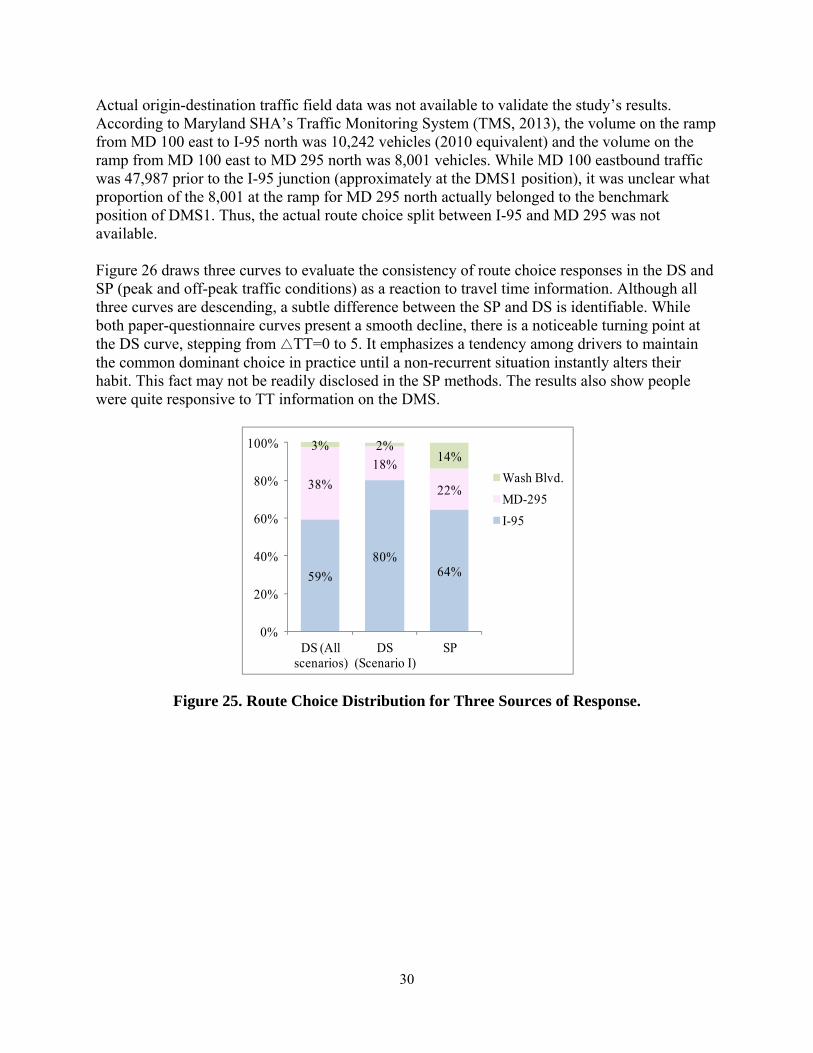
Aggregate Route Choice Analysis Many road-specific, environmental, and spatial factors (such as traffic condition, road geometry, distance, and speed limit) are proven to affect drivers’ route choices. Although the focus of this research was to investigate the effect of DMS information and guidance on route choice behavior, this cannot be separately simulated and analyzed as en-route subjects are under the accumulated load of the aforementioned factors. Therefore, to deduce the effect of a DMS on route choice behavior, one should be cautious of the combined effect of all potential factors. Statistical evidence for some singular factors was reviewed in the previous section for the SP and DS approaches. This section discusses the results presented in the previous section findings by integrating the SP and DS approaches for further identification of the route decision making process. Figure 25 displays the variation of route choice distribution that emerged from three sources of response: the overall DS tests, the first DS scenario (off-peak condition), and the SP (which were inquired for off-peak condition as well). I-95 was more likely to be selected in scenario I than in the other scenarios since it was 5 minutes faster (the second bar versus the first left bar in figure 25). The difference between the first and the third left bars is mainly Washington Blvd. While it was a considerable alternative on paper, Washington Blvd. was less attractive in the DS; perhaps, the reason might be that it was not listed on the DMS as a vital alternative. However, the second and third left bars were the most dissimilar cases, although they were anticipated to hold the most similarities. They showed a significant difference between the SP and DS on route choice under normal traffic conditions without the influence of past DS experience.
41% 44%
71%
42%
73%85% 80%
57%
76%
41% 31%
19%
45%
22%10%
11%
29%
11%
15%21%
6% 11%5% 4%
2% 11% 10%
4% 4% 4% 2% 0% 1% 6% 2% 4%
0%
20%
40%
60%
80%
100%
Discomfort Fatigue Headache Eyestrain Blurred vision
Salivation Sweating Dizziness Nausea
SevereModerateSlightNone
30
Actual origin-destination traffic field data was not available to validate the study’s results. According to Maryland SHA’s Traffic Monitoring System (TMS, 2013), the volume on the ramp from MD 100 east to I-95 north was 10,242 vehicles (2010 equivalent) and the volume on the ramp from MD 100 east to MD 295 north was 8,001 vehicles. While MD 100 eastbound traffic was 47,987 prior to the I-95 junction (approximately at the DMS1 position), it was unclear what proportion of the 8,001 at the ramp for MD 295 north actually belonged to the benchmark position of DMS1. Thus, the actual route choice split between I-95 and MD 295 was not available. Figure 26 draws three curves to evaluate the consistency of route choice responses in the DS and SP (peak and off-peak traffic conditions) as a reaction to travel time information. Although all three curves are descending, a subtle difference between the SP and DS is identifiable. While both paper-questionnaire curves present a smooth decline, there is a noticeable turning point at the DS curve, stepping from △TT=0 to 5. It emphasizes a tendency among drivers to maintain the common dominant choice in practice until a non-recurrent situation instantly alters their habit. This fact may not be readily disclosed in the SP methods. The results also show people were quite responsive to TT information on the DMS.
Figure 25. Route Choice Distribution for Three Sources of Response.
59%80%
64%
38%18%
22%
3% 2%14%
0%
20%
40%
60%
80%
100%
DS (All scenarios)
DS (Scenario I)
SP
Wash Blvd.MD-295I-95

31
Figure 26. Probability of Choosing I-95 for Three Sources of Response. The accuracy of information plays a significant role in the prolonged DMS compliance rate. Zhang and Levinson (2008), in a field experiment for route choice analysis, discovered that drivers’ willingness to pay the provider for travel information depended on their perception of information accuracy. Drivers’ intuition was investigated in the post-experiment survey of the current study and the results are summarized in figure 27. Drivers rated the reliability of the DMS information on a 1 to 5 scale, 1 being the most unreliable and 5 the most reliable. Although 72 percent of the drivers rated the DMS travel time information accurate enough, 28 percent were not satisfied with the accuracy of the DMS information, which substantially impacted the DMS compliance rate.
Figure 27. Reliability of DMS Information (1: lowest to 5: highest).
0%
20%
40%
60%
80%
100%
-5 0 5 10 15
Driving simulatorWork trip AM-peakLeisure trip off-peak
ΔTT (min)
0%
7%
21%
50%
22%
0%
10%
20%
30%
40%
50%
60%
1 2 3 4 5

32
Disaggregate Route Choice Analysis The aggregate approach in route choice analysis assumes homogenous driving behavior, in which drivers are expected to react to traffic information as a driver with average attributes and understanding of traffic information would respond. Recent studies challenge this standard behavior approach and encourage disaggregate route choice modeling. Tracking individuals’ reaction to various DMS scenarios and comparative analysis of their SPs and DS choices can better explore drivers’ attitudes toward a DMS, their learning process, and the variability of route choice behavior among individuals, which ultimately provides a better performance of a DMS. Although the DMS aggregate response is crucial to DMS design, disaggregate analysis provides more insights into individuals’ understanding and attitudes toward DMS information. Tawfik et al. (2011) studied real-time DS data and demonstrated that disaggregate route choice modeling outperformed the corresponding aggregate approach. One of the principle questions that can be examined on the disaggregate level is compliance rate with DMS guidance. Drivers were presumed to choose the faster route between the two vital alternatives displayed on DMS1 in accordance with the travel time information. The path with the shortest travel time displayed on the DMS was considered the recommended path. Route choices compatible with the recommended path were counted as compliance cases. Table 5 shows the DMS compliance rate for each scenario for both the SP and DS. Scenario III is excluded in this analysis since there was no travel time distinction between the two routes.
Table 5. DMS1 Compliance Rate Analysis for SP and DS Approaches.
Scenario Faster route |△TT|* DS SP
(peak) SP (off-peak)
I I-95 5 81% 69% 72% IV MD 295 5 50% 47% 37% II MD 295 10 54% 57% 57% V MD 295 15 65% 62% 67%
Overall - - 65% 59% 59% * The absolute value of difference in travel time displayed on DMS1
According to table 5, the overall compliance rate with DMS1 in the DS experiments was 65 percent, higher than the 59 percent reported in the paper questionnaires in response to similar scenarios. Two SP responses for peak-hour and off-peak traffic conditions are listed in table 5. When I-95 is 5 minutes faster, the I-95 selection rate is 81 percent in the DS, 69 percent (peak period) and 72 percent (off-peak period) in the SP. The higher value of the I-95 selection rate in the DS appears to better match reality. Scenario IV displayed the same △TT values as scenario I. However, travel time on MD 295 is 5 minutes less than I-95 in scenario IV, while travel time on I-95 is 5 minutes less than MD 295 in scenario I. The DMS compliance rate to choose the faster route was significantly lower in scenario IV (for MD 295) than in scenario I (for I-95). This fact demonstrates the anchoring effect in route choice behavior as drivers tended to persist in the dominant alternative. I-95 is the

33
likely option during normal traffic conditions. As △TT increased to 10 and 15 minutes in favor of MD 295, the compliance rate started to gradually exceed 50 percent in both the SP and DS. Overall, the SP compliance with the DMS information had a higher variance in off-peak than peak conditions, although they resulted in a similar mean of 59 percent compliance. A disaggregate comparison of the SP and DS choices was also conducted to better evaluate the consistency in responses of the subjects to the corresponding circumstances between the two methods. Considering three route alternatives, the overall consistency rate between the SP and DS approaches in route choice was 60 percent. This is the summation of the diagonal cells divided by the total cases in table 6. As shown in table 6, among the 47 subjects who stated (in SP) choosing I-95 in the normal traffic conditions, 39 of them actually selected I-95, six chose MD 295, and two chose Washington Blvd. in the first DS scenario. However, out of the 56 people who chose I-95 in the DS first scenario, only 39 people had stated in the survey questionnaire that they would choose I-95. Table 7 evaluates the harmony of the SP responses and the DS choices for all scenarios. Subjects rated their willingness to choose I-95 on a scale of 1 (strong unwillingness) to 5 (strong willingness) for the five scenarios. For the sake of comparison with the actual choice in the corresponding DS test, I-95 was designated as the predominant choice to those who scored 4 or 5 and “not I-95” to those who scored their propensity as 1 or 2. The consistency rate, as it can be computed from table 7, is only 55 percent. Of the 225 scenarios that I-95 was scored 4 or 5 in a 5-point Likert scale, I-95 was selected 150 times. The results demonstrate that the travelers’ reactions to traffic information in the DS environment are not fully consistent with their stated choices. However, the DS responses are more compliant with the DMS travel time directions than with the SP.
Table 6. Disaggregate Choice Comparison of SP and DS, First Scenario.
DS choice
I-95 MD 295 Wash Blvd Total
SP
I-95 39 6 2 47 MD 295 11 4 0 15
Wash Blvd 6 4 0 10 Total 56 14 2 72
Table 7. Disaggregate Comparison of SP and DS for All Scenarios Combined.
DS choice I-95 Not I-95 Total
SP I-95 150 75 225
Not I-95 178 160 338 Total 328 235 563

34
Travel Time Analysis The comparative results obtained in the context of the SP and DS indicate that route choice can be attributed to many efficiency-related factors other than the DMS travel time (TT) information. Subjects were exposed to two sources of TT, DMS TT and their own perceived travel time (PTT) learned from past experiences. The latter is identified as a reliable substitute for the actual travel time (ATT) in relevant studies (Zhang and Levinson, 2008) since travelers do not normally measure their ATT. The subjects were asked of their approximate travel time after finishing each scenario. While average PTT for all experiments was 24.1 minutes, average ATT was calculated as 22.7 minutes, and average DMS1 travel time was 24.5 minutes for the active scenarios. What the subjects perceived was closer to what they observed (DMS TT) than what actually elapsed. Figure 28 evaluates the accuracy of drivers’ perceptions compared to the real travel time measured by the simulator. The left plot performs the analysis in an aggregate level for 10 data points comprised of the mean values of the five scenarios for each of the two alternative routes, I-95 and MD 295. The right plot includes all observations in a disaggregate level. As shown in the right plot, the bisector of the first quadrant intersects the regression line at about 25 minutes. It appears that drivers had an exaggerated PTT in their DS experiments for trips shorter than 25 minutes and they had an underestimated PTT for trips longer than that. The dispersion of data-points and small R-Squared value indicated an overall unsteady TT perception. According to figure 29, which shows the aggregate scenario-based comparison of PTT and ATT separately for the two routes, travel time in the longer route (MD 295) tended to be overestimated compared to the shorter route. It can be concluded that the route distance has an increasing impact on TT misperception.
Figure 28. PTT versus ATT for the Entire Experiments (Left: Aggregate; Right: Disaggregate).
R² = 0.6546
20
22
24
26
28
30
20 22 24 26 28 30
ATT (min)
PTT (min)
R² = 0.2049
51015202530354045505560
5 10 15 20 25 30 35 40 45 50
ATT (min)
PTT (min)

35
Figure 29. PTT versus ATT for Each Route in Each Scenario. Route Diversion Route diversion analysis in this study was conducted through two series of SP surveys and DS experiments with DMS2. As learned from past literature, the SP generally exaggerates the diversion rate due to the DMS information. The study results demonstrated this fact for all DMS contents. According to the SP results presented in figure 14, there is an 80 percent (the highest) probability that drivers divert to MD 295 from I-95 due to the message “accident ahead, 2 right lanes closed.” Jindahra and Choocharukul (2013) in a similar empirical SP data analysis in Thailand asserted that the diversion rate was nearly 80 percent when the cause of delay and suggested route information were displayed on the DMS. However, diversion occurred only in 4 percent of the current study’s experiments in the corresponding scenario V of the DS approach. Moreover, the overall diversion rate in the SP was reported as 68 percent for work trips and 65 percent for leisure trips, compared to only 1 percent in the DS. In fact, only 1 percent of those who chose I-95 diverted to MD 295 (through the MD 195 junction). Many reasons may explain this inconsistency between the SP and DS. Xu et al. (2011) asserted that factors such as time period and traffic conditions at off-ramps and downstream of the road distinguished field studies from the SP approach in typical driver behavior analysis. Chatterjee et al. (2002) reached similar conclusions when the actual diversion rate was 80 percent less than what was stated in the questionnaire. Therefore, the presence of queue and traffic congestion has a significant effect on the diversion likelihood. The traffic generation in the DS could not exceed a particular volume of traffic. Due to this restriction, which produced fairly fluent downstream traffic, subjects might not perceive the necessity to divert. Message comprehension for DMS2 might be another reason for the low compliance rate compared to DMS1. DMS2 provided qualitative information, while DMS1 provided quantitative information. Also, none of the DMS2 messages informed drivers of an alternate detour and GPS was not available to the subjects. Xu et al. (2011) concluded that travel time information on a DMS attracted more attention than traffic congestion information. In this study, although subjects were informed of the purpose of the research, a random debrief implied that a notable
0
5
10
15
20
25
30
AvgATTAvgPTT
min

36
portion of drivers did not read the message, most likely due to driving cognitive loads. Chatterjee et al. (2002), in a similar study, surveyed the reaction of drivers to an active DMS and declared that while many drivers found DMS information useful in a pre-SP survey, only one-third actually saw the DMS information and a small portion of them followed the recommendation. Furthermore, Zhong et al. (2012) suggested that besides drivers’ characteristics, perception of information, DMS content, and road familiarity, and even drivers’ mood when they observed the DMS determined compliance behavior with DMS guidance.

37
CONCLUSIONS AND LIMITATIONS In an empirical study, route choice data using both stated preference (SP) questionnaire and driving simulator (DS) techniques was collected. While the aggregate route choice pattern showed similarity between the two techniques, the disaggregate consistency rate was nearly 60 percent. Several studies in the field of route choice that merely used the SP method concluded encouraging effects of a DMS as a traffic management tool for route diversion. However, studies that utilized both SP and real-time traffic data (often via loop detectors) produced a more realistic view of a DMS with less promising effectiveness (Chatterjee et al., 2002; Xu et al., 2011). Although the diversion rate in this study’s SP analysis was in line with past SP studies, it had a huge gap with the observed diversions in DS experiments. A major limitation with a DS is that it fails to capture the influence of the interactive traffic stream on the test subject, better known as the chain reaction, and, therefore, fails to fully reflect drivers’ behavior. Erke et al. (2007) discovered that no driver followed a road section that was announced closed via a DMS due to the chain reaction effect. Route diversion in response to a DMS is typically associated with the behavior of the traffic stream as a whole system that induces a need to divert. One solution to this challenge would be integrating the DS with a fully-calibrated traffic simulator that could generate real traffic flow, which is responsive to real time changes. Nonetheless, some drivers are unable to comprehend the message in a timely manner due to driving cognitive loads. Fatigue is another limiting factor in DS studies. In spite of the aforementioned DS limitations, it is still a better way to study route choice behavior, especially if it is integrated with a traffic simulator. The research team found that no significant speed reduction was made by the subjects when reading a DMS. The majority of the subjects believed that a DMS is a useful tool in travelers’ information provision. Drivers with a higher DMS exposure rate were relatively more likely to pay attention to a DMS than those with less exposure. A DMS was found to be an effective tool in route choice, and the majority of drivers chose their routes based on the travel time information provided by the DMS. When the major route became slower, the probability of choosing the alternative routes was higher. The information provided after a route is selected was less effective, meaning that drivers were more reluctant to reroute after choosing their route. Basically, there was inertia toward the shorter route, which was wider, faster (in normal traffic), and had higher speed limit.
The study concluded that travel time is not the only factor affecting route choice. Personal perceptions and experiences (which were affirmed to be different from the reality) and the DMS information and its accuracy were significant determinants in the route decisions. The effectiveness of major factors such as travel time saving, perceived and actual travel time, route familiarity, and drivers’ impression of the completed experiment in route choice behavior were identified, and it was demonstrated that the combination of past experiences and information provided for drivers determined their route choices. Subjects’ perceived travel time was closer to what they observed (DMS travel time) than the actual travel time and they also overestimated travel time for the longer route. Drivers’ route preferences, which were acquired by multiple choice questions, were compared to their actual choices in the simulator experiments. Although the overall reaction trend to DMS information was consistent between the SP and DS, there was

38
an approximately 40 percent contradiction in individuals’ responses on paper and in the driving experiments. Lastly, the compliance rate with the DMS information was 65 percent for the DS and 59 percent for the SP cases. This study did not consider the influence of other travelers’ information sources such as radio advisory, 511, and personalized navigation system. The combination of a DMS and other information sources could increase diversion rate.

39
REFERENCES Brooks, J. O., Goodenough, R. R., Crisler, M. C., Klein, N. D., Alley, R. L., Koon, B. L., Logan Jr, W. C., Ogle, J. H., Tyrrell, R. A., & Wills, R. F. (2010). Simulator sickness during driving simulation studies. Accident Analysis and Prevention, Vol. 42 (3), pp. 788-796. Chatterjee, K., Hounsell, N. B., Firmin, P. E., & Bonsall, P. W. (2002). Driver response to variable message sign information in London. Transportation Research Part C, Vol. 10 (2), pp. 149–169. Colorado Department of Transportation (2005), CDOT Guidelines on Variable Message Signs (VMS), VMS Committee. Dutta A., D. L. Fisher, A. A. Noyce (2004). Use of a driving simulator to evaluate and optimize factors affecting understandability of variable message signs. Transportation Research Part F, Vol. 7, pp. 209–227. Erke, A., Sagberg, F., & Hagman, R. (2007). Effects of route guidance variable message signs (VMS) on driver behaviour. Transportation Research Part F, Vol. 10 (6), pp. 447–457. FHWA (2011), Federal Highway Administration, Office of Highway policy Information, http://www.fhwa.dot.gov/ohim/onh00/bar8.htm, Accessed on April 9th 2013. Forum 8 (2013), UC-win/Road New Features, http://www.forum8.co.jp/english/uc-win/ucwin-road-e1.htm, Accessed on April 14th 2013. Haghani, A., Hamedi, M., Fish, R. L. and Nouruzi, A. (2013). Evaluation of Dynamic Message Signs and Their Potential Impact on Traffic Flow. Maryland State Highway Administration, MD-13-SP109B4C. Jindahra, P. and Choocharukul, K. (2013). Short-Run Route Diversion: An Empirical Investigation into Variable Message Sign Design and Policy Experiments. IEEE Transactions on Intelligent Transportation Systems, Vol. 14 (1), pp. 388-397. Koutsopoulos, H. N., T. Lotan, Q. Yang (1994). A driving simulator and its application for modeling route choice in the presence of information. Transportation Research Part C, Vol. 2 (2), pp. 91–107. Molino, J. A., Wachtel, J., Farbry, J. E., Hermosillo, M. B., & Granda, T. M. (2009). The Effects of Commercial Electronic Variable Message Signs (CEVMS) on Driver Attention and Distraction: An Update. Federal Highway Administration, Report No. FHWA-HRT-09-018. Montes, C. (2008), Guidelines for the Use of Dynamic Message Signs on the Florida State Highway System, Prepared for: Florida DOT, Traffic Engineering and Operations Office, ITS Section.

40
MUTCD (2009), The Manual on Uniform Traffic Control Devices, 2009 Edition. New York State Thruway Authority (2011), Guidelines for Use of Variable Message Signs (VMS). Department of Maintenance and Operations, TAP-633. Oregon Department of Transportation (2008), Guidelines for the Operation of Variable Message Signs on State Highways, Highway Division, Traffic Management Section. Peeta, S., J. L. Ramos, and R. Pasupathy (2000). Content of Variable Message Signs and On-Line Driver Behavior. Transportation Research Record, Journal of Transportation research Board, 1725, pp. 102-108. Tawfik, A. M., Szarka, J., House, L., and Rakha, H. A. (2011). Disaggregate Route Choice Models Based on Driver Learning Patterns and Network Experience. 14th International IEEE Conference on Intelligent Transportation Systems, Washington, DC. Tian, H., Gao, S., Fisher, D. L., and Post, B. (2011). Route Choice Behavior in a Driving Simulator with Real-time Information. TRB Annual Meeting CD-ROM, Washington, D.C. TMS: Traffic Monitoring Systems (2013). Maryland State Highway Administration, Volume Count Detail Reports, http://shagbhisdadt.mdot.state.md.us/itms_public/, Accessed on June 15th 2013. Wardman M., P. W. Bonsall, and J. D. Shires (1997). Driver response to variable message signs: a stated preference investigation, Transportation Research Part C, Vol. 5 (6), pp. 389–405. Wang, J. H., Collyer, C. E. and Hesar, S. G. (2006). Employing Graphics to Aid Message Display on Dynamic Message Signs. University of Rhode Island Transportation Center, URITC FY 04-472. Wang, J. H., Keceli, M. and Maier-Speredelozzi, V. (2009). Effect of Dynamic Message Sign Messages on Traffic Slow Downs, TRB Annual Meeting CD-ROM, Washington, D.C. Xu, T., Sun, L. & Peng, Z. R. (2011). Empirical Analysis and Modeling of Drivers’ Response to Variable Message Signs in Shanghai, China. TRB Annual Meeting CD-ROM, Washington, D.C. Zhang, L. & Levinson, D. (2008). Determinants of Route Choice and Value of Traveler Information; A Field Experiment. Transportation Research Record, Journal of TRB, No. 2086, pp. 81-92. Zhong, S., L. Zhou, S. Ma, and N. Jia. (2012). Effects of Different Factors on Drivers’ Guidance Compliance Behaviors under Road Condition Information Shown on VMS. Transportation Research Part A, Vol. 46 (9), pp. 1490-1505.