state engineer - north dakota · state engineer of north dakota stream-flow measurement ... july i...
TRANSCRIPT

0_1o
cA) 0
OFFICE COPYco 68= DO NOTREMOVE
SIXTH BIENNIAL REPORT
of the
State Water ConservationCommission
and the
TWENTY-THIRD BIENNIAL REPORTof the
STATE ENGINEERof
North Dakota
STREAM-FLOW MEASUREMENTSUPPLEMENT
From October 1, 1946 to October 1, 1948

OFFICE COPYDO NOT REMOVE
SIXTH BIENNIAL REPORT
of the
State Water ConservationCommission
and the
TWENTY-THIRD BIENNIAL REPORT
of the
STATE ENGINEERof
North Dakota
STREAM-FLOW MEASUREMENT'1PLEMENT
From October 1, 1946 to October 1, 1948

2 REPORT OF N. D. WATER CONSERVATION COMMISSION
MISSOURI RIVER NEAR WILLISTON, N. D.Stream-Flow Information
(Addition to Supplement "B" of the Fourth Biennial Report.)
Second Run-off inMonth Foot Days Maximum Minimum Mean Acre-Feet1944-1945
October 654,800 27,600 17,000 21,090 1,297,000November 614,600 36,100 17,200 20,490 1,219,000December ______ 799,160 51,000 8,960 25,780 1,585,000January 489,200 19,700 10,100 15,780 970,300February 208,300 11,500 5,260 7,439 413,200March 665,400 I 50 600 5,680 21,460 1,320,000April 281,130 13,500 7,590 9,371 557,600May 420,0,90 18,800 7,810 13,550 833,200June 1,258,100 68,600 21,800 41,940 2,495,000July 1,105,600 63,300 I 20,200 35,660 2,193,000August 564,900 20,500 16,000 18,220 1,120,000September I 752,000 I 30,200 18,800 25,070 1,492,000
iWater year 1944-45 I 7,812,280 168,600 I 5,260 21,400 15,500,000
MISSOURI RIVER NEAR WILLISTON, N. D.Stream-Flow Information
(Addition to Supplement "B" of the Fourth Biennial Report.)
Second Run-off inMonth Foot Days Maximum I Minimum Mean Acre-Feet1945-1946
October 756,200 27,300 15,500 24,390 1,500,000November 389,100 17,000 6,800 12,970 771,800December _ 182,010 11,200 2,000 I 5,871 361,000January 252,650, 6,700 8,150 501,100February 198,200 12,200 5,200 7,079 393,100March 521,200 29,800 11,400 16,810 1,034,000April 346,610 16,600 I 8,850 11,550 687,500May 526,400 21,000 14,100 16,980 1,044,000June 1,119,100 52,200 24,400 37,300 2,220,000July 807,800 40,600 13,400 26,060 1,602,000August , 25,000 10,300 20,760 1,277,000September 758,100 36,600 22,400 25,270 1,504,000
Water Year 1945-46 6,501,070 52,200 I 2,000 17,810 12,900,000
MISSOURI RIVER NEAR ELBOWOODS, N. D.Stream-Flow Information
(Addition to Supplement "B" of the Fourth Biennial Report.)
Second Run-off inMonth Foot Days Maximum Minimum Mean Acre-Feet1944-1945
October 692,700 29,500 18,500 22,350 1.374,000November 603,700 23,600 10,600 20,120 1,197,000December 813,740 66,100 6,000 26,250 1,614,000January 522,900 24,600 6,200 16,870 1,037,000February 257,900 14,300 I 6,600 9,211 511,500March 837,700 71,000 6,400 27,020 1,662,000April 345,870 23,200 8,390 11,530 686,000May 429,450 19,700 8,180 13,850 851.800June 1,220,100 69,400 18,800 40,670 2,420,000July 1,119,100 64,400 23,900 36,100 2,220,000August .. 574,200 21,800 16,200 18,520 1,139,000September 754,300 30,400 I 17,300 I 25,140 I 1.496,000
Water Year 1944-45 8,171,660 71,000 6,000 22,390 16,210,000

PROPERTY OFND STATE WATER COMMISSION
LIBRARYSTATE OF NORTH DAKOTA
3
MISSOURI RIVER NEAR ELBOWOODS, N. D.Stream-Flow Information
(Addition to Supplement "B" of the Fourth Biennial Report.)
Second Run-off inMonth Foot Days Maximum Minimum IMean Acre-Feet1945-1946
October 759,900 26,200 17,600 24,510 1,507.000November 372,210 17,200 4,310 12,410 738,300December 189,990 10,000 3,800 I 6,129 376,800January 252,270 9,000 5,600 I 8,138 500,400February 194,300 9.300 5,000 I 6,939 385,400March 584,100 43,400 10,200 18,840 1,159,000April 374,000 15,800 10,400 12,470 741,800May 529.000 21,400 14,200 17,060 1,049,000June __________ 1,144,500 55,600 21,600 38,150 2,270,000July 874,300 40,200 15,200 28,200 1,734,000August 631,300 25,400 11,200 20,360 1,252,000September 748,000 138,500 22,930 24,930 1,484,000
Water Year 1945-46 _ 6,653,870 55,600 3,800 18,230 13,200,000
MISSOURI RIVER AT BISMARCK, N. D.Stream-Flow Information
(Addition to Supplement "B" of the Fourth Biennial Report.)
Second I I inMonth Foot Days I Maximum Minimum Mean I Acre-Feet1944-1945
October 704,900 28,300 19,400 22,740 1,398,000November 643,100 25,100 17,900 21,440 1,276,000December 498,000 21,600 9,400 16,060 987,800January 479,800 21,600 8,700 15,480 951,700February 344,040 20,200 7,900 12,290 682,400March 1,016,520 78,000 7,500 32,790 2,016,000April 380,320 23,200 9,020 12,680 754,400May 440,550 20,200 9,090 14,210 873,800June 1,161,200 71,300 18,300 38,710 2,303,000July 1,228,000 70,600 26,000 39,610 2,436,000August 580,000 24,300 15,900 18,710 1,150,000September 733,000 131,300 16,400 24,430 I 1,454,000
Water Year 1944-45 8,209,430 78.000 I 7,500 22,490 16,280,000
MISSOURI RIVER AT BISMARCK, N. D.Stream-Flow Information
(Addition to Supplement "B" of the Fourth Biennial Report.)
Second I I IRun-off inMonth Foot Days I Maximum Minimum Mean I Acre-Feet1945-1946
October 783,700 27,700 22,600 25,280 1,554,000November 370,500 21,700 5,200 12,350 734,900December 188,950 I 9,200 3,200 I 6,095 374,800January 200,000 7,500 3,600 6,452 396,700February 185,100 I 9,700 5,500 6,611 367,100March 664,700 57,000 10,200 21,440 1,318,000April ___________________ 368,900 14,500 10,700 12,300 731,700May 542,700 20,500 14,000 16,540 1,017,000June 1,112,000 56,100 17,500 37,070 2,206,000July 919,600 47,000 16,300 29,660 1,824,000August 619,800 25,800 11,000 19,990 1,229,000September 774,400 37,900 22,300 I 25,810 I 1,536,000
Water Year 1945-46 6,700,350 57,000 I 3,200 I 18,360 13,290,000

4 REPORT OF N. D. WATER CONSERVATION COMMISSION
LITTLE MUDDY NEAR WILLISTON, N. D.Stream-Flow Information
(Addition to Supplement "B" of the Fourth Biennial Report.)
Second I I 1 Run-off inMonth Foot Days I Maximum I Minimum Mean 1 Acre-Feet1945-1946
October November December January February March April 18-30 208 20 13 16.0 413May 438 20 11 14.1 869June 377.7 20 9 12.6 749July 1,816.4 712 7 58.6 3,600August 288.1 12 6 7.36 452September 190.9 1 9.1 I 5 I 6.361 379
The period 6,460
LITTLE MISSOURI RIVER AT MARMARTH, N. D.Stream-Flow Information
(Addition to Supplement "B" of the Fourth Biennial Report.)
Second I Run-off inMonth 1 Foot Days Maximum I Minimum IMean T Acre-Feet1944-1945
October 1,063 65 26 34.3 2,110November 1,422 137 2 47.4 2,820December 31 1 1 1.0 60January 31 1 1 1.0 60February 623 100 1 22.2 I 1,240March 71,054 9,320 3 2,292 I 140,900April 7,279 600 83 242 14,440May 3,396 367 44 110 6,730June 8,196 1,030 69 273 16,260July __ ______ 2,034 490 10, 65.6 4,030August 2,197 351 10 70.7 4,350September _ _ . _ __ _ 3,021 393 12 101 5,990
Water year 1944-45 100,347 9,320 1 275 198,990
LITTLE MISSOURI AT MARMARTH, N. D.Stream-Flow Information
(Addition to Supplement "B" of the Fourth Biennial Report.)
I Second Run-off InMonth I Foot Days Maximum 1 Minimum I Mean 1 Acre-Feet1945-1946
October 1,089 92 10 35.1 2,160November __ 408 21 9 13.6 809December 156 10 1 5.0 309January 278 25 1 9.0 551February 1,222 300 1 43.6 2,420March_ ________ ---- .--- - I 9,339 728 144 301 18,520April 4,804 650 34 160 9,530May 16,470 I 3,640 23 531 32,670June I 41,176 I 5,020 227', . 81,670July I 7,984 2,000 20 258 15,840August I 1,011 180 2 32.6 2,010September 3,736 532 8 125 7,410
Water year 1945-46 I 87.673 5.020 1 240 173,900 _

STATE OF NORTH DAKOTA 5
LITTLE MISSOURI RIVER AT MEDORA, N. D.Stream-Flow Information
(Addition to Supplement "B" of the Fourth Biennial Report.)
Second Run-off inMonth Foot Days Maximum I Minimum Mean I Acre-Feet 1945-1946
October 1,633 250 25 52.7 3,240November 517 28 7 I 17.2 1,030December 193 12 2 6.2 383January 277 25 0 8.9 549February 317 150 0 11.3 629March 11,791 700 159 380 23,390April 6,944 910 46 231 13,770May 15,172 3,570 48 489 30,090June 46,910 5,550 270 1,564 93,040July 10,073 1,170 67 325 19.980August 1,252 142 8 40.4 2,480September 4,316 540 I 8 144 I 8,560
Water year 1945-46 99,395 5,550 0 272 197,100
LITTLE MISSOURI RIVER AT WATFORD CITY, N. D.Stream-Flow Information
(Addition to Supplement "B" of the Fourth Biennial Report.)
Second I Run-off inMonth Foot Days Maximum I Minimum Mean I Acre-Feet 1944-1945
October 2,167 115 40 69.9 4,300November 4,420 608 10 147 8,770December _ 161 10 1 5.2 319January February 4,610 1,000 165 9,140March 155,350 17,300 20 5,011 308,100April 18,756 2,280 211 625 37,200May 5,257 544 94 170 10,430June 17,274 2,175 168 576 34,260July 4.324 357 68 139 8,580August 3,071 267 20 99.1 6,090September 3,301 I 374 I 24 110 6,550
Water year 1.944-45 . 218,691 17,300 599 433,739
LITTLE MISSOURI NEAR WATFORD CITY, N. D.Stream-Flow Information
(Addition to Supplement "B" of the Fourth Biennial Report.)
Second Run-off inMonth Foot Days Maximum Minimum Mean Acre-Feet1945-1946
October 2,797 306 36 90.2 5,550November 409 30 5 13.6 811December 62 2.0 123January 76 2.5 151February 7,883 3,000 282 15,640March 15,391 1,500 223 496 30,530April 8,512 895 79 284 16,880May 8,510 3,040 58 275 16,880June _ 49,488 4,640 377 1,650 98,160July 15,753 1,240 115 508 31,250August 2,104 122 I 14 67.9 4,170September _ 4,576 I 377 I 8 153 9,080
Water year 1945-46 ... 115,561 4,640 317 229,200

6 REPORT OF N. D. WATER CONSERVATION COMMISSION
LITTLE BEAVER CREEK NEAR MARMARTH, N. D.Stream-Flow Information
(Addition to Supplement "B" of the Fourth Biennial Report.)
Second I I Run-off inMonth Foot Days I Maximum I Minimum I Mean Acre-Feet 1944-1945
October 120.3 I 8.8 1 2.8 3.88 239November 240.4 19 1.0 8.01 477December 15.9 1.0 .2 .51 32January 3.1 .1 .1 .10 6.1February 1,342.6 500 .1 48.0 2,660March 12,845.4 2,100 .2 414 25,480April 840 85 14 28.0 1,670May 715.2 297 8.0 I 23.0 1,420June 1,751.8 560 8.8 I 58.4 3,470July 154..9 8.8 2.2 I 5.00 307August 7.5 1.4 0 I .24 15September 38.8 I 4.9 0 1.291 77
Water year 1944-45 18,075.9 I 2,100
0 I 49.5 35,853.1
LITTLE BEAVER CREEK NEAR MARMARTH, N. D.Stream-Flow Information
(Addition to Supplement "B" of the Fourth Biennial Report.)
I Second 1 Run-off inMonth I Foot Days 'Maximum Minimum 1 Mean Acre-Feet1945-1946
October 133.4 11 2.0 4.30 265November 110.6 I 8.0 2.3 3.69 219December 31 2 0 1.0 61January 21 2 0 .6 42February 319 150 0 11.4 633March 1,033 I 100 10 33.3 2,050April 145.8 I 8.8 I 3.2 4.86 289May . 246.1 67 1.5 7.94 488June 2,816.3 795 1.7 93.9 5,590July 4,678.0 1,840 1.3 151. 9,280August 106.6 I 38 0 3.44 211September 125.9 I 31 .1 4.201 250
Water year 1945-46 9,766.7 I 1,840 0 26.8 19,380
KNIFE RIVER NEAR GOLDEN VALLEY, N. D.Stream-Flow Information
(Addition to Supplement "B" of the Fourth Biennial Report.)
Second 1 Run-off inMonth Foot Days Maximum Minimum Mean Acre-Feet1944-1945
October 359 19 10 11.6 712November 928 95 8 30.9 1,840December 275 10 5 8.9 645January 231 10 3 7.5 458February 487 100 3 17.4 966March 42,195 7,000 3 1,361 83,690April 2,588 170 40 86.3 5,130May 1,144 300 23 36.9 2,270June 6,166 1,760 21 206 12,230July 542 32 13 17.5 1,080August 385.7 27 7.8 12.4 765September 210.4 8.0 I 6.0 7.01 417
Water year 1944-45 55,511.1 7,000 3 152 110,103

STATE OF NORTH DAKOTA 7
KNIFE RIVER NEAR GOLDEN VALLEY, N. D.Stream-Flow Information
(Addition to Supplement "B" of the Fourth Biennial Report.)
Second I Run-off inMonth Foot Days Maximum Minimum Mean I Acre-Feet1945-1946 I
October 203.6 7 6 6.571 404November 246.7 10 6 8.221 489December 108.2 9 1 3.49 215January 131 8 2 4.2 1 260February 1,271.5 300 1 45.4 1 2,520March 7,644 1,400 32 247 1 15,160April 546.0 32 9.0 18.2 1,080May 270.3 13 6.9 8.72 536June 1,082.4 177 4.0 36.1 I 2,150July 2,10.9.0 588 4.8 68.0 I 4,180August 124.7 35 .9 4.021 247September 130.4 6.3 2.9 4.351 259
Water year 1945-46 13,867.8 1,400 0.9 38.0 I 27,500
KNIFE RIVER NEAR GOLDEN VALLEY, N. D.Stream-Flow Information
(Addition to Supplement "B" of the Fourth Biennial Report.)
Second I Run-off inMonth Foot Days I Maximum Minimum Mean I Acre-Feet1946-1947
October 474.2 39 2.9 15.3 I941November 252.8 I 19 I 4.6 8.43 501December 189 8 5 6.1 375January 1,783 400 3 57.5 3,540February 5,887 1,600 17 210 11,680March 13,849 3,000 16 447 27,470April 11,579 1,580 42 386 22,970May 685 37 14 22.1 1,360June 20,436 5,630 12 681 40,530July 2,237 2.91 23 72.2 4,440August __ 1,508 319 12 48.6 2,990September 322 I12 10 I 10.7 639
Water year 1946-47 59,202.0 I 5,630 I 2.9 162 1 117,400
KNIFE RIVER AT HAZEN, N. D.Stream-Flow Information
(Addition to Supplement "B" of the Fourth Biennial Report.)
Second 1 T Run-off inMonth 1 Foot Days Maximum 1 Minimum Mean I Acre-Feet 1944-1945
October I 1,090 45 32 35.2 2,160November 1,835 171 25 61.2 3,640December I 566 25 11 18.3 1,120January I 545 T 40 10 17.6 1,080February I 2,7 2 400 10 99.4 5,520March I 65,489 8,520 25 2,113 129,900April I 5,404 453 77 180 10,720May I 2,247 110 62 72.5 4,460June 9,240 2,180 71 308 18,330July 1,743 160 33 56.2 3,460August 1,112 51 23 35.9 2,210September I 810 30 21 27.0 1,610
Water year 1944-45 I 92,863 8,520 I 10 254 184,210

8 REPORT OF N. D. WATER CONSERVATION COMMISSION
KNIFE RIVER AT HAZEN, N. D.Stream-Flow Information
(Addition to Supplement "B" of the Fourth Biennial Report.)
Second 1 Run-off inMonth Foot Days !Maximum Minimum Mean Acre-Feet 1945-1946
October 864 30 27 27.9 1,710November 863 33 20 28.8 1,710December 387 24 7 I 12.5 768January 455 19 10 I 14.7 902February 3,145 700 6 I 112 6,240March 19,350 3,300 104 624 38,380April 1,694 104 30 56.5 3,360May 918 34 25 29.6 1,820June 3,824 702 18 I 127 7,580July 4,735 837 23 I 153 9,390August 483 31 11 I 15.6 958September 614 31 I 14 I 20.5 I 1,220
Water year 1945-46 37,332 13,300 6 102 74,040
KNIFE RIVER AT HAZEN, N. D.Stream-Flow Information
(Addition to Supplement "B" of the Fourth Biennial Report.)Second I I Run-off in
Month Foot Days Maximum 'Minimum I Mean Acre-Feet1946-1947
October 1,173 96 I 15 1 37.8 y 2,330November 795 42 15 I 26.5 I 1,580December 536 20 I 13
I 1,060January 3,123 650 10 I 101 6,190February 8,269 1,700 26 295 16,400March 21,472 3,500 I 34 I 693 42,590April 23,675 2,250 102 I 789 46,960May 1,757 96 I 42 I 56.7 3,480June 25,715 5,910 I 40 II 857 51,000July 4,663 452 I 60 I 150 9,250August 2,504 300 26 I 80.8 I 4,970September 1,005 38 I 30 33.5 1,990
Water year 1946-47 94,687 I 5,910 I 10 I 259 I 187,800
SPRING CREEK AT ZAP, N. D.Stream-Flow Information
(Addition to Supplement "B" of the Fourth Biennial Report.)
Second I Run-off inMonth Foot Days Maximum Minimum Mean I Acre-Feet1945-1946 1
October 183.3 6.6 5.3 5.911 364November 214.8 9 5 7.161 426December 96 8 1 3.1 I 190January 98 8 0 3.2 194February 943 250 0 33.7 1.870March 6,852 1,400 22 221 13,590April 430.7 29 8.9 14.4 854May 347.3 46 5.8 11.2 689June 554.4 237 4.2 18.6 1,100July 505.6 120 2.4 16.3 1,000August 128.4 26 1.3 4.14 255September 118.3 8.9 2.2 3.94 235
Water year 1945-46 10,471.8 1,400 0 28.7 I 20,770

STATE OF NORTH DAKOTA 9
SPRING CREEK AT ZAP, N. D.Stream-Flow Information
(Addition to Supplement "B" of the Fourth Biennial Report.)
Second 1 1 Run-off inMonth Foot Days Maximum Minimum Mean 1 Acre-Feet1946-1947
October 239.2 12 3.5 7.721 474November 202.3 16 4 6.741 401December 155 7 3 I 5.0 1 307January 669 130 2 I 21.6 I 1,330February 1,107 350 3 39.5 1 2,200March 5,154 1,150 2 166 I 10,220April 4,417 615 22 147 1 8,760May 464.0 25 9.2 15.0 1 920June 5,778.0 1,430 8.5 193 1 11,460July 985 118 10 I 31.8 I 1,950August 351.1 30 6.6 I 11.3 I 696September 205.0 I 9.9 5.3 I 6.831 407
1Water year 1946-47 19,726.6 1,430 2 54.0 39,120
HEART RIVER NEAR DICKINSON, N. D.Stream-Flow Information
(Addition to Supplement "B" of the Fourth Biennial Report.)
Second I I I I Run-off inMonth I Foot Days I Maximum 1 Minimum I Mean I Acre-Feet 1945-1946 I
June 33.5 6.0 0.8 3.351 66July 69.6 19.3 I .7 2.251 138August 39.5 5.6 1 .4 1.271 78September 1 35.1 1 3.5 1 .7 I 1.171 70
1 1 1The period 1945-1946 I 1 I I I 362
HEART RIVER NEAR LEHIGH, N. D.Stream-Flow Information
(Addition to Supplement "B" of the Fourth Biennial Report.)
Second 1 1 I Run-off inMonth Foot Days I Maximum I Minimum Mean I Acre-Feet1944-1945
October 111 10 I 2 3.6 220November 229 25 I 3 7.6 444December 109 5 2 3.5 216January 143 10 I 2 4.6 284February 2,362 500 I 2 84.4 4,680March 20,121 4,090 3 649 39,910April 1,946 256 I 16 64.9 3,860May _____ _ 444 43 I 11 1 14.3 881June 1,069.1 208 I 7.4 1 35.6 2,120July 206.1 19 I 3.8 6.651 409August 75.4 5.5 I 1.3 1 2.431 150September 113.4 6.4 I 2 3.781 225
1Water year 1944-45 26,929 I 4,090 I 1.3 73.S ! 53,409

10 REPORT OF N. D. WATER CONSERVATION COMMISSION
HEART RIVER AT LEHIGH, N. D.Stream-Flow Information
(Addition to Supplement "B" of the Fourth Biennial Report.)
Second Run-off inMonth Foot Days Maximum Minimum Mean Acre-Feet1945-1946
October 122.6 5.9 2.7 3.95 243November 122.5 5.9 2 4.08 243December 69 4 1 2.2 137January 42 2 1 1.4 83February 57 8 1 2.0 113March 244.0 10 2 7.87 484April 135.4 8.3 2.5 4.5.1 269May 152.7 13 1.4 4.93 303June 208.4 18 2.5 6.95 413July 172.7 13 1.4 5.57 343August 93.2 I 8.6 .3 3.01 185September __ 54.7 I 3.1 .7 1.821 108
Water year 1945-46 1,474.2 18 .3 4.04 2,920
HEART RIVER NEAR RICHARDTON, N. D.Stream-Flow Information
(Addition to Supplement "B" of the Fourth Biennial Report.)
Second i Run-off inMonth Foot Days Maximum !Minimum Mean Acre-Feet1944-1945
October 421 16 12 13.6 835November 1,468 642 I 10 48.9 2,910December 356 20 I 5 11.5 706January 209 12 I3 6.7 414February 2,497 500 2 89.1 4,950March 65,871 I 9,690 I 10 2,126 130,700April 6,474 981 I 66 216 12,840May 1,743 116 41 56.2 3,460June 5,582 1,980 32 186 11,070July 1,332 294 I 23 42.9 2,640August 479.9 7.9 15.4 952September _ 297.5 1 13 I 7.6 9.91 590
Water year 1944-45 86,730.4 9,690 I 2 282 172,067
HEART RIVER NEAR RICHARDTON, N. D.Stream-Flow Information
(Addition to Supplement "B" of the Fourth Biennial Report.)
SecondI1 Run-off inMonth Foot Days Maximum Minimum Mean 1 Acre-Feet1945-1946 I I I
October 308.3 I 12 I 8.7 9.951 612November 289.3 12 8 9.64 574December 157 11 I 0 5.1 I 311January 96 I 4 2 3.1 190February 457 I 120 0 16.3 906March 5,030 I 600 38 162 9,980April 735 I 48 I 11 24.5 1,460May 455.4 1 22 I 9.7 14.7 903June 474.0 69 5.9 15.8 I 940July 416.3 I 84 I 1.4 13.4 1826August 101.4 I 14 I .5 3.27 201September __ _ 146.0 I 7.8 I 1.8 4.871 290
Water year 1945-46 _ 8,665.7 I 600 1 .0 23.7 1 17,190
STATE OF NORTH DAKOTA 11
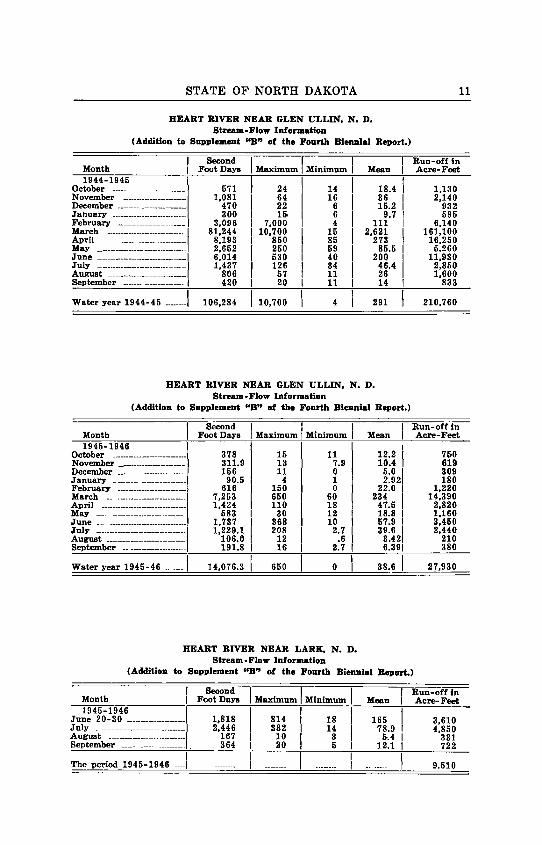
HEART RIVER NEAR GLEN ULLIN, N. D.Stream•Flow Information
(Addition to Supplement "B" of the Fourth Biennial Report.)
Second Run-off inMonth Foot Days Maximum Minimum I Mean Acre-Feet1944-1945
October 571 24 14 I 18.4 1,130November 1,081 64 16 36 2,140December 470 22 I 6 I 16.2 932January 300 16 6 9.7 595February 3,096 7,000 4 111 6,140March 81,244 10,700 I 15 2,621 161,100April 8,193 860 I 85 273 16,250May __ 2,652 250 59 86.5 5,260June 6,014 530 I 40 200 11,930July 1,437 126 34 I 46.4 2,850August 806 57 11 I 26 I 1,600September 420 20 I 11 I 14 I 833
Water year 1944-45 106,284 10,700 I 4 291 210,760
HEART RIVER NEAR GLEN ULLIN, N. D.Stream-Flow Information
(Addition to Supplement "B" of the Fourth Biennial Report.)
Second I Run-off inMonth Foot Days Maximum Minimum Mean I Acre-Feet1945-1946
October 378 15 11 12.2 760November __ 311.9 13 7.9 10.4 619December 156 11 0 5.0 I 309January 90.5 4 1 2.92 180February 616 150 0 22.0 1,220March 7,253 650 60 234 14,390April 1,424 110 18 47.5 2,820May 583 30 12 18.8 1,160June 1,737 368 10 57.9 3,450July 1,229.1 208 2.7 39.6 2,440August 106.0 12 .6 3.42 210September I 191.8 I 16 I 2.7 I 6.39 380
Water year 1945-46 14,076.3 650 0 38.6
27,930
HEART RIVER NEAR LARK, N. D.Stream-Flow Information
(Addition to Supplement "B" of the Fourth Biennial Report.)
I Second Run-off inMonth Foot Days I Maximum Minimum IMean I Acre-Feet 1945-1946
June 20-30 1,818 I 814 18 I 165 I 3,610July 2,446 I 382 14 I 78.9 I 4,850August 167 I 10 3 I 5.4 I 331September 364 I 20 5 I 12.1 I 722
The period 1945-1946 9,510

12 REPORT OF N. D. WATER CONSERVATION COMMISSION
HEART RIVER NEAR MANDAN, N. D.Stream-Flow Information
(Addition to Supplement "B" of the Fourth Biennial Report.)
I Second Run-off in
Month I Foot Days Maximum Minimum Mean Acre-Feet1944-1945
October 1,197 50 34 38.6 2,370November 2,162 581 15 72.1 4,290December 617 30 10 19.9 1,220January 435 20 8 14.0 863February 4,693 800 6 168 9,310March 100,387 13,400 10 3,238 I 199,100April _. 13,850 1,290 159 462 27,470May _ . ______ _.. I 3,675 153 93 119 7,290June . ___ 10,342 906 96 345 20,510July 2,359 05 57 76.1 4,680August 1,754 196 31 66.6 3.480September __. . . . . 926 43 25 30.9 1,840
Water year 1944-45 __. 142,397 1 13,400 6 390 282,423
HEART RIVER NEAR MANDAN, N. D.Stream-Flow Information
(Addition to Supplement "B" of the Fourth Biennial Report.)
Second Run-off inMonth Foot Days Maximum I Minimum Mean Acre-Feet1945-1946
October 854 29 26 27.5 1,090November 653 31 15 21.8 1,300December 330 20 0 10.6 655January 22 1 0 .7 44February 121 50 0 4.3 240March 16,747 1,500 239 540 33,220April 2,416 200 35 80.5 4,790May 1,115 42 30 36.0 2,210June 2,395 652 23 79.8 4,750July 3,235 829 13 104 6,420August 244 12 4 7.9 484September ____ _ . 363 20 4 I 12.3 I 732
Water year 1945-46 I 28,501 1.500 0 78.1 I56,540
GREEN RIVER NEAR GLADSTONE, N. D.Stream-Flow Information
(Addition to Supplement "B" of the Fourth Biennial Report.) =---
- - - -Run-off inSecond
Month IFoot Days Maximum I Minimum 1 Mean I Acre-Feet1945-1946 I I I
October 113.3 I 6.1 I 2.6 I 3.65 225November ___ 116.7 I 5.2 1 2.5 3.89 231December 54 I 4 0 I 1.7 107January 10 1 0 I .3 20February 138 100 0 I 4.9 274March 1,365.8 I 130 9.8 I 44.1 2,710April 198.6 I 8.S 4.3 I 6.63 394May 124.7 5.9 2.9 I 4.021 247June I 134.7 I 12 I1.6 I 4.191 267July 74.5 I 13 .4 I 2.401 148August 1 25.4 I 4.1 I .1 I .821 50September ____ 40.2 I 2.8 I 1.0 1.511 90
Water year 1945-46 _ 2,400.9 130 0 I 6.581 4,760
STATE OF NORTH DAKOTA 13
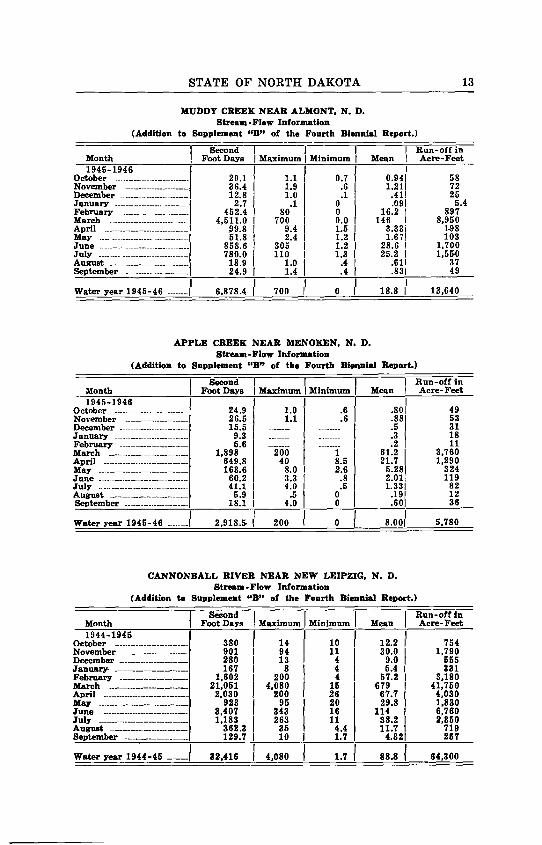
MUDDY CREEK NEAR ALMONT, N. D.Stream-Flow Information
(Addition to Supplement "B" of the Fourth Biennial Report.)
Second I 1 Run-off inMonth Foot Days 1 Maximum Minimum Mean 1 Acre-Feet 1945-1946 I I
October 29.1 1.1 0.7 0.941 58November 36.4 1.9 .6 1.211 72December 12.8 1.0 .1 .41! 25January 2.7 I .1 0 .091 5.4February 452.4 I 80 0 16.2 I 897March 4,511.0 I 700 9.0 146 1 8,950April 99.8 I 9.4 1.5 3.33i 1.98May 51.8 2.4 1.2 1.671 103June 858.6 I 305 1.2 28.6 I 1,700July 780.0 I 110 1.3 25.2 I 1,550August 18.9 I 1.0 .4 .611 37September 24.9 I 1.4 .4 .831 49
Water year 1945-46 6,878.4 I 700 I 0 I 18.8 1 13,640
APPLE CREEK NEAR MENOKEN, N. D.Stream-Flow Information
(Addition to Supplement "B" of the Fourth Biennial Report.)
Second Run-off inMonth Foot Days Maximum Minimum Mean Acre-Feet1945-1946
October 24.9 1.0 .6 .80 49November 26.5 1.1 .6 .88 53December 15.5 .5 31January 9.3 .3 18February 5.6 .2 11March 1,898 200 1 61.2 3,760April 649.8 40 8.5 21.7 1,290May 163.6 8.0 2.6 5.28 324June 60.2 3.3 .8 2.01 119July 41.1 4.0 .5 1.33 82August____ __ _ ________________ _ 5.9 .5 0 .19 12September 18.1 I 4.0 0 .60 36
Water year 1945-46 2,918.5 200 0 8.00 5,780
CANNONBALL RIVER NEAR NEW LEIPZIG, N. D.Stream-Flow Information
(Addition to Supplement "B" of the Fourth Biennial Report.)
Second I I Run-off inMonth Foot Days Maximum I Minimum I Mean Acre-Feet1944-1945
October 380 14 10 I 12.2 754November 901 94 I 11 I 30.0 1,790December 280 13 I 4 I 9.0 555January 167 8 4 5.4 331February 1,602 200 4 I 57.2 3,180March 21,051 4,080 15 1 679 41,750April 2,030 200 I 26 1 67.7 4,030May 923 95 20 29.8 1,830June 3,407 343 16 114 6,760July 1,183 263 11 I 38.2 2,350August 362.3 35 4.411.7 719September 129.7 10 1.7 4.321 267
Water year 1944-45 82,416 4,080 1.7 1 88.8 64,300

14 REPORT OF N. D. WATER CONSERVATION COMMISSION
CANNONBALL RIVER NEAR NEW LEIPZIG, N. D.Stream-Flow Information
(Addition to Supplement "B" of the Fourth Biennial Report.)
Second Run-off inMonth Foot Days Maximum Minimum I Mean Acre-Feet1945-1946 I
October 155.7 11 2.3 5.02 309November 191.2 9.4 5.0 6.37 379December... _ 89 6 1 2.9 177January 55 2 1 1.8 109February 253 60 0 9.0 502March 1,580 107 20 51.0 1' 3,130April 651.5 63 5.8 21.7 1,290May 213.0 15 2.7 6.87 422June 335.3 41 2.1 11.2 665July 1,046.0 178 1.3 33.7 2,070August 120.3 28 .3 3.88 239September 83.4 5.8 1.0 I 2.78 165
IWater year 1945-46 4,773.4 178 0 13.1 I 9,460
CANNON BALL RIVER NEAR NEW LEIPZIG, N. D.Stream-Flow Information
(Addition to Supplement "B" of the Fourth Biennial Report.)
Second I Run-off inMonth Foot Days Maximum I Minimum Mean Acre-Feet1946-1947
October 208.3 12 I 1.8 6.72 413November 246.1 15 I 4 8.20 488December 150 6 I 3 4.8 298January 644 130 I 2 20.8 1,280February 6,099 1,000 11 218 12,100March 13,855 4,600 I 15 447 27,480April 10,711 2,030 I 53 357 21.240May 783 45 I 14 25.3 1,550June 14,095 3,110 I 12 470 27,960July 2,836 338 I 17 91.5 5,630August 351.6 17 4.5 11.3 697September 156.2 6.9 I 2.9 I 5.21 310
Water year 1946-47 _____ 50,135.2 I 4,600 I 1.8 137
99,450
CANNONBALL RIVER AT BREIEN, N. D.Stream-Flow Information
(Addition to Supplement "B" of the Fourth Biennial Report.)
Second IMonth Foot Days I Maximum1944-1945
October 803 50November 2,195 150December 656 33January 397 20February 6,620 1,000March 42,883 6,020April 7,696 750May 2,991 214June 9,671 775July 2,051 174August 1,327 128September 685.9 99
Run-off in
Minimum Mean Acre-FeetI
20 25.9 1,59021 73.2 4,350
8 21.2 1,3007 12.8 I 787
10 236 13,13055 1,383 85,06091 257 15,26066 96.55,93066 322 19,18028 66.2 4,07017 I 42.8 2,6307.6 I 22.9 1,360
Water year 1944-45 77,975.9 I 6,020
7 214 164.647

STATE OF NORTH DAKOTA 15
CANNONBALL RIVER AT BREIEN, N. DAK.Stream-Flow Information
(Addition to Supplement "B" of the Fourth Biennial Report.)
Second I I Run-off inMonth Foot Days 1 Maximum Minimum Mean 1 Acre-Feet 1945-1946 I I
October 236.8 I 9.3 6 7.641 470November 433.6 I 20 8.6 14.5 1 860December 377 I 21 5 12.2 I 748January 114 I 5 1 3.7 I 226February 207 50 1 7.4 I 411March 7,961 I700 100 257 I 15,790April 2,541 I 205 28 84.7 5,040May 952 I 79 13 30.7 1,890June 2,733 I 590 13 91.1 I 5,420July 1 5,693 I 1,280 I 15 I 184 I 11,290August 406.3 I 65 3.0 13.1 I 806September 561.7 I 81 1.9 18.7 I 1,110
Water year 1945-46 ___ 22,216.4 I 1,280 1 60.9 I 44,060
CEDAR CREEK AT PRETTY ROCK, N. D.Stream-Flow Information
(Addition to Supplement "B" of the Fourth Biennial Report.)
Second 1 Run-off inMonth Foot Days I Maximum Minimum Mean Acre-Feet1944-1945 I I
October 162.8 I 15 3.0 5.25 323November 324.3 I 28 5.7 10.8 643December 167 I 10 2 5.4 331January 70 I 3 2 2.3 139February 2,237 I 300 2 79.9 4,440March 9,179 I 1,500 10 296 18,210April 1,398 I 164 15 46.6 2,770May 528.6 I 36 6.9 17.0 1,050June 2,519 I 215 12 84.0 5,000July 211..9 I 33 1.5 6.84 420August 151 45 0.3 4.87 300September 19.1 I 1.5 0.1 0.64 38
1 IWater year 1944-45 16,967.7 1 1,500 0.1 ' 46.5 1 33,664
CEDAR CREEK AT PRETTY ROCK, N. D.Stream-Flow Information
(Addition to Supplement "B" of the Fourth Biennial Report.)
Second 1Run-off inMonth Foot Days I Maximum 1 Minimum Mean Acre-Feet1945-1946 *
October_____ _. __ _ ____ __ 36.8 I 2.0 .5 1.19 73November 67.7 I 3 I 1 2.26 134December 39 I 3 0 1.3 77January 31 I 1 1 1.0 61February 48 I 15 0 1.7 95March 831 I 60 10 26.8 1,650April 423.5 56 1.7 14.1 840May 143.2 13 1.1 4.62 284June 591.6 I 212 .7 19.7 1,170July 1,299.6 184 .6 41.9 2,580August 6.1 .5 0 .20 12September 2.9 I .7 0 .10 5.8
Water year 1,945-46 3,520.4 I 212
0
9.641 6,980
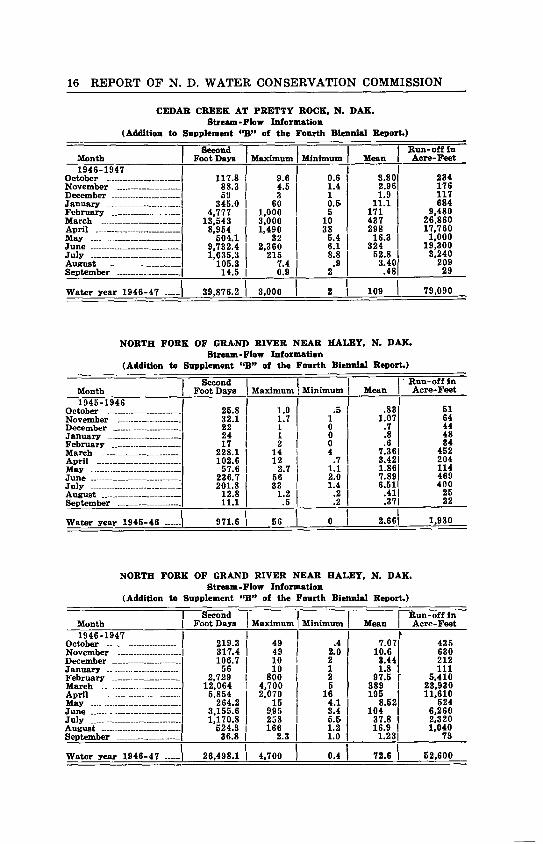
16 REPORT OF N. D. WATER CONSERVATION COMMISSION
CEDAR CREEK AT PRETTY ROCK, N. DAK.Stream-Flow Information
(Addition to Supplement "B" of the Fourth Biennial Report.)
SecondRun-off inMonth Foot Days Maximum 1 Minimum Mean Acre-Feet1946-1947
October 117.8 9.6 0.6 3.80 234November 88.3 4.5 1.4 2.96 176December 59 3 1 1.9 117January 345.0 60 0.5 11.1 684February 4,777 1,000 5 171 9,480March I 13,543 3,000 10 437 26,860April 8,954 1,490 38 298 17,760May 504.1 32 5.4 16.3 1,000June 9,732.4 2,360 6.1 324 19,300July 1,635.3 215 8.8 52.8 3,240August 105.3 7.4 .9 3.40 209September 14.5 I 0.9 2 .48 29
Water year 1946-47 39,876.2 3,000 2 109 79,090
NORTH FORK OF GRAND RIVER NEAR HALEY, N. DAK.Stream-Flow Information
(Addition to Supplement "B" of the Fourth Biennial Report.)
Second' Run-off inMonth Foot Days I Maximum Minimum I Mean Acre-Feet1945-1946
October 25.8 1.0 .5 .83 51November 32.1 I 1.7 1 1.07 64December 22 I 1 0 .7 44January 24 I 1 0 .8 48February 17 I 2 0 .6 34March 228.1 I 14 4 7.36 452April 102.6 I 12 .7 3.42 204May 57.6 I 2.7 1.1 1.86 114June 236.7 I 56 2.0 7.89 469July 201.8 33 1.4 6.51 400August 12.8 1.2 .2 .41 25September 11.1 .5 .2 .37 22
Water year 1945-46 971.6 I 56 0 2.66 1,930
NORTH FORK OF GRAND RIVER NEAR HALEY, N. DAK.Stream-Flow Information
(Addition to Supplement "B" of the Fourth Biennial Report.)
Second I I Run-off inMonth Foot Days I Maximum Minimum Mean I Acre-Feet1946-1947 I I`
October 219.3 49 .4 7.07 435November 317.4 49 2.0 10.6 630December 106.7 10 I 2 3.44 212January 56 10 I 1 1.8 111February 2,729 800 I 2 97.5 5,410March 12,064 4,700 5 389 1 23,930April 6,854 2,070 16 195 I 11,610May 264.2 15 4.1 8.521 524June 3,155.6 995 I 3.4 104 I 6,260July _ 1,170.8 258 5.5 37.8 1 2.320August 524.3 I 166 I 1.2 16.9 I 1,040September 36.8 I 2.3
II1.0 I 1.231 73
Water year 1946-47 26,498.1 II4,700I
0.4 72.6 52,600

STATE OF NORTH DAKOTA 17
JAMES RIVER AT JAMESTOWN, N. D.Stream-Plow Information
(Addition to Supplement "B" of the Fourth Biennial Report.)Second Run-off in
Month Foot Days Maximum Minimum Mean Acre-Feet1944-1945
October 104.7 I 6.0 I 2.0 I 3.38 208November 337.0 25 I 4.0 I 11.2 668December 372.5 50 2.5 12.0 739January 81.6 5.0 1.5 2.63 162February 72.3 5.0 1.5 2.58 143March 4,131.6 324 2 133 8,190April 2,267 128 I 28 75.6 1 4.500May I 842 57 I 16 27. 1,670June 424.1 30 I 1 14.1 1 841July 85.2 18 0.6 2.75 169August 127.0 33 1.2 4.10 252September 75.6 10 1.2 I 2.52 150
Water year 1944-45 1 8,920.6 324 0.6 24.4 17,692
JAMES RIVER AT JAMESTOWN, N. D.Stream-Flow Information
(Addition to Supplement "B" of the Fourth Biennial Report.)
Second I Run-off inMonth Foot Days Maximum Minimum I Mean Acre-Feet1945-1946 I
October 59.7 2.6 1.1 I 1.93 118November 42.8 1.6 1.1 I 1.43 85December 45.6 2.2 .9 I 1.47 90January 43.4 2.2 1.0 I 1.40 86February 34.6 1.6 1.0 I 1.24 69March 1,885.9 149 1.2 I 60.8 3,740April 2,850 159 39 I 95.0 5,650May 617 35 11 I 19.9 1,220
156.2June 21 .4 I 5.21 310July 144.3 264.65 286August 82.2 9.7 .69 2.65 163September 67.8 17 .5 I 2.26 134
IWater year 1945-46 6,029.5 159 .4 I 16.5 11,950
RED RIVER AT WAHPETON, N. D.Stream-Flow Information
(Addition to Supplement "B" of the Fourth Biennial Report.)
Second T Run-off inMonth Foot Days Maximum Minimum I Mean I Acre-Feet1944-1945
October I 23,362 811 706 754 46,340November I 20,786 773 416 693 41,230December I 13,206 493 236 426 26,190January 12,057 422 331 389 23,910February 10,248 429 319 366 20,330March 38,741 3,740 328 1,250 76.840April I 33,987 1,460 758 1,133 67,410May 25,963 1,100 706 838 51,500June I 27,488 1,170 I729 916 64,520July I 9,546 620 184 308 I18,930August I 4,532 202 112 146 8,990September I 4,222 208 94 141 I 8,370
Water year 1944-45 224,138 3,740 I 94 614 I 444,560

18 REPORT OF N. D. WATER CONSERVATION COMMISSION
RED RIVER AT WAHPETON, N. D.Stream-Flow Information
(Addition to Supplement "B" of the Fourth Biennial Report.)
Second Run-off inMonth Foot Days I Maximum Minimum Mean I Acre-Feet 1945-1946
October 6,957 283 174 224 13,800November 7,804 I 361 140 260 15,480December . 6,868 I 294 176 222 13,620January 5,882 I224 157 190 11,670February 3,569 160 66 127 7,080March 25,515 I 3,030 176 823 50,610April 33,408 I 1,510 643 1,114 66,260May 18,739 I 748 467 604 37,170June 10,875 I 452 305 362 21,570July 22,198 I 949 452 716 44.030August 18,846 I 731 493 608 37,380September 15,039 I 561 452 601 29,830
Water year 1945-46 175,700 3,030 66 481 348,500
RED RIVER AT WAHPETON, N. DAK.Stream-Flow Information
(Addition to Supplement "B" of the Fourth Biennial Report.)
Second I Run-off inMonth Foot Days Maximum Minimum I Mean I Acre-Feet 1946-1947
October 18,513 784 414 I 597 36,720November 17,499 740 350 I 583 34,710December . 14,960 600 330 I 483 29,670January 12,810 480 350 I 413 25,410February 9,660 420 270 I 345 19,160March 15,080 900 260 I 486 29,910April 60,632 4,540 780 I 2,021 120,300May 50,430 1,800 1,430 I 1,627 100,000June 44,610 1,720 1,210 I 1,487 88,480July 33.561 1,470 302 I1,083 66,570August . 7,184 368 167 232 14,250September . 6,209 255 I 135 207 I 12.320
Water year 1946-47 291,148 I 4,540 135 I798 677,5011
RED RIVER AT FARGO, N. D.Stream-Flow Information
(Addition to Supplement "B" of the Fourth Biennial Report.)
Second I Run-off inMonth I Foot Days I Maximum Minimum Mean I Acre-Feet1944-1945
October I23,099 i 779 709 745 46,030November 21,904 I 827 46.9 730 I 43,650December I 15,817 I 767 323 I 510 I 31,570January 13,359 I484 383 431 I 26,690February I 10,898 432 357 389 I 21,790March 87,224 I 7,650 344 2,814 I 173,200April 50,120 I 2,080 1,210 1,671 I99,590May 30,977 I 1,420 789 999 61,640June 33,222 I 1,520 795 1,107 I 66,120July 11,638 I 789 218 375 I 23,370August 4,805 215 102 155 9,800September 4,032 202 89 I 134 8,260
Water year 1944-45 307,095 j 7,650 89 841 I 611,691

STATE OF NORTH DAKOTA 19
RED RIVER OF THE NORTH AT FARGO, N. DAK.Stream•Flow Information
(Addition to Supplement "B" of the Fourth Biennial Report.)
I Observed I Adjusted for DiversionSecond I I Run-off in
Month Foot Days 'Maximum Minimum Mean I Acre-Feet 1945-1946
October 6,767 268 177 223 13,690November I7,446 332 151 253 15,030December I 6,802 295 174 224 13,760January 5,792 218 162 191 11,750February 3,159 157 80 117 6,510March 48,061 J 5,880 151 1,555 95,590April 40,425 I 1,820 836 1,352 80,440May I 19,833 I 795 557 644 39,620June 12,613 I 527 345 425 25,320July I 21,873 I .935 407 712 43,800August I 18,566 I 745 502 606 37,240September I 15,113 542 I 454 I 509 I 30,310
IWater year 1945-46 I 206,450 I 5,880 80 571 413,100
RED RIVER OF THE NORTH AT FARGO, N. DAK.Stream -Flow Information
(Addition to Supplement "B" of the Fourth Biennial Report.)
Observed Adjusted for DiversionI SecondI I Run-off in
Month Foot Days Maximum I Minimum I Mean I Acre-Feet 1946-1947
October 17,927 712 436 584 35,900November 16.056 676 344 541 32,170December 15,202 582 353 496 30,500January 12,829 450 361 419 55,780February 9,487 428 270 344 19,120March I 13,909 1,200 290 519 31,880April 106,120 9,200 1,080 3,543 210,800May 58,300 I 2,260 1,600 1,887 116,000June 48.370 I 1,960 1,380 1,619 96,310July 35,614 1,490 450 1,158 71,180August 7,669 II 420 159 256 15,760September 6,052 I 247 138 1 208 I 12,400
I 1
Water year 1946-47 349,535 1 9,200 138 964 I697,800
a No gage-height record ; discharge computed on basis of record for station at Wahpeton.
RED RIVER AT HALSTAD, MINNESOTAStream-Flow Information
(Addition to Supplement "B" of the Fourth Biennial Report.)
Second I I I Run-off inMonth I Foot Days Maximum I Minimum I Mean I Acre-Feet 1944-1945 I
October November December January February March April 139,330 6,840 3.970 I 4,976 276,400May 71,310 3,670 1,510 I 2,300 I 141,400June 49,700 2,260 I 1,260 I 1,657 I 98,580July
August
September -
Water year 1944-45 260,340 6,840 1,260 I I 516,380

388,800
20 REPORT OF N. D. WATER CONSERVATION COMMISSION
RED RIVER OF THE NORTH AT HALSTAD, MINN.Stream•Flow Information
(Addition to Supplement "B" of the Fourth Biennial Report.)
Second I I Run-off inMonth Foot Days I Maximum Minimum Mean I Acre-Feet 1945-1946 I
October November December I I I I IJanuary I February I March 31 8,610 r - 17,080April 113,490 I 7,440 1,820 3,783 225,100May 43,780 I 1,750 1,160 1,412 86,840June 26,377 I 1,180 669 I 879 I 52,320July 1-3 3,750 1 7,440August September I
The period 1945-46
RED RIVER OF THE NORTH AT HALSTAD, MINN.Stream•Flow Information
(Addition to Supplement "B" of the Fourth Biennial Report.)
Second I Run-off inMonth Foot Days Maximum Minimum Mean I Acre-Feet 1946-1947
October November IDecember I I IJanuary February March April 12-30 297,780 24,400 4,340 15,670 590,600May 96,230 4,220 2,380 3,104 190,900June 103,610 7,440 2,030 3,454 205,500July 45,993 2,040 714 1,484 91,230August 11,220 669 242 362 22,250September
The period 1,100,000
RED RIVER AT GRAND FORKS, N. D.Stream•Flow Information
(Addition to Supplement "B" of the Fourth Biennial Report.)
Second I I I Run-off inMonth Foot Days I Maximum I Minimum Mean I Acre-Feet1944-1945 I I
October 74,150 I 2,680 I 2,120 2,392 147,100November 69,640 I 3,040 I 1,760 I 2,321 138,100December ........... . 51,710 I 2,240 I 1,140 1,668 102,600January .. . ..... 42,700 I 1,430 I 1,330 1,377 84,690February 38,440 I 1,420 I 1,260 1,373 76,240March 281,880 21,000 I 1,230 9,093 559,100April 365,790 18,300 I 9,720 12,190 725,500May 181,720 I 9,5.40 I 3,230 5,862 360,400June 94,830 I 3,650 I 2,480 3,161 188,100July 50,450 I 2,410 1,220 1,627 100,100August 31,537 1,220 851 1,017 62,550September I 40,080 I 1,860 I 933 1,336 79,500
Water year 1944-45 .. 1,322,927 21,000 I 851 3,624 I 2,623,980

STATE OF NORTH DAKOTA 21
RED RIVER OF THE NORTH AT GRAND FORKS, N. DAK.Stream-Flow Information
(Addition to Supplement "B" of the Fourth Biennial Report.)
Second I I Run-off inMonth Foot Days I Maximum I Minimum I Mean I Acre-Feet1945-1946I
October 52,570 1,950 1,520 I 1,696 104,300November 36,390 1,630 I 950 I 1,213 72,180December 29,510 I1,200 I 830 I 952 58.530January 26,760 I 900 I 795 863 I 53,080February 21,485 I 900 I 685 767 42,610March 200,000 i 21,900 I 775 I 6,452 396,700April _ __ _________ 286,220 19,100 I 4,410 9,541 567,700May 107,460 I 4,1,90 I 2,780 3,466 213,100June 61,380 2,660 I 1,700 2,046 121,700July 69,400 3,830 j 1,490 2,239 137,700August 38,030 1,460 I 1,100 1,227 I 75,430September 35,650 I 1,420 I 1,020 1,188 I 70,710
Water year 1945-46 _ 964,855 21,900 I 685 I 2,643 1.914.000
RED RIVER OF THE NORTH AT GRAND FORKS, N. DAK.Stream -Flow Information
(Addition to Supplement "B" of the Fourth Biennial Report.)
I Second I I Run-off inMonth I Foot Days I Maximum Minimum I Mean I Acre-Feet1946-1947
October 53,970 2,000 1,350 1,741 I 107,000November I 43,150 1,800 900 1,438 T 85,590December 34,470 I 1,220 I 1,040 1,112 68.370January I 33,310 1,160 950 1,075 66,070February I 23,490 990 740 839 46,590March I 42,700 4,300 740 1,377 84,6.90April 588,700 34,900 4,800 19,620 1,168,000May 232,060 13,400 5,080 7,486 460,300June I 309,640 19,000 4,660 10,320 614,200July I 132,910 6,710 1,850 I 4,287 263,600August 43,790 1,700 1,260 I 1,413 86.860September 41,790 1,620 1,220 I 1,393 82,890
Water year 1946-47 1,579,980 34,900 740 I 4,329 I 3.134,000
RED RIVER OF THE NORTH AT GRAND FORKS, N. DAK.Stream - Flow Information
(Addition to Supplement "B" of the Fourth Biennial Report.)
I Second Run-off inMonth I Foot Days Maximum Minimum Mean Acre-Feet1947-1948 1
October I 49,560 1,660 1,500 1,599 98,300November I 39,890 1,750 760 1,330 79,120December 38,890 1,460 1,150 1,255 77,140January 34.300 1,240 910 1,106 68,030February 26,480 970 870 913 52,520March I 32,260 1,580 880 1,041 63,990April 593,960 34,000 1,690 19,800 1,178,000May 242,330 12,300 4,100 7.817 480,700June 75,070 I 3,990 1,840 2,502 148.900July I 52,520 I 2,630 1,250 1,694 104,200August I 35,860 I 1,460 1,000 1,157 71,130September I 26,747 I 1,120 647 892 53,050
Water year 1947-48 1,247,867 34,000 647 3,409 I 2,475,000

22 REPORT OF N. D. WATER CONSERVATION COMMISSION
RED RIVER OF THE NORTH AT OSLO, MINN.Stream. Flow Information
(Addition to Supplement "B" of the Fourth Biennial Report.)
Second I I Run-off inMonth Foot Days Maximum I Minimum I. Mean I Acre-Feet 1944-1945
October • NovemberDecember JanuaryFebruary March 23-31 201,800 I 24,000 I 22,426 I 400,300April 387,190 21,800 .9,920 12,910 768,000May I 185,450 9,680 3,500 I 5,982 367,800June 99,410 3,730 2,690 I 3,314 197,200July 1-9 20,570 2,580 2,286 40,800AugustSeptember
The period I 1,774,000
RED RIVER OF THE NORTH AT OSLO, MINN.Stream 'Flow Information
(Addition to Supplement "B" of the Fourth Biennial Report.)
Second I Run-off inMonth Foot Days Maximum Minimum I Mean I Acre-Feet 1945-1946 I
OctoberNovemberDecember JanuaryFebruary T March April 307,010 21,900 4,620 10,230 608,900May 107,610 4,280 2,830 3,471 213,400June _ _____ _ ____ _____ 62,220 2,750 1,720 2,074 123,400JulyAugustSeptember
The period 1945-46 945,700
RED RIVER OF THE NORTH AT OSLO, MINN.Stream. Flow Information
(Addition to Supplement "B" of the Fourth Biennial Report.) - - - .
Second I Run-off inMonth Foot Days Maximum I Minimum Mean I Acre-Feet1946-1947 I I I
October ___ __ I I
NovemberDecemberJanuaryFebruaryMarchApril 7-30 559,220 I 33,800 I 7,800 I 23.300 I 1,109,000May 241,810 I 15,900 I 5,170 7,800 T 479,600June 320,820 19,400 I 4,750 10,690 I 636,300July 139,550 I 6,710 2,200 I 4,502 I 276,800August _September ____
•
The period . --- I 2,5-02,000

STATE OF NORTH DAKOTA 23
RED RIVER OF THE NORTH AT DRAYTON, N. DAK.Stream-Flow Information
(Addition to Supplement "B" of the Fourth Biennial Report.)Second Run-off in
Month Foot Days I Maximum Minimum Mean Acre-Feet1944-1945 I
October November -December January ...FebruaryMarch April 476,200 24,600 11,100 15,870 944,500May 210,170 11,600 3,990 6,780 416,900June 105,120 3,940 2,720 3,504 208,500July 25,880 2,750 1,860 2,363 51,330August September
•The period 1,621,000
RED RIVER OF THE NORTH AT DRAYTON, N. DAK.Stream . Flow Information
(Addition to Supplement "B" of the Fourth Biennial Report.)
I Second I I Run-off inMonth I Foot Days Maximum I Minimum Mean I Acre-Feet1945-1946 I
October I November - I IDecember 1 IJanuary I IFebruary I March 026-31 131,600 23,000 I 20,300 21,930 261., --00April ___._ ______ I 373,000 22,900 1 4,990 12,430 739,800May I 114,310 I 4,780 I 2,970 3,687 226,700June I 63,950 2,870 I 1,670 2,132 126,800July August
I 1 ----September
The period I 1,354,000
RED RIVER OF THE NORTH AT DRAYTON, N. DAK.Stream-Flow Information
(Addition to Supplement "B" of the Fourth Biennial Report.)
Second I Run-off inMonth Foot Days Maximum I Minimum Mean Acre-Feet
OctoberI1946-1947
DecemberNovember
January February March April 14-30 429,100 2,9,300 17,300 25,240 851,100May 321,150 26,100 I 5,400 10,360 637,000June 334,320 19,400 I 4,720 11,140 663,100July , 7,790 I 3,1405,267 323,800August 54,630 I 2,740 1 1,390 I 1,762 108,400September I ---__The period Apr. 14 to 1 I
Aug. 31 I 2,583,000

24 REPORT OF N. D. WATER CONSERVATION COMMISSION
RED RIVER AT EMERSON, MANITOBAStream-Flow Information
(Addition to Supplement "B" of the Fourth Biennial Report.)
Second I Run-off inMonth Foot Days Maximum Minimum Mean I Acre-Feet 1944-1945 I
October 90,100 3,310 2,520 2,910 178,700November 120,790 6,240 2,510 4,030 289,600December 84,710 4,290 1,530 2,730 168,000January 40,100 1,520 1,18D 1,290 79.540February 38,220 1,420 1,260 1,370 75,810March 282,760 29,300 1,300 9,120 560,800April 604,400 29,400 13,700 20,100 1,199,000May 268,020 13,800 5,000 8,650 531,600June 121,300 4,780 3,220 4,040 240,600July 67,800 3,190 1,670 2,1.90 134,500August 40,570 1,760 1,120 1,310 80,470September 53,290 2,400 1,030 1,780 105,700
Water year 1944-45 1,812,070 29,400 I 1,030 4,960 3,594,000
RED RIVER OF THE NORTH AT EMERSON, MANITOBAStream-Flow Information
(Addition to Supplement "B" of the Fourth Biennial Report.)
Second I Run-off inFoot Days I Maximum I Minimum I Mean I Acre-Feet
1945-1946October 61,240 2,370 1,700 1,980 121,500November 41,944 1,750 994 1,400 83,200December 30,633 1,140 900 988 60,760January 29,293 1,000 886 945 58,100February __ I 22,145 952 644 791 43.920March I 177,888 22,900 701 5,740 352,800April 439,200 24,100 5,940 14,600 871,100May 127,690 5,660 3.170 4,120 253,300June 66,690 3.060 1,780 2,220 132,300July 75,690 4,310 1,680 I 2,400 150,100August I 39,470 1,660 1,120 I 1,270 78.290September I 35,000 1,410 1,030 I 1,170 69,420
Water year 1945-46 11,146,881 24,100 644 I3,140 2,275,000
RED RIVER OF THE NORTH AT EMERSON, MANITOBAStream-Flow Information
(Addition to Supplement "B" of the Fourth Biennial Report.)_ - ---
I Second I I I I Run-off inMonth I Foot Days I Maximum I Minimum I Mean I Acre-Feet1946-19-17
October I 51,490 1,920 1,290 1,660 I 102,100November 48,500 1,860 1,230 1,620 96,200December 36,250 1,390 1,010 1,170 71,900January 31,953 1,110 933 1,030 63,380February 25,123 987 804 897 49,830March 32,776 3,050 813 1,060 65,010April 534,900 28,400 3,730 17,800 1,061,000
' 28,100 5,670 11,900 734,400May ,June __ _._ ____________ __. I 361,510 20,900 5,250 12,100 717,000July I 179,320 9 090 3,230 5,780 355,700August I 62,910 3,000 I 1,640 2,030 124.800September I 47,130 1,740 I 1,400 1,570 93,480
Month
Water year 1946-47 1,782,102 28,400 804 I 4,880 _3,535,000_

STATE OF NORTH DAKOTA 25
BOISE DE SIOUX RIVER NEAR WHITE ROCK, S. D.Stream-Flow Information
(Addition to Supplement "B" of the Fourth Biennial Report.)
Second I I 1 Run-off inMonth Foot Days I Maximum I Minimum I Mean 1 Acre-Feet 1944-1945
October 87.4 11 0 2.82 173November 37.8 5.7 0 1.26 75December 3.0 0.10 6January 0 0 0 0 0February 0 0 0 0 0March 491.9 104 0 15.9 976April 11,256 876 227 375 22,330May 1,284 255 9.0 41.4 2,550June 6,419 487 82 214 12,730July 182.1 12 3 5.87 361August 99.4 9.5 0.8 3.21 197September 34.6 2.6 0.2 1.151 69
Water year 1944-45 19,895.2 875 0 54.5 39,467 _
BOIS DE SIOUX RIVER NEAR WHITE ROCK. S. D.Stream-Flow Information
(Addition to Supplement "B" of the Fourth Biennial Report.)
Second I 1 Run-off inFoot Days I Maximum I Minimum Mean 1 Acre-Feet
1945-1946 I 1October 96.4 4.9 1.7 3.111 191November 33.8 3.8 .2 11.3 1 67December 8.5 1.2 0 .27 17January 0 0 0 0 0February 0 0 0 0 0March 872.0 130 0 28.1 1.730April 15,914.0 825 7.5 530 1 31,560May 767.1 90 3.8 24.7 I 1,520June 393.8 36 5.3 13.1 1 781July 1,199.1 185 2.1 38.7 1 2,380August 129.3 7.5 2.0 4.17 256September __ . 69.5 3.8 1.6 2.321 138
1Water year 1945-46 _ 19,483.5 825 I 0 53.4 1 38,640
WILD RICE NEAR MANTADOR, N. D.Stream-Flow Information
(Addition to Supplement "B" of the Fourth Biennial Report.)
Second I 1 1 I Run-off inMonth I Foot Days 1 Maximum 1 Minimum 1 Mean I Acre-Feet
1944-1945October 451.1 l 24 8.2 14.6 895November 535.2 1 29 6.7 17.8 1,060December 96.6 3.12 192January February March 11,586 924 0.0 374 22,980April 8,310 479 214 277 16,480May 2,915 205 42 94 5,780June 3,003 162 25 100 5,960July 299.2 24 3.6 9.651 593August_ _ .__ _ 55.9 6.2 0 1.801 111September 46.5 8.0 0 1.551 92
Water year 1944-45 27,298.51 924 0 1 74.8 1 54,143
Month

26 REPORT OF N. D. WATER CONSERVATION COMMISSION
WILD RICE RIVER NEAR MANTADOR, N. D.Stream-Flow Information
(Addition to Supplement "B" of the Fourth Biennial Report.)
Second I I I Run-off inMonth Foot Days 1 Maximum I Minimum Mean 1 Acre-Feet 1945-1946
October 35.4 2.2 .6 1.14 70November 69.6 4.8 .4 2.32 138December 16.1 1.6 0 .52 32January 0 0 0 0 0February 0 0 0 0 0March 3,254 290 0 105 6.450April 4,050 247 35 135 8,030May 453.9 31 6.9 14.6 900June 168.9 18 1.5 5.63 335July 572.7 73 3.6 18.5 1,140August 11.6 2.6 0 .37 23September 29.6 3.6 0 .99 59
Water year 1945-46 8,661.8 290 0 23.7 17.180
WILD RICE RIVER NEAR ABERCROMBIE, N. D.Stream-Flow Information
(Addition to Supplement "B" of the Fourth Biennial Report.)
Second I I 1 Run-off inFoot Days I Maximum I Minimum Mean I Acre-Feet
1945-1946October 64.5 4.4 1.1 2.08 128November _ 78.6 3.6 1.8 2.62 156December 21.5 1.9 0 .69 43January 0 0 0 0 0February 0 0 0 0 0March 16,663 2,300 0 538 33,050April 6,077 343 69 203 12,050May 836 58 11 27.0 1,660June 246.3 24 3.6 8.21 489July 947.2 84 9.2 30.6 1,880August 78.4 17 0 2.53 156September 3.6 .8 0 .12 7.1
Water year 1945-46 25,016.1 2,300 0 I 68.5 49,620
WILD RICE RIVER NEAR ABERCROMBIE, N. D.Stream-Flow Information
(Addition to Supplement "B" of the Fourth Biennial Report.)Second I 1 1 Run-off in
Month Foot Days I Maximum I Minimum I Mean I Acre-Feet 1944-1945
October I 609 I 26 15 1.9.6 I 1,210November I 972 I 74 13 32.4 I 1,930December 396.5 28 1.9 12.8 786January I 27.61.8 .6 .89 55February 35.1 1.4 .8 1.25 70March 31,181.7 I 2,800 1.4 1,010 61,850April 12,374 780 261 412 24,540May 4,041 1261 60 130 8,020June __ ___________________ 4,723 I 433 40 157 I 9,370July 490.5 I 38 7.7 15.8 I 973August i 129.9 1 7.7 .6 4.191 258September _-_. 65.8 9.7 0 2.19 131
1Water year 1945 55,046.1 2,800 0 151 1 109,200
Month
STATE OF NORTH DAKOTA 27
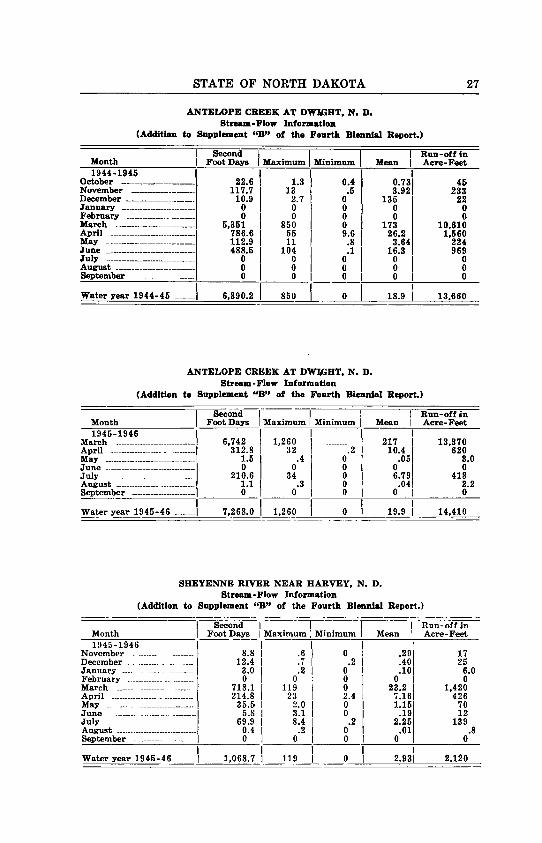
ANTELOPE CREEK AT DW/sGHT, N. D.Stream-Flow Information
(Addition to Supplement "B" of the Fourth Biennial Report.)
I Second 1 I Run-off 4nMonth I Foot Days I Maximum I Minimum Mean 1 Acre-Feet 1944-1945
October _ ________ -_______ 22.6 1.3 0.4 0.73 45November 117.7 13 I.5 3.921 233December 10.9 2.7 0 135 22January 0 0 0 0 0February 0 0 0 0 0March 5,351 850 0 173 10,610April 786.6 55 9.6 26.2 1,560May 112.9 11 .8 3.64 224June __ 488.5 104 .1 16.3 1 969July 0 0 1 0 0 0August 0 o 1 0 0 I0September 0 0 I 0 I 0 I 0
Water year 1944-45 6,890.2
850
0 18.9 I 13,660
ANTELOPE CREEK AT DWIGHT, N. D.Stream-Flow Information
(Addition to Supplement "B" of the Fourth Biennial Report.)
Second I I I I Run-off inMonth Foot Days I Maximum I Minimum 1 Mean I Acre-Feet 1945-1946 I I
March 6,742 1 1,260 217 1 13,370April 312.8 I 32 .2 1 10.4 I 620May 1.5 I .4 I .05 3.0June 0 0 I 0 0July 210.6 34 6.79 418August 1.1 .3 .04, 2.2September 0 0 0 0
Water year 1945-46 7,268.0 1 1,260 19.9 I 14,410
SHEYENNE RIVER NEAR HARVEY, N. D.Stream-Flow Information
(Addition to Supplement "B" of the Fourth Biennial Report.)
Second I I I I Run- off inMonth I Foot Days I Maximum : Minimum I Mean ' Acre-Feet 1945-1946 I I
November 8.8 .6 I 0 .29 17December . 12.4 .7 I .2 .40 25January 3.0 .2 I 0 .10 6.0February . 0 0 0 0 0March 718.1 119 I 0 23.2 1,420April 214.8 23 I 2.4 I 7.16 426May 35.5 2.0 I 0 I 1.15 70June 5.8 3.1 I 0 I .19 12July 69.9 8.4 I .2 2.25 139August 0.4 .2 I 0 .01 .8September 0 0 I 0 I 0 I 0
Water year 1945-46 . 1,068.7 I 119 I 0 I 2.931 2,120

28 REPORT OF N. D. WATER CONSERVATION COMMISSION
SHEYENNE RIVER AT SHEYENNE, N. D.Stream-Flow Information
(Addition to Supplement "B" of the Fourth Biennial Report.)
Second I Run-off inMonth Foot Days 'Maximum Minimum Mean I Acre-Feet 1944-1945
October 9.6 I 2.0 0 0.31 19November 302.2 27 0 10.1 599December 162.3 I 10 2.5 5.24 322January 12.5 I 2 0 0.4 25February 5.6 0.2 11March 6,614.2 I 901 0.2 213 13,120April 1,058.8 I 84 7.4 35.3 2,100May 328 25 3.0 10.6 651June 221.1 16 1.6 7.37 439July 28.7 3.6 0 0.93 57August 117.9 I 16 0 3.8 234September 1.2 1 0.4 1 2.4
Water year 1944-45 8,862.1 I 901 0 24.3 1 17,679.4
SHEYENNE RIVER AT SHEYENNE, N. D.Stream-Flow Information
(Addition to Supplement "B" of the Fourth Biennial Report.)
Second I I I I Run-off InMonth I Foot Days I Maximum 1 Minimum I Mean I Acre-Feet 1945-1946
October 3.7 1.0 0 0.12 7.3November .5 .5 0 .02 1.0December 24.1 2.0 0 .78 48January 14.6 1.0 0 .47 29February 0 0 0 0 0March 7,943 1,120 0 256 15.750April 1,557.6 157 6.6 51.,9 3,090May 186.9 22 .3 6.03 371June 84.2 14 0 2.81 167July 2,274.9 443 2.4 73.4 4,510August 179.8 27 .1 5.80 357September 41.0 14 I 0 1.371 81
Water year 1945-46 12,310.3 1,120 0 33.7 24,410
SHEYENNE RIVER NEAR COOPERSTOWN, N. D.Stream-Flow Information
(Addition to Supplement "B" of the Fourth Biennial Report.)
Second I 1 Run-off inMonth Foot Days I Maximum Minimum Mean 1 Acre-Feet 1944-1945
October November December JanuaryFebruary . March 1,037 2,060April 3,845 278 64 128 7,630May 2,424 100 61 78.2 4,810June . 1,968 114 26 65.6 3.900July 613 37 11 19.8 1,220August 265.8 24 2.6 8.57 527
September 306.3 29 2.0 I 10.2 608
Water year 1944-45 10,459.1 278 2.0
20,755

STATE OF NORTH DAKOTA 29
SHEYENNE RIVER NEAR COOPERSTOWN, N. D.Stream-Flow Information
(Addition to Supplement "B" of the Fourth Biennial Report.)
I Second I I Run -off inMonth I Foot Days I Maximum I Minimum I Mean I Acre-Feet 1945-1946 I
October 289.8 28 3.4 9.35 575November 385 18 11 12.8 764December 262.4 11 5.6 8.46 520January _ _ _________ _ 292.5 11 8.1 9.44 580February 103.9 10 1.9 3.71 206March 11,484.3 958 6.5 370 22,780April 8,921 964 70 297 17,690May I 1,641 68 I 37 52.9 3,250June 722 40 15 24.1 1,430July 1,919 348 10 61.9 3,810August 1,052.9 142 7.6 34.0 2,090September 389.9 I 25 4.5 13.0 773
Water year 1945-46 __ . 27,463.7 964 1.9 75.2 54,470
SHEYENNE RIVER NEAR COOPERSTOWN, N. D.Stream-Flow Information
(Addition to Supplement "B" of the Fourth Biennial Report.) - - _
Second I I I I Run-off inMonth I Foot Days I Maximum I Minimum I Mean Acre-Feet 1946-1947
October 722 35 17 23.3 1,430November 545 26 13 18.2 1,080December 298 15 6 9.6 591January 240 30 5 7.7 476February 125 10 2 4.5 248March 4,704 490 1 152 9,330April 12,466 1,100 104 416 24,730May 2,067 101 52 66.7 4,100June 1,931 193 44 64.4 3,830July 909 77 12 29.3 t 1,800August 450.1 28 5.5 14.5 893September 161.4 18 I 1.9 5.38 320
Water year 1946-47 24,618.5 1,100 1 67.4 48,830
SHEYENNE RIVER AT VALLEY CITY, N. D.Stream -Flow Information
(Addition to Supplement "B" of the Fourth Biennial Report.)
Second I I I1r Run-off inFoot Days I Maximum I Minimum Mean I Acre-Feet
1944-1945October 659 31 16 21.3 1,310November I 1,640 99 20 54.7 3,250December 961 53 11 31.0 1,910January _ 320.4 12 7.8 10.3 636February 346.2 27 9.0 12.4 687March 13,877 1,010 10 448 27,520April 5,041 375 76 168 10,000May I 2,826 113 71 91.2 5,610June 2,383 121 34 79.4 4,730July I 822 39 16 26.5 1,630August I 799.4 113 0.8 25.8 1,590September I 363 29 1.0 I 12.1 720
Month
Water year 1944-45 I 30,033 I 1,010 0.8 82.3 59,593

30 REPORT OF N. D. WATER CONSERVATION COMMISSION
SHEYENNE RIVER AT VALLEY CITY, N. D.Stream-Flow Information
(Addition to Supplement "B" of the Fourth Biennial Report.)
Second I I I1 Run-off inMonth Foot Days I Maximum I Minimum Mean I Acre-Feet
1945-1946 -October 263.9 24 2.5 8.51 523November 438 21 10 14.6 869December 302.3 14 5.3 9.75 600January 313.2 11 9.2 10.1 621February 141.8 12 1.8 . 5.061 281March 12,761.6 1,130 2.8 412 25,310April 11,425 976 88 381 22,660May 2,174 88 50 70.1 4,310--June 1,107 84 19 36.9 2,200July 1,432.6 267 3.0 46.2 2,840August 1,443.5 228 3.7 46.6 2,860September 607.9 43 4.9 20.3 1,210
Water year 1945-46 32,410.81,130 1.8 85..8 64,280
SHEYENNE RIVER AT VALLEY CITY. N. D.Stream-Flow Information
(Addition to Supplement "B" of the Fourth Biennial Report.)
= = --
Second I I I I Run-off inMonth I Foot Days I Maximum I Minimum I Mean I Acre-Feet1946-1947
October 1,101 1 62 19 I 35.5 2,180November 742 I 35 16 24.7 1.470December 355.8 I 17 7.0 I 11.5 706January 473.7 68 5.3 I 15.3 940February 241.2 21 2.6 f 8.61 478March 7,159.3 800 1.8 I 231 14,200April 18,886 1,890 149 I 630 37,460May 2.699 146 GO I 87.1 5,350June 2,857 199 50 I 95.2 5,670July 1,099.8 81 9.8 I 35.5 2,180August 395.4 38 4.3 12.8 784September 47.6 4.1 I 9- 1.59 94 --_
Water year 1946-47 36,057.8 1,890 .9 98.8 71.510 _
SHEYENNE RIVER AT WEST FARGO, N. D.Stream-Flow Information
(Addition to Supplement "B" of the Fourth Biennial Report.)
I Second I I I Run-off inMonth I Foot Days I Maximum I Minimum I Mean I Acre-Feet1544-1945 I
October I 2,444 97 59 78.8 4,850November I 2,775 120 66 92.5 5,500December I 1,883 85 40 60.7 3,730January I 1,380 68 34 44.5 2,740February I 1,317 50 40 47.0 2,610March I 17,139 1,330 40 553 33,990April 13,689 975 226 456 27,150May 5,841 221 149 188 11,590June I 4,804 199 110 160 9,530July I 2,446 109 62 78.9 I 4,850August I 1,953 95 42 63.2 I 3,890September 1,130 52 31 I 37.7 I 2,240
Water year 1944-45 . 56,807 I 1,330 I 31 156 I 112,670

STATE OF NORTH DAKOTA 31
SHEYENNE RIVER AT WEST FARGO, N. D.Stream-Flow Information
(Addition to Supplement "B" of the Fourth Biennial Report.)
Second I I 1 Run-off inMonth I Foot Days I Maximum 1 Minimum I Mean 1 Acre-Feet 1945-1946 I I
October 1,151 53 130 37.1 2,280November 1,135 50 28 37.8 2,250December 823 34 22 26.5 1,630January I894 32 26 28.8 1,770February 1,021 42 31 36.5 2,030March I10,309 1,630 42 333 20,450April 20,626 1,390 230 688 40,910May I 4,694 219 117 151 9,310June I 3,448 172 93 115 6,840July 2,747 126 48 88.6 5,450August 2,301 161 36 74.2 4,560September 1 1,260 62 30 I 42.5 2,500
Water year 1945-46 I 50,409 I 1,630 I 22 138 99,980
MAPLE RIVER AT MAPLETON, N. D.Stream-Flow Information
(Addition to Supplement "B" of the Fourth Biennial Report.)
I Second 1 1 I 1 Run-off in1 Foot Days I Maximum 1 Minimum Mean 1 Acre-Feet
1944-1945October 157.0 8.7 3.4 5.06 309November 434.9 28 6.3 14.5 863December 150.0 11 1.3 4.84 298January 10.2 1.5 0 1 .33 20February 0 0 o 1 0 0March 2,888 230 0 1 93.2 5,730April 2,593 315 38 1 86.4 5,140May _ 780 43 14 25.2 1,550June 495.1 35 3.0 16.5 982July 111.5 22 .8 3.60 221August 104.6 6.6 .3 3.37 207September 14 3 1 .1 .47 28
Water year 1944-45 7,738.3 I 315 0 1 21.2 1 15,350
MAPLE RIVER AT MAPLETON, N. D.Stream-Flow Information
(Addition to Supplement "B" of the Fourth Biennial Report.)
I Second 1 1 I 1 Run-off inMonth I Foot Days !Maximum 1 Minimum 1 Mean 1 Acre-Feet 1945-1946 I I I
October 40.8 I 3.6 0.6 I 1.32! 81November 70.5 1 6.6 .7 1 2.351 140December 24.6 1 1.4 .1 I .791 49January 3.1 I .1 .1 .10 6.1February .9 .1 0 .031 1.8March . 3,5.91.1 527 .2 I 116 7.120April 2,094 149 18 69.8 4,150May 273.5 17 6.3 8.82 542June I 281.2 1 21 5.5 9.371 558July I 136.8 I 11 .3 I 4.411 271August 1.3 I .2 0 f .04! 2.6September 3.8 1 1.9 0 T .131 7.5
1Water year 1945-46 6,521.6 I 527 0 I 17.9 1 12,930
Month

32 REPORT OF N. D. WATER CONSERVATION COMMISSION
RUSH RIVER AT AMENIA, N. D.Stream-Flow Information
(Addition to Supplement "B" of the Fourth Biennial Report.)
I Second I I 1 I Run-off inMonth Foot Days I Maximum I Minimum 1 Mean I Acre-Feet
1945-19461 1
0
IJuly 8-31 6.8 I 1.1 I .28 13August 0 1 0 1 0 I 0September 0 1 0 I 0 1 0 I 0
I I ------- 13The period
GOOSE RIVER NEAR PORTLAND, N. D.Stream•Flow Information
(Addition to Supplement "B" of the Fourth Biennial Report.)
1 Second 1 I 1 I Run-off inMonth 1 Foot Days , Maximum I Minimum I Mean 1 Acre-Feet 1945-1946 1I
March 3,508 I 520 0 I 1131 6,960April 546.6 1 50 4.5 I 18.2 1 1,080May 86.8 1 3.8 1.4 I 2.801 172June 26.3 1 2.60 1 .88 52July 21.1 1 2.7 0 1 .681 42
1The period 1945-46 4,188.8 I 520 0 1 11.5 1 8,310
GOOSE RIVER NEAR PORTLAND, N. D.Stream-Flow Information
(Addition to Supplement "B" of the Fourth Biennial Report.)
Second 1 I I I Run-off inMonth Foot Days I Maximum I Minimum I Mean I Acre-Feet1946-1947
October 0 0November 0 I 0December 0 0January 0 0February 0 0March 1,61 260 5 .2 3,210April 1,94 .3 200 .5 6 .0 3,870May 9 .9 6.1 .8 .00 184June 44 .7 41 .5 1 .7 876July 2 .1 1.S .68 42August .6.02 1.2September o o
8,180_Water year 1946-47 4,12 .6 I 260 I 0 11.3
STATE OF NORTH DAKOTA 33
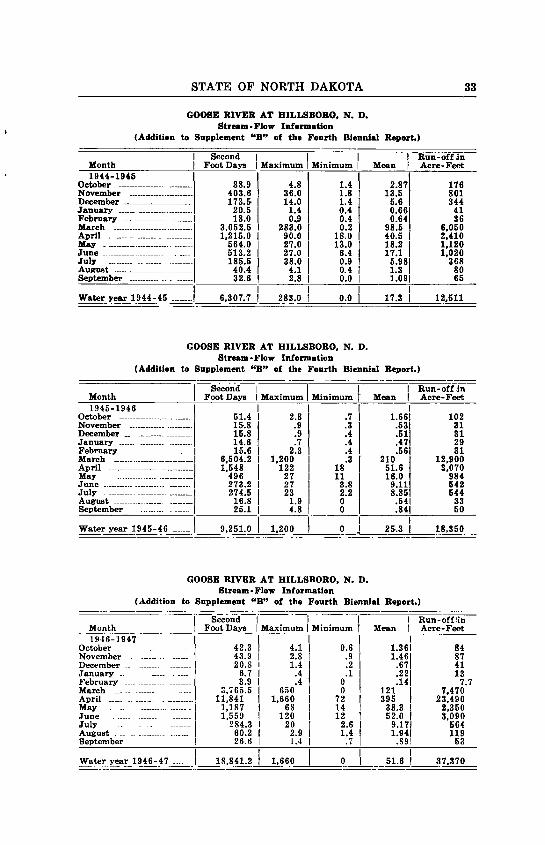
GOOSE RIVER AT HILLSBORO, N. D.Stream-Flow Information
(Addition to Supplement "B" of the Fourth Biennial Report.)
Second I I I 1 Run-off anMonth Foot Days I Maximum I Minimum I Mean 1 Acre-Feet 1944-1945
October 88.9 I 4.8 1.4 2.87 176November 403.6 36.0 1.8 13.5 801December 173.5 14.0 1.4 5.6 344January 20.5 1.4 0.4 0.66 41February 18.0 0.9 0.4 0.64 36March 3,052.5 283.0 0.2 98.5 6,050April . . .... 1,215.0 90.0 18.0 40.5 2,410May 564.0 27.0 I 13.0 18.2 1,120June 513.2 27.0 6.4 17.1 1,020July 185.5 38.0 I 0.9 5.98 368August 40.4 4.1 0.4 1.3 80September 32.6 I 2.8 I 0.0 1.091 65
Water year 1944-45 6,307.7 I 283.0 I 0.0 17.3 12,511
GOOSE RIVER AT HILLSBORO, N. D.Stream-Flow Information
(Addition to Supplement "B" of the Fourth Biennial Report.)
Second I I I Run-off inMonth Foot Days I Maximum Minimum I I Mean 1 Acre-Feet1945-1946
October 51.4 2.8 .7 1.66 102November 15.8 .9 .3 .53 31December 15.8 .9 .4 .51 31January 14.6 .7 .4 .47 29February 15.6 2.3 .4 .56 31March 6,504.2 1,200 .3 210 12,900April 1,548 122 18 51.6 3,070May 496 27 11 16.0 984June 273.2 I 27 3.8 9.11 542July 274.5 I 23 2.2 8.85 544August 16.8 I 1.9 0 .54 33September 25.1 4.8 .841 50
Water year 1945-46 9,251.0 I 1,200 0 25.3
18.350
GOOSE RIVER AT HILLSBORO, N. D.Stream-Flow Information
(Addition to Supplement "B" of the Fourth Biennial Report.)
MonthSecond I 1 I I Run-off fin
I Foot Days I Maximum I Minimum 1 Mean I Acre-Feet1946-1947
October 42.3 4.1 0.6 1.36 84November 43.9 I 2.8 .9 1.46 87December 20.8 I 1.4 .2 .67 41January _ 6.7 .4
0 .22 13
February ____ ______ 3.9 .4 .14 7.7March 1,765.5 650 0 121 7.470April 11,841 1,660 72 395 23,490May 1,187 68 14 38.3 I 2,350June 1,559 120 12 52.0 I 3,090July 284.3 I 20 2.6 9.171 564August 60.2 I 2.9 1.4 1.941 119September 26.6 I 1.4 .7 .89; 53
1Water year 1946-47 18,841.2 1,660 0 51.6 1 37,370

34 REPORT OF N. D. WATER CONSERVATION COMMISSION
TURTLE RIVER AT MARVEL, N. D.Stream-Flow Information
(Addition to Supplement "B" of the Fourth Biennial Report.)
Second I I I Run-off inMonth Foot Days I Maximum' Minimum Mean I Acre-Feet 1945-1946
October 64.3 3.7 I 1.3 2.07 128November 54.2 4.9 .2 1.81 108December 11.4 .9 .1 .37 23January 3.1 .1 .1 .10 6.1February 2.8 .1 .1 .10 5.6March 4,355.2 650 I .1 140 8,640April 1,062 100 I 10 35.4 2,110May 244.0 11 3.7 7.87 484June _ 152.5 15 I 2.7 5.08 302July 1,486.5 277 I .8 48.0 2,950August 8.9 1.1 .1 .29 18September 171.5 21 I .2 5.72 340
Water year 1945-46 7,616.4 650 I .1 20.9 15,110
FOREST RIVER NEAR FORDVILLE, N. D.Stream-Flow Information
(Addition to Supplement "B" of the Fourth Biennial Report.)
Second I Run-off tinMonth Foot Days I Maximum I Minimum r Mean 1 Acre-Feet 1944-1945
October 87.7 3.2 2.2 2.83 174November 255.8 25 2.4 8.53 507December 201.4 8.5 2.4 1 6.50 399January 114.9 5.0 2.2 3.71 228February 137.7 5.6 I 4.3 4.92 273March 2,561.6 224 5.0 82.6 5,080April 699 63 12 20.3 1,210May 355 15. 10 11.5 704June 263.8 16 4.5 8.79 523July 121.1 4.4 3.0 3.91 240August 50.7 2.9 1.0 1.64 101September 84.5 5.0 1.0 I 2.82 168
Water year 1944- 4 5 4,843.2 224 1.0 13.3 9,607
FOREST RIVER AT FORDVILLE, N. D.Stream-Flow Information
(Addition to Supplement "B" of the Fourth Biennial Report.)
Second 1 1 Run-off inMonth Foot Days I Maximum 1 Minimum Mean 1 Acre-Feet 1945-1946 I
October 91.7 3.8 2.3 2.961 182November 111.4 4.0 3.5 3.711 221December 117.8 4.2 3.5 3.80 234January 142.4 4.8 4.0 4.59 282February 118.2 4.8 3.8 4.22 234March 3,772.4 900 4.5 122 7,480April 599.9 I 49 8.9 20.0 1,190May 223.4 9.8 5.2 7.21 443June 210.7 I 19 4.7 7.02 418July 123.0 I 8.9 2.2 3.97 244August 71.3 I 3.6 2.0 2.30 141September 129.1 I 14 I 2.4 4.30 256
1Water year 1945-46 _ 5,711.3 I 900
2.0 15.6 I
11,320
STATE OF NORTH DAKOTA 35
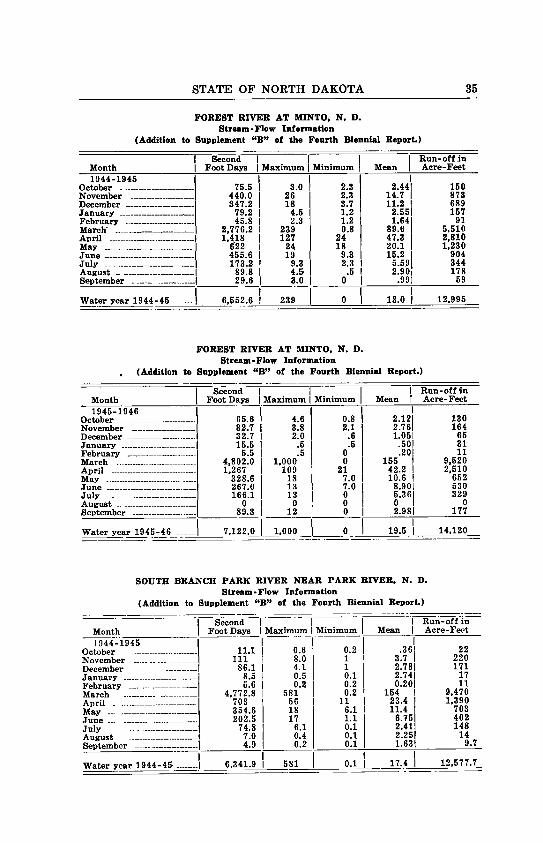
FOREST RIVER AT MINTO, N. D.Stream-Flow Information
(Addition to Supplement "B" of the Fourth Biennial Report.)
Second I I I I Run-off inMonth Foot Days I Maximum I Minimum I Mean I Acre-Feet1944-1945
October 75.5 3.0 2.3 2.44 150November 440.0 26 2.3 14.7 873December 347.2 18 3.7 11.2 689January 79.2 4.5 1.2 2.55 157February 45.8 2.3 1.2 1.64 91March" 2,776.2 239 0.8 89.6 5,510April 1,418 127 24 47.3 2,810May 622 24 18 20.1 1,230June 455.6 19 9.3 15.2 904July 173.2 9.3 2.3 I 5.591 344August 89.8 4.5 .5 I 2.901 178September 29.6 I 3.0 I 0 .991 59
IWater year 1944-45 6,552.6 239 0 18.0 I 12,995
FOREST RIVER AT MINTO, N. D.Stream-Flow Information
, (Addition to Supplement "B" of the Fourth Biennial Report.)
Second I I I I Run-off inMonth Foot Days I Maximum I Minimum Mean T Acre-Feet1945-1946
October 65.6 4.6 0.8 2.12 130November 82.7 I 3.8 2.1 2.76 164December 32.7 I 2.0 .6 1.05 65January 15.5 .5 .5 .50 31February 5.5 .5 0 .20 11March 4,802.0 1,000 0 155 9,520April 1,267 109 21 42.2 2,510May 328.6 18 7.0 10.6 652June 267.0 13 7.0 8.90 530July 166.1 13 0 5.36 329August 0 0 0 0 0
September 89.3 12 I 0 I 2.98 177
Water year 1945-46 7,122.0 1 1,000 19.5 I 14,120
SOUTH BRANCH PARK RIVER NEAR PARK RIVER, N. D.Stream-Flow Information
(Addition to Supplement "B" of the Fourth Biennial Report.)
Second I I I Run-off inMonth I Foot Days I Maximum I Minimum Mean I Acre-Feet1944-1945
October 11.1 0.6 0.2 .36 22November 111 8.0 1 3.7 220December 86.1 4.1 1 2.78 171January 8.5 0.5 0.1 2.74 17February 5.6 0.2 0.2 0.20 11March 4,772.8 581 0.2 154 9,470April 703 56 11 23.4 1,390May 354.6 I 18 6.1 I 11.4 703June 202.5 17 1.1 6.75 402July 74.8 I 6. 0.1 2.41 148August 7.0 I 0.4 0.1 2.25 14September 4.9 I 0.2 I 0.1 1.63 9.7
Water year 1944-45 6,341.9 I 581 0.1 17.4 12,577.7 ___

36 REPORT OF N. D. WATER CONSERVATION COMMISSION
SOUTH BRANCH OF PARK RIVER NEAR PARK RIVER, N. D.Stream-Flow Information
(Addition to Supplement "B" of the Fourth Biennial Report.)
Second 1 1 Run-off InMonth Foot Days 1 Maximum 1 Minimum Mean 1 Acre-Feet 1945-1946 I
October 5.6 .2 .1 .181 11November 4.5 .2 .1 Al 8.9December 3.1 .1 .1 .10 6.1January 3.1 .1 .1 .10 6.1February 2.8 .1 .1 .101 5.6March 2,854.0 400 .1 92.0 5,660April 531.2 39 4.8 17.7 1,050May 113.2 8.6 2.3 3.65 225June . 82.0 25 .1 2.73 163July 3.5 .5 0 .11 6.9August 3.1 .1 .1 .10 6.1September 15.9 2.3 .1 1 .53 32
Water year 1945-46 3,622.0 400 0 9.921 7,180
PARK RIVER AT GRAFTON, N. D.Stream • Flow Information
(Addition to Supplement "B" of the Fourth Biennial Report.)
Second 11 Run-off InMonth Foot Days I Maximum I Minimum Mean 1 Acre-Feet 1944-19451
October 25.9 1 4.0 0.4 0.841 51November 436.5 I 35 0.5 14.6 866December 216.6 1 29 I 0.4 6.99 430January 8.2 I .3 1 0.2 0.261 16February 6.4 .3 0.2 0.231 13March 12,709.8 1,140 0.1 410 1 25,210April 4,029 536 52 134 7,990May 1,758 75 44 56.7 3,490June 945 54 21 31.5 1,870July 227.4 20 I 1.6 7.341 451August 26.2 .2 .1 0.851 62September 18.3 1.6 I .1 0.611 36
1Water year 1944-45 20,407.3 1 1,140 1 .1 55.9 1 40,475
PARK RIVER AT GRAFTON, N. D.Stream- Flow Information
(Addition to Supplement "B" of the Fourth Biennial Report.)
Second 1 I Run-off inMonth Foot Days I Maximum 1 Minimum Mean 1 Acre-Feet 1945-1946 1
.16jOctober 5.0 .3 .1 9.9November 6.3 .4 .2 .211 12December 4.3 .3 .1 .141 8.5January 3.1 .1 .1 .101 6.1February 3.5 1 .2 .1 .121 6.9March 7,336.5 I 1,150 .1 237 I 14,550April 2,055 147 28 68.5 I 4.080May 295.8 19 4.5 9.541 587June 147.9 9.4 3.0 4.931 293July 39.3 I 6.3 0 1.271 78August 4.0 I 1.1 0 .131 7.9September 11.2 1 2.2 0 .371 22
1 1Water year 1945-46 . 9,911.9 I 1,150 0 27.2 1 19,660
STATE OF NORTH DAKOTA 37
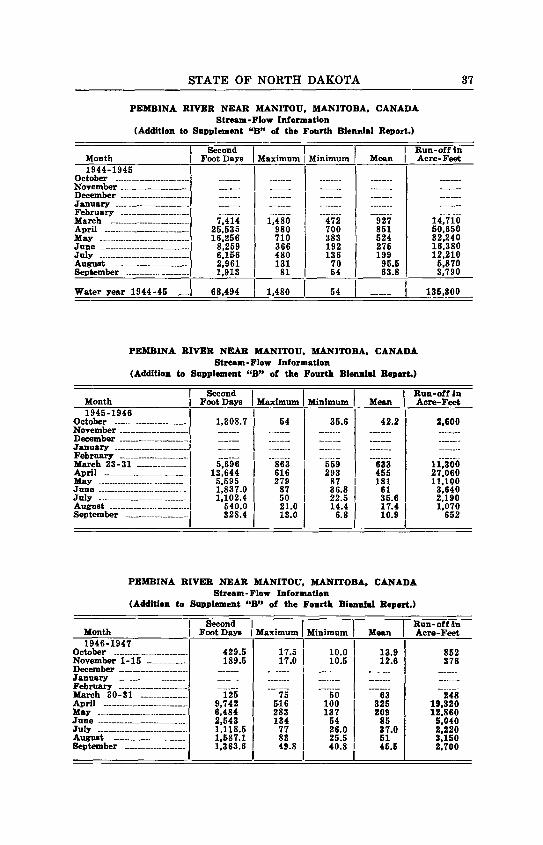
PEMBINA RIVER NEAR MANITOU, MANITOBA, CANADAStream -Flow Information
(Addition to Supplement "B" of the Fourth Biennial Report.)
Second I I I Run-off inMonth I Foot Days I Maximum I Minimum Mean I Acre-Feet 1944-1945
October November December January--------February March 7,414 1,480 472 927 14,710April 25,535 980 700 851 50,650May 16,256 710 383 524 32,240June 8,259 366 192 275 16,380July 6,156 480 136 199 12,210August 2,961 131 70 95.5 6,870September 1,913 81 I 54 63.8 3,790
Water year 1944-45 68,494 1,480 54 135,800
PEMBINA RIVER NEAR MANITOU, MANITOBA, CANADAStream-Flow Information
(Addition to Supplement "B" of the Fourth Biennial Report.)
Second I I I Run-off inMonth Foot Days I Maximum I Minimum Mean I Acre-Feet1945-1946
October 1,308.7 I 54 35.6 42.2 2,600November I---December January February March 23-31 5,696 863 559 633 11,300April 13,644 616 293 455 27,060May 5,595 279 87 181 11,100June 1,837.0 87 I 36.8 61 3,640July 1,102.4 I 50 22.5 35.6 2,190August 540.0 21.0 14.4 17.4 1,070September 328.4 13.0 6.8 10.9 652
PEMBINA RIVER NEAR MANITOU, MANITOBA, CANADAStream-Flow Information
(Addition to Supplement "B" of the Fourth Biennial Report.)
Second I I Run-off inMonth I Foot Days I Maximum Minimum Mean I Acre-Feet 1946-1947
October 429.5 17.5 10.0 13.9 852November 1-15 189.5 17.0 I 10.5 12.6 376DecemberJanuary February March 30-31 125 75 50 63 248April 9,742 616 100 325 19,320May 6,484 283 137 209 12,860June 2,543 134 54 85 5,040July 1,118.5 77 26.0 37.0 2,220August 1,587.1 83 25.5 51 3,150September 1,363.6 49.8 40.8 45.5 2,700

38 REPORT OF N. D. WATER CONSERVATION COMMISSION
PEMBINA RIVER NEAR WALHALLA, N. D.Stream-Flow Information
(Addition to Supplement "B" of the Fourth Biennial Report.)
Second I I Run-off inMonth Foot Days I Maximum I Minimum r Mean I Acre-Feet1944-1945
October 5,612 242 135 181 11,130November 6,389 938 80 213 12,670December 2,768 135 50 89.3 5,490January 1,299 50 36 41.9 2,580February 1,161 47 34 41.5 2,300March 24,915 2,780 I 32 804 I 49,420April 30,182 1,560 I 876 I 1,006 59,870May 21,441 899 I 531 692 42,530June 11,188 527 I 24.8 373 22,190July 6,963 375 I 175 225 13,810August 3,663 I 166 80 118 7,270September 2,401 I 97 I 70 I 80 I 4,760
Water year 1944-45 117,982 2,780 I 32 323 234,020
PEMBINA RIVER NEAR WALHALLA, N. D.Stream-Flow Information
(Addition to Supplement "B" of the Fourth Biennial Report.)
Second I I T I Run-off inMonth Foot Days I Maximum ! Minimum Mean I Acre-Feet
1945-1946 I I
October 1,729 I 69 40 55.8 3,430November I 907 47 24 30.2 1,800December 504 26 10 16.3 1,000January 293.2 10 7.9 9.46 582February 223.9 8.8 7.5 8.00 444March 19,241 1,910 7.9 621 38,160April 18,780 911 382 626 37,250May 7,521 371 135 243 14,920June . 2,543 123 56 84.8 5,040July . _____ 1,521 86 31 49.1 3,020August 644 29 1,s 20.8 1,280September 448.2 21 I 9.4 I 14.9 889
Water year 1945-46 I 54,355.3 I 1,910 I 7.5 i 149 107,800
PEMBINA RIVER NEAR WALHALLA, N. D.Stream-Flow Information
(Addition to Supplement "B" of the Fourth Biennial Report.)
Second I I I Run-off inMonth I Foot Days I Maximum I Minimum Mean I Acre-Feet1946-1947
October 668 29 I 16 21.5 1,320November _ 603 28 14 20.1 1,200December ____ 289 14 4 9.3 573January 151 12 2 4.9 300February 77.9 4 1.3 2.78 155March 373.8 100 .4 12.1 741April 16,960 1,240 200 566 33,640May 7,996 371 188 258 15,860June _ 5,112 266 144 170 10,140July 2,105 121 38 67.9 4,180August 3,975 958 36 128 7,880September 1,671 69 48 I 55.7 3,310
Water year 1946-47 ___ 39,981.7 I 1,240 I .4 110 79,300
STATE OF NORTH DAKOTA 39
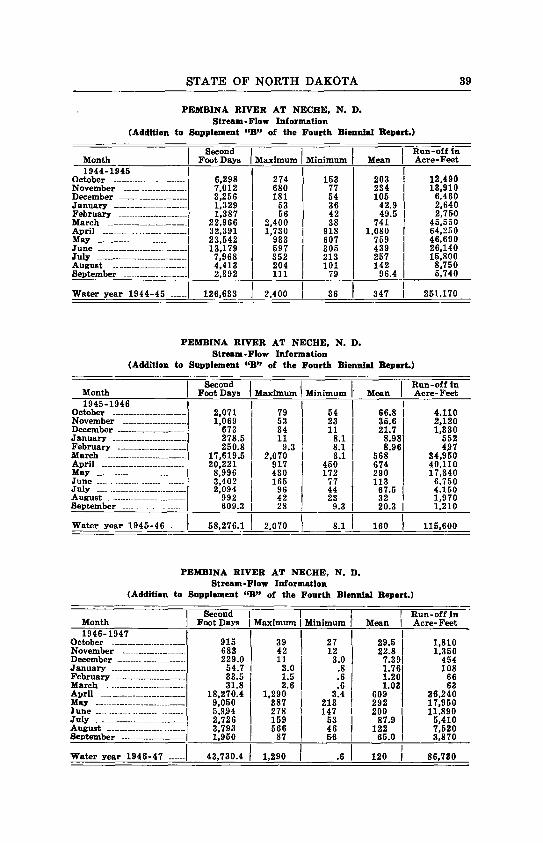
PEMBINA RIVER AT NECHE, N. D.Stream-Flow Information
(Addition to Supplement "B" of the Fourth Biennial Report.)
Second I I Run-off inMonth Foot Days I Maximum Minimum Mean 1 Acre-Feet1944-1945
October 6,298 274 153 203 12.490November 7,012 680 77 234 13,910December 3,256 181 54 105 6,460January 1,329 53 36 42.9 2,640February 1,387 56 42 49.5 2,750March 22,966 2,400 38 741 45,550April 32,391 1,730 918 1,080 64,250May 23,542 933 607 759 46.690June 13,179 597 305 439 26,140July __ 7,968 352 213 257 15,800August 4,413 204 101 142 8,750September 2,892 111 79 I 96.4 5,740
Water year 1944-45 126,633 2,400 36 347 I 251,170
PEMBINA RIVER AT NECHE, N. D.Stream-Flow Information
(Addition to Supplement "B" of the Fourth Biennial Report.
I Second I 1 Run-off InMonth Foot Days 1 Maximum 1 Minimum Mean 1 Acre-Feet1945-1946
October 2,071 j 79 54 66.8 4,110November 1,069 I 53 1 23 35.6 2,120December 673 34 11 21.7 1,330January 278.5 11 8.1 8.98 552February 250.8 9.3 8.1 8.96 4.97March 17,619.5 1 2,070 8.1 568 34,950April 20,221 1 917 450 674 40,110May 8,996 I 430 172 290 17.840June 3,402 165 77 113 6.750July 2,094 I 96 44 67.5 4.150August 992 I 42 23 32 1,970September 609.3 I 28 9.3 20.3 I 1,210
Water year 1945-46 58,276.1 1 2,070 8.1 160 115,600
PEMBINA RIVER AT NECHE, N. D.Stream -Flow Information
(Addition to Supplement "B" of the Fourth Biennial Report.)
Second I I Run-off inMonth Foot Days 1 Maximum 1 Minimum Mean I Acre-Feet1946-1947
October 915 39 27 29.5 I1,810November 683 42 12 22.8 1,350December 229.0 11 3.0 7.39 454January 54.7 3.0 .8 1.76 108February 33.5 1.5 .6 1.20 66March 31.8 2.6 I .6 1.03 63April 18,270.4 1,290 3.4 609 36,240May 9,050 387 213 292 17,950June 5,994 278 147 200 I 11,890July 2,726 159 53 87.9 i 5,410August 3,793 566 46 122 I 7,520September 1,950 87 5.6 65.0 I 3,870
Water year 1946-47 43,730.4 1,290 .6 120 1 86,730

40 REPORT OF N. D. WATER CONSERVATION COMMISSION
PEMBINA RIVER AT NECHE, N. DAILStream-Flow Information
(Addition to Supplement "B" of the Fourth Biennial Report.)
Second I Run-off inMonth Foot Days I Maximum Minimum Mean I Acre-Feet 1947-1.948
October 1,658 I 66 48 53.5 3,290November 844 48 18 I 28.1 1,670December 478 20 12 I 15.4 948January 436 16 10 I 14.1 865February 159 9 5 I 5.5 315March 156 6 5 I 5.0 309April 27,907 3,600 6 930 55,350May 27,542 1,310 654 888 54,630June 12,387 628 274 413 24,570July 9,671 510 213 312 19,180August 6,106 255 165 197 12,110September 3.517 162 84 117 6,980
Water year 1947-48 90,861 3,600 5 248 180,200
TONGUE RIVER AT CAVALIER, N. D.Stream-Flow Information
(Addition to Supplement "B" of the Fourth Biennial Report.)
Second I1 Run-off inMonth Foot Days I Maximum Minimum I Mean I Acre-Feet 1944-1945
October 112.8 4.8 3.2 3.64 224November 1,358.9 321 3.4 45.3 2,700December 310.2 18 4.4 10.0 615January 113.1 4.4 3.1 3.65 224February 79.3 3.4 2.4 2.83 157March 5,717.3 855 2.2 184 11,340April 1,808 130 38 60.3 3,590May 1,318 114 27 42.5 2,610June 899 130 13 30.0 1,780July ._ 530.5 114 5.7 17.1 1,050August 106.9 6.2 1.8 3.45 212September 127.1 8.1 1.8 4.241 252
Water year 1944-45 12,481.1 855 1.8 34.2 24,754
TONGUE RIVER AT CAVALIER, N. D.Stream-Flow Information
(Addition to Supplement "B" of the Fourth Biennial Report.)
Second I I I Run-off inMonth Foot Days I Maximum I Minimum Mean I Aere-Feet1945-1946 I I
October 107.1 5.1 2.3 I 3.45 212November 115.5 5.3 3.0 3.85 229December 75.8 4.1 1.0 2.45 150January 48.4 1.8 1.1 1.56 96February 36.3 1.4 1.2 I 1.30 72March 2,826.3 363 1.2 I 91.2 5,610April 981 77 11 32.7 1,950May 370.0 18 9.2 I 11.9 734June 184.4 11 3.4 I 6.15 366July 86.7 9.4 .7 2.80 172August 13.9 1.1 .2 .45 28September 72.1 7.9 .1 2.40 143
Water year 1945-46 . 4,917.5 363 .1 I 13.5 I 9,760

STATE OF NORTH DAKOTA 41
TONGUE RIVER AT CAVALIER, N. DAK.Stream•Flow Information
(Addition to Supplement "B" of the Fourth Biennial Report.)
Second 1 I I Run-off inMonth Foot Days I Maximum I Minimum ' Mean I Acre-Feet 1946-1947
October 118.2 7.0 I 2.0 3.81 234November 83.7 4.5 I 1.1 2.79 166December 28.9 2.5 0 .93 57January 1.0 .1 0 .03 2.0February 0 0 0 0 0March 15 10 0 .5 30April 2,465 300 24 82.2 4,890May 419.3 24 7.9 13.5 832June 1,077.6 128 I 7.9 35.9 2,140July 282.4 24 i 3.9 9.11 560August 139.1 7.9 1.5 4.49 276September 61.8 6.1 .4 1 2.061 123
Water year 1946-47 4,692.0 300 I 0 12.9 9,310
SOURIS RIVER NEAR SHERWOOD, N. D.Stream•Flow Information
(Addition to Supplement "B" of the Fourth Biennial Report.)
Second I 1 Run-off InMonth Foot Days I Maximum I Minimum Mean 1 Acre-Feet 1944-1945
October 442.6 I 18 8.5 14.3 878November 336.5 26 4.6 11.2 667December 130.2 5.8 1.6 4.2 258January 50.2 2 1.0 1.62 100February 40.3 I 1.7 1.2 1.44 79.9March 873.6 I 105 1.1 28.2 1,730April 963 I 68 20 32.1 1.910May 482 I 20 I 13 15.5 956June 518 I 27 I 13 17.3 1,030July 928 56 I 15 29.9 1,840August 313.4 I17 I 2.7 10.1 622.September 66 I 4.4 I 1.0 2.2 1 131
Water year 1944-45 5,143.81
105 I 1.0 14.1 10,201.9
SOURIS RIVER NEAR SHERWOOD, N. D.Stream•Flow Information
(Addition to Supplement "B" of the Fourth Biennial Report.)
Second 1 I I Run-off inMonth Foot Days I Maximum 1 Minimum . Mean 1 Acre-Feet 1945-1946
October 117.0 4.7 I 2.4 3.77 232November 118.5 6.0 2.4 3.95 235December 25.6 2.4 0 .83 51January 0 0 0 0 0February .5 .1 0 .02 1.0March 17,162 1,980 I 0 554 34,040April 8,599 863 I 55 287 17,060May 1,076 I 54 I 27 34.7 2,130June 700 I 36 I 11 23.3 1,390July 439.2 23 8.8 14.2 871August 185.6 I 15 I 3.2 5.99 368September 52.3 I 4.4 1 .8 1.741 104
Water year 1945-46 28,475.7 1 1,980 1 0 78.0 56,480

42 REPORT OF N. D. WATER CONSERVATION COMMISSION
SOURIS RIVER NEAR SHERWOOD, N. D.Stream-Flow Information
(Addition to Supplement "B" of the Fourth Biennial Report.)
Second I I ' Run-off toMonth Foot Days 1 Maximum 1 Minimum Mean I Acre-Feet1946-1947
October 95.6 5.8 1.9 3.08 1.90November 58.5 I 2.6 I 1.6 1.95 116December 34.9 I 1.6 .5 1.13 69January 22.5 I .8 .7 .731 45February 13.0 I .6 .1 .46 26March 1,692.4 I 900 .1 54.6 3,360April 48,080 I 2,250 840 1,603 95,370May 11,310 I 721 168 365 22,430June 6,544 I 682 58 218 12,980July 4,417 I 473 38 142 8,760August 919 I 42 21 29.6 1,820September 713.6 I 46 6.9 23.8 1,420
Water year 1946-47 73,900.5 I 2,250 I .1 202 146,600
SOURIS RIVER NEAR SHERWOOD, N. D.Stream•Flow Information
(Addition to Supplement "B" of the Fourth Biennial Report.)
Second I 1 I Run-off inMonth Foot Days I Maximum 1 Minimum Mean 1 Acre-Feet 1947-1948 1
October 410.2 29 I 4.5 13.2 I 814November 287.3 14 1 6.2 9.581 570December 329 13 8 10.6 1 653January 247 12 I 4 7.971 490February 174 6 I 6 6.0 345March 161 6 I 4 5.2 319April 41,111 I 7,380 I 5 1,370 1 81,540May 73,509 7,070 1 262 2,371 145,800June 5,040 248 1 118 168 10,000July 2,870 140 I 74 92.6 I 5,690August 1,500 149 1 23 I 48.4 I 2,980September 375.4 21 1 8.4 1 12.5 I 745
Water year 1947-48 126,013.9 7,380 1 4 344 I 249,900
SOURIS RIVER NEAR FOXHOLM, N. D.Stream•Flow Information
(Addition to Supplement "B" of the Fourth Biennial Report.)
Second I I Run-off inMonth I Foot Days 1 Maximum 1 Minimum Mean 1 Acre-Feet1944-1945
October 3,121 107 87 101 6,190November 3,213 137 60 107 6,370December 2,644 89 84 85. 5,240January 2,622 87 84 84.6 5,200February 2,097 87 36 74.9 4,160March 1,377 77 17 44.4 2.730(Ora 567.1 31 5.7 18.9 1,120May 409.8 39 1.7 13.2 813June 138.2 12 0.2 4.6 274July 15.2 1.4 0.1 0.49 30August 3.3 1.7 0 0.11 6.5September 21.0 2 0.3 0.7 42
Water year 1944-45 16,228.6 137 0 44.5 32,175.5
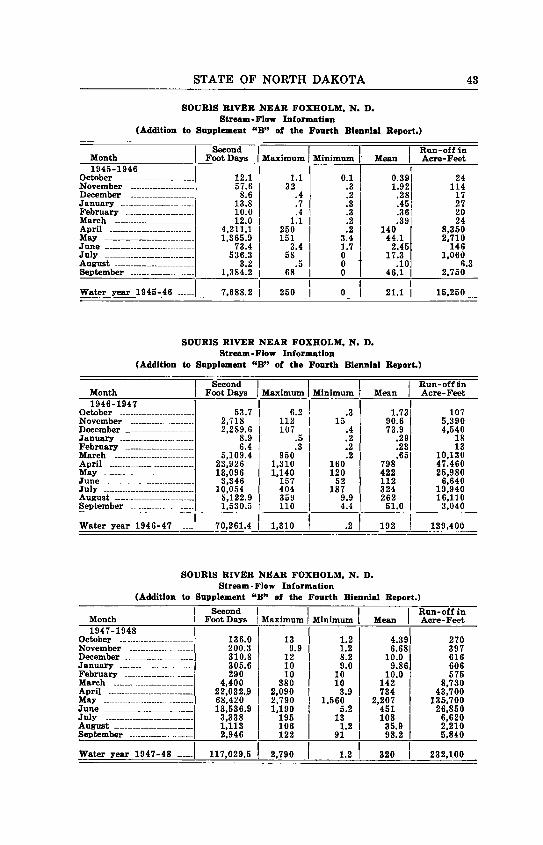
STATE OF NORTH DAKOTA 43
SOURIS RIVER NEAR FOXHOLM, N. D.Stream-Flow Information
(Addition to Supplement "B" of the Fourth Biennial Report.)
Second I I Run-off inMonth I Foot Days I Maximum I Minimum ' Mean I Acre-Feet 1945-1946
October 12.1 1.1 0.1 0.39 24November 57.6 32 .3 1 1.92 114December 8.6 .4 .2 .28 17January 13.8 .7 .3 .45 27February 10.0 .4 .3 .36 20March 12.0 1.1 .2 .39 24April 4,211.1 250 .2 140 8,350May 1,365.9 151 3.4 44.1 2,710June 73.4 3.4 1.7 2.45 146July 536.3 58 0 17.3 1,060August 3.2 .5 0 .10 6.3September 1,384.2 68 I 0 46.1 1 2,750
Water year 1945-46 7,688.2 250 0 21.1 I 15,250
SOURIS RIVER NEAR FOXHOLM, N. D.Stream-Flow Information
(Addition to Supplement "B" of the Fourth Biennial Report.)
Second I 1 I Run-off inMonth Foot Days I Maximum I Minimum Mean I Acre-Feet 1946-1947
October 53.7 6.2 .3 1.73 107November 2,718 112 I 15 I 90.6 5,390December 2,289.6 107 I .4 I 73.9 4,540January 8.9 .5 I .2 I.29 18February 6.4 .3 I .2 .23 13March 5,109.4 950 I .2 .65 10,130April 23,926 1,310 I 160 I798 47,460May 13,096 1,140 I 120 422 25,980June 3,346 157 52 112 6,640July 10,054 404 187 324 19.940August 8,122.9 I 359 9.9 I 262 16,110September _______ 1,530.5 I 110 I 4.4 I 51.0 3,040
Water year 1946-47 ____ 70,261.4 I 1,310 21
192 139,400
SOURIS RIVER NEAR FOXHOLM, N. D.Stream-Flow Information
(Addition to Supplement "B" of the Fourth Biennial Report.)
Second I 1 I Run-off inMonth Foot Days 1 Maximum I Minimum Mean I Acre-Feet 1947-1948 1
October 136.0 13 I1.2 4.391 270November 200.3 1 9.9 I 1.2 6.681 397December 310.8 12 1 8.2 10.0 1 616January 305.6 10 9.0 9.86 606February 290 10 10 10.0 I 575March 4,400 380 10 142 8,730April 22,032.9 2,090 3.9 734 43,700May 68,420 2,790 1.560 2,207 135,700June 13,536.9 1,190 5.2 451 26,850July 3,338 I 195 13 108 I 6,620August 1,113 106 1.2 I 35.9 2,210September _ _________ 2,946 I 122 I 91 I 98.2 I 5,840
Water year 1947-48 I
8 117,029.5 2,790 1.2 320 232,100

44 REPORT OF N. D. WATER CONSERVATION COMMISSION
SOURIS RIVER ABOVE MINOT, N. D.Stream-Flow Information
(Addition to Supplement "B" of the Fourth Biennial Report.)
Second 1 1 1 Run-off inMonth I Foot Days I Maximum 1 Minimum Mean 1 Acre-Feet 1944-1945 I I
October 3,501 I 119 105 113 1 6,940November 3,582 I 142 89 119 I 7,100December 2,622 j 100 82 I 84.6 5,200January 2,653 I 93 84 85.6 5,260February 2,238 1 98 38 79.9 I 4,440March 2,960 425 36 95.5 5,870April 921 53 15 30.7 1,830May 578.5 I 34 8.1 18.7 1,150June 416 I 41 2 13.9 825July 104.8 j 8.1 0.8 3.38 208August 26.1 I 3.2 0 0.84 52September 0 I 0 I 0 1 0 0
Water year 1944-45 19,602.4 j 425 0 53.7 I 38,875
SOURIS RIVER ABOVE MINOT, N. D.Stream-Flow Information
(Addition to Supplement "B" of the Fourth Biennial Report.)
Second I 1 I 1 Run-off inFoot Days I Maximum 1 Minimum . Mean 1 Acre-Feet
1945-1946October i 13.5 1.4 0 .44 27November 82.3 i 14 .2 2.74 163December 41.5 I 2.0 1.0 1.34 82January 36.8 1.4 .8 1.19 78February 15.1 .8 .4 .54 30March 899.6 124 .4 29 1,780April 4,403 243 21 147 8,730May 1,520.7 I 148 2.7 49.1 3,020June 57.2 I 3.6 1.3 1.91 113July _ _ _ 467.1 I 57 0 15.1 926August 1.1 .4 0 .04 2.2September 1,320.6 j 69 1 0 44.0 2,620
Water year 1945-46 8,858.5 1 243 0 24.3 17,570
SOURIS RIVER ABOVE MINOT, N. D.Stream-Flow Information
(Addition to Supplement "B" of the Fourth Biennial Report.)
Second I I I Run-off inMonth Foot Days 'Maximum 1 Minimum Mean 1 Acre-Feet1946-1947
October 110.5 i 8.7 1.5 3.561 219November 2,516.4 112 2.3 83.9 4,990December 2,347.2 105 3.4 75.7 4,660January 44.5 3.0 1.0 1.44 88February 17.0 .9 .4 . 61 34March 6,512.5 1,050 .4 210 12,920April 27,402 1,350 288 913 54,350May 15,096 1,230 129 487 29,940June 4,486 332 96 150 8,900July 9,,954 400 118 321 19,740August 8,176 343 29 264 16,220September 1,905 115 11 I 63.5 3,780
Water year 1946-47 78,567.1
1,350 .4 215 155,800
Month

STATE OF NORTH DAKOTA 45
SOURIS RIVER ABOVE MINOT, N. D.Stream-Flow Information
(Addition to Supplement "B" of the Fourth Biennial Report.)
Second I 1 I I Run- off inMonth Foot Days I Maximum I Minimum 1 Mean 1 Acre-Feet 1947-1948 I
October 288.9 I 26 ' 4.6 9.32 573November 309.9 I 12 I 8.7 10.3 1 615-December 12 I 11 12.0 1 736January 344 12 1 10 11.1 1 682February _ _ 305 11 1 10 10.5 I 605March 4,057 340 1 11 131 1 8,050April 24,290 1,650 380 810 I 48,180May 67,080 2,680 1,760 2,164 1 133,100June 15,478 1,660 24 516 I 30,700July 4,208 203 53 136 i 8,350August 2,386 111 39 77.0 I 4,730September 3,299 130 97 110 I 6,540
1Water year 1947-48 __ 122,416.8 2,680 1 4.6 1 334 1 242,900
SOURIS RIVER AT VERENDRYE, N. D.Stream-Flow Information
(Addition to Supplement "B" of the Fourth Biennial Report.)
Second 1 1 I I Run-off inMonth , Foot Days 'Maximum 1 Minimum I Mean I Acre-Feet1944-1945
October 3,615 162 68 117 7,170November 3,881 157 101 I 129 7,700December 2,632 100 79 1 84.9 5,220January ______ _ ________ _ 2,608 88 79 I 84.1 I 5,170February 2,363 90 81 I 84 I 4,690March 8,274 640 52 I 267 I 16,410April 2,130 171 35 I 71 I 4,220May 1.121 68 24 I 36.2 I 2,220June 967 57 14 I 32.2 I 1,920July 538 28 12 1 17.4 I 1,070August 408.5 23 8 1 13.2 I 810September 222.5 1 10 6 1 7.421 441
Water year 1944-45 28,760 640 6
SOURIS RIVER AT VERENDRYE, N. D.Stream -Flow Information
(Addition to Supplement "B" of the Fourth Biennial Report.)
I Second 1 I I Run-off anMonth I Foot Days 1 Maximum 1 Minimum 1 Mean I Acre-Feet1945-1946 I I1
October _ _ ____ _ ____ 198.0 I 9.3 4.2 6.391 393November 234.0 I 9.3 I 6.8 7.801 464December 213.6 8.2 5.3 6.39 424January 168.8 6.0 I 5.0 5.45 335February 144.0 5.3 I 4.9 5.14 286March 4,221.2 376 I 5.3 136 8,370April___ . __ ___ __________ _ 4,797 267 I 62 160 9,510May 2,306 154 I 18 74.4 4,570June 390.0 21 I 8.2 13.0 774July 469.4 39 I 5.3 15.1 931August 130 .6 7.3 I 2.7 4.21 259September 1,022.9 I 6a I 4.5 34.1 I 2,030
Water year 1945-46 1 14,295.5 376 I 2.7 1 39.2 I 28,350
78.8 1 57,041

46 REPORT OF N. D. WATER CONSERVATION COMMISSION
SOURIS RIVER AT VERENDRYE, N. D.(Addition to Supplement "B" of the Fourth Biennial Report.)
Stream-Flow Information
Second I I I Run-off inMonth I Foot Day_s I Maximum Minimum I . Mean I Acre-Feet1946-1947
October 401.3 57 7.1 12.9 796November . ____ _ - 1,999.5 105 8.8 66.6 3,970December 2,757 110 28 88.9 5,470January 270.0 24 3.0 8.71 536February 80.6 5.0 2.0 2.88 160March 4,545.0 750 1.0 147 9,010April 26,651 1,300 498 I 888 52,860May _ ___________ 19,460 1,220 179 I 628 38,600June__ ..... _____ ._ 5,724 360 I 136 I 191 11,350July 9,592 431 I 115 I 309 19,030August 9,477 38838 306 18,800September 2,090 156 31 69.7 I 4,150
Water year 1.946-47 _83,047.4 I 1,300 1.0 I 228 I 164,700
SOURIS RIVER AT VERENDRYE, N. D.Stream-Flow Information
(Addition to Supplement "B" of the Fourth Biennial Report.)
Second I I Run-off InIMonth Foot Days I Maximum 'Minimum I Mean I Acre-Fe,1947-1.948
October 625 32 15 20.2 1,240November 451 19 12 15.0 895December 470 17 14 15.2 932January 456 16 13 14.7 904February 348 12 12 12.0 690March 2,396 230 12 77.3 4,750April 28,560 1,980 240 952 56,650May 63,520 2,290 1,290 2,049 126,000June 24,833 1,970 170 828 49,260July 6,5.71 2.91 120 212 13,030August 3,121 131 77 101. 6,190September 3,606 147 98 120 7,150
Water year 1947-48 134,957 2,290 I 12 369 267,700
SOURIS RIVER NEAR BANTRY, N. D.Stream-Flow Information
(Addition to Supplement "B" of the Fourth Biennial Report.)
Second I I I Run-off inMonth IFoot Days I Maximum I Minimum Mean I Acre-Feet1944-1945
October 3,501 135 92 113 6,940November I 3,838 150 115 128 7,610December 3,152 130 77 102 6,250January 2,561 91 75 82.6 5,080February 2,53.9 I 102 84 90.7 5,040March 9,015 766 75 291 17,880April _ 5,586 381 63 186 11,080May _ 2.042 72 62 65.9 4,050June _ I 2,135 169 40 71.2 4,230July 1,208 54 28 39 2,400August 856 40 13 27.6 1,700September 276.3 17 I 6.9 9.21 548
Water year 1944-45 36,709.3 I 766
6.9 L 101 I 72,808

STATE OF NORTH DAKOTA 47
SOURIS RIVER NEAR BANTRY, N. D.Stream• Flow Information
(Addition to Supplement "B" of the Fourth Biennial Report.)
Second I 1 Run-off inMonth IFoot Days I Maximum Minimum Mean I Acre-Feet1945-1946
October 457 26 10 14.7 906November 557 22 18 18.6 1,100December 486 19 11 15.7 I964January 384 13 11 12.4 I 762February 290.3 11 9.2 10.4 I 576March 2,857 594 10 92.2 I 5,670April 6,411 606 84 214 I 12,720May 3,717 218 74 120 7,370June 1,249 92 21 41.6 2,480July 773 41 15 24.9 1,530August 201.0 14 3.9 6.481 399September __ 402.1 49 5.1 13.4 I 798
Water year 1945-46 . 17,784.4 606 3.9 48.7 I 35.280
SOURIS RIVER NEAR BANTRY, N. D.Stream-Flow Information
(Addition to Supplement "B" of the Fourth Biennial Report.)
Second I I I Run-off tinMonth Foot Days I Maximum 1 Minimum Mean I Acre-Feet 1946-1947
October 1,218 72 18 39.3 2,420November 1,581 89 19 52.7 3,140December 2,964 106 80 95.6 5,880January 657.0 70 8.0 21.2 1,300February 15.2.0 8.0 2.5 5.43 301March 1,008.0 420 1.0 32.5 2,000April 25,175 1,320 500 839 49,930May 24.902 1,230 334 803 49,390June 7,507 389 195 250 I14,890July 10,,919 427 198 352 21,660August 10,477 389 276 338 I 20,780September __ _ 2,432 I 213 62 I 81.1 I 4,820
Water year 1946-47 ___ 88,992.0 1,320 1 1.0 244 I 176,500
SOURIS RIVER NEAR BANTRY, N. D.Stream-Flow Information
(Addition to Supplement "B" of the Fourth Biennial Report.)
Second II Run-off inMonth Foot Days I Maximum Minimum Mean I Acre-Feet1947-1948 J I
October 1,353 I 87 23 43.6 2,680November 700 I 32 20 23.3 1,390December 607 I 21 I 18 19.6 1,200January 522 I 18 14 16.8 1,040February 344 I 13 I11 11.9 682March 1,566 210 I 12 50.5 3.110April 22,965 I 1,700 I 220 766 45,550May 53.970 I 1,990 1,470 1,741 107,000June 39,590 I 1,990 478 1,320 78,530July 10,969 I449 252 354 21,760August 4,785 275 114 154 9,490September 3,427 I 133 98 114 I 6,800
Water year 1947-48 . 140,798 1,990 11 385 279,200

48 REPORT OF N. D. WATER CONSERVATION COMMISSION
SOURIS RIVER NEAR WESTHOPE, N. D.Stream-Flow Information
(Addition to Supplement "B" of the Fourth Biennial Report.)
Second I I I Run-off inMonth I Foot Days I Maximum I Minimum IMean I Acre-Feet 1944-1945 I
October 2,920 346 19 94.2 5,790November 2,015.7 I 157 0.5 67.2 4,000December 4,357 I 149 130 141 8,640January 3,638 I 146 68 117 7,220February 2,015 I 79 68 72 4,000March 4,874 I 1,040 1 157 9,670April 22,631 I 1,020 213 754 44,890May 5,208.3 I 650 0.2 168 10,330June 784.9 47 0.3 26.2 1,560July 591.4 41 2.5 19.1 1,170August 2,757.5 196 3.9 89.0 5.470September 545.9 37 1.9 18.2 I 1,080
Water year 1944-45 52,338.7 I 1,040 0.2143 103,820
SOURIS RIVER NEAR WESTHOPE, N. D.Stream-Flow Information
(Addition to Supplement "B" of the Fourth Biennial Report.)_ -
Second I I I Run-off inI Foot Days I Maximum I Minimum Mean I Acre-Feet
1945-1946 I IOctober 582.6 I 54 .6 18.8 1,160November 20.1 12 .67 40December 0 0 0 0January 0 0 0 0February 0 I 0 I 0 0March 61.8 I 25 I 1.99 123April 9,630 I GOO 3 321 19,100May ...... _ 752 120 I 1 24.3 1,490June _ 576.9 I 26 I 7.8 19.2 1,140July 485.5 I 24 I 1.1 I 15.7 963August .... ....... 640.8 I 29 I 1.7 I 20.7 1.270September 1,910 I 122 I 18 63.7 I 3,790
Water year 1945-46 14,659.7 I 600 I 0 40.2 29,080
SOURIS RIVER NEAR WESTHOPE, N. D.Stream •Flow Information
(Addition to Supplement "B" of the Fourth Biennial Report.)
Second I I I Run-off inMonth Foot Days I Maximum I Minimum I Mean I Acre-Feet
1946-1947October 373.8 I 28 I 3.1 12.0 741November 15.6 I 9.3 I 0 .52 31December 0 0 0 0 0January 8.6 1.0 0 .28 17February 28.8 1.1 1.0 I 1.03 57March 31.6 1.3 I 1.0 1.02 63April - 31,258 1,800 3.0 1,042 62,000May __ 20,960 940 40 676 41,570June 5,849 438 I 97 195 11,600July 11,861 450 I 140 383 23,530August 8,881 I :120 I 191 286 17,620September 2,199 27:i 11 73.3 4,360
Water year 1946-47 81,466.4 I 1,800 I 0 I 223 161,600
Month

STATE OF NORTH DAKOTA 49
SOURIS RIVER NEAR WESTHOPE, N. D.Stream-Flow Information
(Addition to Supplement "B" of the Fourth Biennial Report.)
I Second I I Run-off inMonth I Foot Days I Maximum I Minimum Mean I Acre-Feet 1947-1948
October 331.7 17 6.8 10.7 658November 303.4 42 0 10.1 602December 24.9 I 1.6 0 .80 49January 18.4 I 1.6 0 .59 36February 6.4 .3 .1 .22 13March 14.5 .5 .4 .47 29April 26,701 2,900 1 890 52,960May 67,970 2,800 1,750 2,193 134,800June 50,900 1,900 1,100 1,697 101,000July 10,536 950 21 340 20,900August I 7,669 433 47 247 15,210September I 1,284 I 47 36 I 42.8 2,550
Water year 1.947-48 165,759.3 2,900 0 453 328,800
LONG CREEK NEAR CROSBY, N. D.Stream-Flow Information
(Addition to Supplement "B" of the Fourth Biennial Report.)
Second I I 1 Run-off in
Month I Foot Days I Maximum I Minimum Mean T Acre-Feet1942-1943
October November December January February March April 1-10, 1943 15,925 2,960 463 1,590 31,590May -June July August September
LONG CREEK NEAR CROSBY, N. D.Stream-Flow Information
(Addition to Supplement "B" of the Fourth Biennial Report.)
Second I Run-off inMonth Foot Days 'Maximum i Minimum Mean 1 Acre-Feet1943-1944
October November December January February March April 7-16, 1944 2.6 1 0.7 0 0.261 5.2M _
June 4-30 491.0 58 0 18.2 I ,974July 27-31 10 .8 I 2.6 1.2 2.161 21August 131.1 I 9.4 0 4.231 260September 0 0 0 0 1 0
1

50 REPORT OF N. D. WATER CONSERVATION COMMISSION
LONG CREEK NEAR CROSBY, N. D.Stream -Flow Information
(Addition to Supplement "B" of the Fourth Biennial Report.)
Second 1 I Run-off inMonth I Foot Days 1 Maximum I Minimum Mean I Acre-Fee 1944-1946 I I
October 1944 0 I 0 I 0November 0 I 0 I 0December 0 0 0January 1945 0 0 I 0February 0 0 I 0March 67.2 5.4 2.17 13April 51.7 7.7 1.72 102May .8 .6 I .03 1.6June 0 0 I 0 0July 0 0 0 0August 11.0 3.8 I .35 22September 0 0 I 0 I 0
Water year 1944-45 __ 130.7 7.7 .36 259
LONG CREEK NEAR CROSBY, N. D.Stream-Flow Information
(Addition to Supplement "B" of the Fourth Biennial Report.)
I Second I I I Run- off snMonth I Foot Days I Maximum I Minimum Mean I Acre-Fee1.945-1946
October 0 0 0November 0 0 0
December 0 0 0January 0 0 0February 0 0 0March 3,58 .7 678 0 116 7,11April 58 .2 67 3.5 19.6 1,17May 3 .6 5.2 0 1.02 6June .9 .3 0 .03 .8
July 34 .2 150 0 11.1 68August 0 0 0September 0 0 I 0
Water year 1945-46 4,548.6 678 0 12.5 9,03
LONG CREEK NEAR CROSBY, N. D.
Stream-Flow Information(Addition to Supplement "B" of the Fourth Biennial Report.)
Second I I I Run-off inMonth IFoot Days I Maximum I Minimum Mean I Acre-Feet1946-1947
October 0 0November 0 0December 0 0January 0I 0 0March 3,34 600 I 10 6,620April 11,31 936 I 6 37 22,450May 57. .6 61 .7 1 .7 1,150June 45 .1 83 I .6 1 .2 903July 19 7 34 .4 .25 384August 26 .6 31 .1 .54 525September 24 .6 20 2.5 .021 477
Water year 1946-47 16,39 .6 936
0 4 .9 32,510
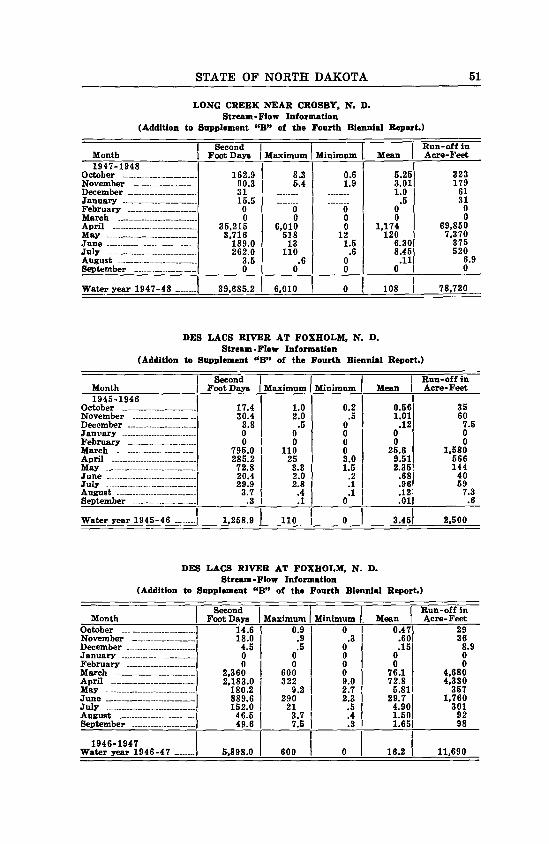
STATE OF NORTH DAKOTA 51
LONG CREEK NEAR CROSBY, N. D.Stream-Flow Information
(Addition to Supplement "B" of the Fourth Biennial Report.)
Second I 11 Run-off inMonth Foot Days I Maximum I Minimum I Mean 1 Acre-Feet 1947-1948
October 162.9 8.3 0.6 5.25 323November 90.3 5.4 1.9 3.01 179December 31 1.0 61January 15.5 I .5 31February 0 0 0 0 0March 0 0 0 0 0April 35,215 6,010 0 1,174 69,850May 3,716 518 I 12 120 7,370June 189.0 13 I 1.5 6.30 375July 262.0 110 .6 8.45 520August 3.5 .6 0 .11 6.9September 0 0 0 0 0
Water year 1947-48 39,685.2
6,010
0 108 78,720
DES LACS RIVER AT FOXHOLM, N. D.Stream-Flow Information
(Addition to Supplement "B" of the Fourth Biennial Report.)
Second I I Run-off inMonth I Foot Days I Maximum Minimum Mean I Acre-Feet 1945-1946
October 17.4 1.0 0.2 0.56 35November 30.4 2.0 .5 1.01 60December 3.8 .5 0 .12 7.5January 0 0 0 0 0February 0 0 0 0 0March 795.0 110 0 25.6 1,580April 285.2 25 3.0 9.51 566May _ 72.8 3.3 1.5 2.35 144June 20.4 2.0 .2 .68 40July 29.9 2.8 .1 .96 59August 3.7 .4 .1 .121 7.3September .3 I .1 0 .011 .6
Water year 1945-46 1,258.9 110 0 3.45 2,500
DES LACS RIVER AT FOXHOLM, N. D.Stream-Flow Information
(Addition to Supplement "B" of the Fourth Biennial Report.)
Second 11 Run-off inMonth Foot Days I Maximum I Minimum Mean 1 Acre-Feet
October 14.6 0.9 0 0.47 29November 18.0 .9 .3 .60 36December 4.5 .5 0 .151 8.9January 0 0 0 0 0February 0 1 0 0 0 0March 2,360 1 600 0 76.1 4,680April 2,183.0 1 322 9.0 72.8 4,330May 180.2 9.2 2.7 5.811 357June 889.6 1 290 2.3 29.7 1,760July 152.0 1 21 .5 4.90 301August 46.51 3.7 .4 1.50 92September 49.6 1 7.5 .3 1.651 98
1946-1947Water year 1946-47 5,898.0 I 600 0 16.2 11,690

52 REPORT OF N. D. WATER CONSERVATION COMMISSION
DES LACS RIVER AT FOXHOLM, N. D.Stream-Flow Information
(Addition to Supplement "B" of the Fourth Biennial Report.)
Second I I I I Run-off inMonth Foot Days I Maximum I Minimum L Mean I Acre-Feet 1947-1948
October 32.7 1.1 1.0 I 1.05 65November 30.3 1.2 .8 1.01 60December 19.7 1.0 .3 .64 39January 5.6 .3 0 .18 11February 0 0 0 0 0March 3.1 2.0 0 .10 6.1April 5,390.0 498 .1 180 10,690May 1,306.8 219 9.1 I 58.3 3,580June 251.1 32 2.0 1 8.37 498July 1,072 63 23 I 34.6 2,130August 1,116 86 24 fI 36.0 2,210September 509.7 I 23 6.8 I 17.0 1,010
Water year 1947-48 10,237.0 498 0 I 28.0 20,300
WINTERING RIVER NEAR KARLSRUHE, N. D.Stream-Flow Information
(Addition to Supplement "B" of the Fourth Biennial Report.)
Second 1 I 1 Run-off inMonth Foot Days I Maximum I Minimum G Mean I Acre-Feet 1944-1945
October 128 5.2 I 3.2 4.13 254November 216.7 14 2.9 7.22 430December 79.2 4 I 0.6 2.551 157January 10.3 0.5 0.2 0.33 20February 2.8 0.1 0.1 0.1 5.6March I 2,481.5 200 I 0.1 80 4,920April 1,456 I 114 I 14 48.5 2,890May I 321.1 I 15 I 8.4 10.4 637June I 210.9 I 11 I 3.2 I7.03 418July I 140.1 I 7 2.7 4.52 278August I88.6 I 6.2 0.9 I 2.86 176September 78.7 I 5.0 0.9 I 2.621 156
Water year 1944-45 _ . 5,213.9 i 200 1 0.1 1 14.3 10,341.6
WINTERING RIVER NEAR KARLSRUHE, N. D.Stream-Flow Information
(Addition to Supplement "B" of the Fourth Biennial Report.)
Second I Run-off inMonth Foot Days 1 Maximum Minimum Mean 1 Acre-Feet 1945-1946 I 1
October 105.8 4.6 2.9 3.411 210November I 77.1 4.3 1.9 2.571 153December 62.6 2.9 1.5 2.021 124January 40.9 1.7 .6 1.321 81February 4.2 .5 .1 .15 8.3March 656.4 I 67 .1 21.1 1,300April 801.1 I 62 7.9 26.7 1,590May I 166.3 I 7.7 3.2 5.36 330June .._ 91.8 I 5.0 1.9 3.06 182July I 49.3 I 4.4 .6 1.59 98August I 32.5 I 2.9 .5 1.05 64September I 52.6 I 2.9 1.0 1.75 104
Water year 1945-46 1
2,140.6 I 67 .1 5.86 14,240

STATE OF NORTH DAKOTA 53
WINTERIN3 RIVER NEAR KARLSRUHE, N. D.Stream -Flow Information
(Addition to Supplement "B" of the Fourth Biennial Report.)
Second I I Run-off inMonth Foot Days I Maximum I Minimum Mean I Acre-Feet 1946-1947
October 114.4 6.1 2.1 3.69 227November 79.8 6.1 1.0 2.66 158December 27.3 2.1 .1 .88 54January 3.1 .1 .1 .10 6.1February .5 .1 0 .02 1.0March 371 70 0 12.0 736April I 2,009 156 17 67.0 3,980May 270.2 15 4.9 8.72 536June I248.3 19 3.8 8.28 492July 1,097.5 116 7.4 35.4 2,180August 559.2 53 4.3 18.0 1,110September 137.8 6.0 3.5 4.59 273
Water year 1946-47 4,918.1 156 0 13.5 9,750
WINTERINO RIVER NEAR KARLSRUHE, N. D.Stream-Flow Information
(Addition to Supplement "B" of the Fourth Biennial Report.)
Second I I Run-off inMonth Foot Days I Maximum I Minimum I Mean I Acre-Feet 1947-1948
October 106.7 3.8 3.2 3.44 212November 87.9 4.2 2.5 2.93 174December 65.5 2.5 1.8 2.111 130January 42.9 1.7 I .8 1.38 85February 4.8 .7 0 .17 9.5March 16.1 2 0 .52 32April_ _________ __ 3,218 3',7 2 107 6,380May 1,486 131 11 47.9 2.950June 230.8 13 I 4.9 7.69 458July 320.0 19 I 2.6 10.3 635August 404.6 22 I 5.2 13.1 803September 91.3 I 4.9 I 2.4 1 3.04 181
Water year 1947-48 . 6,074.6 331 I 0 16.6 12,050
DEVILS LAKE NEAR DEVILS LAKE, N. D.
Month Elevation1944-45 in feet
October 14th 1,403.40November 18th 1,403.50DecemberJanuary February March 5th 1,404.09April 25th _ __________ 1,404.31May 10th 1,404.34June 11th 1,404.36July12th . _ _______ _ . _________ . 1,404.06August 18th 1,403.90September 25th 1.403.79
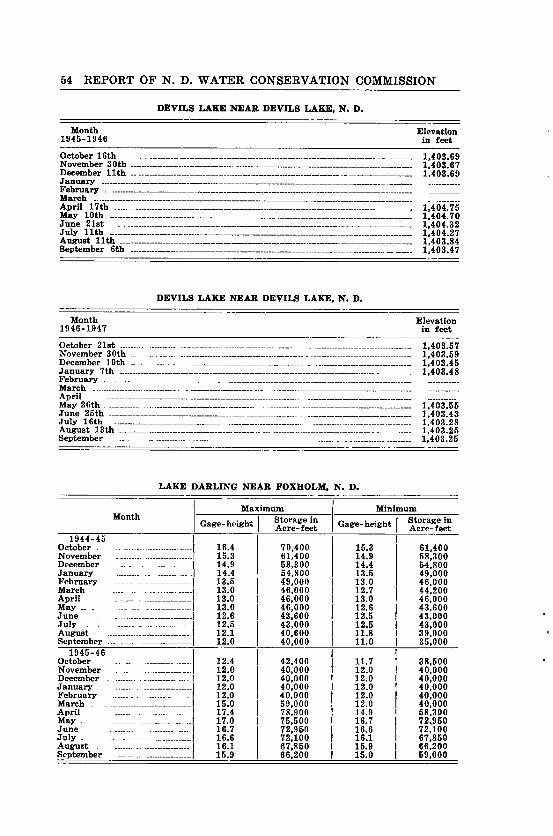
54 REPORT OF N. D. WATER CONSERVATION COMMISSION
DEVILS LAKE NEAR DEVILS LAKE, N. D.
Month Elevation1945-1946 in feet
October 16th 1,403.69November 30th 1,403.67December 11th 1,403.69January February March April 17th 1,404.75May 10th 1,404.70June 21st 1,404.32July 11th 1,404.27August 11th 1,403.84September 6th 1,403.47
DEVILS LAKE NEAR DEVILS LAKE, N. D.
Month Elevation1946-1.947 in feet
October 21st 1,403.57November 30th 1,403.59December 10th __ 1,403.45January 7th 1,403.48FebruaryMarch AprilMay 26th 1,403.55June 25th 1,403.43July 16th 1,403.28August 13th 1,403.25September 1,403.25
LAKE DARLING NEAR FOXHOLM, N. D.
Maximum MinimumMonth
Gage-height Storage inAcre-feet Gage-height Storage in
Acre-feet1944-45
October 16.4 70,400 15.3 61,400November 15.3 61,400 14.9 58,300December .__ 14.9 58,300 14.4 54,800January ______ _. 14.4 54,800 13.5 49,000February 13.5 49,000 13.0 46,000March 13.0 46,000 12.7 44,200April 13.0 46,000 13.0 46,000May _ 13.0 46,000 12.6 43.600June 12.6 43,600 12.5 43,000July 12.5 43,000 12.5 43,000August 12.1 40,600 11.8 39,000September 12.0 40,000 11.0 35,000
1945-46October 12.4 42,400 11.7 38,500November 12.0 40,000 12.0 40,000December 12.0 40,000 12.0 40,000January 12.0 40,000 12.0 40,000February 12.0 40,000 12.0 40,000March 15.0 59,000 12.0 40,000April 17.4 78,900 14.9 58,300May 17.0 75,500 16.7 72,950June 16.7 72,950 16.6 72,100July 16.6 72,100 16.1 67,850August 16.1 67,850 15.9 66,200September 15.9 66,200 15.0 69,000

STATE OF NORTH DAKOTA 55
LAKE DARLING NEAR FOXHOLM, N. D.
Gage Maximum I Gage I Minimum1946-1947
October 15.4 60,600 15.10 59,000November 15.3 60,200 14.7 56,200December 14.7 56,200 14.1 52,5.60January 14.1 52,560 14.1 52,560February 14.1 52,560 14.1 52,560March 14.1 52,560 13.0 46,000April 19.4 94,800 12.9 44,800May 19.4 94,800 19.0 90,300June 19.8 99,700 19.0 90,300July 19.7 99,300 18.9 88.500Augast 18.9 88,500 16.8 69,600September I 16.8 69,600 15.9 64,600
1947-1948October 16.0 65,000 15.9 64,600November 16.0 64,600 15.9 64,600December 16.0 64,600 15.9 64,600January 16.0 64,600 15.9 64,600February 16.0 64,600 15.9 64,600March 16.0 64,600 14.8 55,500April 15.8 63,800 12.0 40,000May 22.7 130,500 17.5 77.200June 19.6 I 95,200 18.0 81,000July 17.9 I 80,400 17.7 79,100August 18.3 I 83,600 17.8 79,400
Buy "Dakota Maid" Flour