state-dependent migratory timing of post ... - core.ac.uk · 2 salmon (salmo salar) 3 4 elina...
TRANSCRIPT

1
State-dependent migratory timing of post-spawned Atlantic 1
salmon (Salmo salar) 2
3
Elina Halttunena, Jenny Lovisa Alexandra Jensena, Tor Fredrik Næsjeb, Jan Grimsrud 4
Davidsena,c, Eva Bonsak Thorstada,b, Cedar Marget Chittendena, Sandra Hamela, Raul 5
Primicerioa, Audun Håvard Rikardsena 6
7
a Department of Arctic and Marine Biology, Faculty of Biosciences, Fisheries and 8
Economics, University of Tromsø, NO-9037 Tromsø, Norway 9
b Norwegian Institute for Nature Research, NO-7485 Trondheim, Norway 10
c Museum of Natural History and Archaeology, Norwegian University of Science and 11
Technology, NO-7491 Trondheim, Norway. 12
Corresponding author: Elina Halttunen. Tel.: +47 77 64 60 20; fax.: +47 77 62 08 53; e-mail 13
address: [email protected] 14
15
E-mail addresses of co-authors: [email protected], [email protected], 16
[email protected], [email protected], [email protected], 17
[email protected], [email protected], [email protected] 18
19
20
21
22

2
Abstract 23
24
Atlantic salmon (Salmo salar) often survive spawning and migrate back to the sea to feed, 25
either shortly after spawning in autumn or in the following spring. We conducted a four-year 26
observational field study using telemetry to evaluate the determinants of migration timing in 27
Atlantic salmon post-spawners (kelts). We found that individuals with low energy reserves 28
migrated early to the risky but productive marine habitat, whereas individuals with greater 29
energy reserves stayed in the safe but less productive river habitat until staying became 30
energetically more costly than migrating. For males, the likelihood of overwintering in the 31
river instead of migrating in autumn increased 27-fold with each increase in body condition 32
index, whereas almost all females overwintered in the river. Among spring migrants, body 33
condition was the strongest determinant of migration timing, and females left the river about 34
five days later than males. Our study suggests that migration timing in Atlantic salmon kelts 35
is the outcome of adaptive state-dependent habitat use, related to individual and sexual 36
differences in energy allocation during spawning. 37
38
Keywords: telemetry, life-history, reproduction, iteroparity, behaviour 39
40

3
Introduction 41
Anadromous salmonids reproduce in fresh water, but achieve the bulk of their growth at sea 42
(Gross 1987). The marine part of the lifecycle is generally characterised by low survival and 43
rapid growth, whereas the freshwater residency offers poorer growth (Jonsson and Jonsson 44
1993). This difference exists because both the predation pressure and production are higher in 45
the marine than in the freshwater habitat (Gross 1987; Ward and Hvidsten 2010). As 46
salmonids are ectotherms, they also grow faster with increasing temperature up to a growth 47
optimum (Jobling 1994, Jobling et al. 2010). Therefore, salmonids grow especially well in 48
the summer when both the temperature and the food availability are high at sea (Ingvaldsen 49
and Loeng 2009; Rikardsen and Dempson 2010). 50
In contrast to most Pacific salmon species, Atlantic salmon (Salmo salar L.1758) often 51
survive spawning in the river (Jonsson et al. 1990; 1991a), and perform repeated marine 52
feeding migrations to build new reserves for re-occurring spawning events (Fleming 1996). 53
The low temperatures experienced by the surviving post-spawning salmonids after spawning 54
(late autumn/winter) restrict their activity and growth potential (see Knutsen et al. 2004) both 55
in the river and at sea. Therefore, the winter season is not ideal for re-building depleted 56
energy resources. This may explain the large individual variation in the timing of feeding 57
migration observed in post-spawning Atlantic salmon (kelts); they either migrate shortly after 58
spawning in the autumn, or during the following spring/summer (Jonsson et al. 1990; 1991a; 59
Niemelä et al. 2000; Webb et al. 2007). 60
Here, we hypothesize that the variation in migration timing is the outcome of adaptive state-61
dependent habitat use, related to differences in energy allocation during spawning. In order to 62
address this hypothesis, we analysed data from a four-year observational field study based on 63
remote sensing of individual behaviour. We tagged a total of 352 Atlantic salmon, and 64

4
registered their post-spawning freshwater survival and migratory timing by means of acoustic 65
and radio telemetry. For Atlantic salmon, the likelihood of repeat spawning is negatively 66
related to energy depletion during the previous spawning event (Fleming 1996). The asset-67
protection principle (Clark 1994) predicts that individuals with low energy reserves and a low 68
probability of future reproduction should accept risky, productive habitats, whereas 69
individuals with large reserves and a high probability of future reproduction should choose 70
safe but less productive habitats. Therefore, applying the asset-protection principle to the 71
migration of Atlantic salmon kelts, we predicted that kelts with low energy reserves would 72
migrate to the sea shortly after spawning, whereas kelts with larger reserves would stay in the 73
river until reaching an energetic threshold, determined by a trade-off between metabolic costs 74
and gains in fresh waters versus marine waters. We thus expected the migration timing to be 75
governed by individual factors related to state-dependency, specifically the individual’s body 76
condition, size and sex. As large Atlantic salmon individuals tend to allocate relatively more 77
energy to spawning than small individuals (Jonsson et al. 1997), and as males have higher 78
energy expenditure than females (Jonsson et al. 1991b; Fleming et al. 1997; Niemelä et al. 79
2000), we expected that (i) individuals in poor body condition would leave the river early, (ii) 80
males would leave the river earlier than females, and (iii) large individuals would leave the 81
river earlier than small individuals. 82
83

5
Material and Methods 84
Study area 85
The study was conducted in Alta River and Fjord in northern Norway (70oN, 23oE, Fig. 1) 86
during 2007-2010. Alta River has a catchment area of 7400 km2 and a mean annual water 87
discharge of 75 m3 s-1. It supports a large Atlantic salmon population with annual in-river 88
catches between 6 and 32 t, with a mean mass of 5.2 kg for individual Atlantic salmon 89
(Ugedal et al. 2008). Most spawners spend one or three years in the sea, where one-sea-90
winter fish (1SW) are mainly males (76%, mean 2.3 kg) and three-sea-winter fish (3SW) are 91
mainly females (77%, mean 10.0 kg) (Ugedal et al. 2008). Repeat spawning is more common 92
in females than in males, and the large majority of both female and male repeat spawners 93
spend one year at sea before returning to spawn again (Halttunen et al. 2011). The river 94
length accessible to Atlantic salmon is 46 km, and a hydropower plant was constructed above 95
this stretch in 1987. Winter freeze-up usually occurs in November, and spring ice break-up 96
normally occurs in early May. There are numerous suitable areas for kelts to overwinter 97
(deep pools, still waters), and a minimum discharge of 20-30 m3 s-1 is maintained by the 98
hydropower plant during the winter. The peak spawning run of Atlantic salmon occurs from 99
mid-June through July, and spawning commences during the first half of October (Ugedal et 100
al. 2008). 101
102
Tagging 103
The post spawning survival and seaward-migration timing of Atlantic salmon kelts was 104
assessed by the use of radio and acoustic telemetry (Cooke et al. 2004). Both methods enable 105
monitoring movements of individual fish by using electronic tags that transmit individually 106
coded signals. Radio telemetry was used to assess the post-spawning survival and the overall 107

6
seaward-migration timing of kelts. The method was chosen because it enabled tracking of 108
fish through ice during the winter. Acoustic telemetry was used for a higher resolution study 109
of out-migration timing versus energy reserves in the spring. The method was chosen because 110
it enables tracking fish in saline water. 111
112
Radio tagging 113
We tagged a total of 166 returning Atlantic salmon in the Alta Fjord and River between June 114
and September 2008-2009 (Table 1). Multi-sea-winter (MSW) fish (56 males, 2-5SW, mean 115
fork length 95 cm; 92 females, 2-6SW, mean fork length 94 cm) were captured in bag nets in 116
the Alta Fjord during their spawning migration towards the Alta River from June to August 117
2008-2009. Uninjured specimens were placed in a 400 L tank with oxygenated water in the 118
research vessel (time in tank 5-120 min), and thereafter externally tagged with radio 119
transmitters (Model F2120, Advanced Telemetry Systems (ATS), MN, flat with outline 120
dimensions 21×52×11 mm, mass in air 15 g, estimated battery lifetime 10 or 13 months). 121
Individuals could be identified by using unique combinations of frequencies and pulse-rates. 122
The fish were anaesthetised prior to tagging (2-phenoxy-ethanol, EC No. 204-589-7, SIGMA 123
Chemical Co., MO, 0.5 ml L-1, mean time 2 min 40 sec), and thereafter placed in a water-124
filled tube with the head and gills submerged. The radio transmitters were attached through 125
the musculature 3-4 cm below the dorsal fin by use of 0.8 mm stainless-steel wires, and 126
anchored to a 10×40 mm plastic back plate. The mean tagging time was 1 min 50 sec, and the 127
mean handling time was 5 min 20 sec. The tagged fish were left to recover in the oxygenated 128
tank under observation (mean time 2 min 50 sec), whereupon they were released back into 129
the fjord to resume their migration towards the river. 130
One-sea-winter Atlantic salmon often escape bag nets due to the large mesh sizes. Therefore, 131
the radio-tagged group was biased towards MSW males, and so the radio-tagged group was 132

7
more similar in size than the acoustically tagged group (see Table 1). To increase the number 133
of 1SW males in the study, eight additional individuals (mean fork length 57 cm) were 134
captured by rod and reel in the upper parts of the river between 6 and 30 September 2009, 135
and tagged using similar procedures as described above. An additional 10 MSW Atlantic 136
salmon (eight females, two males, mean fork length 92 cm,) were captured in the same area 137
and tagged during the same period (Table 1). 138
139
Acoustic tagging 140
We tagged a total of 202 kelts (57 males, 1-3SW, mean fork length 65 cm; 145 females, 2-141
7SW, mean fork length 94 cm, Table 1) with acoustic tags (Vemco Inc., Canada, model V13-142
1L, cylindrical with dimensions 13 mm×36 mm, mass in air 11 g, and Thelma AS, Norway, 143
model MP-13, 13 mm×31mm, mass in air 11 g, estimated battery life 13 or 37 months) in the 144
Alta River during April - May 2007-2009. The kelts were captured in the river by angling 145
with barbless treble hooks, anaesthetised and tagged internally according to Halttunen et al. 146
(2010). All kelts were also externally tagged with modified Carlin tags with contact and 147
reward information for the report of recaptures. 148
149
Tracking 150
Radio tracking 151
To detect radio-tagged fish descending the river, automatic stationary receivers storing 152
information on tag ID and time of registration (R4500S Scientific receiver, ATS, connected 153
to a four- or nine-element Yagi-antenna) were installed 1 and 8 km upstream from the river 154
outlet during both study years (Fig. 1). In addition, stationary receivers were operative 15 and 155
19 km upstream from mid-October 2009. The scan time on the receiver for each frequency 156

8
used on radio transmitters was 5 sec, giving a total scan time ranging from 2 min 30 sec to 4 157
min 10 sec to cover all frequencies used and to be able to register fish within the detection 158
area of the receiver (approximately 1 km). 159
160
The positions and possible predation events of the radio-tagged fish within the river were 161
determined by manual tracking using a portable receiver (R410 Scanning receiver, ATS, 162
connected to a three-element Yagi-antenna). The fish were positioned with an accuracy of 163
approximately ± 300 m, i.e. fish were localized to a specific pool in the river. Tracking was 164
performed approximately every second week from spawning (October) until the river froze 165
(~mid-November), on a monthly basis during winter, and every third week from ice break-up 166
(~mid-April) until the end of July. Due to unstable ice conditions during the winter 2008-167
2009, tracking in December and January could not be performed because accessing these 168
remote areas in wintertime requires snowmobile transport on the river ice. 169
170
Acoustic tracking 171
To detect acoustically tagged fish descending the river, eleven acoustic receivers (model 172
VR2, Vemco Inc.) were deployed at 5 m depth, spaced 400 m apart, in an array across the 173
Alta Fjord 4 km from river mouth (Fig. 1) between April and October 2007-2009. In addition, 174
two receivers were deployed near the river mouth in the lower reaches of the river. 175
Information on the time of registration and the tag ID were stored in the acoustic receivers 176
whenever an individual passed within the detection range. The receivers were able to detect 177
fish at a range varying from 200-600 m, depending on environmental conditions. Hence, all 178
fish passing the receiver arrays were within the detection range. 179
180

9
Sampling 181
A total of 144 kelts (46 males and 68 females, mean fork length 82 cm, range 50-112 cm) 182
were sacrificed during tagging in the river (2007-2009), and their stomach contents were 183
analysed. The water temperature and discharge in the river were measured hourly at Kista 184
hydrographical station 28 km upriver, and the sea temperature was measured at an average of 185
10 days interval at Ingøy hydrographical station (N 71°08' E 24°01') at one meter depth. 186
187
Data analysis 188
The minimum survival of Atlantic salmon kelts 189
Because we chose small tags to minimize potential tag effects on behaviour (Thorstad et al. 190
2000), some of the batteries were dead before the fish left the river. Due to the uncertain fates 191
of fish with undetected exit, we based the survival rate estimate strictly on confirmed 192
survived fish, i.e. fish with detected exit and recaptured fish, and therefore our survival 193
estimate is a minimum estimate. We considered fish reported recaptured and released by 194
anglers in the river during 1 June – 31 August to be alive with a high survival probability, 195
despite being caught and released (Halttunen et al. 2010). Predation was assessed from 196
tagged carcasses detected in the vicinity of the river. 197
198
Analyses of seaward-migration timing of Atlantic salmon kelts 199
Two separate models were used to test the determinants for the timing of seaward-migration; 200
a logistic regression model to assess the probability of the radio-tagged fish migrating either 201
during autumn (defined here as before end of January) or spring (defined her as after onset of 202
April), and a linear regression model to explain sea entry date (in Julian days using 1 May as 203
day 1) of the acoustically tagged fish in the spring. For both analyses, we were interested in 204

10
assessing the influence of sex, length (fork length in cm), body condition index and their 205
interactions. The body condition index consisted of the residuals of log [mass] regressed on 206
log [length], and was chosen in order to avoid co-linearity between the explanatory variables 207
length and body condition (R = 0.34). The body condition index was calculated from length 208
and mass measured at tagging, i.e. it represented the body condition in two distinct phases of 209
the spawning migration; before spawning for the radio tagged fish and after spawning and 210
overwintering for acoustically tagged fish. The variable year was included to account for 211
among-year variation in the environment, which can be considerable; for example, the timing 212
and intensity of the flood peak varied greatly among the study years (range 400-816 m3s-1, 213
Fig. 2). The variable tag site was included as a covariate in the linear model explaining sea 214
entry date to control for distances between tagging sites and the sea. 215
For the logistic regression model predicting spring migration, only 2 females out of 63 left in 216
autumn (3%) compared with 9 out of 21 males (43%). Therefore, we only analysed the 217
probability of spring migration for males. Because we had very few males in this analysis, we 218
could not assess the influence of interactions. In addition, to prevent type II errors owing to 219
the low power of the test (4 estimates -intercept, year, condition, length- for 21 data points), 220
we performed stepwise removal of least significant variables. We performed a Pearson χ2 221
statistic to assess the goodness-of-fit of the model, which showed no evidence of over-222
dispersion (P = 0.99). We present odds ratio (with 95% confidence intervals), which is a 223
measure of effect size in logistic regression (Nakagawa and Cuthill 2007). For continuous 224
variables like length and body condition index, the odds ratio is the odds of migration 225
occurring in the spring with an increase of one unit, e.g. the ratio of the odds when length 226
equals 100 cm to the odds of it occurring when it equals 101 cm. An odds ratio of 1 indicates 227
that spring migration is equally probable with change of one unit. When the ratio moves 228
towards 0, spring migration is more likely to occur with a decrease of one unit, whereas when 229

11
it moves towards infinity, it is more likely to occur with an increase of one unit. To assess the 230
performance of the logistic model, we report the area under the receiver operating 231
characteristic curve (AUC), which measures the overall predictive accuracy of the model 232
independent of a specific threshold (Fielding and Bell 1997, R package “lrm”). AUC values 233
vary from 0.5 to 1, and represent the percentage of randomly drawn pairs (i.e. one of each 234
group) that the model classifies correctly. Generally, the predictive accuracy of a model is 235
classified as “worthless” with an AUC close to 0.5 and “excellent” with an AUC close to 1.0. 236
All variables in both models were centred to allow interpretation of main effects 237
independently of interactions (Schielzeth 2010). In addition, all continuous variables were 238
standardized in order to provide standardized parameter estimates that allow comparing the 239
magnitude of the effects, and hence, the importance of each variable (Schielzeth 2010). 240
Because the models included a categorical variable, we used two standard deviations to 241
standardize the continuous variables, therefore permitting comparison between categorical 242
and continuous variables (Gelman 2008; Schielzeth 2010). All statistical analyses were 243
conducted using the open source R language for statistical computing and graphics (R 244
Development Core Team 2009). 245

12
Results 246
The minimum survival of Atlantic salmon kelts 247
The minimum survival of Atlantic salmon kelts was 63% (98/156 individuals included in the 248
analysis, both study years pooled). Out of these survivors, 13% (13/98) left the river in the 249
autumn, and the remaining 87% (85/98) left in the spring. The majority of the autumn 250
migrants (10 of 13, 77%) were MSW males. The minimum survival rate was higher for MSW 251
females (74%) than for MSW males (43%; χ2-test, P < 0.001), but there was no difference in 252
survival between MSW females and 1SW males (62%; Fisher’s exact test, P = 0.70). 253
254
Overall seaward-migration timing of Atlantic salmon kelts 255
Despite no difference in the body condition between the males and females (t test assuming 256
equal variances: t = 1.99, P = 0.29, df = 80) upon entry, almost all females started their 257
migration in spring (97%) whereas almost half of the males migrated in the autumn (43%). 258
Even though salmons had a slight tendency to enter later with lower body condition (Pearson 259
correlation coefficient: r = -0.20, P = 0.08, n = 76), the river entry date was not correlate with 260
the exit date (Pearson correlation coefficient: r = -0.05, P = 0.69). Among males, the 261
complete model (with low power because it is getting towards saturation with about 5 data 262
points available for each estimate) showed a tendency for males in better condition to leave in 263
the spring (Table 2). Model reduction, increasing the power of the analysis, confirmed the 264
effect of condition on the probability of spring migration (odds ratio [CI] = 26.7 [2.2;1265.0], 265
Wald χ2 = 2.1, P = 0.036). Males were 27 times more likely to migrate in the spring with each 266
increase of one unit in body condition index (Fig. 3). In general, the probability of males 267
migrating to sea in the spring was 50% if their body condition index was close to 0 or 268
13
positive, meaning fish of average or higher than average condition (Fig. 3). Overall, the 269
model had an excellent predictive power, as indicated by the high AUC value (Table 2). 270
271
Migration timing among spring migrating Atlantic salmon kelts 272
In total, 188 (93%) of all the acoustically-tagged spring migrants were detected on the 273
acoustic arrays in the fjord. Among sex, body condition, and fork length, body condition had 274
the strongest influence on migration timing of detected fish: fish in better body condition 275
migrated later, and this effect was stronger for females than for males (Table 3, Fig. 4a). Sex 276
was the second strongest predictor but its effect was three times smaller than that of body 277
condition (Table 3). On average, females migrated five days later than males (Table 3). Fish 278
length did not affect sea entry date in the spring, but its interaction with sex was a strong 279
predictor (Table 3, Fig. 4b); males entered the sea slightly later with increasing fork length, 280
whereas females’ sea entry date did not vary with length. Sea entry date varied among years, 281
but variation among tag sites was negligible (Table 3). The median migration date during the 282
study period was 9 June (Fig. 2). 283
284
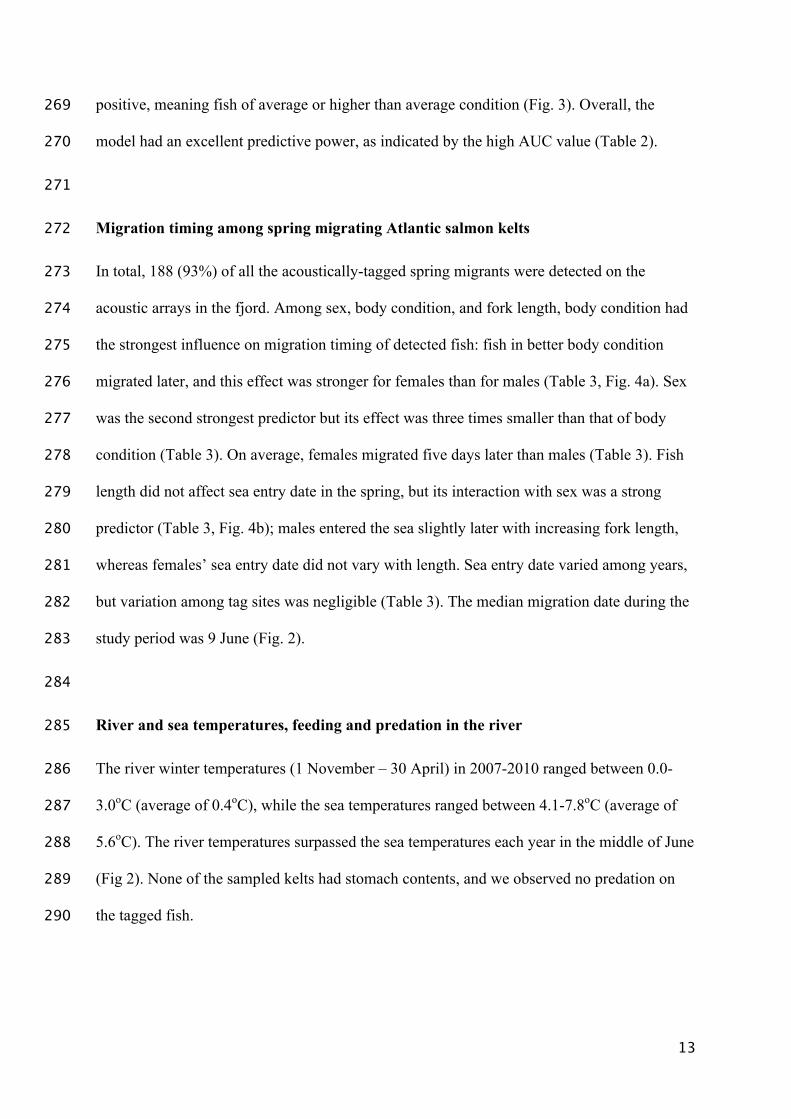
River and sea temperatures, feeding and predation in the river 285
The river winter temperatures (1 November – 30 April) in 2007-2010 ranged between 0.0-286
3.0oC (average of 0.4oC), while the sea temperatures ranged between 4.1-7.8oC (average of 287
5.6oC). The river temperatures surpassed the sea temperatures each year in the middle of June 288
(Fig 2). None of the sampled kelts had stomach contents, and we observed no predation on 289
the tagged fish.290

14
Discussion 291
Consistent with our expectations, fish in poorer condition left the river earlier than fish in 292
better condition, both when comparing between autumn and spring migrating males, and 293
among spring migrating females and males. This indicates that there may be an inherent 294
advantage to prolonging the freshwater residency instead of initiating the seaward-migration 295
as soon as possible. We suggest that the advantage may be related to the differences between 296
the river and marine habitat during winter, in relation to metabolic costs vs. gains, and 297
predation risk. The river is a low-cost, low-gain, and low-risk habitat for overwintering kelts. 298
Fish that overwinter in the river at temperatures close to 0 °C should have very low metabolic 299
costs (Jobling 1994). We found no evidence for metabolic gains through feeding (because 300
kelts had empty stomachs), and the kelts risk little or no predation in the river, as they are 301
virtually untouchable under the protective ice cover. The known predators of Atlantic salmon 302
in the River Alta are white-tailed sea eagles Haliaeetus albicilla and European otters Lutra 303
lutra, and as a rule, they feed on dead fish after spawning before the river freezes (E. 304
Halttunen, personal observations). The marine environment, on the other hand, is a 305
productive but more risky habitat for kelts. Despite lower marine production during winter, 306
there are prey (fish, amphipods, euphausiids) available in the sea throughout the year. In 307
addition, even though marine predation on adult Atlantic salmon is not considered an 308
important factor for mortality (reviewed by Mather 1998), large predators like seals and 309
whales are known to predate upon adult salmon (Ward and Hvidsten 2011, own unpublished 310
data). Therefore, we suggest that individuals that can energetically afford to do so, should 311
overwinter in the river and migrate to the sea when increased temperatures improve feeding 312
opportunities. This hypothesis is further supported by the fact that the median outmigration 313
date among the spring migrants coincided roughly with the equalising of temperatures in the 314
river and along the outer coast, therefore rendering the metabolic costs of staying in the river 315

15
higher than that of migrating to the sea. As Atlantic salmon migrate between the river and 316
marine habitats, where they cover large distances (Klemetsen et al. 2003), optimizing each 317
leg of the migration to the lowest possible risk and the highest possible gain is likely 318
important for the overall survival and lifetime fitness. 319
320
Consistent with our expectations, males left the river earlier than females, both when 321
comparing autumn to spring migrants and spring migrants among each other. Atlantic salmon 322
males generally invest more of their somatic energy (36%) in spawning than females (25%, 323
Jonsson et al. 1991b) as a result of active and aggressive behaviour and investments in 324
secondary sexual traits (Fleming 1998). This somatic energy loss, when added to injuries 325
acquired during intense male-male competition during spawning, may lead to poor 326
physiological status and high post-spawning mortality among males (Jonsson et al. 1990; 327
Baglinière et al. 1991; Fleming 1998). However, Atlantic salmon males display two 328
alternative reproductive strategies. They return from their sea feeding migration either after 329
one winter as small individuals, or after multiple winters as large individuals. Small males 330
invest less of their total energy in spawning (40-50%) compared to large males (up to 70%), 331
and larger males fight more violently (Fleming 1996; Jonsson et al. 1997; Jonsson and 332
Jonsson 2003). Accordingly, the mortality among large males in this study was higher than 333
among females and small males, and almost all of the autumn migrants were large males. 334
Small males may minimize their involvement in the spawning event to conserve their energy, 335
therefore increasing their chances of surviving to spawn again (Seamons and Quinn 2010). 336
This seems to be the case in River Alta, where small males have a much higher repeat 337
spawning probability than large males (Halttunen 2011). 338
339

16
Almost all females (98%) overwintered in the river and started their ocean migration in the 340
spring, despite large variations in body condition when entering the river. This shows a clear 341
difference in the overall migration strategy between the sexes, and most likely, a difference in 342
energy allocation during spawning. Atlantic salmon females generally allocate most of their 343
energy reserves in egg production (~30%; Jonsson and Jonsson 2003) and little in aggression 344
and competition, therefore suffering lower post-spawning mortality (Jonsson et al 1990; 345
Baglinière et al. 1990, 1991; Fleming 1998). Consequently, females have a higher repeat-346
spawning probability than males (Heggberget 1989; Jonsson et al. 1990; Niemelä et al. 2000). 347
Females in River Alta can spawn multiple times (Halttunen 2011). Therefore, according to 348
the asset protection principle (Clark 1994), females should choose safe but less productive 349
habitats like the river after spawning, and hence prioritise the next spawning occasion 350
because they have a high future reproductive probability. As the large majority of the repeat 351
spawning females and males spend a year in the sea before returning, i.e. spawn alternate 352
years (Halttunen 2011), the difference in the migration behaviour between sexes cannot result 353
from a difference in repeat spawning. 354
355
Based on the knowledge that larger fish tend to use more energy than small fish during 356
spawning (Jonsson et al. 1997), we expected large individuals to leave the river earlier than 357
small individuals, and this was certainly true for the overall migration pattern of males, where 358
almost all of the autumn migrants were large males. However, we observed the contrary 359
among the spring migrating males; larger males left the river at a later date than smaller 360
males (Fig 4b). For spring migrating females, length had no effect on migration timing (Fig 361
4b). There might be several factors accounting for large size not advancing the outmigration 362
date in the spring. Especially for females, large size is an asset worth protecting, as size 363
correlates positively with fecundity (Fleming 1996). Large fish also have a lower metabolic 364

17
rate in relation to body size than small fish (Jobling 1994), and might use relatively less 365
energy than small fish during overwintering. In addition, large fish might be more dependent 366
on good feeding conditions to meet the demands of growth compensation. Growth 367
compensation (Jobling 1994, 2010; Ali et al. 2003) is a phenomenon occurring in Atlantic 368
salmon after a period of starvation, induced by the loss of body mass and reduced lipid 369
reserves. It leads to high feeding rates, and a growth rate above that normally recorded in fish 370
that feed regularly. Growth compensation may have far-reaching consequences, as there are 371
trade-offs between growth and other fitness-related traits, such as physiological costs in the 372
form of reduced swimming performance, immune capacity and developmental stability 373
(Jobling 2010; Ali et al. 2003). Therefore, waiting for good growth conditions before starting 374
the feeding migration might be crucial for adult post-spawners, and especially for large ones. 375
376
Variation among years affected the overall (autumn/spring) migration timing of Atlantic 377
salmon kelts, likely due to annual changes in environmental factors. The river temperatures 378
Atlantic salmon experience prior to and during spawning will have an immediate effect on 379
their energy expenditure through metabolic costs (Jobling 1994). As we suggest that out-380
migration is related to body condition, this could explain the differences between years in the 381
likelihood of migrating in the autumn. Environmental factors had also a significant effect on 382
the out-migration during spring. The migration timing of kelts varied in accordance to the 383
timing of the flood peak (earliest in 2009 and latest in 2008, Table 3, Fig. 2), and hence the 384
spring flood may be an important environmental cue for kelt migration initiation. This 385
concurs with the migratory timing of Atlantic salmon smolts, which synchronize their out-386
migration with environmental cues in an attempt to match the most profitable growth 387
conditions at sea (Hvidsten et al. 2009; Rikardsen and Dempson 2010). However, despite the 388
clear effect of environmental cues, the out-migration of kelts spanned out over a period of 6-389

18
12 weeks, whereas the smolts migrate over a more concentrated time period (Jensen et al. 390
2012). This might be because kelts are considerably larger than smolts, and therefore not 391
dependent on the safety of a crowd under migration. Also, kelts have larger mouths, and 392
therefore, a larger feeding repertoire than smolts, whereas smolts are dependent on certain 393
seasonal prey types (e.g. zooplankton; Hvidsten et al. 2009; Rikardsen and Dempson 2010). 394
Finally, even though kelts might also benefit from entering the sea in the most productive 395
season, they might be forced to leave the river earlier than would be optimal for feeding 396
opportunities at sea due to poor body condition. 397
398
On a more general note, the morphology and hydrography of rivers can play an important 399
role in the migration timing of post-spawning Atlantic salmon. The decision to overwinter in 400
the river is likely dependent on suitable overwintering areas and adequate water discharge 401
throughout the winter (as documented in e.g. brown trout Salmo trutta and Arctic charr 402
Salvelinus alpinus; Olsen et al. 2006; Jensen and Rikardsen 2012), as well as on a favourable 403
temperature regime and relative differences between river and sea temperatures. Therefore, 404
the individual condition and the future reproductive prospects of the fish work most likely in 405
concert with environmental factors in determining the overall migration timing of spent 406
Atlantic salmon. This study, however, demonstrates the importance of physical condition in 407
migration timing, and provides a theoretical framework for future salmonid migration studies. 408
409
Acknowledgements 410
Members of Alta Laksefiskeri Interessentskap (ALI), Birger Hansen and the Arild family, 411
Amund Suhr, Endre Baltesgard, Sigurd Tønnessen, Brødrene Mathisen Sagbruk og Trelast 412
DS, and the crew of FF Johan Ruud are thanked for their help during fieldwork, Gunnel 413

19
Østborg is thanked for scale sample analysis, and Karl Ø Gjelland, Ola Ugedal and Michael 414
Greenachre are thanked for comments on data-analysis. The University of Tromsø, 415
Sparebanken Nord-Norge, the Norwegian Research Council, the Norwegian Institute for 416
Nature Research, the Norwegian Directorate for Nature Management, ALI, the County 417
Governor of Finnmark and Fiskeriforskningsfondet are acknowledged for funding of the 418
project. Hydrological data were provided by the Norwegian Water Resources and Energy 419
Directorate and Institute of Marine Research. All the experimental procedures were approved 420
by the Norwegian Animal Research Authority. 421
422

20
References 423
Ali, M., Nicieza, A., and Wootton, R. J. 2003. Compensatory growth in fishes: a response to 424
growth depression. Fish Fish. 4: 147–190. doi: 10.1046/j.1467-2979.2003.00120.x. 425
Baglinière, J.L., Maisse, G., and Nihouarn, A. 1990. Migratory and reproductive behaviour of 426
female adult Atlantic salmon, Salmo salar L., in a spawning stream. J. Fish Biol. 427
36(4): 511–520. doi:10.1111/j.1095-8649.1990.tb03553.x. 428
Baglinière, J.L., Maisse, G., and Nihouarn, A. 1991. Radio-tracking of male adult Atlantic 429
salmon, Salmo salar L., during the last phase of spawning migration in a spawning 430
stream (Brittany, France). Aquat. Living Resour. 4(3): 161–167. doi: 431
10.1051/alr:1991017. 432
Clark, C.W. 1994. Antipredator behavior and the asset-protection principle. Behav. Ecol. 433
5(2): 159-170. doi:10.1093/beheco/5.2.159. 434
Cooke S.J., Hinch S.G., Wikelski M., Andrews R.D., Kuchel L.J., Wolcott T.G., Butler P.J. 435
2004. Biotelemetry: a mechanistic approach to ecology. Trends Ecol. Evol. 19(6): 436
334–343. doi: 10.1016/j.tree.2004.04.003. 437
Fielding, A.H., and Bell, J.F. 1997. A review of methods for the assessment of prediction 438
errors in conservation presence/absence models. Environ. Conserv. 24(1): 38-49. doi: 439
10.1017/S0376892997000088. 440
Fleming I.A, 1996. Reproductive strategies of Atlantic salmon: ecology and evolution. Rev. 441
Fish Biol. Fish. 6: 379–416. doi: 10.1007/BF00164323. 442
Fleming, I.A. 1998. Pattern and variability in the breeding system of Atlantic salmon (Salmo 443
salar), with comparisons to other salmonids. Can. J. Fish. Aquat. Sci. 55(Suppl. 1): 444
59-76. doi: 10.1139/d98-009. 445

21
Fleming, I.A., Lamberg, A., and Jonsson, B. 1997. Effects of early experience on the 446
reproductive performance of Atlantic salmon. Behav. Ecol. 8(5): 470-480. doi: 447
10.1093/beheco/8.5.470. 448
Gelman, A. 2008. Scaling regression inputs by dividing by two standard deviations. Statist. 449
Med. 27: 2865–2873. doi:10.1002/sim.3107. 450
Gross, M.R. 1987. Evolution of diadromy in fishes. Am. Fish. Soc. Symp. 1: 14-25. 451
Halttunen, E., Rikardsen, A.H., Thorstad, E.B., Naesje, T.F., Jensen, J.L.A., and Aas, Ø. 452
2010. Impact of catch-and-release practices on behavior and mortality of Atlantic 453
salmon (Salmo salar L.) kelts. Fish. Res. 105(3): 141-147. doi: 454
10.1016/j.fishres.2010.03.017. 455
Halttunen, E. 2011. Staying alive – the survival and importance of Atlantic salmon post-456
spawners. Ph.D. thesis, University of Tromsø, Tromsø, Norway. Munin Open 457
Research Archive: http://munin.uit.no/handle/10037/3536 458
Heggberget, T.G. 1989. The population structure and migration system of Atlantic salmon, 459
Salmo salar, in the River Alta, North Norway. A summary of the studies 1981-1986. 460
In Proceedings of the Salmonid Migration and Distribution Symposium. Edited by 461
E.L. Brannon and B. Jonsson. University of Washington, School of Fisheries, Seattle. 462
pp. 124-139. 463
Hvidsten, N.A., Jensen, A.J., Rikardsen, A.H., Finstad, B., Aure, J., Stefansson, S., Fiske, P., 464
and Johnsen, B.O. 2009. Influence of sea temperature and initial marine feeding on 465
survival of Atlantic salmon Salmo salar post-smolts from the Rivers Orkla and Hals, 466
Norway. J. Fish Biol. 74(7): 1532-1548. doi: 10.1111/j.1095-8649.2009.02219.x. 467
468

22
Ingvaldsen, R., and Loeng, H. 2009. Physical oceanography. In Ecosystem Baretns Sea. 469
Edited by E. Sakshaug, G. Johnsen and K. Kovacs. Tapir Academic Press, 470
Trondheim, Norway. pp. 33–64. 471
Jensen, A.J., Finstad, B., Fiske, P., Hvidsten, N.A., Rikardsen, A.H., and Saksgård, L. 2012. 472
Timing of smolt migration in sympatric populations of Atlantic salmon (Salmo salar), 473
brown trout (Salmo trutta), and Arctic charr (Salvelinus alpinus) Can. J. Fish. Aquat. 474
Sci. 69: 711–723. doi:10.1139/F2012-005. 475
Jensen, J.L.A., and Rikardsen, A.H. 2012. Archival tags reveal that Arctic charr Salvelinus 476
alpinus and brown trout Salmo trutta can use estuarine and marine waters during 477
winter. J. Fish Bio. 81(2), 735–749. doi:10.1111/j.1095-8649.2012.03343.x. 478
Jobling, M. 1994. Fish bioenergetics. Chapman & Hall, London, UK. 479
Jobling, M. 2010. Are compensatory growth and catch-up growth two sides of the same coin? 480
Aquacult. Int. 18: 501–510. doi: 10.1007/s10499-009-9260-8. 481
Jonsson B, and Jonsson N. 1993. Partial migration: niche shift versus sexual maturation in 482
fishes. Rev. Fish Biol. Fish. 3: 348–365. 483
Jonsson, N., and Jonsson, B. 2003. Energy allocation among developmental stages, age 484
groups, and types of Atlantic salmon (Salmo salar) spawners. Can. J. Fish. Aquat. 485
Sci. 60(5): 506-516. doi: 10.1139/f03-042. 486
Jonsson, N., Jonsson, B., and Hansen, L.P. 1990. Partial segregation in the timing of 487
migration of Atlantic salmon of different ages. Anim. Behav. 40(2): 313-321. doi: 488
10.1016/S0003-3472(05)80926-1. 489
Jonsson, N., Hansen, L.P., and Jonsson, B. 1991a. Variation in age, size and repeat spawning 490
of adult Atlantic salmon in relation to river discharge. J. Anim. Ecol. 60(3): 937-947. 491
Available from http://www.jstor.org/stable/5423 [accessed 3 May 2011]. 492

23
Jonsson, N., Jonsson, B., and Hansen, L.P. 1991b. Energetic cost of spawning in male and 493
female Atlantic salmon (Salmo-salar L). J. Fish Biol. 39(5): 739-744. doi: 494
10.1111/j.1095-8649.1991.tb04403. 495
Jonsson, N., Jonsson, B., and Hansen, L.P. 1997. Changes in proximate composition and 496
estimates of energetic costs during upstream migration and spawning in Atlantic 497
salmon Salmo salar. J. Anim. Ecol. 66(3): 425-436. Available from 498
http://www.jstor.org/stable/5987 [accessed 3 May 2011]. 499
Mather, M.E. 1998. The role of context-specific predation in understanding patterns exhibited 500
by anadromous salmon. Can. J. Fish. Aquat. Sci. 55: 232-246. doi: 10.1139/d98-002. 501
Nagelkerke, N.J.D. 1991. A note on a general definition of the coefficient of determination. 502
Biometrika 78(3): 691-692. doi: 10.1093/biomet/78.3.691. 503
Nakagawa, S., and Cuthill, I.C. 2007. Effect size, confidence interval and statistical 504
significance: a practical guide for biologists. Biol. Rev. 82(4):591-605. doi: 505
10.1111/j.1469-185X.2007.00027.x. 506
Niemelä, E., Mäkinen, T.S., Moen, K., Hassinen, E., Erkinaro, J., Länsman, M., and 507
Julkunen, M. 2000. Age, sex ratio and timing of the catch of kelts and ascending 508
Atlantic salmon in the subarctic River Teno. J. Fish Biol. 56(4): 974-985. doi: 509
10.1006/jfbi.1999.1223. 510
Olsen, E.M., Knutsen, H., Simonsen, J.H., Jonsson, B., and Knutsen, J.A. 2006. Seasonal 511
variation in marine growth of sea trout, Salmo trutta, in coastal Skagerrak. Ecol. 512
Freshw. Fish 15(4): 446–452. doi: 10.1111/j.1095-8649.2004.00285.x. 513
R Development Core Team. 2009. R: A Language and Environment for Statistical 514
Computing. R Foundation for Statistical Computing, Vienna, Austria. 515

24
Rikardsen, A.H., and Dempson, J.B. 2010. Dietary life-support: the food and feeding of 516
Atlantic salmon at sea. In Atlantic Salmon Ecology. Edited by Ø. Aas, S. Einum, A. 517
Klemetsen and J. Skurdal. Blackwell Publishing Ltd., Oxford, UK. pp. 115-145. doi: 518
10.1002/9781444327755.ch5. 519
Schielzeth, H. 2010. Simple means to improve the interpretability of regression coefficients. 520
Meth. Ecol. Evol. 1(2): 103–113. doi: 10.1111/j.2041-210X.2010.00012.x. 521
Seamons, T.R., and Quinn, T.P. 2010. Sex-specific patterns of lifetime reproductive success 522
in single and repeat breeding steelhead trout (Oncorhynchus mykiss). Behav. Ecol. 523
Sociobiol. 64(4): 505–513. doi: 10.1007/s00265-009-0866-7. 524
Thorstad, E.B., Økland, F., and Finstad, B. 2000. Effects of telemetry transmitters on 525
swimming performance of adult Atlantic salmon. J. Fish Biol. 57(2): 531-535. doi: 526
10.1111/j.1095-8649.2000.tb02192.x. 527
Ugedal, O., Næsje, T.F., Thorstad, E.B., Forseth, T., Saksgård, L.M., and Heggberget, T.G. 528
2008. Twenty years of hydropower regulation in the River Alta: long-term changes in 529
abundance of juvenile and adult Atlantic salmon. Hydrobiologia 609(1): 9-23. doi: 530
10.1007/s10750-008-9404-2. 531
Ward, D.M., and Hvidsten, N.A. 2010. Predation: Compensation and Context Dependence. In 532
Atlantic Salmon Ecology. Edited by Ø. Aas, S. Einum, A. Klemetsen and J. Skurdal. 533
Blackwell Publishing Ltd., Oxford, UK. pp. 199-220. doi: 534
10.1002/9781444327755.ch8. 535
Webb, J., Verspoor, E., Aubin-Horth, N., Romakkaniemi, A., and Amiro, P. 2007. The 536
Atlantic salmon. In The Atlantic Salmon: Genetics, Conservation and management. 537
Edited by E. Verspoor, L. Strandmeyer and J. Nilsen. Blackwell Publishing Ltd., 538
Oxford, UK. pp. 17-56.539

25
Table 1. The number, average length, and average mass of tagged Atlantic salmon in Alta River and Fjord in 2007 – 2009, according to sex and
tagging technique. Ranges (minimum-maximum) are given in parenthesis.
Year 2007 2008 2009
n Fork length (cm) Mass (kg) n Fork length (cm)
Mass (kg) n Fork length (cm)
Mass (kg)
Radio
tagging;
tagged
before river
entry
Males - - - 25 98
(71-122)
11.9
(3.9-23.3)
41 83
(54-110)
10.1*
(4.8-15.0)
Females - - - 54 96
(83-116)
11.2
(6.5-17.8)
46 94
(82-113)
10.0*
(6.8-17.0)
Acoustic
tagging;
tagged
before river
exit
Males 27 62
(54-82)
1.6
(0.9-3.4)
0 - - 30 67
(57-102)
2.7
(1.3-10.3)
Females 33 93
(75-115)
6.1
(2.6-12.9)
73 93
(75-116)
6.0
(2.9-11.5)
39 97
(89-108)
7.1
(4.0-10.2)
Note: *mass average based on 28 and 38 individuals, respectively, as data was not available for all tagged individuals

26
Table 2. Probability (odds ratio with 95% confidence interval - CI) of migrating in the spring
(after onset of April) rather than in the autumn (before end of January) in relation with length
and body condition while controlling for year, for radio tagged Atlantic salmon (n = 84) in
Alta River and Fjord (2007 – 2009).
Predictor Odds ratio 95% CI
Wald
χ2
P Model
diagnostics*
Intercept 1.9 0.9 – 118.7 0.9 0.4
AUC = 0.93
R2 = 0.65
Year 5.5 1.3 – 53.0 1.9 0.06
Length 29.9 1.0 – 16596.7 1.5 0.13
Condition 265.2 4.32 – 576885.1 1.7 0.08
Note: * The area under the receiver operating characteristic curve (AUC) and Naglekerke R2
(Nagelkerke 1991) present the predictive and explanatory power of the model, respectively.

27
Table 3. Effects of sex, length and body condition, while controlling for year and tag site, on
the migration timing (sea entry date) among spring migrants (n=186), for Atlantic salmon
tagged with acoustic transmitters in Alta River (2007-2009).
Predictor Level Estimate 95% CI df F P
Intercept 40.9 33.2 – 48.7
Year 2008 5.5 -1.8 – 12.9 2 41.6 <0.001
2009 -5.8 -12.6 – 0.9
Tag site 2 -1.4 -9.6 – 6.9 5 0.9 0.5
3 -1.5 -7.5 – 4.4
4 -1.1 -8.4 – 6.2
6 -2.2 -10.1 – 5.6
7 4.0 -3.0 – 11.0
Sex F 4.8 0.1 – 9.4 1 54.2 <0.001
Condition 12.6 8.0 – 17.3 1 50.6 <0.001
Length 4.6 -2.7 – 11.9 1 1.4 0.2
Sex * Condition F 8.1 0.7 – 15.5 1 7.9 0.005
Sex * Length F -8.4 -15.7 – -1.2 1 4.6 0.03
Length * Condition -6.2 -19.5 – 7.2 1 0.8 0.4
Note: F = female, Level = category level which is associated with the estimate. CI =
confidence interval, df = degrees of freedom. Model R2 = 0.55.
28
Figure captions
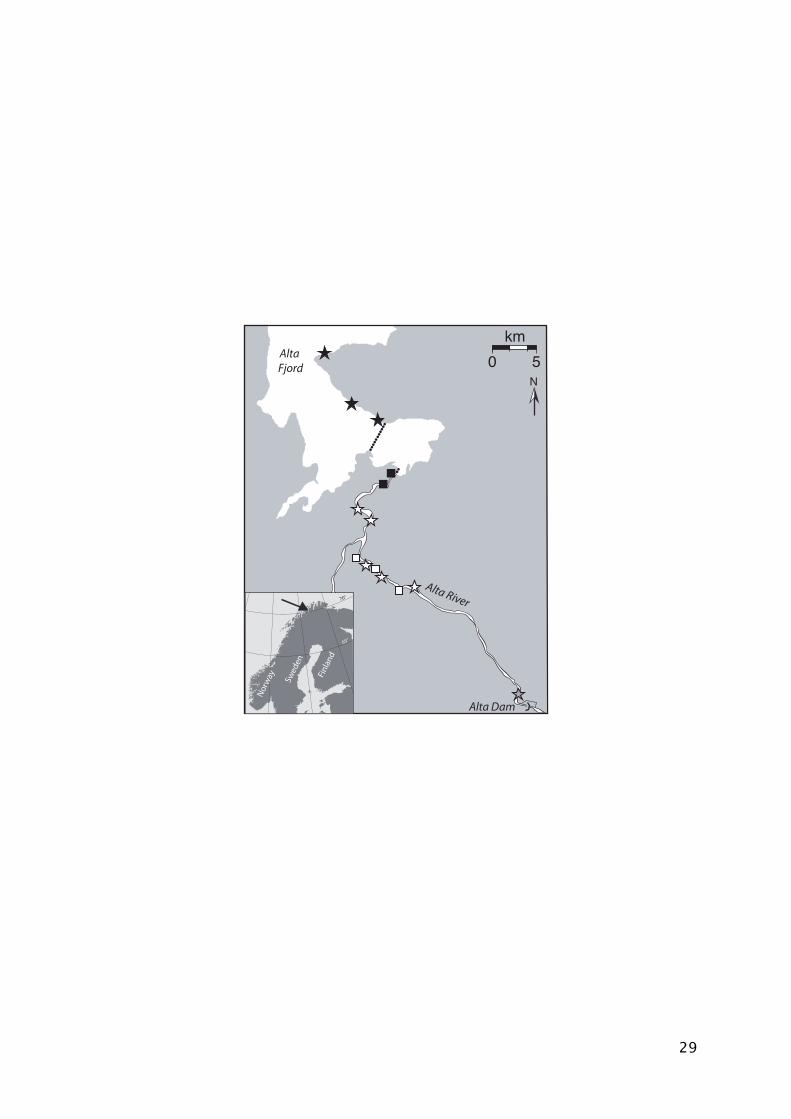
Fig. 1. Map of the lower part of the Alta River and Fjord showing the position of the acoustic
receiver arrays (dotted line and single dots), the stationary radio loggers (black and white
squares; the white squares depicts radio loggers in use only in 2008), and the tagging sites
both in the river and the fjord (stars; the black stars mark the tagging sites for radio tagged
Atlantic salmon, the white stars for acoustically tagged Atlantic salmon, and the grey star an
additional tagging site for radio tagged Atlantic salmon in 2009).
Fig. 2. The marine migration start of acoustically tagged kelts in 2007-2009 in Alta River in
relation to water discharge, river temperature, and sea temperature. The grey vertical line
marks the median migration date across all years (9 June).
Fig. 3. The probability (± SE) for Atlantic salmon kelts in Alta River of migrating in autumn
(0) or spring (1) in relation to body condition in 2009-2010. The thin dotted lines underline
the body condition and length values where fish had a 50% probability of migrating in spring
rather than in autumn. Vertical lines on the x-axis represent the distribution of the data, i.e.
each line represents a tagged male.
Fig. 4. Sea entry date (in Julian days using 1 May as day 1) of Atlantic salmon kelts in Alta
River in relation to body condition (a) and fork length (b). Lines represent model predictions
(± SE), and dots the data.
29
Alta River
Alta Fjord
Alta Dam

30
0"2"4"6"8"10"12"14"16"
0"
150"
300"
450"
600"
750"
900"
Tempe
rature)(0C))/)
#)of)individu
als)
Water)discharge)(m
3 s=1))
0"2"4"6"8"10"12"14"16"
0"
150"
300"
450"
600"
750"
900"
Tempe
rature)(0C))/)
#)of)individu
als)
Water)discharge)(m
3 s=1)) 2008"
0"2"4"6"8"10"12"14"16"
0"
150"
300"
450"
600"
750"
900"
Tempe
rature)(0C))/)
)#)of)ind
ividua
ls)
Water)discharge)(m
3 s=1))
2009"
0"2"4"6"8"10"12"14"16"
0"150"300"450"600"750"900"
1.5." 8.5." 15.5." 22.5." 29.5." 5.6." 12.6." 19.6." 26.6." 3.7." 10.7." 17.7." 24.7." 31.7."
Tempe
rature)(0C))/)
)#)of)ind
ividua
ls)
Water)discharge)(m
3 s=1))
Date)males) females) water)discharge) river)temperature) sea)temperature)
2010"

31
Fig. 3. The probability (± SE) for Atlantic salmon kelts in Alta River of migrating in autumn (0) or spring (1) in relation to body condition in 2009-2010. The thin dotted lines underline the body condition and length values where fish had a 50% probability of migrating in spring rather than in autumn. Vertical lines on the x-axis represent the distribution of the data, i.e. each line represents a tagged male.

32
Fig. 4. Sea entry date (in Julian days using 1 May as day 1) of Atlantic salmon kelts in Alta River in relation to body condition (a) and fork length (b). Lines represent model predictions (± SE), and dots the data.