state contract law and debt contracts · 1032 the journal of law & economics ies generally...
TRANSCRIPT

1031
[ Journal of Law and Economics, vol. 57 (November 2014)]
© 2014 by The University of Chicago. All rights reserved. 0022-2186/2014/5704-0040$10.00
State Contract Law and Debt Contracts
Colleen Honigsberg Columbia University
Sharon Katz Columbia University
Gil Sadka University of Texas at Dallas
Abstract
This paper examines the relationship between debt contracts and state contract
law. We first develop an index to evaluate whether each state’s law is favorable or
unfavorable to lenders. We then analyze how the contract terms, the frequency
of covenant violations, and the repercussions of covenant violations vary across
states. We find that cash collateral is most likely to be used when the contract
is governed by law that is favorable to debtors and that out-of-state borrowers
who use favorable law pay higher yield spreads. In addition, when the law is
favorable to lenders, there are significantly fewer covenant violations, and the
repercussions of covenant violations—measured as changes in the borrower’s
investment policy—are more severe. We also compare the characteristics of rel-
evant parties across states, and the results provide support for the theory that
there is a market for contracts similar to the market for incorporations.
1. Introduction
This paper examines the association between state contract law and debt con-tracts. A recent stream of papers in finance and economics study the role that debt contracts play in mitigating agency problems between equity and debt hold-ers (for example, Baird and Rasmussen 2006; Chava and Roberts 2008; Roberts and Sufi 2009; Nini, Smith, and Sufi 2009). This area of literature examines both the contract terms and the implications of covenant violations. While these stud-
We are grateful for helpful comments and suggestions from Sam Peltzman, an anonymous ref-eree, Thomas Bourveau, Alon Cohen, J. Anthony Cookson, Shahar Dillbary, Miguel Duro-Rivas, Fabrizio Ferri, Victor P. Goldberg, Shachar Hadar, Sharon Hannes, Trevor Harris, Robert Jackson, Jr., Alon Kalay, Urooj Khan, Mattia Landoni, Ningzhong Li, Suresh Nallareddy, Doron Nissim, Stephen Penman, Ariel Porat, Robert E. Scott, Ofer Setty, Elissa Swift, Frederick Tung, Omri Yadlin, and Yu-Ting Forester Wong. We are also grateful to workshop participants at the 2013 Conference on Empirical Legal Studies, the 2014 American Accounting Association annual meeting, the 2014 European Accounting Association Annual Congress, the 2014 Financial Accounting and Reporting Section Midyear Meeting, the 2014 Midwest Economics Association annual meeting, the 2014 Tem-ple University annual conference, the 2014 Trans-Atlantic Doctoral Conference, Columbia Business School, and Tel Aviv University. All errors are our own.

1032 The Journal of LAW & ECONOMICS
ies generally treat contract law as a uniform product across states and assume
that all contracts are enforced in a similar fashion, in practice lenders and bor-
rowers select the state law that will govern the contract. Because the legal rights of
both parties vary depending on the law chosen, the state contract law may be as-
sociated with enforcement. To examine this relationship, we first categorize each
state’s contract law by whether it is favorable or unfavorable to lenders, and then
we examine the characteristics of the contracts and the relevant parties across
states. Finally, we test whether the contract terms, frequency of covenant viola-
tions, and repercussions of covenant violations are related to the state contract
law.
We begin by classifying states according to whether they are favorable to lend-
ers (pro-lender) or favorable to debtors (pro-debtor). In our primary analysis, we
present two metrics to represent the state law. The first metric is the Pro-Debtor
Index, which captures six distinct features of state law that are related to contract
enforcement and that differ across states. The second metric is the perceived lit-
igation risk, which measures the rate of litigation using the reported number of
lawsuits (for a use of such methodology, see Li et al. 2012; Heninger 2001; Fran-
cis, Philbrick, and Schipper 1994). For robustness, we supplement our two pri-
mary rankings of state law with two additional metrics: an alternative classifi-
cation based on the frequency of litigation and a measure in which we rank the
states on the basis of the average number of lenders per loan. All of our different
rankings clearly identify New York as the most pro-lender state and California as
the most pro-debtor state.
Using these rankings of state contract law, we provide descriptive statistics on
the characteristics of contracts, borrowers, and lenders across states to better un-
derstand how borrowers and lenders self-select into different legal regimes. The
analysis suggests that there are significant differences in borrower-lender pairs
across states, most notably that they are more likely to use pro-lender law when
the borrower is highly leveraged and when the deal size is larger. Our findings
also suggest that borrowers and lenders with operations in fewer states are more
likely to use the law of the state in which they are primarily located but that par-
ties with significant multistate operations are more likely to use law from pro-
lender states. This suggests that the costs and benefits to using out-of-state law
vary depending on the geographic characteristics of the borrower and lender.
The observed self-selection is consistent with the legal argument that states
compete to provide law for commercial contracts and that New York has been
particularly successful in courting commercial contracts (Eisenberg and Miller
2010). In our data, we find that New York law is used most frequently and is
especially popular with multistate lenders. It is also noteworthy that the states
that have developed more pro-lender law are the ones in which the financial sec-
tor contributes a greater percentage of the state’s gross domestic product (GDP).
Given that state legislators can affect the state’s contract law, it is important to
acknowledge the role of the state in setting contract law.
We then examine how the contract terms, the frequency of covenant viola-

Debt Contracts 1033
tions, and the consequences of violations vary with the original choice of con-tract law. We first document that cash collateral, which is defined as cash and cash- equivalent assets that are pledged as security for a loan, is used most fre-quently when the contract is governed by pro-debtor law and that out-of-state borrowers who use pro-debtor law pay a premium. We next show that the fre-quency of financial covenant violations increases as the law becomes more favor-able to debtors. Financial covenants are accounting-based measures of perfor-mance with which the borrower must comply (for example, a financial covenant might require that the borrower’s debt be no more than a certain percentage of its assets). A borrower who violates a covenant must inform the lender; such vi-olations are considered technical default and provide lenders with contractual rights to make substantial changes to the loan agreement, including the right to demand immediate repayment. Prior literature has shown that creditors use the contractual rights granted by covenant violations to force the borrower to imple-ment a more conservative investment policy (Roberts and Sufi 2009; Nini, Smith, and Sufi 2012). To test whether there is an association between the legal regime and the repercussions of covenant violations, we test whether changes in firm in-vestment policy postviolation—measured as changes in net debt issuance, acqui-sitions, capital expenditures, and physical property postviolation (see, for exam-ple, Roberts and Sufi 2009; Nini, Smith, and Sufi 2012)—are uniform across legal regimes. Our analysis shows that when the contract is governed by pro-lender law, there are significantly fewer covenant violations but that the repercussions of those violations are significantly more severe.
Our findings should be interpreted with caution because parties to the contract are able to select their governing law and because state legislators can affect the governing law in each state. As a result, the associations reported in the paper are descriptions of an equilibrium sorting of borrowers and creditors. However, regardless of whether our results arise because of self-selection or because parties respond to differences in the law, they indicate that the contract law is an im-portant consideration in understanding the relationship between borrowers and lenders.
We contribute to the literature in several ways. First, as the first empirical paper to test differences in state contract law, we address the issue of how to measure contract law and provide a ranking of states based on the degree to which each state’s contract law is favorable or unfavorable to lenders. Second, we provide the first descriptive evidence that the variation in state contract law is associated with real differences in firm financing, investment policy, and contract terms. Third, our analysis provides initial evidence consistent with the legal theory that there is a market for contracts. We document that New York, the primary state for debt contracts and a state widely known for its efforts to attract commercial contracts, has increased its dominance since the mid-1990s. We note, however, that we can-not identify whether New York’s dominance has increased because of its more pro-lender laws.
The remainder of our paper proceeds as follows. Section 2 describes the rel-
evant legal framework and background literature. Section 3 describes our data.

1034 The Journal of LAW & ECONOMICS
Section 4 presents our main empirical findings. Section 5 presents our robustness tests. Section 6 concludes.
2. Legal Framework for Private Debt Contracts
2.1. Choice of Contract Law
Prior literature on U.S. law and debt contracts has studied the relationship be-tween the laws of the state in which the borrower is incorporated and the con-tract (Qi and Wald 2008; Mansi, Maxwell, and Wald 2009), but no prior work has considered the contract law itself.1 Although the state of incorporation and the state of contract can be the same, we find that this occurs less than 10 percent of the time. As a general rule, the internal affairs of a corporation, such as the rela-tionship between shareholders and management, are governed by the laws of the state in which the firm is incorporated. However, substantial commercial con-tracts such as debt contracts are considered to be part of the external affairs of a corporation and are governed by the state contract law chosen by the parties and noted in a choice-of-law clause in the contract. Therefore, it is the state contract law rather than the state corporate law that governs debt contracts.2 In this paper, we thus make the distinction between state corporate law and state contract law, and we study contract law specifically.3
Over the past few decades, there have been two significant developments in the legal framework surrounding choice-of-law clauses. First, courts have become more willing to enforce the parties’ choice of law. The general rule is that courts will enforce the parties’ choice of law only if that state has a nexus—or a rea-sonable relationship—to the contract. However, the required closeness for a rela-tionship to be deemed reasonable has been interpreted far more broadly over the past few decades (Eisenberg and Miller 2010).4 Second, many states have passed
1 Beginning with La Porta et al. (1998), the relation between law and debt contracting has also been studied in international settings. See, for example, Davydenko and Franks (2008), Cumming and Johan (2006), and Qian and Strahan (2007). Our U.S. setting controls for disadvantages that arise in international settings, such as different levels of economic development.
2 See, for example, Engel v. Ernst, 724 P.2d 215, 216 (Nev. 1986): “It is well settled that parties are permitted to select the law that will govern the validity and effect of their contract.” We focus here on the choice of law rather than the forum selection because of concerns regarding the enforceabil-ity of forum-selection clauses during our sample period. See, for example, Atlantic Marine Construc-tion Co. v. U.S. District Court for the Western District of Texas 571 U.S. ___ (2013), which resolves a circuit split in federal courts over how to enforce forum-selection clauses.
3 Although we focus on the contract law, we also estimate the models in Tables 7–10 controlling for the payout restrictions noted in Wald and Long (2007), Qi and Wald (2008), and Mansi, Max-well, and Wald (2009). All of our results remain consistent and significant at current levels. In ad-dition, because we expect private lenders who rely on corporate law to prohibit reincorporation without permission, we review all of our contracts to determine whether any of our lenders restrict reincorporation. We do not find any such clauses.
4 See, for example, Mechanic v. Princeton Ski Shop, Inc., 1992 U.S. Dist. LEXIS 19979 (S.D.N.Y. 1992), which finds that the parties’ decision to elect the law involved was a sufficient relationship. We caution that our description of enforcement of choice-of-law clauses is intended for commercial contracts between sophisticated parties. Courts can decline to enforce choice-of-law clauses when doing so would violate public policy, and courts face additional public policy considerations in other types of contractual disputes, such as labor disputes, so the outcome is less certain.

Debt Contracts 1035
statutes allowing their law to be used for commercial contracts exceeding a min-imum dollar value (usually $250,000) regardless of whether the contract has any connection to the state.5 Many states also have corresponding statutes allowing parties to litigate in their state courts providing that the contract exceeds a min-imum dollar value (usually $1 million) and that the parties have selected the law of that state.6 Consequently, parties to substantial commercial contracts can now feel confident that their choice of law will be enforced.
There are four important reasons why parties to debt contracts may prefer the law of one state over another. First, and possibly most important, the law regard-ing debt contracts is more developed in some states than in others, which thereby reduces uncertainty with regard to enforcement of the contract. Second, the law of a state may be appealing because of its court system and the procedural rules regarding litigation. As noted, parties who select the law of a particular state may be allowed to litigate there even if the contract otherwise bears no relationship to the state. New York in particular is known for developing a court system that is friendly to commercial parties—especially to lenders (Eisenberg and Miller 2010). Third, the parties may prefer the law of a state because its legislature is par-ticularly responsive.7 Finally, there are differences in the substantive law across states that will affect the lender’s ability to enforce the contract. Substantive law refers to the law that governs the rights and duties of each party, and it includes both common law created by judges and statutory law enacted by legislators. For lenders, the issues of substantive law that will be most important are the state laws relating to lender liability and to the enforceability of specific contract pro-visions.
Lender liability is not one particular claim but is instead a compilation of many different state and federal claims. When reviewing the cases of lender liability during our sample period, we found that the vast majority of claims were based on the state law that governs contracts and torts (civil acts that are recognized as wrong and for which a claim is available) rather than on federal law. In the typical claim, the borrower faced financial difficulty, and the lender responded by tak-ing an action for which he had a contractual right—such as seizing the collateral
5 See, for example, N.Y. Gen. Oblig. Law sec. 5-1401; Cal. Civ. Code sec. 1646.5 (West 2009); Fla. Stat. Ann. sec. 685.101 (West 2009); Del. Code Ann., tit. 6, sec. 2708 (2000); Ohio Rev. Code Ann. sec. 2307.39 (West 2009); and Tex. Bus. & Com. Code Ann. sec. 35.51 (Vernon 2009).
6 See, for example, N.Y. Gen. Oblig. Law sec. 5-1402; Cal. Civ Proc. sec. 410.40; Fla. Stat. Ann. secs. 685.101–.102 (West 2009); Del. Code. Ann., tit. 6 sec. 2708 (2000); Ohio Rev. Code Ann. sec. 2307.39 (West 2009); Tex. Bus. & Com. Code Ann. sec. 35.51 (Vernon 2009); Ill. Comp. Stat. Ann. 105/5-1 (West Supp. 1998). New York was the first state to enact the complementary statutes allow-ing for court access and ensuring that choice-of-law clauses will be enforced, and the state did so in 1984 after a recommendation from the New York Bar Association (NYBA). The NYBA’s recom-mendation was thought to be motivated by self-interest because it provides more work for attorneys licensed in New York.
7 For example, after the introduction of the euro, there was concern that contracts requiring pay-ment in currencies that had been replaced by the euro would become invalid. In response, financial institutions pressured states to enact legislation that would mitigate this potential issue. Some states responded more quickly than others, and New York and Illinois were the first to enact the necessary legislation in this instance (Freis 1998).

1036 The Journal of LAW & ECONOMICS
or demanding immediate repayment without prior notice—that the borrower argued was overly aggressive given the circumstances. The borrower’s business usually suffered extreme difficulty following the lender’s actions, and the bor-rower then sued the lender, claiming that the lender’s actions violated the duty of good faith that is implicit in every commercial contract. The court then decided whether the lender violated the duty of good faith by taking the action in ques-tion and, if so, to what extent the lender had damaged the borrower.8
Lenders will also be concerned with prior legal rulings on the enforceability of
specific contract provisions. Courts have the right to void contract clauses they
deem to be unconscionable or against public policy, and this has resulted in dif-
ferent states treating the same clause differently. For example, lenders may seek
to include a contractual waiver of the duty of good faith in order to avoid poten-
tial liability. While state courts generally decline to enforce these waivers, courts
applying Illinois law have enforced them (Silver 2013). For further detail on dif-
ferences in the substantive law across states, see the Appendix.
2.2. The Association between Contract Law and Debt Contracts
Our first research question relates to the market for contracts and asks whether
there are systematic differences in debt contracts across states. Legal literature has
documented that states actively compete for contracts and that the law of some
states is used more frequently in commercial contracts than others (Eisenberg
and Miller 2010). However, no prior study has examined the characteristics of
borrowers, lenders, and contract terms across states. If a market for contracts ex-
ists, we would expect the states that compete most stringently for debt contracts
not only to have a disproportionate number of contracts but also to have at-
tracted the most informed investors and the largest deals regardless of their geo-
graphic location. While we cannot identify whether more pro-lender laws attract
more deals, we should observe a positive association between pro-lender regimes
and the market share of contracts if such a market exists.
Our second research question asks whether the contract terms vary with the
law governing the contract. Because the state contract law governs the enforce-
ment of the contract and the parties to the contract select the state law, it is likely
that the terms of the contracts will also vary with the state contract law. Cash
collateral is thought to provide lenders with greater control rights in the event
of default (Baird and Rasmussen 2006), so we start by examining the correlation
between the state contract law and the use of cash collateral. We then examine
the relationship between state contract law and the yield spread, where the yield
8 The most well-known lender liability case is K.M.C. Co. v. Irving Trust Co., 757 F.2d 752 (6th Cir. 1985). In this case, the lender refused to provide additional funds that were available under the borrower’s line of credit because the lender believed that the borrower posed a credit risk. When the borrower ultimately went out of business and sued the lender for violating the duty of good faith, the jury awarded the borrower $7,500,000. The case was unusual in finding the lender liable for tak-ing an action that was expressly permitted by the contract terms, and it sparked a flurry of litigation against lenders that created uncertain precedent in many states.

Debt Contracts 1037
spread is defined as the total amount paid by the borrower in fees and interest
over the London Interbank Offered Rate.Our third research question asks whether the frequency of financial covenant
violations varies with the law governing the contract. Assuming that the fre-quency of violations is related to the tightness of the covenants, the association between the legal environment and covenant violations is not clear ex ante. On the one hand, lenders may compensate for pro-debtor law by demanding tighter covenants. On the other hand, lenders who are sufficiently comfortable with their borrowers to allow pro-debtor law may also allow loose covenants. In addition, if lenders are better able to enforce the contract under pro-lender law, there may be fewer covenant violations because the borrowers are more reluctant to violate.
Our final research question examines whether the repercussions of covenant
violations vary with the law governing the contract. We do not have a clear pre-
diction on the direction of the association. All else equal, lenders exert more in-
fluence on the borrower when they have more power. As explained above, lend-
ers will have more negotiating power when they are better able to enforce the
contract, and enforcement can vary because of procedural differences in state
courts or substantive differences in state law. The states that are favorable to lend-
ers have clear rules allowing lenders wide discretion when enforcing their con-
tract rights, whereas the states that are less favorable to lenders have conflicting
precedent that can be worrisome.
All else equal, laws that are more pro-lender should result in more severe re-
percussions postviolation. However, different types of borrowers and lenders
may select into different legal regimes, and their actions may vary correspond-
ingly. For example, borrowers who are willing to select pro-lender law may know
that they pose little risk to the lenders, in which case we would not expect to see
severe repercussions when these borrowers violate a covenant. On the other
hand, borrower- lender pairs that select into more pro-lender laws could do so be-
cause the lenders want the extra protection of knowing that they can enforce the
contract as written without liability, in which case we would expect more severe
repercussions when the borrowers violate a covenant. Hence, the relationship be-
tween state contract law and the role of lenders postviolation remains an open
empirical question.
3. Data
3.1. Data Set Overview
Our main data set is from Nini, Smith, and Sufi (2009), which the authors kindly provide online.9 This data set contains information for 3,720 private debt contracts (that is, bank loans) that the authors obtained from the Securities and Exchange Commission’s EDGAR database of registered public company filings
9 Amir Sufi, Data and Appendices (http://faculty.chicagobooth.edu/amir.sufi/data.html).

1038 The Journal of LAW & ECONOMICS
using a text-search program.10 The authors provide the number and type of cov-enants, an indicator variable noting whether the firm violated a covenant in the prior year, and the relevant information necessary to match their data set with existing commercial databases. The authors also provide the contracts.
We reviewed these contracts and examined the governing law for each one. Af-ter discarding 31 contracts for which no statement of governing law is available—most of which state that the contract is to be governed in accordance with the law noted in the prior agreement, which we do not have—we have 3,689 contracts. Similar to Eisenberg and Miller (2009), we find that New York law is favored for debt contracts (51 percent). The next three most heavily favored states are Illinois, Texas, and California (8 percent, 8 percent, and 7 percent, respectively).
In addition, although the merged data set contains an indicator variable noting whether the borrower violated a financial covenant in the prior year, it does not specify the covenant that was violated. Thus, we hand checked all the violations to determine whether the borrower violated a covenant associated with a prior ver-sion of a contract in our data set that was renegotiated or a covenant associated with a contract that is not in our data set. This step was necessary because compa-nies do not always use the same law for each contract, and we needed to associate the violation with the respective governing law. We found that only 94 of the initial 232 violations were associated with the contract in question.11 For the 94 violations, we reviewed the original contract whenever possible and found that the renegotiated contract was governed by different law than the original contract in only two instances.
In order to obtain data on financial performance, we then merged this data set with the Compustat North America Fundamentals Quarterly database main-tained by Standard & Poor’s (S&P). This database includes quarterly account-ing reports for all public companies and descriptive information such as the company’s state of incorporation. During this merge, we lost one observation. As described below, our proxies include only those 10 states with 1 percent or more of the total number of contracts, which results in a total of 3,322 observations (roughly 90 percent of the initial sample). We use this data set for our descriptive statistics and our analyses of the frequency of violations and the changes in firm activity postviolation.12
This data set contains far fewer contracts in 1996, but the rest of the years, from 1997 to 2005, are fairly consistent. The most striking time trend of our contracts is that New York’s predominance increased during our time period. While 46
percent of our contracts used New York law in 1996, 70 percent of our contracts
10 Securities and Exchange Commission regulations require registered public companies to dis-close material contracts as exhibits to registration statements and periodic reports (17 C.F.R. 229.601[b][10]). Substantial loan contracts are considered material and must be disclosed.
11 In a limited number of instances, we were unable to determine the covenant violated. These ob-servations were dropped from our sample.
12 Although the full sample includes 3,322 observations, there are fewer observations in most analyses because we omit the observations that are missing relevant information from either Com-pustat or the original Nini, Smith, and Sufi (2009) data set.

Debt Contracts 1039
used it in 2005. This increase in use is consistent with New York’s well-known attempts to court commercial contracts (Eisenberg and Miller 2009). Meanwhile, the percentage of contracts using law from all our other 10 states—with the ex-ception of North Carolina, which increased from 1.8 percent to 2.5 percent— decreased.
Finally, for our regressions on contract terms, we further merge this data set with the Dealscan database maintained by Thomson Reuters. This database con-tains detailed deal terms, such as the loan maturity and deal size, for private loans and other financing agreements. Many of the contracts offer multiple facilities, where each facility is a separate term loan or line of credit, so we treat each facil-ity as a unique observation. This approach is feasible because Dealscan reports the different loan characteristics for each facility. The descriptive statistics for the contract terms include all available information, but the regressions exclude those observations that are missing necessary contract control variables such as the deal size, yield spread, or lender. We also drop 271 observations that are miss-ing complete firm-specific information from Compustat and 124 observations missing the number of financial covenants from the initial Nini, Smith, and Sufi (2009) data set. The final data set includes a total of 4,157 facilities, of which 3,880 use law from our 10 states. We use this data set for our analysis of yield spreads and cash collateral. Throughout the paper, all continuous, nonlog variables are winsorized at the 1st and 99th percentiles.
3.2. Classification of Contract Law
The first metric we use to classify contract law is the Pro-Debtor Index, which is an index of six features of state law that relate to the lender’s ability to enforce the contract. Prior literature has used an index based on state law to rank corpo-rate law (see, for example, Bebchuk and Cohen 2003). The specific practices and standards, which are shown Table 1, are drawn from legal literature and reflect the state court system, the lender’s ability to enforce the contract as written, and the uncertainty relating to lender liability. Each state receives a ranking of 1–3 for each feature. While the practices and standards used here are by no means the only differences between the laws of each state, we focus on the features that are mentioned most frequently in the legal literature.
Our second ranking scheme is based on the perceived risk of litigation for each state. To classify the states into three legal regimes, we reviewed the Cappello (2009) lender liability treatise and catalogued the number of lawsuits brought against lenders under each state’s law during our sample period 1996–2005.13 Al-though there are multiple theories for why parties choose to litigate rather than
13 As part of this process, we removed those lawsuits that were brought under only federal law. Under federal law, claims can be brought against lenders under a number of statutes, such as the Comprehensive Environmental Response, Compensation, and Liability Act, the Racketeer Influ-enced and Corrupt Organizations Act, or the bankruptcy code. For example, if a bankruptcy court finds that a creditor has engaged in conduct that provides him with an unfair advantage or that injures other creditors, the doctrine of equitable subordination allows the court to subordinate that creditor’s claim to those of other creditors (11 U.S.C. sec. 510[c][2000]).

Tab
le 1
Fea
ture
s o
f S
tate
Law
Use
d t
o C
om
pu
te P
ro-D
ebto
r In
dex
Va
lues
CA
FL
GA
ILM
AN
YN
CO
HP
AT
X
Do
es t
he
stat
e al
low
fo
r th
e en
forc
emen
t o
f p
red
isp
ute
ju
ry t
rial
wai
vers
?3
13
11
13
11
1D
oes
th
e st
ate
hav
e sp
ecia
lize
d b
usi
nes
s co
urt
s?2
11
11
11
31
3D
oes
th
e st
ate
reco
gniz
e th
e to
rt o
f d
eep
enin
g in
solv
ency
?2
22
22
12
23
1T
o w
hat
ext
ent
do
es t
he
stat
e en
forc
e w
aive
rs o
f le
nd
er li
abil
ity?
22
12
11
12
13
Do
es t
he
stat
e h
ave
stat
ute
s al
low
ing
cho
ice
of
law
an
d f
oru
m f
or
com
mer
cial
co
ntr
acts
of
a m
inim
um
do
llar
val
ue?
11
31
31
31
31
To
wh
at e
xten
t is
a le
nd
er r
equ
ired
to
act
in
go
od
fai
th w
hen
tak
ing
dis
cret
ion
ary
acti
on
s?2
11
12
11
11
2
T
ota
l12
811
81
06
11
10
10
11
No
te.
Bec
ause
th
e st
ate
law
may
ch
ange
ove
r ti
me,
th
e ra
nk
ing
for
each
sta
te i
s d
eter
min
ed a
s o
f D
ecem
ber
31,
200
5. 1
= r
elat
ivel
y fa
vora
ble
to
len
der
s, 2
= u
nce
rtai
n a
nd
/or
mix
ed, 3
= u
nfa
vora
ble
to
len
der
s.

Debt Contracts 1041
settle, the predominant theory is that litigation is driven by uncertainty (Priest and Klein 1984).14 When both parties think they will prevail, they have less incen-tive to settle. As such, we expect that there will be more litigation against lenders in states with greater uncertainty.
We thus follow prior literature in estimating litigation risk using an ex post approach based on the number of lawsuits (for example, Li et al. 2012; Heninger 2001; Francis, Philbrick, and Schipper 1994), and we calculate perceived litiga-tion risk as the number of reported lawsuits per state divided by the number of contracts per state. Each state is then categorized as pro-lender, intermediate, or pro-debtor. The pro-lender states are the three states with the lowest frequency of litigation, the intermediate states are those four states in the middle of the distri-bution, and the pro-debtor states are the three states with the highest frequency of litigation.
Both classifications are limited to those states with 1 percent or more of the total number of contracts because of concerns that the inclusion of all U.S. states would bias the rankings. Many of the features in our Pro-Debtor Index are based on common law, so the law will be uncertain in the state if there is no prior prec-edent. As such, the inclusion of all U.S. states would introduce noise into our in-dex because many of the states that are rarely used for debt contracts have sparse relevant law and thus cannot be ranked with certainty. The inclusion of all U.S. states would bias our litigation risk measure as well. Since many states have fewer than five contracts, there would be small-denominator problems that would in-flate the litigation measure. Using only those states with 1 percent or more of the total number of contracts leaves us with 10 states that make up roughly 90 per-cent of the original sample.
Under both classifications, California and New York are at the two extremes: California represents the most pro-debtor state and New York the most pro-lender. These rankings are consistent with the view of practitioners. For example, New York is known for being so favorable to lenders that one law firm advises lenders to select New York law as one of four suggested tactics to avoid lender li-ability.15 Conversely, an article posted by an American Bankers Association jour-
14 In general, common law in most states was traditionally pro-lender but became more pro-debtor following the wave of lender liability litigation in the late 1980s and early 1990s. However, the pro-debtor rulings of this era did not necessarily overrule the prior law but instead created seem-ingly contradictory precedent that created uncertainty, especially for lenders. For example, while all states allow a lender to demand repayment after the borrower violates a covenant, there are states with conflicting precedent as to what sort of notice, if any, the lender needs to provide to the bor-rower before demanding repayment. As such, a lender in these states is more likely to open itself to litigation because there is no clear rule for it to follow. We thus expect borrowers in these uncertain states to be more likely to sue the lenders because they have precedent on which they can rely, even if it seems to contradict other precedent in the same state, and we expect lenders to be less likely to settle the litigation out of court because they too have precedent on which they can rely.
15 “Some states are more liberal than others on lender liability. New York is a state that takes a stricter approach to enforcing the terms of the loan documents and the exercise of lender rights. Other states may be more lenient, particularly if the borrower is a ‘home town favorite’ while the lender comes from outside of the jurisdiction. What can lenders do to use more favorable law to increase their chances of defeating lender liability suits? . . . Choice of law provisions in loan docu-ments—or in loan modification documents—can be the answer” (Epstein 2010, p. 27).
1042 The Journal of LAW & ECONOMICS
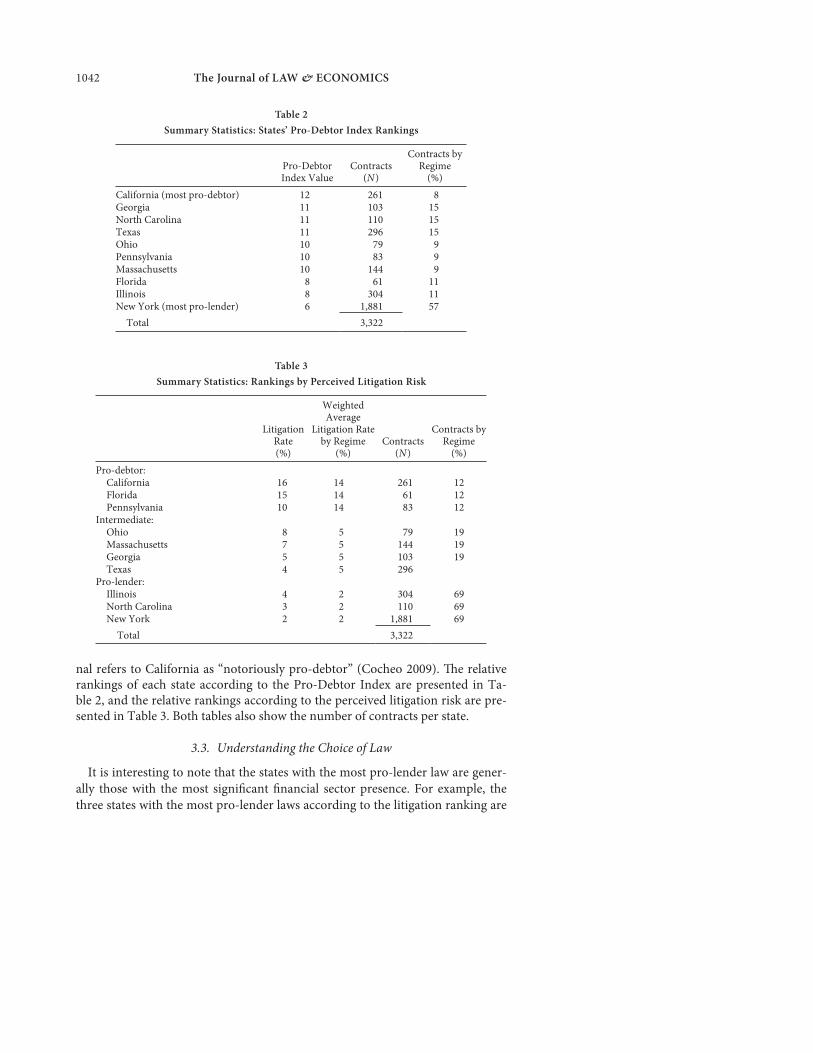
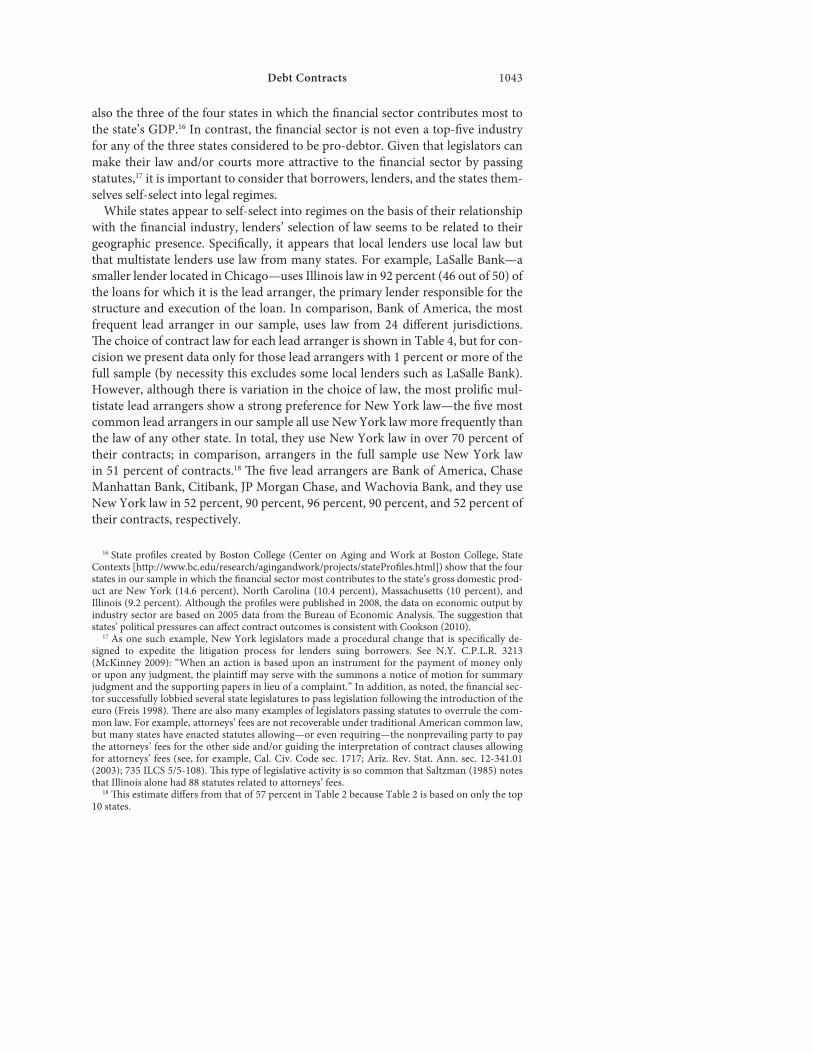
nal refers to California as “notoriously pro-debtor” (Cocheo 2009). The relative rankings of each state according to the Pro-Debtor Index are presented in Ta-ble 2, and the relative rankings according to the perceived litigation risk are pre-sented in Table 3. Both tables also show the number of contracts per state.
3.3. Understanding the Choice of Law
It is interesting to note that the states with the most pro-lender law are gener-
ally those with the most significant financial sector presence. For example, the
three states with the most pro-lender laws according to the litigation ranking are
Table 2
Summary Statistics: States’ Pro-Debtor Index Rankings
Pro-Debtor Index Value
Contracts (N )
Contracts by Regime
(%)
California (most pro-debtor) 12 261 8Georgia 11 103 15North Carolina 11 110 15Texas 11 296 15Ohio 10 79 9Pennsylvania 10 83 9Massachusetts 10 144 9Florida 8 61 11Illinois 8 304 11New York (most pro-lender) 6 1,881 57
Total 3,322
Table 3
Summary Statistics: Rankings by Perceived Litigation Risk
Litigation Rate (%)
Weighted Average
Litigation Rate by Regime
(%)Contracts
(N )
Contracts by Regime
(%)
Pro-debtor: California 16 14 261 12 Florida 15 14 61 12 Pennsylvania 10 14 83 12Intermediate: Ohio 8 5 79 19 Massachusetts 7 5 144 19 Georgia 5 5 103 19 Texas 4 5 296Pro-lender: Illinois 4 2 304 69 North Carolina 3 2 110 69 New York 2 2 1,881 69
Total 3,322
Debt Contracts 1043
also the three of the four states in which the financial sector contributes most to
the state’s GDP.16 In contrast, the financial sector is not even a top-five industry
for any of the three states considered to be pro-debtor. Given that legislators can
make their law and/or courts more attractive to the financial sector by passing
statutes,17 it is important to consider that borrowers, lenders, and the states them-
selves self-select into legal regimes.
While states appear to self-select into regimes on the basis of their relationship
with the financial industry, lenders’ selection of law seems to be related to their
geographic presence. Specifically, it appears that local lenders use local law but
that multistate lenders use law from many states. For example, LaSalle Bank—a
smaller lender located in Chicago—uses Illinois law in 92 percent (46 out of 50) of
the loans for which it is the lead arranger, the primary lender responsible for the
structure and execution of the loan. In comparison, Bank of America, the most
frequent lead arranger in our sample, uses law from 24 different jurisdictions.
The choice of contract law for each lead arranger is shown in Table 4, but for con-
cision we present data only for those lead arrangers with 1 percent or more of the
full sample (by necessity this excludes some local lenders such as LaSalle Bank).
However, although there is variation in the choice of law, the most prolific mul-
tistate lead arrangers show a strong preference for New York law—the five most
common lead arrangers in our sample all use New York law more frequently than
the law of any other state. In total, they use New York law in over 70 percent of
their contracts; in comparison, arrangers in the full sample use New York law
in 51 percent of contracts.18 The five lead arrangers are Bank of America, Chase
Manhattan Bank, Citibank, JP Morgan Chase, and Wachovia Bank, and they use
New York law in 52 percent, 90 percent, 96 percent, 90 percent, and 52 percent of
their contracts, respectively.
16 State profiles created by Boston College (Center on Aging and Work at Boston College, State Contexts [http://www.bc.edu/research/agingandwork/projects/stateProfiles.html]) show that the four states in our sample in which the financial sector most contributes to the state’s gross domestic prod-uct are New York (14.6 percent), North Carolina (10.4 percent), Massachusetts (10 percent), and Illinois (9.2 percent). Although the profiles were published in 2008, the data on economic output by industry sector are based on 2005 data from the Bureau of Economic Analysis. The suggestion that states’ political pressures can affect contract outcomes is consistent with Cookson (2010).
17 As one such example, New York legislators made a procedural change that is specifically de-signed to expedite the litigation process for lenders suing borrowers. See N.Y. C.P.L.R. 3213 ( McKinney 2009): “When an action is based upon an instrument for the payment of money only or upon any judgment, the plaintiff may serve with the summons a notice of motion for summary judgment and the supporting papers in lieu of a complaint.” In addition, as noted, the financial sec-tor successfully lobbied several state legislatures to pass legislation following the introduction of the euro (Freis 1998). There are also many examples of legislators passing statutes to overrule the com-mon law. For example, attorneys’ fees are not recoverable under traditional American common law, but many states have enacted statutes allowing—or even requiring—the nonprevailing party to pay the attorneys’ fees for the other side and/or guiding the interpretation of contract clauses allowing for attorneys’ fees (see, for example, Cal. Civ. Code sec. 1717; Ariz. Rev. Stat. Ann. sec. 12-341.01 (2003); 735 ILCS 5/5-108). This type of legislative activity is so common that Saltzman (1985) notes that Illinois alone had 88 statutes related to attorneys’ fees.
18 This estimate differs from that of 57 percent in Table 2 because Table 2 is based on only the top 10 states.

Tab
le 4
Ch
oic
e o
f C
on
tra
ct L
aw b
y L
ead
Arr
ang
er
Pri
nci
pal
Pla
ce
of
Bu
sin
ess
Stat
e o
f In
corp
ora
tio
n
Lo
ans
Usi
ng
the
Co
ntr
act
Law
fro
m E
ach
Sta
te
Lea
d A
rran
ger
CA
FL
GA
ILM
AN
YN
CO
HP
AT
XO
ther
To
tal
Ban
k O
ne
Co
rp.
ILD
E4
424
65
81
21
10
13
7B
ank
of
Am
eric
aN
CD
E11
114
2698
12
49
73
92
92
74
96
5B
ank
of
New
Yo
rkN
YN
Y2
70
27
4B
ank
ers
Tru
st C
o.
NY
NY
11
64
16
7C
IBC
On
tari
oO
nta
rio
45
42
60
Ch
ase
Man
hat
tan
Ban
kN
YN
Y1
36
63
16
40
7C
itib
ank
NY
DE
11
24
24
91
12
59
Cre
dit
Su
isse
Fir
st B
ost
on
NY
DE
98
41
02
Fir
st U
nio
n N
atio
nal
Ban
kN
CN
C9
51
19
23
61
22
86
Fle
et N
atio
nal
Ban
kM
AM
A2
60
54
22
17
13
7G
ener
al E
lect
ric
Cap
ital
Co
rp.
CT
DE
44
75
42
89
JP M
org
anN
YD
E5
10
81
11
11
26
JP M
org
an C
has
eN
YD
E1
151
38
33
11
37
42
4L
ehm
an C
om
mer
cial
Pap
er, I
nc.
NY
NY
16
46
5M
org
an G
uar
anty
Tru
stN
YN
Y6
91
37
3N
atio
nsB
ank
NC
NC
317
101
45
20
22
42
11
43
PN
C B
ank
PA
PA
36
18
39
31
87
8Su
nT
rust
Ban
kG
AG
A6
263
56
47
7W
ach
ovi
a B
ank
NC
NC
15
394
11
11
32
24
87
21
4W
ells
Far
go B
ank
CA
SD28
22
81
12
14
85
No
te.
Lea
d a
rran
gers
wit
h 1
% o
r m
ore
of
the
tota
l sa
mp
le w
ith
ava
ilab
le d
ata
are
incl
ud
ed.
Bec
ause
nat
ion
al b
ank
s h
ave
no
sta
te o
f in
corp
ora
tio
n,
the
stat
e d
esig
nat
ed i
n a
n
atio
nal
ban
k’s
org
aniz
atio
n c
erti
fica
te i
s li
sted
. Th
e ar
ran
ger’
s lo
cati
on
is
det
erm
ined
as
of
its
fin
al d
ay o
f ex
iste
nce
or
Dec
emb
er 3
1, 2
005.
CIB
C =
Can
adia
n I
mp
eria
l B
ank
of
Co
mm
erce
.

Debt Contracts 1045
Given that the majority of borrower-lender pairs in our sample select New York law, we look at the pairs that select California law to understand what fac-tors influenced those pairs to pick law at the opposite end of the spectrum. We find that geography plays the most important role—66 percent of the borrowers consider California to be their primary place of business, and roughly 85 percent of the borrowers are based on the West Coast. In comparison, the contract law is the same as the borrower’s primary place of business in roughly 35 percent of the contracts for the full sample. Many of the lead arrangers have a geographic connection as well—38 percent of them consider California to be their primary place of business, and 39 percent are located on the West Coast. For the full sam-ple, the contract law is the same as the lead arranger’s primary place of business in roughly 32 percent of the contracts. We then reviewed the contracts for the borrower-lender pairs that did not have an obvious geographic connection to the West Coast, and we found that in many instances one or more lenders had an of-fice in California and/or the contract was signed in California.
3.4. Descriptive Statistics
Given that the selection of contract law is an active decision, we examine whether there are significant differences in contract and borrower characteristics across regimes. For brevity and to better show trends across legal regimes, we present our descriptive statistics on contracts and borrowers using only the clas-sification based on perceived litigation risk because this classification contains fewer groupings.
Table 5 provides descriptive statistics for contract characteristics across legal regimes and shows that many of the characteristics increase or decrease mono-tonically. For example, as we move from pro-debtor to pro-lender law, the num-ber of lenders, the loan maturity, and the deal size consistently increase across each regime. However, while loans using pro-lender law have fewer covenants and are less likely to be secured, these differences are not monotonic.19 Overall, Table 5 shows that the larger deals with more players select into pro-lender law. The self-selection observed here is consistent with the legal argument that there is a market for contracts and that states such as New York have succeeded in at-tracting the biggest deals.
Table 6 shows average borrower characteristics across legal regimes. As we move from pro-debtor to pro-lender law, we find that borrowers’ debt-to-asset
ratios, capital expenditures, and acquisitions increase, while their current ratios (a liquidity measure defined as current assets divided by current liabilities) de-crease. However, not all borrower characteristics increase or decrease monotoni-cally. For example, while the borrowers using pro-lender law are larger, the mean asset value is smallest for borrowers using intermediate law.
19 A limited number of borrowers in our data set have multiple contracts and use law from more than one state. We examine the contract characteristics of this limited data set in an untabulated analysis. While the results are qualitatively similar, statistical significance remains only for deal size and maturity.

1046
Tab
le 5
Un
ivar
iate
Tes
ts C
om
par
ing
Co
ntr
act
Ch
ara
cter
isti
cs a
cro
ss L
ega
l R
egim
es
Reg
ime
1: P
ro-L
end
erR
egim
e 2:
In
term
edia
teR
egim
e 3:
Pro
-Deb
tor
Fu
ll S
amp
leR
egim
e 1
— R
egim
e 3
NM
ean
Med
ian
NM
ean
Med
ian
NM
ean
Med
ian
NM
ean
Med
ian
t-V
alu
ez-
Val
ue
Dea
l Siz
e ($
mil
lio
ns)
2,97
434
818
567
813
470
442
132
50
4,0
94
28
91
50
9.4
4**
15
.36
**Y
ield
Sp
read
2,94
918
216
367
418
617
543
518
81
55
4,0
58
18
41
75
–.9
2-1
.11
Nu
mb
er o
f L
end
ers
2,09
211
.91
958
25.
794
379
5.17
33
,05
39
.90
71
1.4
5**
14
.44
**M
atu
rity
(m
on
ths)
2,94
648
.38
6066
641
.22
3643
139
.48
36
4,0
43
46
.25
48
7.6
0**
7.8
9**
Nu
mb
er o
f C
ove
nan
ts2,
869
2.62
367
02.
863
419
2.80
33
,95
82
.68
32
.77
**–
3.3
7**
Secu
riti
zed
2,55
9.6
71
555
.76
136
1.6
91
3,4
75
.69
1–
.46
–.4
6C
ash
Co
llat
eral
2,97
4.0
260
678
.029
044
2.0
290
4,0
94
.02
70
–.3
9–
.39
Co
ven
ant
Vio
lati
on
2,26
2.0
240
621
.034
040
5.0
350
3,2
88
.02
70
–1
.27
–1
.27
So
urc
e.
Val
ues
fo
r D
eal S
ize,
Yie
ld S
pre
ad, N
um
ber
of
Len
der
s, M
atu
rity
, Sec
uri
tize
d, a
nd
Cas
h C
oll
ater
al a
re f
rom
Dea
lsca
n; N
um
ber
of
Co
ven
ants
is f
rom
Am
ir S
ufi
, Dat
a an
d
Ap
pen
dic
es (
htt
p:/
/fac
ult
y.ch
icag
ob
oo
th.e
du
/am
ir.s
ufi
/dat
a.h
tml)
.N
ote
. Y
ield
Sp
read
is
bas
is p
oin
ts o
ver
the
Lo
nd
on
In
terb
ank
Off
ered
Rat
e. C
ove
nan
t V
iola
tio
n r
efer
s to
wh
eth
er t
he
bo
rro
wer
vio
late
d a
co
ven
ant
asso
ciat
ed w
ith
a c
on
trac
t in
th
e d
ata
set
du
rin
g th
e p
rio
r ye
ar.
The
stat
isti
cal
sign
ifica
nce
rep
rese
nti
ng
the
diff
eren
ce b
etw
een
th
e m
ean
an
d m
edia
n v
alu
es o
f re
gim
es 1
an
d 3
is
sho
wn
in
th
e fi
nal
tw
o
colu
mn
s.**
p <
.01.

1047
Tab
le 6
Un
ivar
iate
Tes
ts C
om
par
ing
Bo
rro
wer
Ch
ara
cter
isti
cs a
cro
ss L
ega
l R
egim
es
Reg
ime
1: P
ro-L
end
erR
egim
e 2:
In
term
edia
teR
egim
e 3:
Pro
-Deb
tor
Fu
ll S
amp
leR
egim
e 1
— R
egim
e 3
NM
ean
Med
ian
NM
ean
Med
ian
NM
ean
Med
ian
NM
ean
Med
ian
t-V
alu
ez-
Val
ue
To
tal A
sset
s ($
mil
lio
ns)
2,32
41,
709
1,16
963
670
133
841
379
63
14
3,3
73
1,4
07
76
61
2.3
5**
13
.70
**P
rop
erty
, Pla
nt,
an
d
Eq
uip
men
t ($
mil
lio
ns)
2,3
1644
432
363
623
310
941
220
06
63
,36
43
74
21
11
2.7
4**
13
.88
**C
apit
al E
xpen
dit
ure
s ($
mil
lio
ns)
2,2
6412
.03
4.92
609
7.82
3.59
405
7.43
3.0
63
,27
81
0.6
84
.22
4.9
9**
3.1
6**
Cu
rren
t R
atio
2,2
771.
911.
4962
62.
041.
6840
22.
211
.82
3,3
05
1.9
71
.49
–1
.50
–6
.12
**M
ark
et-t
o-B
oo
k2,
026
2.32
1.89
577
2.10
1.67
368
2.55
1.8
52
,97
12
.30
1.8
4–
.68
–.7
7L
ever
age
2,28
2.2
93.2
5862
1.2
55.2
3539
8.2
12.1
98
3,3
01
.27
6.2
58
7.7
2**
8.7
6**
Acq
uis
itio
ns/
Ass
ets t−
12,
156
.138
.004
959
8.1
13.0
006
389
.078
03
,14
3.1
26
.00
43
.32
**3
.34
**
Net
Wo
rth
/Ass
ets
2,2
87.6
13.4
7362
7.5
27.5
0140
8.5
57.5
30
3,3
22
.59
0.4
87
1.7
3+–
2.9
2**
Op
erat
ing
Cas
h F
low
/A
vera
ge A
sset
s2,
223
.035
.034
603
.039
.034
399
.033
.02
83
,22
5.0
36
.03
4.5
65
1.3
63
Inte
rest
Exp
ense
/ A
vera
ge A
sset
s2,
101
.006
.006
547
.005
.004
323
.005
.00
42
,97
1.0
06
.00
62
.42
*4
.12
**
No
te.
All
var
iab
les
are
fro
m C
om
pu
stat
an
d r
eflec
t th
e m
ost
rec
ent
fin
anci
al d
ata
that
wer
e p
ub
licl
y av
aila
ble
at
the
tim
e o
f th
e co
ntr
act.
Val
ues
are
rat
ios
un
less
in
dic
ated
o
ther
wis
e. Th
e st
atis
tica
l sig
nifi
can
ce r
epre
sen
tin
g th
e d
iffer
ence
bet
wee
n t
he
mea
n a
nd
med
ian
val
ues
of
regi
mes
1 a
nd
3 i
s sh
ow
n i
n t
he
fin
al t
wo
co
lum
ns.
+ p
< .1
0.
* p
< .0
5.
** p
< .0
1.

1048 The Journal of LAW & ECONOMICS
Given the previously noted importance of geography in selecting contract law,
we conducted additional untabulated analysis on borrowers who use the law of a
state other than their primary place of business. First, we estimated the descrip-
tive statistics in Tables 5 and 6 using only out-of-state borrowers and found that
the trends generally remain consistent or become stronger. Most noteworthy, the
mean yield spread across regimes, which is monotonic but not significant in our
initial analysis, becomes significant at 5 percent (t = –2.51). This suggests that any
differences in yield spreads are largely due to those borrowers who use out-of-
state law. Second, we compared the frequency of out-of-state borrowers by re-
gime. We found that the percentage of out-of-state borrowers increases mono-
tonically from an average of 33 percent in the states considered pro-debtor to
85 percent in the states considered pro-lender. In addition, the three states con-
sidered pro-lender according to our proxy based on litigation risk are also the
three with the highest percentage of out-of-state borrowers—87 percent, 76 per-
cent, and 80 percent of the borrowers in New York, Illinois, and North Carolina
are from out of state, respectively. Prior literature on corporate law measures the
competitiveness of each state’s law by that state’s ability to attract out-of-state
firms (for example, Barzuza and Smith 2013), so our analysis suggests that the
pro-lender states have more attractive law.
Overall, the data show that borrower-lender pairs have a general preference for
pro-lender law but that geography plays a large role in the selection of contract
law. The role of geography is particularly relevant for local lenders and borrow-
ers, which suggests that there are costs to using out-of-state law that are more
substantial for smaller parties with more limited geographic reach. For example,
a local borrower or lender may incur costs to become familiar with out-of-state
law and to find attorneys licensed to write such contracts. Borrowers and lenders
with greater geographic reach would presumably already be familiar with out-of-
state law and would have relationships with out-of-state attorneys. In addition,
some of the benefits of out-of-state law will be less attractive to local parties. Most
notably, a local borrower or lender would benefit less from access to the courts of
another state because it would incur additional travel expenses to litigate in that
state. While it could still benefit from the out-of-state law by having its local court
apply this law, there is a greater risk that the local court will be unfamiliar with
the foreign law and misinterpret it. In contrast, parties with greater geographic
reach would be less hampered by geography and would be able to enjoy the bene-
fits of out-of-state law at a lower cost.
4. Method and Empirical Results
4.1. Contract Terms
Because the state contract law governs the enforcement of the contract and the
parties to the contract select the state law, it is likely that the terms of the contract
will also vary with the state contract law. We examine two contract terms: the use
of cash collateral and the yield spread.

Debt Contracts 1049
We begin by examining the correlation between the state contract law and the use of cash collateral, and we find that contracts in states that are more pro-debtor are more likely to use cash collateral. We follow Ivashina (2009) and use borrower-, contract-, and lender-specific controls for both the use of cash collat-eral and the yield-spread regressions. The borrower-specific controls are whether the borrower’s short-term, subordinated, or long-term debt is rated by S&P, the natural logarithms of sales and assets in the quarter prior to loan origination, and the borrower’s leverage ratio and return on assets. The contract-specific con-trols are the natural logarithm of the dollar amount, the number of loans or lines of credit associated with the contract, whether the loan is secured, the number of financial covenants, whether the base rate is the prime rate, and whether the loan spread will be adjusted to reflect the borrower’s subsequent financial perfor-mance. The lender-specific controls include controls for both the lead arranger and the reputation of the whole group, or syndicate, of lenders. The controls for the lead arranger are whether the lead arranger has arranged other loans for the borrower in the previous 3 years, the lead arranger’s market share, the share of the loan retained by the lead arranger, and the lead arranger’s lending limit, which is defined as the 75th percentile of the dollar value of loans issued by the lead ar-ranger over the past 3 years. The reputation of the syndicate is measured by the frequency with which the lead arranger works with members of the syndicate and by whether the lead arranger and members of the syndicate have switched roles in the past 3 years.20 Finally, all models control for the probability of loss in the borrower’s two-digit Standard Industrial Classification (SIC) industry (as deter-
20 The control for whether the loan is secured is not included in the probit regressions that esti-mate the use of cash collateral. In addition, the variables for whether the loan is secured and for the percentage of the loan retained by the lead arranger are sparsely populated. Rather than include only the populated variables, which would decrease our sample from over 3,000 observations to fewer than 1,000 observations, we add a dummy variable that indicates whether the variable is available and interact the availability with the original variable. Finally, we note that the sources for our con-trol variables may differ slightly from those in Ivashina (2009).
Table 7
Cash Collateral and Legal Regime
Pro-Debtor Index Litigation Risk
Legal Regime .329**(.097)
.833*(.349)
Note. Values are the results from estimating the following probit model: Cash Collateral = α + β
1Legal Regime + Controls + Fixed
Effects. The dependent variable is a dummy variable set equal to one if the borrower employs cash collateral and zero otherwise. Higher values of the Legal Regime variables reflect more pro-debtor law. All models include borrower-, contract-, and lender-specific controls and fixed effects for the loan purpose, bank, industry, borrower’s long-term issuer credit rating, and fiscal quarter-year. All models also control for the probability of loss in the borrower’s industry. Standard errors, in parentheses, are clustered by firm and year. N = 510. * p < .05. ** p < .01.

1050 The Journal of LAW & ECONOMICS
mined by S&P) and include fixed effects for the quarter-year, bank, loan purpose, and the borrower’s industry (based on the borrower’s four-digit SIC code) and long-term issuer credit rating. The standard errors are clustered by firm and year.
Our results, presented in Table 7, confirm the suggestion in our univariate sta-tistics that cash collateral is used most frequently when contracts are governed by pro-debtor law.21 Although the differences across regimes are not statistically significant in Table 5, we note that the difference in significance for the probit regressions appears to be driven by the inclusion of quarter-year and industry fixed effects and that the results are only marginally affected by the inclusion of all other control variables. To ease interpretation and help assess the economic magnitude of the reported coefficients, we compute the marginal probability ef-fects of our variables of interest and provide the results here. The calculations indicate that a 1-unit increase in the Pro-Debtor Index, which ranges from 6 to 12, increases the probability that cash collateral will be used by 4.32 percent. For the litigation ranking, which ranges from 1 to 3, a 1-unit increase in the legal re-gime increases the probability that cash collateral will be used by 11.10 percent. It is interesting to note that cash collateral, which represents stronger protection for lenders, is used more frequently when the contract law is favorable to debtors.
Next we examine the association between the state contract law and the yield spread on the loan. We initially analyzed this relationship for the full sample and did not find a significant association. However, given the importance of geogra-phy in the selection of contract law, we expect that the association between con-tract law and yield spread may be stronger for those out-of-state borrowers who select the law of another state. For example, California law may not be priced for a local borrower-lender pair, but it may be priced for an out-of-state borrower who negotiates to use pro-debtor law. Indeed, untabulated univariate statistics using only out-of-state borrowers support this argument by showing that the yield spread increases monotonically as the law becomes more pro-debtor and that the difference between yield spreads for contracts using pro-lender and pro-debtor law is significant at 5 percent. As such, we conduct the analysis using out-of-state borrowers. The findings indicate that out-of-state borrowers are subject to higher yield spreads and that this result is driven by those out-of-state borrow-ers who use pro-debtor law.
Table 8 presents our findings. As shown in column 1, the coefficient on Out-of-State Borrower suggests that out-of-state borrowers pay an average of 7.26 ba-sis points more than in-state borrowers (t = 2.20).22 In comparison, untabulated univariate statistics show that out-of-state borrowers pay an average of 7.32 basis
21 Our probit regressions do not converge with the inclusion of both fiscal and calendar quarter- year fixed effects, so they are presented with fiscal quarter-year effects only. We also note that our finding that cash collateral is more likely to be used in pro-debtor regimes becomes stronger after article 9 of the Revised Uniform Commercial Code went into effect.
22 In an untabulated analysis, we follow Ivashina (2009) and included only the largest facility in terms of deal size for each package. This affects only Tables 7 and 8 because the other tables do not include Dealscan data. All of our results in Table 8 and for the Pro-Debtor Index in Table 7 remain consistent, but the statistical significance of the findings for litigation risk in Table 7 decreases in magnitude, and the z-statistic is reduced to 1.54 (p > .15).

Debt Contracts 1051
points more than in-state borrowers (significant at 10 percent). We also estimate the regression in column 1 of Table 8 using only fixed effects, and the resulting coefficient, 7.95, remains fairly consistent (significant at 10 percent). Overall, the magnitude of the reported coefficient for the full sample is fairly consistent, and increasing the number of controls, particularly contract controls such as deal size and collateral, generally increases the statistical significance.
We next test whether all out-of-state borrowers pay higher yield spreads or whether this finding is driven by borrowers who select into a particular regime. To do this, we run additional regressions on subsets of legal regimes so that we can compare the magnitude and significance of the coefficients for those borrow-ers who opt into pro-debtor or pro-lender regimes with the coefficient for the full sample. In columns 2 and 4, we analyze only those borrowers who opt into inter-mediate and/or pro-lender law. For these subsets, Out-of-State Borrower is no longer statistically significant. In columns 3 and 5, we analyze only those borrow-ers who opt into intermediate and/or pro-debtor law. For these subsets, Out-of-State Borrower increases in both statistical significance and economic magnitude. The out-of-state borrowers who opt into intermediate and/or pro-debtor law pay an additional 14.42–19.92 basis points (significant at 1 percent). To summarize, analysis of the subsets suggests that the higher yield spreads for out-of-state bor-rowers are driven by those who opt into favorable law.23 This finding is consistent
23 Because clustered standard errors may be too small—particularly when the number of clusters is small (Cheah 2009)—we estimate maximum likelihood multilevel models. Our findings in Table 8 remain consistent, and our findings in Table 10 are very similar (although the statistical signif-icance is reduced in some estimations). Although we also estimate multilevel models for Tables 7 and 9, these estimations do not converge. Prior literature notes that issues with convergence are a disadvantage associated with multilevel models (for example, Primo, Jacobsmeier, and Milyo 2007; Dedrick et al. 2009).
Table 8
All-in-Drawn Yield Spread and Legal Regime
Pro-Debtor Index Litigation Risk
FullSample
(1)
ExcludesPro-Debtor
(2)
ExcludesPro-Lender
(3)
ExcludesPro-Debtor
(4)
ExcludesPro-Lender
(5)
Out-of-State Borrower 7.26*(3.30)
4.71(3.13)
14.42**(4.22)
1.40(3.59)
19.92**(7.54)
N 3,880 3,625 1,528 3,478 1,058R2 .75 .76 .80 .77 .81
Note. Results are from estimating Yield Spread = α + β1Out-of-State Borrower + Controls + Fixed Effects.
The dependent variable is the all-in-drawn yield spread over London Interbank Offered Rate: it is defined in basis points and includes all fees and interest assuming that the borrower has drawn the full dollar value available under the loan. Out-of-State Borrower is a dummy variable set equal to one if the borrower uses law from a state other than its principal place of business and zero otherwise. Higher values reflect more pro-debtor law. All models include borrower-, contract-, and lender-specific controls and fixed effects for the loan purpose, bank, industry, borrower’s long-term issuer credit rating, and fiscal and calendar quarter-year. All models also control for the probability of loss in the borrower’s industry. Standard errors, in parentheses, are clustered by firm and year. * p < .05. ** p < .01.

1052 The Journal of LAW & ECONOMICS
with out-of-state borrowers who opt into pro-debtor law paying for the privilege of that law.24
4.2. Frequency of Violations
We next examine the frequency of covenant violations across legal regimes
and find that the frequency is highest when contracts are governed by pro-debtor
law. In our first model, we follow Nini, Smith, and Sufi (2012) and control for
the measures of operating performance that are most likely to be used in cove-
nants. These variables were presented in Table 4 and include the following: op-
erating cash flow scaled by lagged assets, interest expense scaled by lagged assets,
the leverage ratio (total debt divided by assets), the current ratio, the net worth
ratio (shareholders’ equity divided by assets), and the market-to-book ratio. Al-
though the market-to-book ratio is not as frequently used in financial covenants,
we follow Nini, Smith, and Sufi (2012) and control for it because it predicts many
future outcomes such as earnings and bankruptcy. We also include the 4- quarter
lag of each control variable and higher-order covenant controls (the second and
third power of each covenant control variable) and drop all observations for
which any of the current or lagged control variables are not available in the Com-
pustat Fundamentals Quarterly database. In our second model, we also control
for the number of covenants and the interaction between the legal regime and
the number of covenants. Both specifications are probit models in which the de-
pendent variable is a dummy that indicates whether a covenant associated with
that particular contract was violated in the prior year.25 Our models include fiscal
quarter-year and industry fixed effects, as measured by four-digit SIC codes, and
the standard errors are clustered by firm and year.
Our results, presented in Table 9, show that the frequency of covenant violations
differs significantly across regions; borrowers violate the least when contracts are
governed by pro-lender law. Before controlling for the number of covenants, the
coefficients on the violation dummies are .320 (z = 9.56) and .888 (z = 6.06) for
states ranked by the Pro-Debtor Index and perceived litgation risk, respectively.
We compute the marginal probability effects of these coefficients, and the results
are economically meaningful. Our calculations suggest that a 1-unit change in the
Pro-Debtor Index, which ranges from 6 to 12, increases the probability of violation
by 3.30 percent, and a 1-unit change in the litigation ranking, which ranges from 1
to 3, increases the probability of violation by 9.27 percent. After controlling for the
number of covenants, the coefficients increase to .439 (z = 2.49) and 1.652 (z = 2.57)
for the Pro-Debtor Index and perceived litgation risk, respectively. The marginal
24 In untabulated analyses, we test whether the nonlinearity found in Table 8 affects any of our other results. In particular, we partition the full-sample results in Tables 7, 9, and 10 both by sub-samples of legal regimes and by in-state and out-of-state borrowers. We do not find that the nonlin-earity found in Table 8 applies to any of the other analyses.
25 We are grateful to Mitchell A. Petersen for his cluster2.ado program (http://www.kellogg .northwestern.edu/faculty/petersen/htm/papers/se/cluster2.ado).

Debt Contracts 1053
effects of the legal regime also increase. A 1-unit change in the Pro-Debtor Index
increases the probability of violation by 4.25 percent, and a 1-unit change in the
litigation ranking increases the probability of violation by 16.4 percent. Although
this is smaller in magnitude than the univariate statistics presented in Table 5,
in which the frequency of violation under pro-debtor law is roughly 45 percent
greater than under pro-lender law, we note that our univariate statistics are signif-
icant only at 20 percent. The probit estimation is sensitive to the inclusion of fixed
effects, which reduce the magnitude but increase the statistical significance, but it
is not sensitive to the inclusion of all other control variables. Overall, these results
indicate that borrowers are significantly more likely to violate covenants as the
law governing the contract becomes more favorable to debtors.
4.3. Firm Activity Postviolation
To better understand the ways in which lenders influence firm policy, we also
measure changes in firm activity postviolation. We look at changes in property,
plant, and equipment; net debt issuance; capital expenditures; and acquisitions
postviolation (Nini, Smith, and Sufi 2012; Cohen, Katz, and Sadka 2014). Our
results confirm the findings in the prior literature that show that firm investment
decreases following covenant violations, but our results show that the decrease is
related to the governing law: when the violation occurred under pro-lender law,
the decrease is far greater than when it occurred under pro-debtor law.Following Nini, Smith, and Sufi (2012), we measure the change in investment
as the difference between the activity level in the quarter in which the violation
Table 9
Frequency of Covenant Violations and Legal Regime
Pro-Debtor Index Litigation Risk
(1) (2) (1) (2)
Legal Regime .323**(.034)
.439*(.176)
.888**(.147)
1.652**(.642)
Number of Covenants .288(.634)
.493(.480)
Legal Regime × Number of Covenants –.015(.067)
–.213(.246)
N 482 432 482 432
Note. Results are from estimating the following probit model: Violation = α + β1Legal Regime + β
2NumCov
+ β3Legal Regime × NumCov + Controls + Fixed Effects. The dependent variable is a dummy variable set
equal to one if the firm violated a covenant associated with a contract in the data set in the prior year and zero otherwise. Higher values of the Legal Regime variables reflect more pro-debtor law. All models include the six covenant controls (operating cash flow scaled by lagged assets, interest expense scaled by lagged assets, the leverage ratio, the current ratio, the net worth ratio, and the market-to-book ratio) and fixed effects for industry and fiscal quarter-year. All models also control for the 1-year lag of each covenant control and the higher-order covenant controls. Standard errors, in parentheses, are clustered by firm and year. * p < .05. ** p < .01.

1054 The Journal of LAW & ECONOMICS
occurred and the quarter 1 year after the violation.26 We also follow the defini-tions used by Nini, Smith, and Sufi and define our dependent variables as follows: the change in the natural log of property, plant, and equipment and the change in each additional measure of investment—net debt issuance, capital expenditure, and acquisitions—scaled by lagged assets. Our variable of interest is the interac-tion of legal regime and violation, which estimates whether the effect of the vio-lation varies by legal regime. As with our previous regressions, we control for the measures of operating performance noted by Nini, Smith, and Sufi (2012) that are most frequently used in financial covenants. We also include the 4-quarter lag of each control variable and the higher-order covenant controls (the second and third powers of each covenant control variable). In addition, we follow Nini, Smith, and Sufi (2012) and control for both the natural log of assets and property, plant, and equipment and for the changes in these log variables between the ap-plicable quarters. All of our models include industry fixed effects, as measured by four-digit SIC codes. We also include fiscal and calendar quarter fixed effects, and our standard errors are double clustered by firm and fiscal year.
The results are shown in Table 10. We find that borrowers using pro-lender law exhibit greater decreases in firm investment activity upon violation than do borrowers using pro-debtor law. The results consistently show that the coefficient on the violation dummy is negative (although not necessarily significant) but that the coefficient on the interaction term is positive and significant. The interaction term is significant at 5 percent or greater in all instances except for one, where it is significant only at 15 percent. We note that all results are robust to alternative specifications and to the omission of covenant controls but that some of the re-sults are no longer significant when we omit fixed effects and/or controls for firm size.
The results are economically significant as well. For example, results using the Pro-Debtor Index in column 1 report the change in net debt issuance relative to lagged assets across legal regimes and show that there is cross-sectional variation in the decrease in net debt issuance relative to lagged assets after a violation that is related to the contract law. Borrowers using pro-lender law experience a 5.3 percent decrease in net debt issuance relative to lagged assets following a cove-nant violation (violation coefficient of –.066 and interaction coefficient of .013), but the decrease is reduced by roughly 1.3 percent for each 1-unit increase in the Pro-Debtor Index, which ranges from 6 to 12.27 Our other measures of in-
26 Our data indicate whether a violation occurred in the prior year but do not indicate the specific quarter in which the violation occurred. We hand checked the violations in our data set to deter-mine when they occurred, and, although we were unable to determine the quarter of violation for all our covenants, we found that the average violation, in terms of both mean and median, occurred 2 quarters before the new contract was signed. As such, we look at the change from 2 quarters prior to the contract to 2 quarters following the contract. In addition, because of data limitations with Com-pustat, we use the annual level of acquisitions rather than the quarterly level (controls in this speci-fication are likewise based on annual data). For this variable, we measure the difference between the year in which the contract was signed and the following year.
27 For comparison, Nini, Sufi, and Smith (2012) document that borrowers who violate a covenant experience an average decrease in net debt issuance relative to lagged assets of 2 percent, which is similar to our sample average decrease of 1.9 percent when excluding the control for legal regime.

Debt Contracts 1055
vestment show a similar pattern: the magnitude of the decrease in investment following a violation is statistically and economically related to the contract law. Overall, the results indicate that the contract law is an important element in un-derstanding the implications of covenant violations and how such violations af-fect firms’ policies.
5. Robustness Tests
To test robustness, we estimate our regressions using two alternative rank-
ings for whether the state is more or less favorable to lenders. The first ranking is
based on the perceived litigation risk that we previously calculated, but we group
states by clustering those with the most similar frequency of litigation. Under this
classification, the two states with the highest frequency of litigation are classified
Table 10
Changes in Firm Investment Policy and Legal Regime
Change in NDI
(1)
Change in Ln(PPE)
(2)
Change in CAPX
(3)
Change in ACQ
(4)
Pro-Debtor Index: Covenant Violation –.066**
(.021)–.012(.052)
–.007(.005)
–.017(.066)
Legal Regime –.001(.002)
.005(.005)
–.001(.0004)
–.003(.004)
Covenant Violation × Legal Regime .013**(.003)
.019*(.009)
.0015*(.0006)
.020(.013)
N 2,193 2,193 2,193 2,283 R2 .33 .60 .11 .45Litigation Risk: Covenant Violation –.087*
(.037)–.065(.065)
–.011**(.004)
–.086(.072)
Legal Regime –.011(.005)
.005(.016)
–.002(.002)
–.015(.011)
Covenant Violation × Legal Regime .041*(.021)
.088**(.029)
.006**(.002)
.084*(.034)
N 2,193 2,193 2,193 2,283 R2 .33 .60 .11 .45
Note. Results are from estimating the following equation: Change in Firm Activity = α + β1Covenant
Violation + β2Legal Regime + β
3Legal Regime × Covenant Violation + Controls + Fixed Effects. Higher
values of the Legal Regime variables reflect more pro-debtor law. Covenant Violation is a dummy set equal to one if the borrower violated a covenant associated with a contract in the data set in the prior year and zero otherwise. The dependent variables are, for model 1, the change in net debt issuance (NDI) relative to lagged assets; for model 2, the natural log of the change in property, plant, and equipment (PPE); for model 3, the change in capital expenditures (CAPX) relative to lagged assets; and for model 4, the change in acquisitions (ACQ) relative to lagged assets (based on annual data because of limitations in the quarterly data). All models include the six covenant controls (operating cash flow scaled by lagged assets, interest expense scaled by lagged assets, the leverage ratio, the current ratio, the net worth ratio, and the market-to-book ratio) and fixed effects for industry and the fiscal and calendar quarter-years. All models also control for the 1-year lag of each covenant control, the higher-order covenant controls, and firm size. The controls for firm size are the natural log of assets and PPE and the changes in those variables between the applicable quarters (model 2 omits the PPE controls). Standard errors, in parentheses, are clustered by firm and year. * p < .05. ** p < .01.

1056 The Journal of LAW & ECONOMICS
as pro-debtor, the six states in the middle of the distribution are classified as in-
termediate, and the two states with the lowest frequency of litigation are classified
as pro-lender. All of our regression results in Tables 7–10 remain significant us-
ing this alternative measure.
We next classify whether the state is favorable to lenders by using the average
number of lenders per loan in each state. We conjecture that loans with more
lenders will be more likely to have a lead arranger with greater expertise and fa-
miliarity with state contract law and that these more informed lenders will grav-
itate toward the law that is most favorable to them. Thus, we presume that the
loans with greater numbers of lenders are more likely to select pro-lender law.
We again categorize each state as pro-lender, intermediate, or pro-debtor. The
pro-lender states are the three states with the most lenders per contract, the in-
termediate states are those four states in the middle of the distribution, and the
pro-debtor states are the three states with the fewest lenders per contract. This
ranking yields a grouping that is very similar to our original ranking based on the
perceived litigation risk, and all our results remain significant. For brevity, we do
not include these results.
We conduct two further robustness tests. First, we analyze 241 borrowers who
use laws from different states. Second, we test within-state changes in the features
captured by our index. However, we are very limited by the small number of ob-
servations, and we do not find significant results.
6. Conclusion
This study examines the factors that influence parties’ choice of law in private
debt contracts. The findings extend the legal literature arguing that there is a mar-
ket for contracts by showing that there are systematic differences in borrowers,
contracts, and lenders across states. At a univariate level, borrowers who use pro-
lender law have greater levels of debt, and contracts that use pro-lender law have
longer maturity and higher dollar values. In addition, we show that the states
with law that is more pro-lender are those in which lenders play a larger role
in the local economy and are most successful in competing for out-of-state con-
tracts. In particular, New York, a state widely known to compete for contracts, is
most frequently used for debt contracts and has increased its dominance during
the past 20 years.We also analyze how contract terms, the frequency of covenant violations, and
the repercussions of covenant violations vary depending on the initial choice of contract law. Cash collateral is most likely to be used when the contract is gov-erned by pro-debtor law, and out-of-state borrowers who are subject to pro-debtor law pay higher yield spreads, which is consistent with out-of-state borrow-ers paying for the privilege of pro-debtor law. We also find a positive association between the contract law and the frequency and repercussions of covenant vio-lations. The frequency of violations is highest when the contract is governed by pro-debtor law, and the repercussions of covenant violations—measured using

Debt Contracts 1057
changes in firm investment postviolation—are greatest when the contract is gov-erned by pro-lender law. Because prior literature associates the repercussions of covenant violations with the influence of creditors (Nini, Smith, and Sufi 2012), our results suggest that lenders exert more influence on borrowers postviolation when the contract is governed by pro-lender law. As a final note, we caution that our study shows a series of correlations, rather than a causal relationship, because the parties to the contract are able to select their governing law and because state legislators can affect the law in each state. However, regardless of whether our findings arise because of self-selection or because parties respond to differences in the law, our results indicate that the contract law is an important consideration in understanding the relationship between borrowers and lenders.
Appendix
Detail on Laws Used for the Pro-Debtor Index
The Pro-Debtor Index used to rank the states on the basis of state law consid-
ers six legal practices and standards below. The features included in the index
are meant to reflect the lender’s ability to enforce the contract. Given that both
substantive and procedural laws are relevant for enforcement, the index includes
features relating to the states’ substantive law and court system. Each state re-
ceives a ranking of 1–3 for each feature, where 1 is considered pro-lender and 3 is
considered pro-debtor. Because the relevant law may change over time, all clas-
sifications are based on the law of the state as of December 31, 2005. In addition,
as noted, the six features are not the only differences between states’ laws but in-
stead reflect the relevant differences noted most frequently in legal literature on
lender liability and contract law.
Enforcement of Predispute Jury Trial Waivers
Commercial contracts commonly contain predispute jury trial waivers in
which both parties agree to waive their right to a jury trial should a dispute arise
(Eisenberg and Miller 2007). While the parties may still litigate, they will not have
the option of a jury trial, and the case will be decided by a judge. Some states have
found these clauses to be unenforceable, whereas other states have ruled them
enforceable. We code states as 1 if such waivers are enforceable, 2 if the law is un-
certain, and 3 if the waivers are unenforceable.
Presence of Specialized Business Courts
Many states have established business courts in order to increase judicial ef-
ficiency. These courts are generally divisions or programs within existing trial
courts that specialize in business-related litigation (Applebaum 2011; Coyle
2012). Business courts tend to expedite the process of litigation by, for example,
assigning all aspects of the case to the same judge and hiring judges who spe-

1058 The Journal of LAW & ECONOMICS
cialize in commercial law. These specialized courts are particularly attractive to
lenders, who frequently must obtain and enforce a judgment efficiently so that
the borrower does not spend the funds in question. We code states as 1 if they
had business courts in place as of December 31, 2005; 2 if they had an alternative
to the standard business court; and 3 if they had no relevant business court or
similar structure.
Recognition of the Tort of Deepening Insolvency
States that recognize deepening insolvency as a tort (a wrongful civil act recog-
nized under the law) provide harmed parties with a claim against those who have
wrongfully prolonged a corporation’s life. For example, if an unsecured credi-
tor receives a lower recovery amount because the life of an insolvent corporation
is deemed to have been wrongfully prolonged, that creditor can bring a claim
against any lender who wrongfully extended the corporation’s life by providing
funding beyond the point at which the court deems that the corporation should
have filed for bankruptcy. As such, lenders in states recognizing deepening in-
solvency as a separate cause of action face a greater risk of liability, and lenders
in states that have not yet ruled on whether to recognize the tort face the uncer-
tainty that the state may decide to recognize it. We thus code the states that had
explicitly rejected the tort as of December 31, 2005, as 1; while the states that ex-
plicitly recognized the tort are coded as 3; and the states that had not ruled on the
issue are coded as 2.
State Enforcement of Waivers of Lender Liability
To avoid claims of lender liability, many lenders request that the borrower sign
an agreement waiving all claims that the borrower could bring against the lender.
Although blanket releases of the covenant of good faith are not usually enforce-
able, waivers of other claims are usually enforceable. However, there are differ-
ences across states. Some common differences include the following: whether
the waivers apply only to claims the borrower previously had against the lender
or whether they can apply to future claims as well, whether each claim needs to
be listed separately or whether a general waiver of all claims is enforceable, and
whether a waiver can be enforced on summary judgment (that is, whether the
waiver can be enforced by the court without a full trial). In addition, all states
hold that waivers are unenforceable if the borrower can establish that the waiver
was obtained fraudulently or was signed under economic duress, which in es-
sence means that the party who signed the waiver had no practical choice but to
sign it. However, the circumstances necessary to demonstrate economic duress
vary significantly by state. We rank the states as 1 if the case law surrounding
waivers is the most generous to lenders, 2 if the case law is moderate, and 3 if the
case law poses the highest risk to lenders.

Debt Contracts 1059
Presence of Statutes Allowing Choice of Law and Forum for Commercial Contracts of a Minimum Dollar Value
Many states have enacted statutes allowing their law and courts to be used for substantial commercial contracts regardless of whether the contract has a con-nection to the state. The choice-of-law statutes guarantee that choice-of-law clauses selecting the law of that state will be enforced if they are litigated in that state and the contract exceeds a minimum dollar value—usually $250,000.28 In addition, although there is some variation, the choice-of-forum statutes gener-ally guarantee that the parties may litigate in the state’s courts provided that they have chosen that the state’s law will govern the contract law and the contract ex-ceeds a minimum dollar value—usually $1 million. These statutes are thought to reflect that the state actively competes for contracts because the statutes allow for greater use of the state law (Eisenberg and Miller 2010) and provide greater certainty that the lawsuit will be resolved efficiently and without unnecessary dis-pute over the forum and/or law. Through this increased certainty, the lenders can have more confidence that the choice of pro-lender law will be enforced and can act accordingly. We code states as 1 if they have both statutes, 2 if they have only one statute, and 3 if they have neither statute.
Extent to Which a Lender Is Required to Act in Good Faith When Taking Discretionary Actions
Courts will generally allow lenders to enforce their contractual rights even when doing so harms the borrower. However, there is some case law that finds that lenders who take discretionary actions, such as demanding immediate re-payment, must do so in good faith regardless of the contractual language.29 In general, a lender seeking to take discretionary actions will first need to consider whether the borrower will be harmed by those actions and, if so, whether its ac-tions violate the duty of good faith according to the relevant law. However, its ob-ligation to consider the welfare of the borrower and the exact definition of good faith will vary by state (Burton 1994; Gergen 1993). We rank the states as 1 if the relevant case law is the most generous to lenders, 2 if the case law is moderate, and 3 if the case law poses the highest risk to lenders.
28 States that enact these statutes will enforce a choice-of-law clause that selects the law of their state if the litigation takes place in that state, but other states are not bound to follow these statutes if the litigation is brought in another state. However, there is generally reciprocity among the states that enact these statutes—if the state has a statute, it is more likely to be deferential to all choice-of-law clauses.
29 The courts that require good faith in calling a demand note usually state that section 208 of the Uniform Commercial Code imposes a duty of good faith on both parties when taking a number of discretionary actions, and they hold this duty to apply. The courts that do not require good faith in calling a demand note generally point to the Official Comment to section 208, which states, “Obvi-ously this section has no application to demand instruments or obligations whose very nature per-mits call at any time with or without reason.”

1060 The Journal of LAW & ECONOMICS
References
Applebaum, Lee. 2011. The Steady Growth of Business Courts. Pp. 70–75 in Future Trends
in State Courts 2011, edited by Carol R. Flango, Amy M. McDowell, Charles F. Camp-
bell, and Neal B. Kauder. Report on Trends in the State Courts. Williamsburg, Va.: Na-
tional Center for State Courts.
Baird, Douglas, and Robert Rasmussen. 2006. Private Debt and the Missing Lever of Cor-
porate Governance. University of Pennsylvania Law Review 154:1209–52.
Barzuza, Michal, and David C. Smith. 2013. What Happens in Nevada? Self-Selecting into
Lax Law. Working paper. University of Virginia, School of Law, Charlottesville.
Bebchuk, Lucian A., and Alma Cohen. 2003. Firms’ Decisions Where to Incorporate. Jour-
nal of Law and Economics 46:383–425.
Burton, Steven J. 1994. Good Faith in Articles 1 and 2 of the U.C.C.: The Practice View.
William and Mary Law Review 35:1533–64.
Cappello, A. Barry. 2009. Lender Liability. 4th ed. Huntington, N.Y.: Juris Publishing, Inc.
Chava, Sudheer, and Michael R. Roberts. 2008. How Does Financing Impact Investment?
The Role of Debt Covenants. Journal of Finance 63:2085–21.
Cheah, Ban Chuan. 2009. Clustering Standard Errors or Modeling Multilevel Data? Work-
ing paper. Westat, Rockville, Md.
Cocheo, Steve. 2009. Lender Liability Revisited. ABA Banking Journal, March 13. http://
cappellonoel.com/lender-liability-revisited-aba-banking-journal/.
Cohen, Moshe, Sharon Katz, and Gil Sadka. 2014. Debt Covenants and Capital Structure:
Evidence from an Exogenous Shock to Debt Capacity. Working paper. Columbia Busi-
ness School, New York.
Cookson, Anthony J. 2010. Institutions and Casinos on American Indian Reservations:
An Empirical Analysis of the Location of Indian Casinos. Journal of Law and Economics
53:651–87.
Coyle, John F. 2012. Business Courts and Interstate Competition. William and Mary Law
Review 53:1915–2012.
Cumming, Douglas J., and Sophia A. Johan. 2006. Is It the Law or the Lawyers? Invest-
ment Covenants around the World. European Financial Management 12:553–74.
Davydenko, Sergei A., and Julian R. Franks. 2008. Do Bankruptcy Codes Matter? A Study
of Defaults in France, Germany, and the U.K. Journal of Finance 63:565–608.
Dedrick, Robert F., John M. Ferron, Melinda R. Hess, Kristine Y. Hogarty, Jeffrey D.
Krom rey, Thomas R. Lang, et al. 2009. Multilevel Modeling: A Review of Methodologi-
cal Issues and Applications. Review of Educational Research 79:69–102.
Eisenberg, Theodore, and Geoffrey P. Miller. 2007. Do Juries Add Value? Evidence from
an Empirical Study of Jury Trial Waiver Clauses in Large Corporate Contracts. Journal
of Empirical Legal Studies 4:539–88.
———. 2009. The Flight to New York: An Empirical Study of Choice of Law and Choice
of Forum Clauses in Publicly-Held Companies’ Contracts. Cardozo Law Review 30:
1475–1512.
———. 2010. The Market for Contracts. Cardozo Law Review 30:2073–98.
Epstein, Richard H. 2010. How to Rebuff Lender Liability Lawsuits. Metropolitan Corpo-
rate Counsel, July, p. 27. http://www.metrocorpcounsel.com/articles/12719/how-rebuff-
lender-liability-lawsuits.
Francis, Jennifer, Donna Philbrick, and Katherine Schipper. 1994. Shareholder Litigation
and Corporate Disclosures. Journal of Accounting Research 32:137–64.

Debt Contracts 1061
Freis, James H., Jr. 1998. Continuity of Contracts after the Introduction of the Euro: The
United States Response to European Economic and Monetary Union. Business Lawyer
53:701–66.
Gergen, Mark. 1993. A Cautionary Tale about Contractual Good Faith in Texas. Texas
Law Review 72:1235–76.
Heninger, William G. 2001. The Association between Auditor Litigation and Abnormal
Accruals. Accounting Review 76:111–26.
Ivashina, Victoria. 2009. Asymmetric Information Effects on Loan Spreads. Journal of Fi-
nancial Economics 92:300–319.
La Porta, Rafael, Florencio Lopez-de-Silanes, Andrei Shleifer, and Robert W. Vishny.
1998. Law and Finance. Journal of Political Economy 106:1113–55.
Li, Jingyu, Fayez A. Elayan, Thomas O. Meyer, and Parunchana Pacharn. 2012. The Out-
come of Backdating Investigations: Economic Consequences, Market Overreaction and
Management Motives. Investment Management and Financial Innovations 9(1):70–87.
Mansi, Sattar A., William F. Maxwell, and John K. Wald. 2009. Creditor Protection Laws
and the Cost of Debt. Journal of Law and Economics 52:701–26.
Nini, Greg, David C. Smith, and Amir Sufi. 2009. Creditor Control Rights and Firm In-
vestment Policy. Journal of Financial Economics 92:400–420.
———. 2012. Creditor Control Rights, Corporate Governance, and Firm Value. Review of
Financial Studies 25:1713–61.
Priest, George L., and Benjamin Klein. 1984. The Selection of Disputes for Litigation. Jour-
nal of Legal Studies 13:1–55.
Primo, David M., Matthew L. Jacobsmeier, and Jeffrey Milyo. 2007. Estimating the Impact
of State Policies and Institutions with Mixed-Level Data. State Politics and Policy Quar-
terly 7:446–59.
Qi, Yaxuan, and John K. Wald. 2008. State Laws and Debt Covenants. Journal of Law and
Economics 51:179–207.
Qian, Jun, and Philip E. Strahan. 2007. How Laws and Institutions Shape Financial Con-
tracts: The Case of Bank Loans. Journal of Finance 62:2803–34.
Roberts, Michael R., and Amir Sufi. 2009. Control Rights and Capital Structure: An Em-
pirical Investigation. Journal of Finance 64:1657–95.
Saltzman, Andrea. 1985. A Brief Look at Statutory Attorneys’ Fees in Illinois. Illinois Bar
Journal 73:266–68.
Silver, Leon. 2013. Choice of Law and the Covenant of Good Faith and Fair Dealing. For
the Defense, pp. 25–28, 78. http://www.polsinelli.com/~/media/Articles%20by%20
Attorneys/Silver_DRI_For%20the%20Defense.
Wald, John K., and Michael S. Long. 2007. The Effect of State Laws on Capital Structure.
Journal of Financial Economics 83:297–319.