state-and-transition modelsagrilifecdn.tamu.edu/briske/files/2013/01/briske-seminarbyu1011_2.… ·...
TRANSCRIPT

State-and-transition Models:Current Status and Future DirectionCurrent Status and Future Direction
David D. BriskeDavid D. Briske Ecosystem Science & Management Texas A&M UniversityTexas A&M University

Professional Reinvention
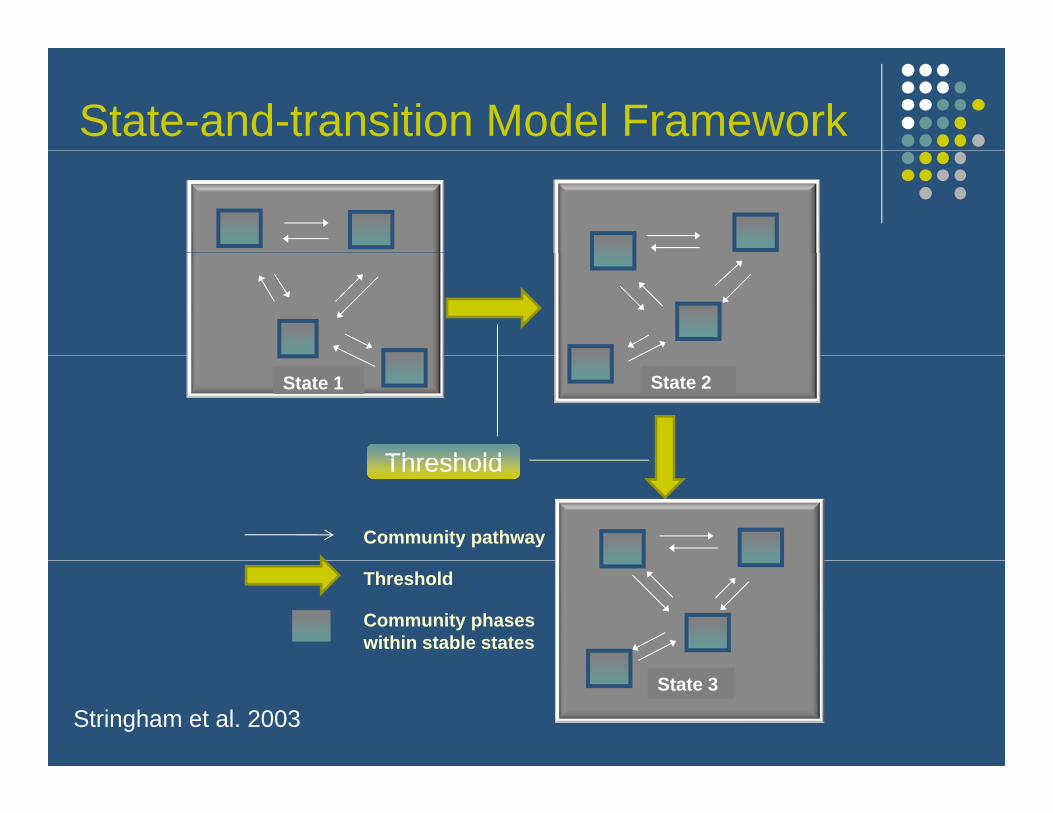
State-and-transition Model Framework
State 2State 1
Threshold
Community pathway
Threshold
Threshold
Community phases within stable states
State 3
Stringham et al. 2003

Presentation Objectivesj
E l li k b t STM d iliExplore linkage between STMs and resilienceAssess the current effectiveness of STMsInvestigate role of empirical data in STMsComment on the future direction of STMs

Thresholds vs ResilienceThresholds vs Resilience
Thresholds Resilience
Resilience – degree of modification that an ecosystem can absorb prior to transform to an alternative stateabsorb prior to transform to an alternative state. Threshold – resilience limit of an ecosystem.

Resilience based ManagementResilience-based Management
Ecological Resilience Ecological Resilience
State I State II
Feedback switch
ThresholdTrigger
Community Phase
Community
Negative Feedbacks Negative Feedbacks
PhaseAt-risk
Community Restoration pathway
Positive Feedbacks Positive Feedbacks
Negative Feedbacks Negative Feedbacks
Modified from Briske et al. 2008

Positive and Negative Feedbacks
Grassland Woodland Threshold
State StateProgression
Positive Feedbacks• woody plant cover• coarse fuel loadsw
itch
• coarse fuel loads• propagule limitations
ack
Sw
Negative Feedbacks• grassland productivity• fine, continuous fuel loadsFe
edb
fine, continuous fuel loads• propogule limitations

Mountain Clay Ecological Site, OregonReference StateIndicators: High perennial grass cover, dispersed sagebrush cover, minimal juniper and bare soil. Feedbacks: Herbaceous cover retains water on
Idaho FescueBluebunchwheatgrass Idaho Fescue
Bluebunchheatgrass
At-risk Community Phase: Herbaceous cover reduced, sagebrush decadence, juniper visible and bare
Feedbacks: Herbaceous cover retains water on site and provides fuel to support a fire return interval of less than 50 years.
wheatgrassMountain big sagebrushJuniper
Idaho FescueBluebunchwheatgrassMountain big
b h soil patches increasing, potential fire frequency reduced.
Trigger: Drought and intensive grazing promote juniper establishment through reduced fire frequency.
sagebrush
JuniperSagebrush
Threshold: Juniper attains a height and density that reduces fine fuel load and fire-induced tree mortality. Large, inter-connected bare soil patches occur with redistribution of nutrients/soil beneath juniper canopies.Restoration Pathway: Bunchgrass
(BG) density > 1 m2 requires mechanical juniper removal only;
SagebrushIdaho FescueBluebunchwheatgrass
mechanical juniper removal only;BG density < 1 m2 requires juniper removaland grass reseeding, if soil is intact.
Alternative State
JuniperIdaho FescueSandberg bluegrass
Alternative State Indicators: Mature juniper dominant, Idaho fescue only beneath juniper canopies, large interconnected bare soil patches, sagebrush decadence.. Feedbacks: Juniper dominates resource use, water and wind redistribute soil and nutrients beneath juniper, minimal grass and sagebrush establishment .

Effectiveness of STMs
Say, aren’t here supposed to be holes in this mask!

How Effective are STMs?How Effective are STMs?
Survey 47 rangeland professionalsSurvey 47 rangeland professionals26 Agency Managers21 Research Scientists21 Research Scientists
Purposes of STMsM d l St thModel Strengths Model Weaknesses Construction and Review
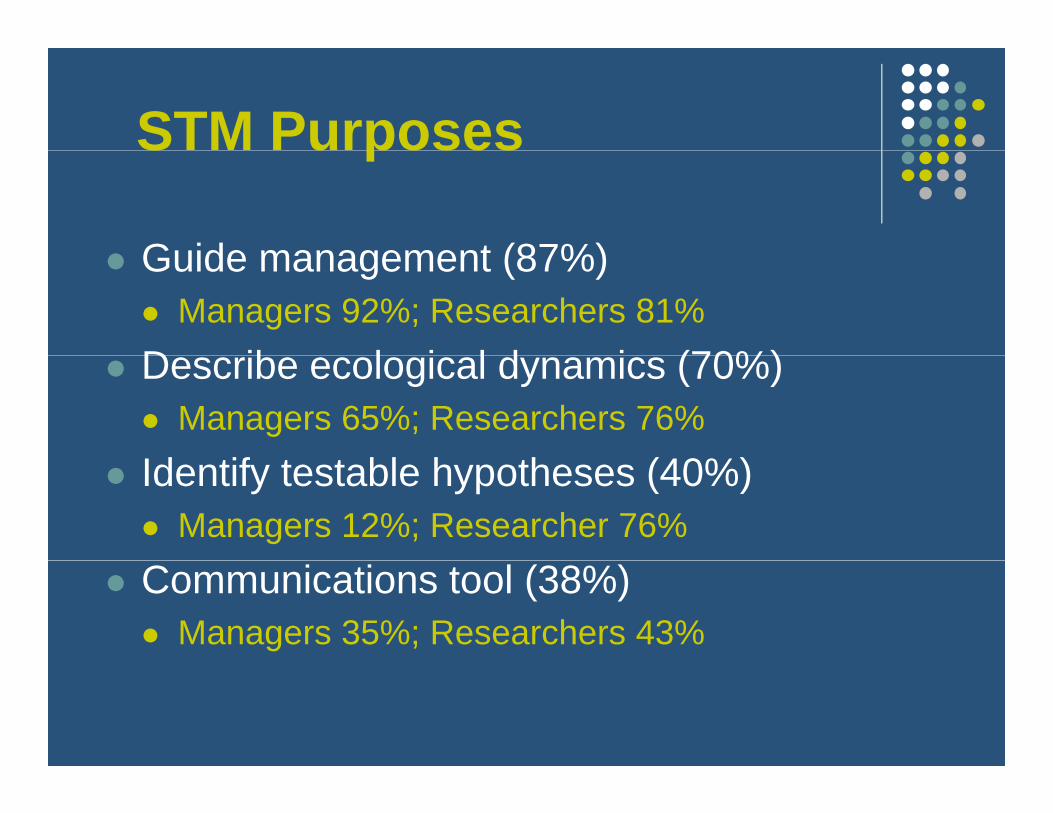
STM Purposes S u poses
Guide management (87%)Guide management (87%)Managers 92%; Researchers 81%
D ib l i l d i (70%)Describe ecological dynamics (70%)Managers 65%; Researchers 76%
Id if bl h h (40%)Identify testable hypotheses (40%)Managers 12%; Researcher 76%
Communications tool (38%)Managers 35%; Researchers 43%

STM StrengthsSTM StrengthsImprove decision making (87%)Improve decision making (87%)
Managers 92%; Researchers 81%D ib t d i (70%)Describe system dynamics (70%)
Managers 65%; Researchers 76%I i i (38%)Improve communication (38%)
Managers 35%; Researchers 43%Identify relevant questions (34%)
Managers 19%; Researchers 52%

STM WeaknessesSTM WeaknessesInsufficient information (43%)Insufficient information (43%)
Managers 30%; Researchers 57%M d l l l (26%)Models overly complex (26%)
Managers 38%; Researchers 10%L k f i d (21%)Lack of time and resources (21%)
Managers 27%; Researchers 14%Potential misrepresentation (17%)
Managers 8%; Researchers 29%

Construction & ReviewConstruction & ReviewExpert knowledge critical (43%)Expert knowledge critical (43%)
Managers 47%; Researchers 37%Mi i l i i l k l d (43%)Minimal empirical knowledge (43%)
Managers 34%; Researchers 61%M d l i i (26%)Model inconsistency (26%)
Managers 34%; Researchers 13%Mechanisms for validation (87%)
Managers 87%; Researchers 88%

Areas of STM RefinementAreas of STM RefinementManagement vs ecological driversg gRole of expert vs empirical knowledgeCriteria to define thresholdsCriteria to define thresholdsAppropriate model complexityModel review and revisionModel review and revision

Value of Empirical Data
“Then a miracle occurs” !!occurs !!

Attributes Idaho Data SetsAttributes Idaho Data Sets
Idaho National Lab US Sheep StationIdaho National LabPlant density
2
US Sheep StationPlant density
234 m2 plotsSampled 10 times
15-26 m2 plotsSampled 23 times
1950 – 2006N = 340 samples
1930 – 1957N = 545 samples
Species = 55 MAP = 220 mm
Species = 54MAP = 300 mm
Idaho Falls ID Dubois ID

Data AnalysisData AnalysisDr Sumanta BagchiDr Sumanta Bagchi
Identify communities with cluster analysisVerify community membership against species dissimilarity
BIC-parsimony, ANOSIM, SIMPERRecord community transitions in timey
Categorize transition frequency and attributes

Species Composition Species Composition
80
100
e (%
)
othersSa.kaPa.smAl.de
b) INEEL
20
40
60
age
abun
danc
e
Me.alBr.teLa.ocOp.poHe co
0
20
1950
1957
1965
1975
1978
1985
1990
1995
2001
2006
Aver
a He.coEl.elEl.laCh.viAr.trd
80
100
e (%
)
othersEl.alKo.maPo.se
a) USSES
20
40
60
age
abun
danc
e
Br.tePs.spTe.caPh.loPh ho
0
20
1930
1932
1934
1936
1938
1940
1942
1946
1949
1951
1954
1956
Aver
a Ph.hoCr.acCh.viBa.saAr.trp

Transition DissimilarityTransition DissimilarityTransition DissimilarityTransition Dissimilarity
Idaho National LabUS Sheep Station
50
67
Idaho National LabUS Sheep Station
ency 30
40
quen
cy 45
Freq
ue
1020
Freq
12
3
0.0 0.2 0.4 0.6 0.8 1.0
0
S i di i il it
0.0 0.2 0.4 0.6 0.8 1.0
0
Species dissimilaritySpecies dissimilarity

Empirical STMsEmpirical STMsEmpirical STMsEmpirical STMs
) USSES) USSES
A5
7
a) USSES
A5
7
a) USSES
D E7 12
7
b) INEEL
D E7 12
7
b) INEEL
D B11
76
13D B
117
6
13
46
4 73
318
46
4 73
318
E1
3
22
E1
3
22 AC 18
36 9 5
AC 18
36 9 5
C EC EF B
9 4
611F B
9 4
611
66

Community TransitionsCommunity Transitionsyy
40
50
m) 25
30
ive
)
Precipitation (cm) Cheatgrassa) USSES
10
20
30
40P
reci
pita
tion
(cm
5
10
15
20
25
heat
gras
s re
lat
abun
danc
e (%
40 70Precipitation (cm) Cheatgrassb) INEEL
0
10
1920 1930 1940 1950 1960 1970
P
0
5 Ch
152025303540
pita
tion
(cm
)
3040506070
gras
s re
lativ
end
ance
(%)
05
1015
1940 1960 1980 2000 2020
Pre
cip
01020
Che
atg
abun
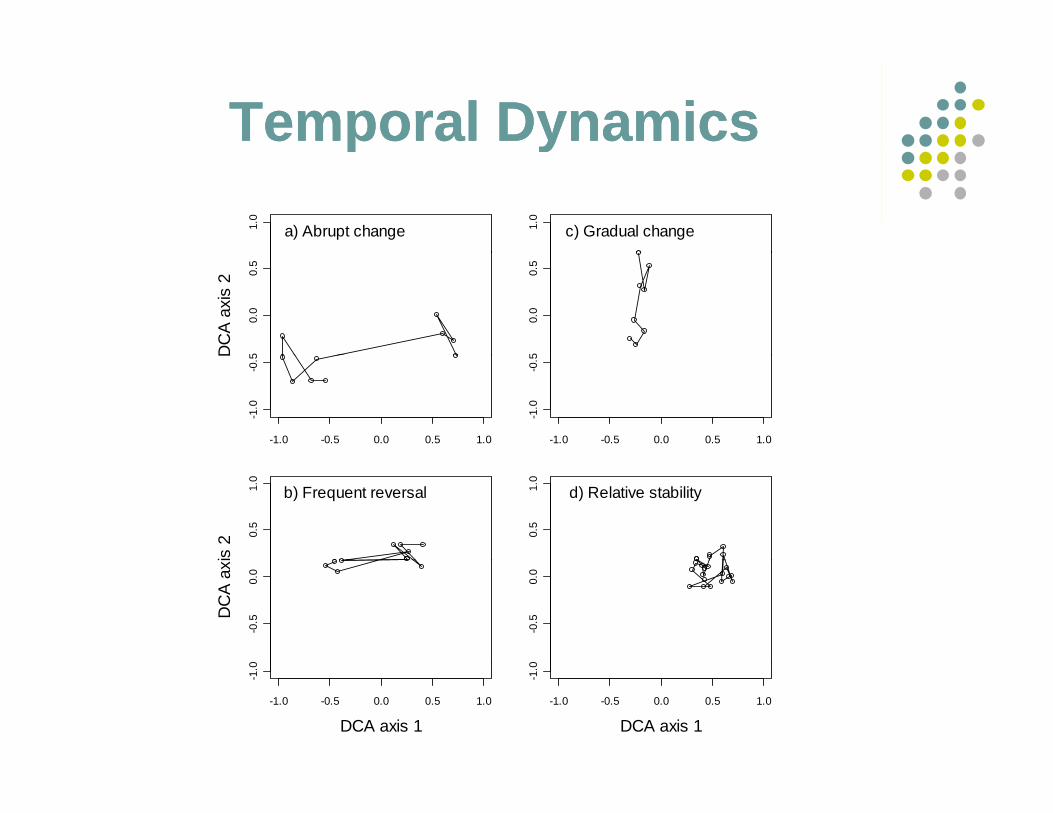
Temporal Dynamics Temporal Dynamics p yp y
1.0
a) Abrupt change 1.0
c) Gradual change5
0.0
0.5
DC
A ax
is 2
50.
00.
5
-1.0 -0.5 0.0 0.5 1.0
-1.0
-0.5D
-1.0 -0.5 0.0 0.5 1.0
-1.0
-0.5
0.5
1.0
is 2
b) Frequent reversal
0.5
1.0
d) Relative stability
0-0
.50.
0
DC
A ax
0-0
.50.
0
-1.0 -0.5 0.0 0.5 1.0
-1.0
DCA axis 1-1.0 -0.5 0.0 0.5 1.0
-1.0
DCA axis 1

Summary Idaho Data Setsy
Transitions occurred in a 10 yr windowyAssociated with increasing cheatgrass density
Transitions decreased at maximum densityyAlternative stable state formed
Cheatgrass is a ‘biotic trigger’Cheatgrass is a biotic trigger Interaction with precipitation patterns
Feedbacks rapid and unrelated to fireFeedbacks rapid and unrelated to fire Likely induced by plant-soil processes
Similar patterns occurred at both sitesSimilar patterns occurred at both sites

Value of Empirical Data?Value of Empirical Data?Empirical data can support STMs:Empirical data can support STMs:
Describe community transitionsIdentify temporal scalesIdentify temporal scalesAssess feedback mechanismsRefine resilience hypothesesRefine resilience hypotheses
Vegetation records insufficient: Adaptive management best approachAdaptive management best approachMonitor management outcomesConsider autogenic & climatic processesConsider autogenic & climatic processes

F t f STMFuture of STMs
Strong, consistent support among stakeholders
Continue resilience-based foundation
Adaptive management supported w/ monitoring
Science-management partnerships