state airport system facts
TRANSCRIPT

The New Jersey State Airport System Plan (NJ SASP) examines airport activity and development from a statewide perspective and is not a funding plan or endorsement for specific airport construction projects. As is the case with most system plans, the NJ SASP was developed as a top-down overview that allows each system airport to fit within a limited number of functional classifications. System performance mea-sures were then developed for each airport classification; however, it was realized that environmental conditions, topography, surrounding land use, public input, available funding, and many other factors will ultimately influence airport development. Typically, specific projects for an airport are identified during the master planning process. Follow-on environmental review is often required before any project is eligible to receive federal and/or state funding. Projects are then typically identified in an airport capital plan.
The system plan focuses on the State’s public use aeronautical facilities
New Jersey’s system includes 45 airports, one heliport, and one seaplane base
New Jersey’s public use airports accommodate more than 2.5 million general aviation operations (landings and takeoffs) each year
Based on FAA data, over 4,400 general aviation aircraft are registered in New Jersey
Approximately 460,000 commercial airline operations take place at New Jersey’s three commercial-service airports annually
Thirty-five million passengers board commercial passenger aircraft at New Jersey’s three commercial service airports each year
Twenty-eight of the State’s public-use airports are privately owned
Thirty-seven system airports have paved runways
Fourteen airports have more than one runway
Nine airports have a runway length of 5,000 feet or greater
More than 55,000 New Jersey businesses (more than 25 percent of all State establishments) in the manufacturing, transportation, finance and insurance, and technical service sectors use aviation services
•
•
•
•
•
•
•
•
•
•
•
s t a t e a i r p o r t s y s t e m f a c t s
state airport system plan

“new Jersey’s airport system is one of the most unique and complex in the U.s. the state’s diverse airports range in size from small general aviation airports with turf runways to newark liberty international airport, one of the nation’s busiest commercial airports.”
2
New Jersey is the most densely popu-lated state in the country. Its proximity to major commerce centers has made it the headquarters for many of the country’s most recognizable corpo-rations. The State’s history, beaches, casinos, small towns, and large urban centers make it a magnet for tourism. New Jersey’s airports support not only the State’s air travel and transporta-tion needs, but also key segments of the State’s economy. Additionally, the State lies in the nation’s busiest and most highly traveled air transportation
corridor, which spans from Boston to Washington, D.C. When combined, these factors explain New Jersey’s no-table demand for aviation and avia-tion-related services.
In 2007, the Governor and the Office of Economic Growth completed an “Economic Growth Strategy” that out-lines the steps necessary to develop and promote economic opportunities throughout New Jersey. The overall goal is to increase the number of well paying jobs by building on the State’s
strategic advantages and proactively addressing economic challenges. This plan includes provisions to promote and increase capital investments in the State’s ports and airports. The New Jersey State Airport System Plan (SASP) supports the overall objectives of the Economic Development Strategy by highlighting the existing system’s many economic benefits and identify-ing current and future enhancements to the State’s outstanding airport net-work.
New Jersey’s airport system is one of the most unique and complex in the U.S. The State’s diverse airports range in size from small general aviation airports with turf run-ways to Newark Liberty International Airport, one of the nation’s busiest commercial airports.
The complexity is also related to the system’s unique own-ership patterns. Among New Jersey’s 46 system airports, approximately 30 are privately owned. This ownership dis-tribution contrasts to the pattern in most states, where airport systems are typically publicly owned, most often by a county, city, or another local jurisdiction. In some instances, airports are owned and operated by authorities created under state statute or by the state itself.
The SASP, a multi-year project of the NJDOT, Division of Aeronautics, is a comprehensive review of New Jersey’s airport system. In preparing this long-term plan, it was necessary to address the many facets of the State’s aviation system. To that end, the NJDOT developed a strategic, performance-based approach that enabled the Division to:
Determine how the airport system is currently performing
Set objectives for its future performance
Set a course to enact change that would direct the airport system toward its established vision
•
•
•
i n t r o d u c t i o n

Inventory of the State’s existing pub-lic use airport system. This included on-site airport visits and cataloging of each airport’s historic and cur-rent facilities and activity levels.
Identification of each airport’s func-tional role within the system. Sys-tem leveling or stratification was accomplished by determining how each airport currently contributes to New Jersey’s air transportation system.
Evaluation of each airport’s per-formance relative to its functional role. Specific facility and service objectives were identified for each airport role. The ability of system
•
•
•
airports to fully comply with estab-lished facility and service objectives was analyzed.
Identification of gaps and duplica-tions in the system. The location of airports and the types of service each provides were analyzed with respect to State population densi-ties and business locations.
Documentation of specific airport projects. Specific projects were iden-tified that should be implemented to allow individual airports to fulfill their functional roles and best serve the State’s citizens and business, while increasing overall system per-formance to targeted levels.
•
•
a n o v e r v i e wThe last comprehensive review of New Jersey’s airport system was completed in 1990. Since that time, aviation, both nationally and in New Jersey, has experienced signifi-cant changes. The SASP provides an analysis of each airport and an overview of New Jersey’s overall air transportation needs for the next 20 years. The study includes the following technical tasks and analyses:
Airports and related facilities need-ed not only to meet current needs but also to promote aviation in New Jersey
Options available to elevate the per-formance of New Jersey’s airport system to meet established goals
Specific facilities and services need-ed to enable each airport to fully comply with its identified system role
Current redundancies in the system that may warrant future funding considerations
•
•
•
•
The possible influence of current constraints and future demand on each airport’s long-term system role
Locations where new or upgraded airport facilities are needed to en-sure that the system meets its tar-geted performance objectives
Current shortfalls or voids in New Jersey’s airport system
•
•
•
The SASP provides the Division of Aeronautics with guidance on each of following:
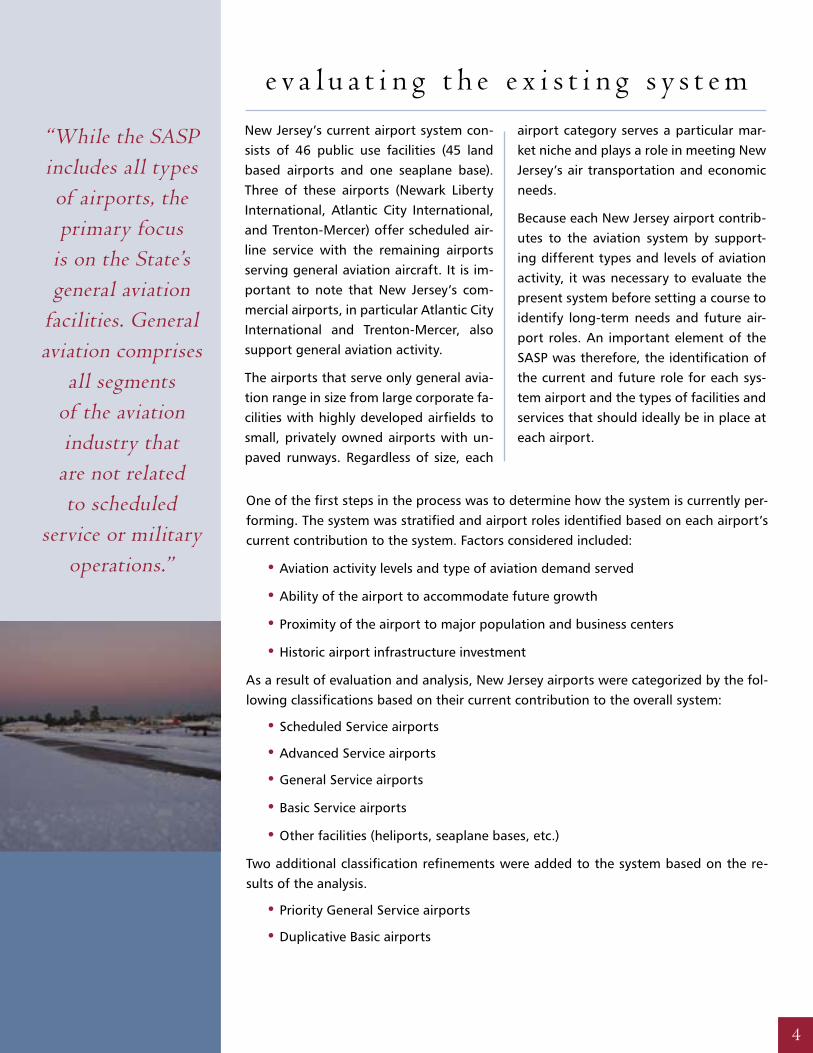
“While the sasp includes all types of airports, the primary focus
is on the state’s general aviation
facilities. General aviation comprises
all segments of the aviation industry that
are not related to scheduled
service or military operations.”
e v a l u a t i n g t h e e x i s t i n g s y s t e mNew Jersey’s current airport system con-sists of 46 public use facilities (45 land based airports and one seaplane base). Three of these airports (Newark Liberty International, Atlantic City International, and Trenton-Mercer) offer scheduled air-line service with the remaining airports serving general aviation aircraft. It is im-portant to note that New Jersey’s com-mercial airports, in particular Atlantic City International and Trenton-Mercer, also support general aviation activity.
The airports that serve only general avia-tion range in size from large corporate fa-cilities with highly developed airfields to small, privately owned airports with un-paved runways. Regardless of size, each
airport category serves a particular mar-ket niche and plays a role in meeting New Jersey’s air transportation and economic needs.
Because each New Jersey airport contrib-utes to the aviation system by support-ing different types and levels of aviation activity, it was necessary to evaluate the present system before setting a course to identify long-term needs and future air-port roles. An important element of the SASP was therefore, the identification of the current and future role for each sys-tem airport and the types of facilities and services that should ideally be in place at each airport.
One of the first steps in the process was to determine how the system is currently per-forming. The system was stratified and airport roles identified based on each airport’s current contribution to the system. Factors considered included:
Aviation activity levels and type of aviation demand served
Ability of the airport to accommodate future growth
Proximity of the airport to major population and business centers
Historic airport infrastructure investment
As a result of evaluation and analysis, New Jersey airports were categorized by the fol-lowing classifications based on their current contribution to the overall system:
Scheduled Service airports
Advanced Service airports
General Service airports
Basic Service airports
Other facilities (heliports, seaplane bases, etc.)
Two additional classification refinements were added to the system based on the re-sults of the analysis.
Priority General Service airports
Duplicative Basic airports
•
•
•
•
•
•
•
•
•
•
•
4
s c h e d u l e d s e rv i c e a i r p o rt s
Intended to support commercial airline activities
Where capacity constraints permit, can also support general aviation activities including corporate/executive operations, personal business operations, recreational activities, and flight training
Recommended minimum runway length of 6,000 feet
Should meet FAA Airport Reference Code (ARC) C-III design standards, which will allow operation by a vari-ety of aircraft including 737’s, regional jets, and smaller aircraft
•
•
•
•
a dva n c e d s e rv i c e a i r p o rt s
Intended to support corporate/executive and private-use general aviation activities; in many cases, located near major metropolitan areas and function as relievers to larger, more congested scheduled service airports
Should be able to accommodate the largest and most demanding corporate jet aircraft
Where operational and/or capacity constraints permit, could also support recreational activities and flight training
Facilities should meet ARC C-II standards, which sup-port most business jets
Recommended minimum runway length of 5,000 feet
•
•
•
•
•
p r i o r i t y g e n e r a l s e rv i c e a i r p o rt s
Whenever possible, should be developed to exceed the objectives of general service airports, and to the extent that it is feasible should be developed to meet facility and service objectives of Advanced Service airports
At a minimum, should be developed to meet ARC B-II design standards, which support most twin-engine piston and small business jet aircraft
Recommended minimum runway length of 4,000 feet
•
•
•
b a s i c s e rv i c e a i r p o rt s
Offer limited facilities and services
Include facilities with paved or turf runways that sup-port small single- and twin-engine general aviation aircraft
Recommended minimum runway length of 2,200 feet
Facilities should meet ARC B-I design standards
•
•
•
•
g e n e r a l s e rv i c e a i r p o rt s
Intended to support smaller corporate aircraft, such as twin-engine aircraft, and the operation of general aviation aircraft for business and pleasure; intended to support a variety of uses, such as busi-ness, recreation, and training, while providing the majority of the system’s operational and storage capacity for single- and multi-engine piston aircraft
Recommended minimum runway length of 3,500 feet
Facilities should meet ARC B-I design standards
•
•
•
d u pl i c at i v e b a s i c s e rv i c e a i r p o rt s
Located close to more highly developed system air-ports and in portions of the State where historic avia-tion demand and current and future socioeconomic and demographic indicators show more limited need for these airports
Should meet ARC B-I design standards
Recommended minimum runway length of 2,200 feet
•
•
•
o t h e r fac i l i t i e s
Other facilities include public use facilities dedicated to special uses, such as heliports and seaplane bases.
•
scheduled service, advanced service, priority General service, and General service airports are considered the core of the state’s system. Core airports are facilities considered key to the states aviation infrastructure. all Basic service airports are considered Core Candidate facilities. it was recognized that each airport serves a variety of functions and accommodates different types of aviation activity, therefore the following general definitions were established:
core a i r por t s
core ca nd idate a i r por t s

4
n e w j e r s e y a i r p o r t s y s t e m
6
Sussex
Greenwood Lake
LittleFerry
Teterboro
Lincoln Park
Essex County
Morristown Municipal
Newark Liberty International
Linden
Central Jersey Regional
Solberg-Hunterdon SomersetAlexandria
Sky Manor
Hackettstown
Blairstown Trinca
Aeroflex-Andover
Newton
Princeton
Old BridgeTwin Pine
Trenton- Mercer Trenton-
Robbinsville
MonmouthExecutive
RedwingLakewood
Robert J. Miller Air Park
South Jersey Regional Flying W
Red Lion
Camden CountySpitfire Aerodrome Cross Keys
Southern CrossHammontonMunicipal
Eagles Nest
Atlantic City International
Ocean City Municipal
Woodbine Municipal
Cape May County
MillvilleMunicipalHolly City
Heliport
Li Calzi
Bucks
Kroelinger Downstown
Core airports
leGenD
public Heliports
Core Candidate airports
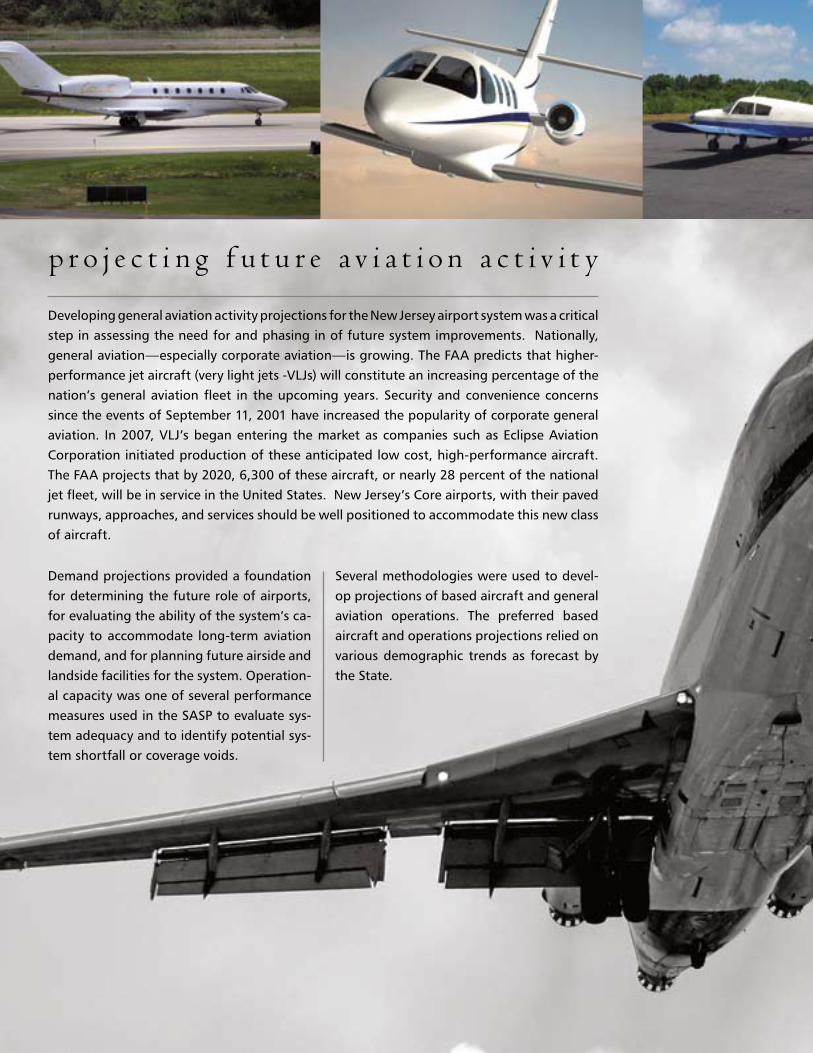
p r o j e c t i n g f u t u r e a v i a t i o n a c t i v i t y
Demand projections provided a foundation for determining the future role of airports, for evaluating the ability of the system’s ca-pacity to accommodate long-term aviation demand, and for planning future airside and landside facilities for the system. Operation-al capacity was one of several performance measures used in the SASP to evaluate sys-tem adequacy and to identify potential sys-tem shortfall or coverage voids.
Several methodologies were used to devel-op projections of based aircraft and general aviation operations. The preferred based aircraft and operations projections relied on various demographic trends as forecast by the State.
Developing general aviation activity projections for the New Jersey airport system was a critical step in assessing the need for and phasing in of future system improvements. Nationally, general aviation—especially corporate aviation—is growing. The FAA predicts that higher-performance jet aircraft (very light jets -VLJs) will constitute an increasing percentage of the nation’s general aviation fleet in the upcoming years. Security and convenience concerns since the events of September 11, 2001 have increased the popularity of corporate general aviation. In 2007, VLJ’s began entering the market as companies such as Eclipse Aviation Corporation initiated production of these anticipated low cost, high-performance aircraft. The FAA projects that by 2020, 6,300 of these aircraft, or nearly 28 percent of the national jet fleet, will be in service in the United States. New Jersey’s Core airports, with their paved runways, approaches, and services should be well positioned to accommodate this new class of aircraft.

6
The SASP forecasts yielded the following:
Due to expected population growth, based aircraft in New Jersey are predicted to increase from 4,203 in 2000 to more than 4,800 by 2020; this represents an average annual growth rate of 0.65 percent.
Based on anticipated changes in New Jersey’s civilian labor force, Statewide general aviation operations are projected to reach 2.39 million in 2020, up from 1.99 million in 2000. This pro-jected growth has an implied average annual growth rate of 0.94 percent.
•
•
0
500
1000
1500
2000
2500
3000
3500
4000
single-engine (3,262)
multi-engine (460)
jet (213)
helicopter (135)
other aircraft (133)
single-engine (3,709) multi-engine (505)
jet (304)
helicopter (161)
other aircraft (150)
ba s e d fl e e t Mi x
2000 20200
1000
2000
3000
4000
5000
2000 (4,203)
2007 (4,674)
2020 (4,800)
ba s e d ai rc r a f t
0.0 0.5 1.0 1.5 2.0 2.5
2020 (2,453,800)
2010 (2,239,800)
2005 (2,140,300)
2000 (2,045,500)
(millions)
ge n e r a l av i at i o n op e r at i o n s
These projected rates of growth for general aviation in New Jersey are consistent with those pro-jected by the Federal Aviation Administration for the U.S. as a whole.
8
Note: Other Aircraft includes military aircraft,
gliders, ultralights, blimps, etc.

The SASP forecasts yielded the following:
Due to expected population growth, based aircraft in New Jersey are predicted to increase from 4,218 in 2000 to 4,848 by 2020; this represents an average annual growth rate of 0.65 percent.
Based on anticipated changes in New Jersey’s civilian labor force, statewide general- aviation operations are projected to reach 2.39 million in 2020, up from 1.99 million in 2000. This pro-jected growth has an implied average annual growth rate of 0.94 percent.
•
•
s y s t e m b e n c h m a r k i n gnew Jersey’s airports are essential to the state’s transportation infrastructure. While the airport system is unparalleled in many re-gards, the dynamic nature of the aviation industry as well as the expanding requirements of the state’s businesses and residents requires periodic assessments of necessary improvements.
pivotal to the analysis of new Jersey’s airport system was the development of a series of performance-related, measurable, system benchmarks. Goals were then identified to evaluate where and how improvements could be made to the already outstanding airport system. this process provided specific information to the Division of aeronautics that allowed them to assess the strengths, facility gaps and duplications in the system.
g oa l p e r f o r M a n c e M e a s u r e
to provide a state system accessible from the air air accessibilityto provide a state system accessible from the ground Ground accessibility
to provide a state system that can support current and future demand Capacity/aviation activityto provide an airport system that can respond to foreseen and unforeseen changes Development potential
to provide a state system with facilities and services matched to each airport’s system role existing infrastructureto provide an airport system that meets applicable design standards Design standards

As part of the SASP, an analysis was undertaken to deter-mine the theoretical number of airports needed to serve New Jersey’s current and future operational levels. This analysis showed that the total number of airports in the State system is ample; however, the type and distribution of airports, especially those serving the growing corporate and business general aviation needs, could be expanded.
a dva n c e d s e rv i c e a i r p o rt s
The SASP recommends Cape May County and Hammonton Municipal airports should be upgraded to the Advanced Service category. As a result of recent closures, Woodbine Municipal may be considered for upgrading as well.
p r i o r i t y g e n e r a l a i r p o rt s
To ensure that a sufficient number of airports are available to meet the needs of more demanding general aviation air-craft, several system airports should be upgraded to meet facility and service objectives identified for priority general airports. The following airports should be developed to the maximum extent feasible based on local development, fi-nancial, environmental, ownership, and community consid-erations:
Central Jersey Regional Airport
Lincoln Park Airport
Solberg-Hunterdon Airport
Cross Keys Airport
Linden Airport
South Jersey Regional Airport
•
•
•
•
•
•
g e n e r a l s e rv i c e a i r p o rt s
The following facilities should be upgraded to meet the fa-cility and service objectives for this category:
Eagles Nest Airport
Spitfire Aerodrome
Camden County
Downstown
co r e ca n d i dat e a i r p o rt s
Although many small airports have a storied history and provide such benefits as recreation, flight training, open space, and emergency access, coverage analysis shows that in certain locations, smaller airports may duplicate services provided by other nearby facilities. While these airports may continue to play a role in meeting the diverse needs of New Jersey’s general aviation pilots and aircraft owners, a lower priority may be considered for assigning state funds to future development projects at these airports. The fol-lowing facilities have been assigned to the Core Candidate or Basic Service category:
Aeroflex-Andover Field
Hackettstown
Newton
Red Lion
Bucks
Kroelinger
•
•
•
•
•
•
•
•
•
•
8
making an outstanding system better
c o v e r a g e r e c o m m e n d a t i o n s
Every New Jersey citizen, business, and visitor should benefit from convenient access to an airport. Since individual needs can be as diverse as chartering a business jet, transporting a critically ill patient, or learning how to fly, the facilities and services provided should also vary. New Jersey’s air transportation and economic needs should be served by a diverse sys-tem of airports appropriately located to meet the State’s equally diverse aviation demand.
Li Calzi
Red Wing
Southern Cross
Trinca
Twin Pine
Little Ferry Seaplane Base
•
•
•
•
•
•
10

making an outstanding system better
m e e t i n g f u t u r e d e m a n d
More than 85 percent of airports in the system offer demand/capacity ratios that are below the FAA’s critical trigger point of 60 percent. However, key airports in the State’s most densely developed ar-eas could face capacity constraints. Cur-rently, two airports are experiencing de-mand/capacity ratios that are between the critical FAA trigger levels of 60 and 80 percent, and four system airports have demand/capacity ratios that exceed the 80 percent ratio.
The SASP identified several airports that may reach critical demand/capacity saturation rates in the coming years, including:
s c h e d u l e d s e rv i c e a i r p o rt s
Newark Liberty International – over 80% demand/capacity
Atlantic City International – between 60% and 80% demand/capacity
Trenton-Mercer – between 60% and 80% demand/capacity
•
•
•
a dva n c e d s e rv i c e a i r p o rt s
Essex County – over 80% demand/capacity
Morristown – over 80% demand/ capacity
Teterboro – over 80% demand/ capacity
To address these potential shortfalls in op-erational capacity, capacity-constrained airports may need to take steps to provide facilities (runways, taxiways, lighting, and navigational aids) that will increase their ability to process activity without delay. New airports would help to resolve poten-tial operational capacity shortfalls.
•
•
•
For New Jersey’s airport system to function efficiently, its airports must provide ample operational capacity. The FAA recognizes that when an airport’s operational demand consumes 60 percent or more of the facility’s annual capacity, delays to aircraft both on the ground and in the air begin to increase. When annual demand exceeds 80 percent of an airport’s annual capacity, delays increase rather dramatically.

12
e v a l u a t i n g d e v e l o p m e n t p o t e n t i a l
e x i s t i n g pl a n n i n g do c u M e n t s
System review shows that 67 percent of all airports in the New Jersey system have a master plan developed since 1995; 8 percent have plans developed prior to 1995; and an estimated 25 percent have no planning documents.
With proper airport planning in place, there is a greater likelihood that airports will have the flexibility to meet chal-lenges and opportunities. To enhance long-term develop-ment potential of the system, the following objectives for upgrading planning documents were established:
Scheduled and Advanced Service airports: plans should be upgraded every 5 years
•
Priority General and General Service airports: plans should be updated every 10 years or as needed
Other airport plans should be updated as demand or local circumstances dictate
a i r p o rt ow n e r s h i p A review of the New Jersey system shows that only 39 percent of the airports are publicly owned by a county, city, authority, or other public body. Of the 28 privately owned, public use airports, seven are eligible to receive federal Airport Improvement Program (AIP) funding; five of these seven are currently obligated. NJDOT supports and advocates public ownership and operation of Core airports as appropriate.
•
•
Two benchmarks were used to evaluate the system’s development potential: the existence of planning documents and types of ownership.
“more than 88 percent of airports in the system offer demand/capacity ratios that are below the
Faa’s critical trigger point of 60 percent. However, key airports in the state’s most densely developed
areas could face capacity constraints.”
“Upgrading all airports to meet 100 percent of their identif ied
objectives will entail significant investment over the coming years.
Funding priority should be given to those airports and projects
considered most essential to the success of the state’s airport system.”

u p g r a d i n g e x i s t i n g i n f r a s t r u c t u r e
Because airports in the New Jersey system serve many different roles, the types of facilities and services appropriate at each airport vary accordingly. The SASP has recommended specific facilities and services that are desirable for each airport based on the facility’s system role.
As a target, the SASP has established that all New Jersey airports should be com-pliant with their respective facility and service objectives. Upgrading all airports to meet 100 percent of their identified objectives will entail significant investment over the coming years. Funding priority should be given to those airports and proj-ects considered most essential to the success of the State’s airport system.
c o m p l i a n c e w i t h d e s i g n s t a n d a r d s
For New Jersey airports to operate in the most safe and efficient manner, all airports should comply with applicable FAA design and development standards. System airports were reviewed for their ability to meet or comply with various standards. System evaluation for key benchmarks produced the following findings:
BenchmarkMeets Standard
(% Of State System)Does Not Meet Standard
(% Of State System)
Runway/Taxiway Separation 54% 46%
Runway Width 65% 35%
Runway Safety Area Width/Length 23% 77%
Pavement Condition 87% 13%
As can be seen from the system’s current compliance with these benchmarks, ac-tions and investment will be needed to elevate the system’s performance in the future.
14
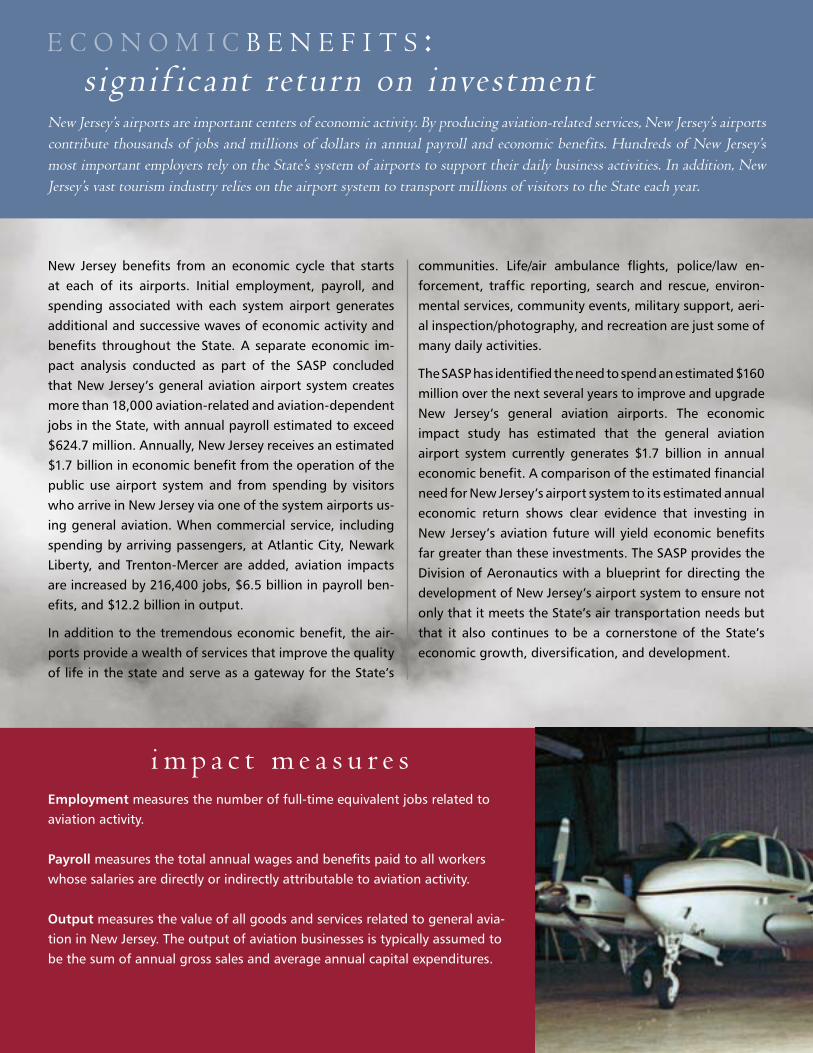
New Jersey benefits from an economic cycle that starts at each of its airports. Initial employment, payroll, and spending associated with each system airport generates additional and successive waves of economic activity and benefits throughout the State. A separate economic im-pact analysis conducted as part of the SASP concluded that New Jersey’s general aviation airport system creates more than 18,000 aviation-related and aviation-dependent jobs in the State, with annual payroll estimated to exceed $624.7 million. Annually, New Jersey receives an estimated $1.7 billion in economic benefit from the operation of the public use airport system and from spending by visitors who arrive in New Jersey via one of the system airports us-ing general aviation. When commercial service, including spending by arriving passengers, at Atlantic City, Newark Liberty, and Trenton-Mercer are added, aviation impacts are increased by 216,400 jobs, $6.5 billion in payroll ben-efits, and $12.2 billion in output.
In addition to the tremendous economic benefit, the air-ports provide a wealth of services that improve the quality of life in the state and serve as a gateway for the State’s
communities. Life/air ambulance flights, police/law en-forcement, traffic reporting, search and rescue, environ-mental services, community events, military support, aeri-al inspection/photography, and recreation are just some of many daily activities.
The SASP has identified the need to spend an estimated $160 million over the next several years to improve and upgrade New Jersey’s general aviation airports. The economic impact study has estimated that the general aviation airport system currently generates $1.7 billion in annual economic benefit. A comparison of the estimated financial need for New Jersey’s airport system to its estimated annual economic return shows clear evidence that investing in New Jersey’s aviation future will yield economic benefits far greater than these investments. The SASP provides the Division of Aeronautics with a blueprint for directing the development of New Jersey’s airport system to ensure not only that it meets the State’s air transportation needs but that it also continues to be a cornerstone of the State’s economic growth, diversification, and development.
u p g r a d i n g e x i s t i n g i n f r a s t r u c t u r enew Jersey’s airports are important centers of economic activity. By producing aviation-related services, new Jersey’s airports contribute thousands of jobs and millions of dollars in annual payroll and economic benefits. Hundreds of new Jersey’s most important employers rely on the state’s system of airports to support their daily business activities. in addition, new Jersey’s vast tourism industry relies on the airport system to transport millions of visitors to the state each year.
Employment measures the number of full-time equivalent jobs related to aviation activity.
Payroll measures the total annual wages and benefits paid to all workers whose salaries are directly or indirectly attributable to aviation activity.
Output measures the value of all goods and services related to general avia-tion in New Jersey. The output of aviation businesses is typically assumed to be the sum of annual gross sales and average annual capital expenditures.
i m p a c t m e a s u r e s

Airport Name Total Employment
Total Payroll
Total Output
General Aviation Impacts
Aeroflex-Andover Field 29 $922,100 $2,908,700
Alexandria Field 59 $1,427,700 $4,010,300
Atlantic City International* 562 $20,436,700 $49,929,100
Blairstown 31 $836,300 $2,008,600
Camden County 26 $591,900 $2,658,900
Cape May County 216 $6,088,400 $13,990,800
Central Jersey Regional 91 $2,605,700 $6,152,500
Cross Keys 73 $2,013,200 $4,919,400
Downstown 21 $458,500 $1,358,900
Essex County 1,774 $49,833,600 $93,099,000
Flying W 96 $3,276,000 $11,072,400
Greenwood Lake 45 $1,297,700 $3,209,100
Hammonton Municipal 28 $707,700 $2,181,800
Lakewood 28 $736,100 $2,388,200
Lincoln Park 183 $5,754,400 $14,810,100
Linden 271 $7,492,400 $25,391,600
Millville Municipal 1,718 $59,029,000 $283,663,500
Monmouth Executive 391 $10,602,800 $27,183,400
Morristown Municipal 3,180 $112,769,600 $271,089,500
Newark Liberty International* 367 $13,206,600 $31,893,300
Ocean City Municipal 45 $1,564,500 $4,112,200
Old Bridge 39 $965,600 $2,736,100
Princeton 104 $2,805,000 $9,161,700
Robert J. Miller Airpark 115 $4,094,400 $9,486,700
Sky Manor 87 $2,886,900 $5,946,600
Solberg-Hunterdon 96 $3,117,300 $7,631,700
Somerset 63 $2,204,600 $7,459,400
South Jersey Regional 158 $5,340,400 $9,845,000
Spitfire Aerodrome 9 $219,700 $1,503,000
Sussex 74 $1,921,900 $5,417,600
Teterboro 5,874 $200,388,600 $517,634,800
Trenton-Mercer* 2,024 $94,460,000 $277,593,300
Trenton Robbinsville 31 $824,000 $2,308,900
Woodbine Municipal 37 $974,900 $3,516,100
Other System Airports 71 $1,892,700 $4,795,300
General Aviation Total 18,048 $624,773,900 $1,726,496,900
Commercial Service Impacts
Atlantic City International 8,687 $376,045,700 $828,918,100
Newark Liberty International 207,427 $6,122,615,000 $11,375,535,700
Trenton-Mercer 299 $7,791,300 $10,024,700
Commercial Service Total 216,412 $6,506,452,000 $12,214,478,500
New Jersey Total 234,460 $7,131,225,900 $13,940,975,400
economic im
pacts of n
ew Jersey a
irports
16Source: The Economic Impact of New Jersey Airports, 2003* Impacts from general aviation activity. Commercial service impacts listed separately.
m e e t i n g t h e c h a l l e n g e
For New Jersey’s airport system to move toward the objectives established in the SASP, local ac-tions will be needed. Responsibility for imple-menting the recommendations ultimately rests with each airport owner, whether public or private. As each owner considers the future of its airport facility, recommendations stemming from the SASP should serve as a guide for future development.
Significant investment on both the State and federal levels will be required to enable New Jersey’s airport system to satisfy the facility and service objectives established in the SASP and to elevate the performance of the system to better satisfy identified system performance measures and their associated benchmarks. It has been estimated that, at a minimum, $160 million will be required to enhance the system
to satisfy target performance and facility and service objectives by 2020. While the invest-ment is significant, the potential return is far greater.
Intermodal connections are important to ensure timely and seamless transfers of people and goods. Automobile, truck, rail and bus linkages are being improved at many of the State’s larger Core airports. For example, Trenton-Mercer Airport may be evaluated for future intermodal passenger connections based on its proximity to the Reading Railroad line. Future connections to this corridor could provide service to Philadelphia via SEPTA, to Newark and New York via NJ TRANSIT rail, to Burlington and Camden counties via the River Line, and to Route 1 corridor destinations via the proposed Bus Rapid Transit line.
From Newark Liberty International Airport to the state’s smallest public use turf strips, New Jersey’s airport system must support all aspects of the State’s air transportation needs. To meet the chal-lenge, the State must be served by a system of well-developed, strategically located, diversified airports. Recommendations that emerged from the New Jersey SASP meet each of these important criteria.

18
