stat 512 day 4: quantitative data. last time p-values and statistical significance what p-values...
Post on 20-Dec-2015
216 views
TRANSCRIPT

Stat 512Day 4: Quantitative Data
Last Time
p-values and statistical significance What p-values tell us (and do not tell us)
For now, approximating the p-value through simulating the randomization process
How small p-values provide evidence that the difference we observed did not occur “just by chance” (randomization) Assume there is no treatment effect…
If a randomized experiment, then can also draw cause and effect conclusions
Practice Problem
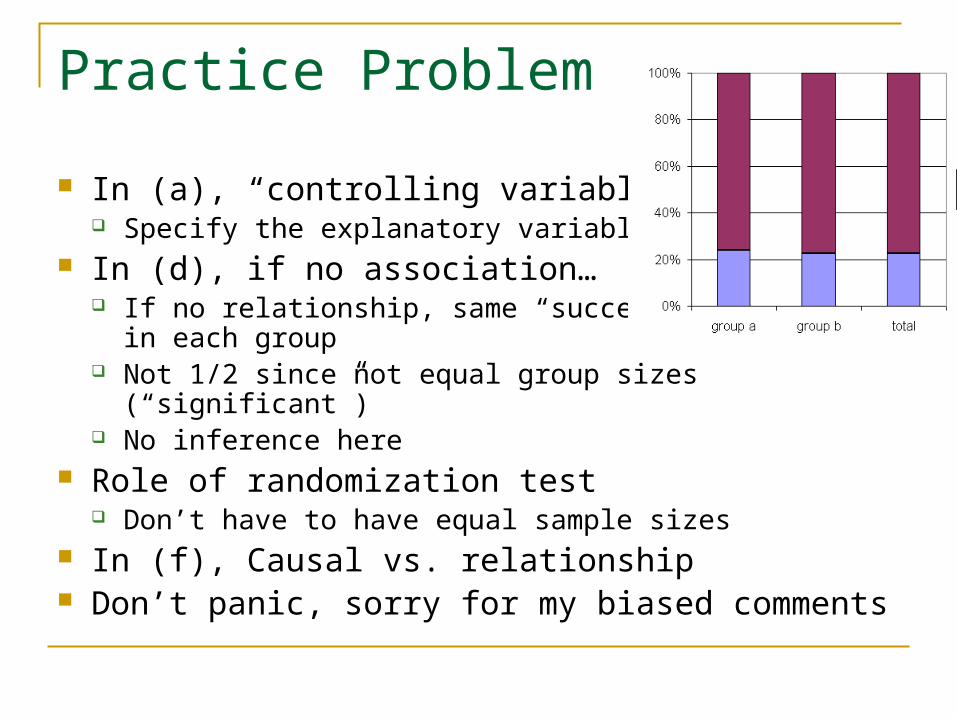
In (a), “controlling variables” Specify the explanatory variable
In (d), if no association… If no relationship, same “success proportion” in each group Not 1/2 since not equal group sizes
(“significant”) No inference here
Role of randomization test Don’t have to have equal sample sizes
In (f), Causal vs. relationship Don’t panic, sorry for my biased comments

Statistical Methods
Design: Planning and carrying out research studies Observational units, Number and types of
variables Descriptive: Summarizing and exploration
data Inference: Making predictions or generalizing
about phenomena represented by data What conclusions can we draw based on
each of these three steps?

Repeat the Process – Quantitative Data Consider data collection issues Consider appropriate numerical and
graphical summaries Several measures, what does each tell you? How do we get Minitab to do all the work?
Simulation of p-values to determine statistical significance Interpretation of p-values
Example 1: Cloud Seeding
“A Bayesian analysis of a multiplicative treatment effect in weather modification” Simpson, Alsen, Eden Technometrics, 17, 161-166 (1975)
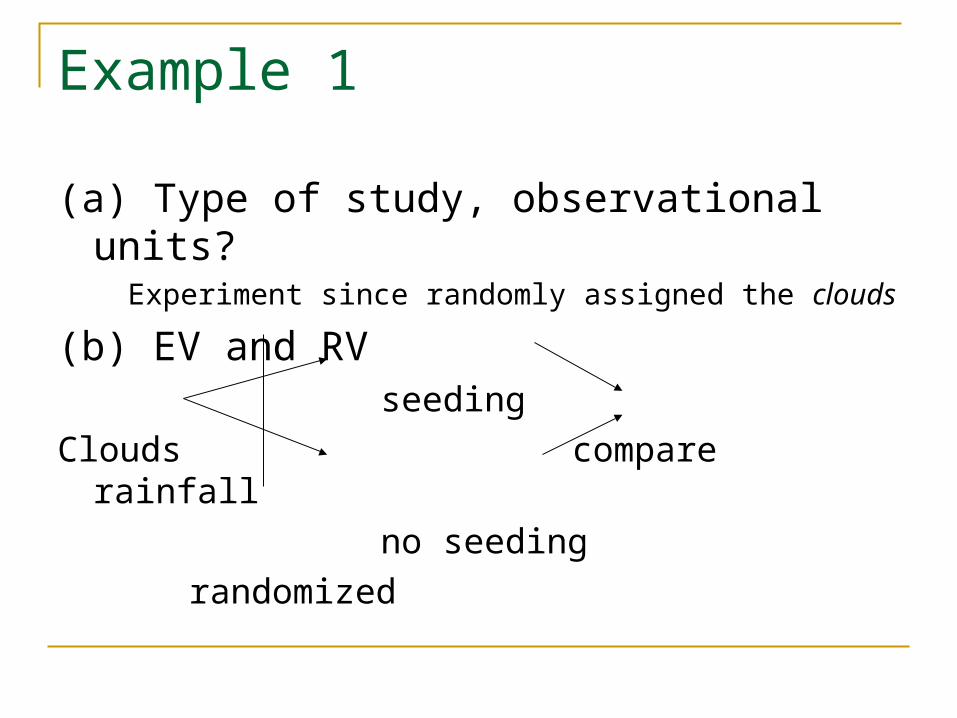
Example 1
(a) Type of study, observational units?Experiment since randomly assigned the clouds
(b) EV and RVseeding
Clouds compare rainfall
no seeding
randomized

Example 1
With a quantitative response variable, can compare the groups through parallel dotplots
What to look for
Center
Spread
Shape
Unusual observations

Numerical Summaries
Five number summaryVariable treatment Minimum Q1 Median Q3 Maximum
rainfall seeded 4 79 222 445 2746
unseeded 1.0 23.7 44.2 183.3 1202.6
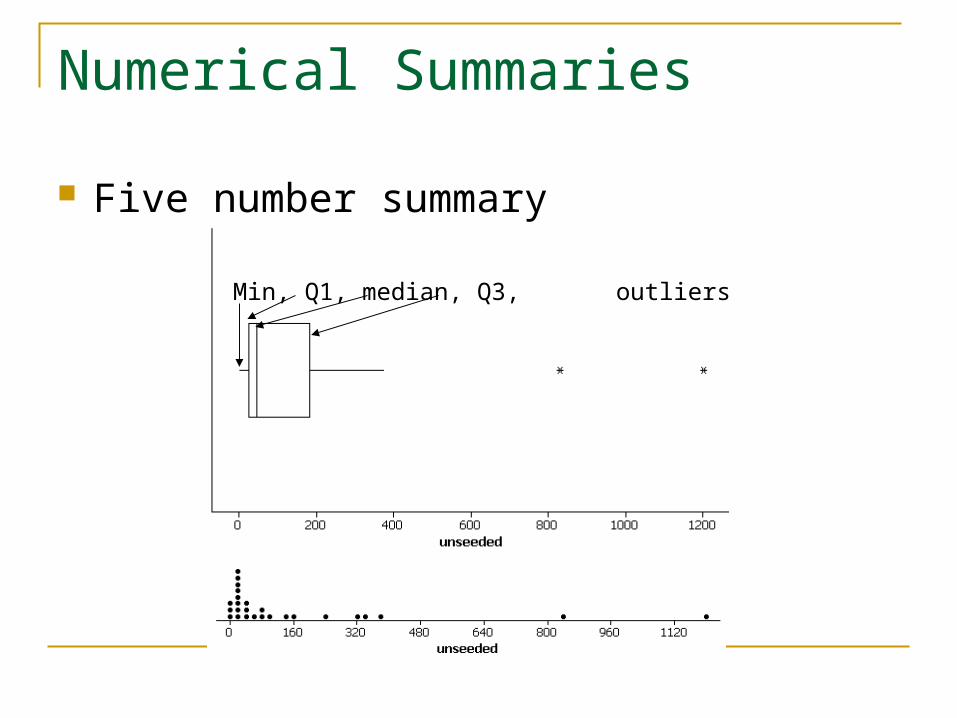
Numerical Summaries
Five number summary
Min, Q1, median, Q3, outliers
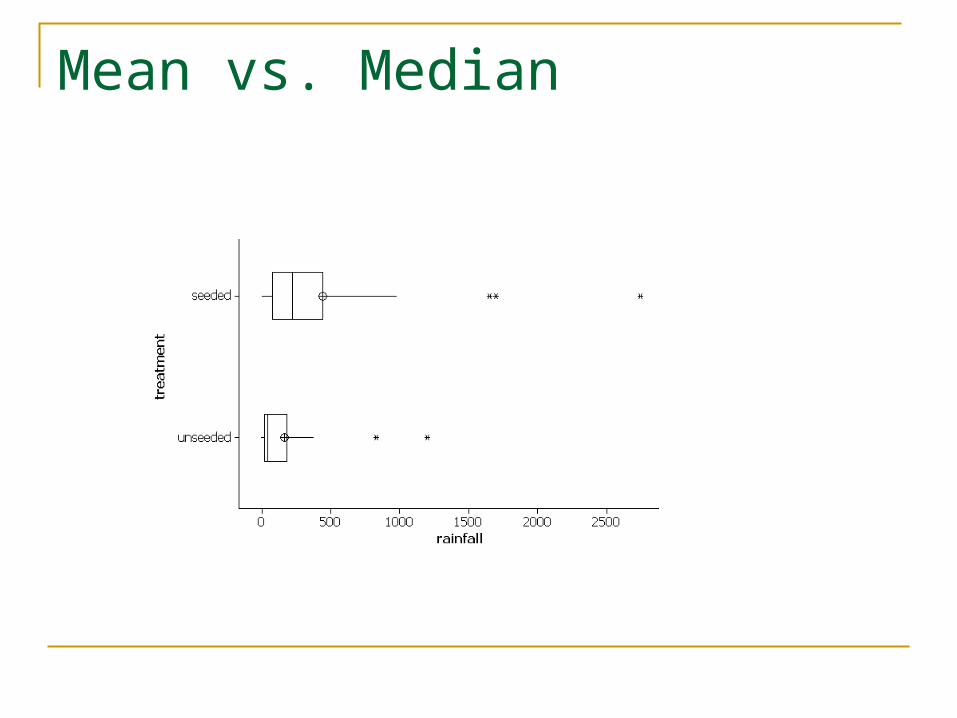
Mean vs. Median
Properties
The University of North Carolina took a survey of the students who had graduated as geology majors. In 1998, the average annual salary of geology majors who graduated from UNC was more than $500,000.
The next year it was less than $100,000.

Summary
Comparing the distribution of a quantitative variable between two or more groups Graphical summaries: (parallel) dotplots, boxplots,
side by side stemplots Center, spread, shape (skewed?), outliers
Numerical summaries Center: mean, median (five-number summary)
Mean = average of all values (not “resistant”) Median = “typical” value
Outliers: 1.5IQR criterion
x
Old Faithful
Histograms
Histograms
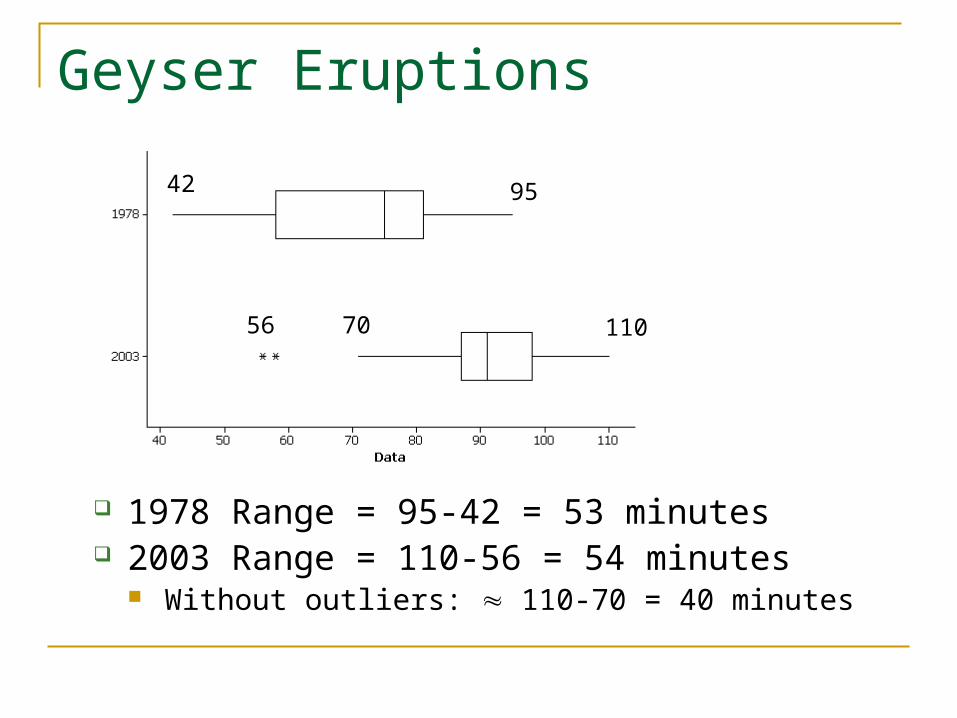
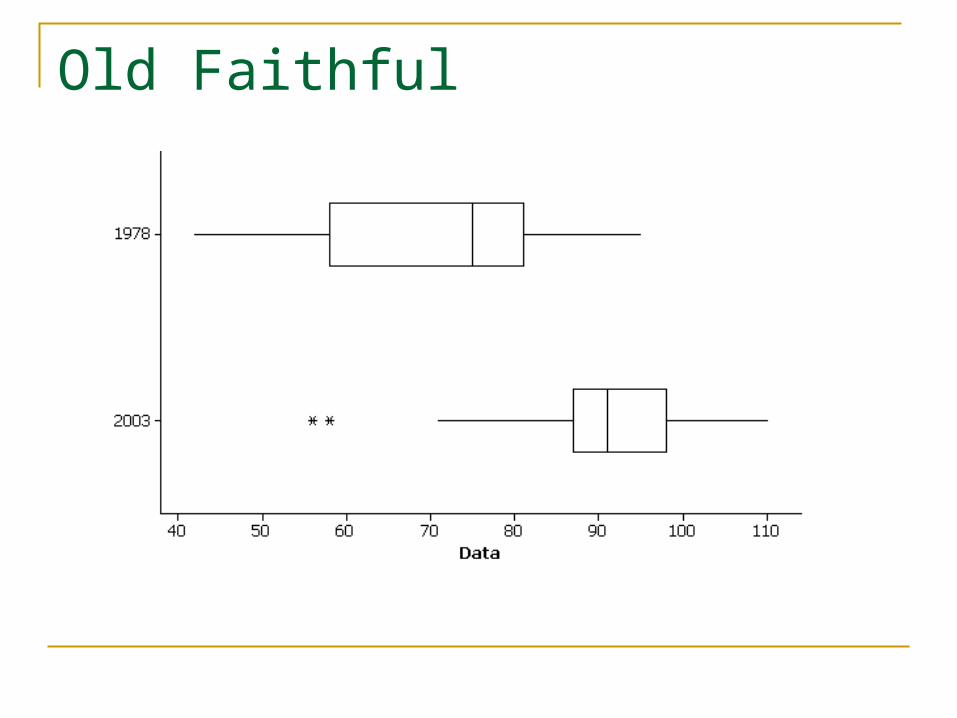
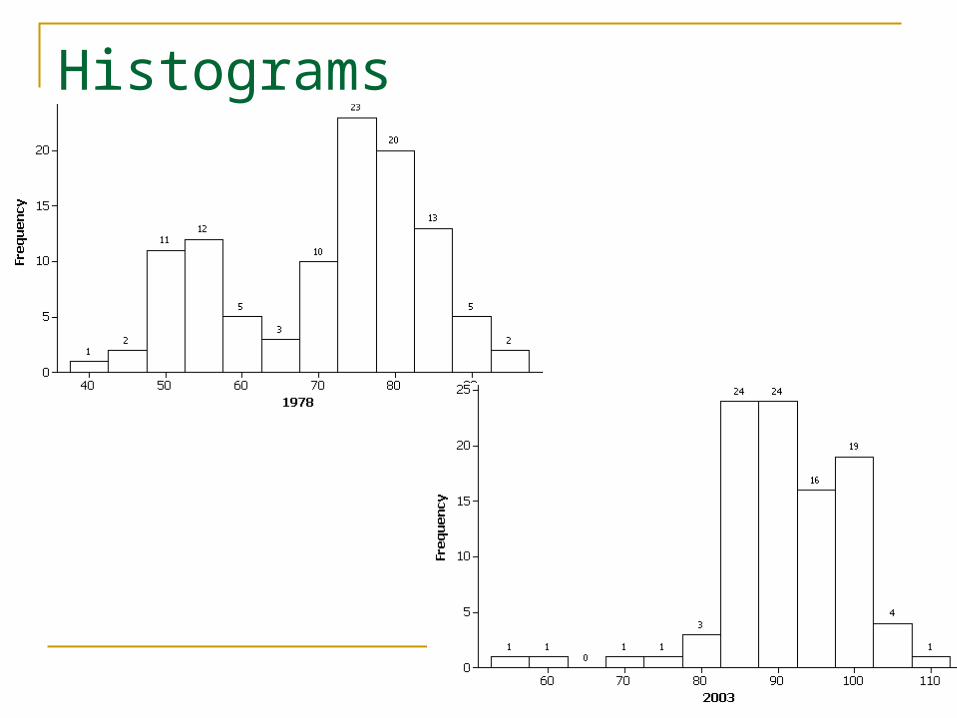
Geyser Eruptions
1978 Range = 95-42 = 53 minutes 2003 Range = 110-56 = 54 minutes
Without outliers: 110-70 = 40 minutes
9542
11056 70
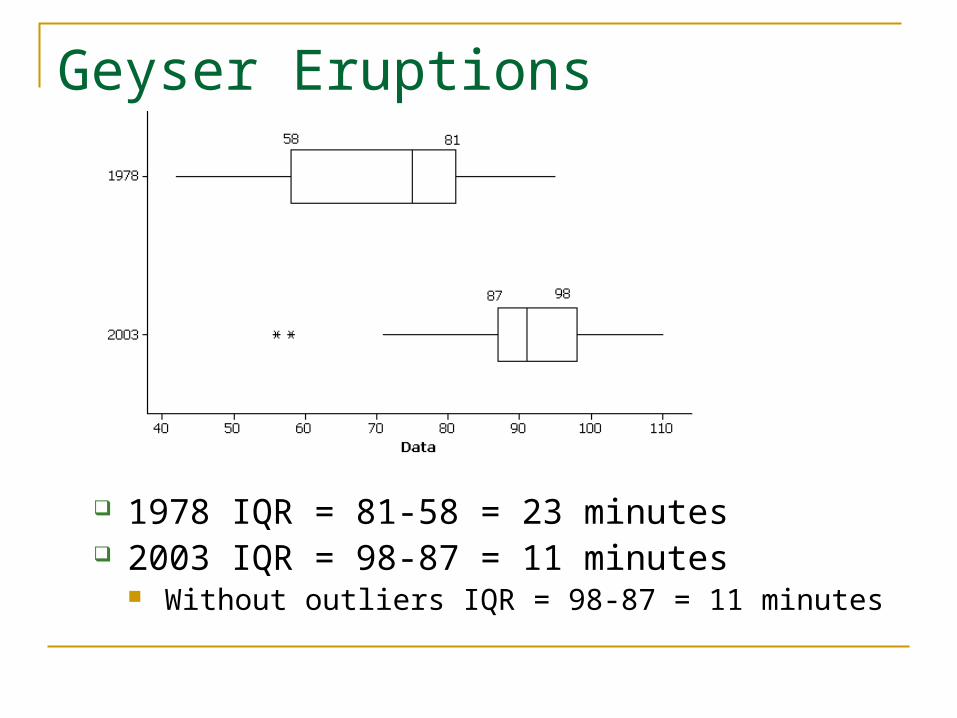
Geyser Eruptions
1978 IQR = 81-58 = 23 minutes 2003 IQR = 98-87 = 11 minutes
Without outliers IQR = 98-87 = 11 minutes

Standard Deviation
Want to compare the distance of the observations from the mean Deviation from mean: yi- Absolute deviations Squared deviations
1
)(1
2
2
n
xxs
n
ii
y
1
)(1
2
n
yys
n
ii
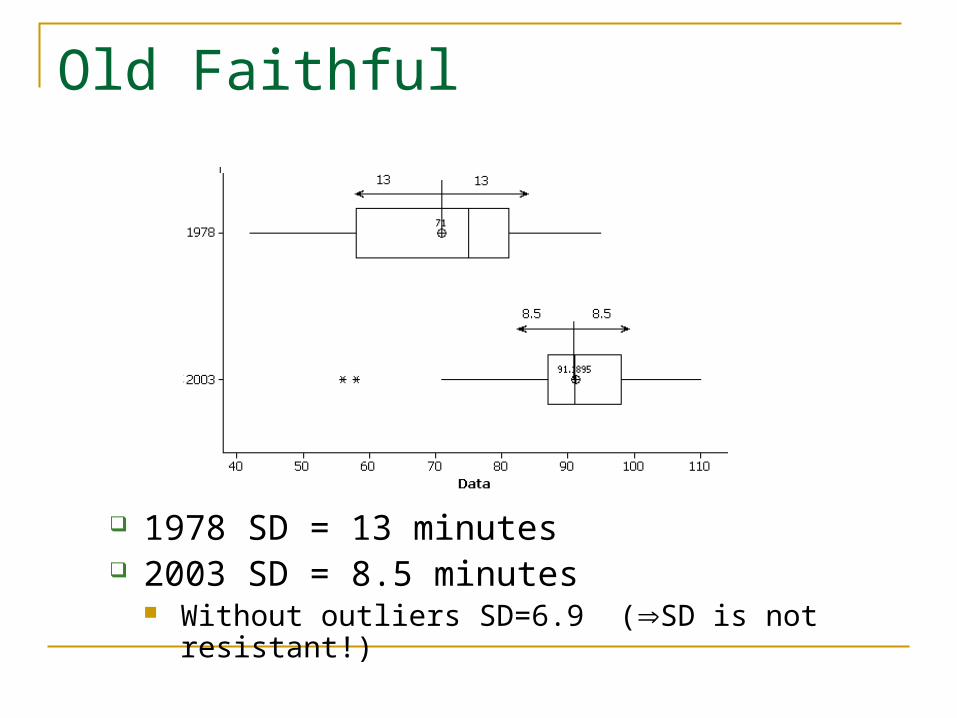
Old Faithful
1978 SD = 13 minutes 2003 SD = 8.5 minutes
Without outliers SD=6.9 (SD is not resistant!)

Example 3
What do we mean by variability?

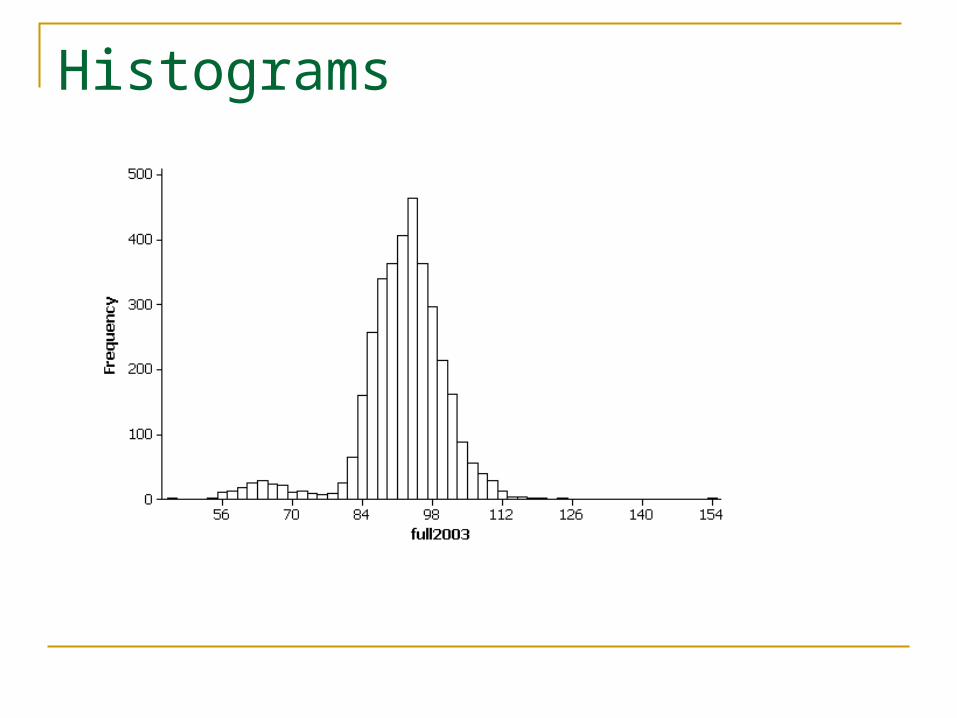
Notes on histograms
Left-hand endpoint rule Choice of interval widths
Also watch use of “even” in describing shape (flat vs. symmetric)
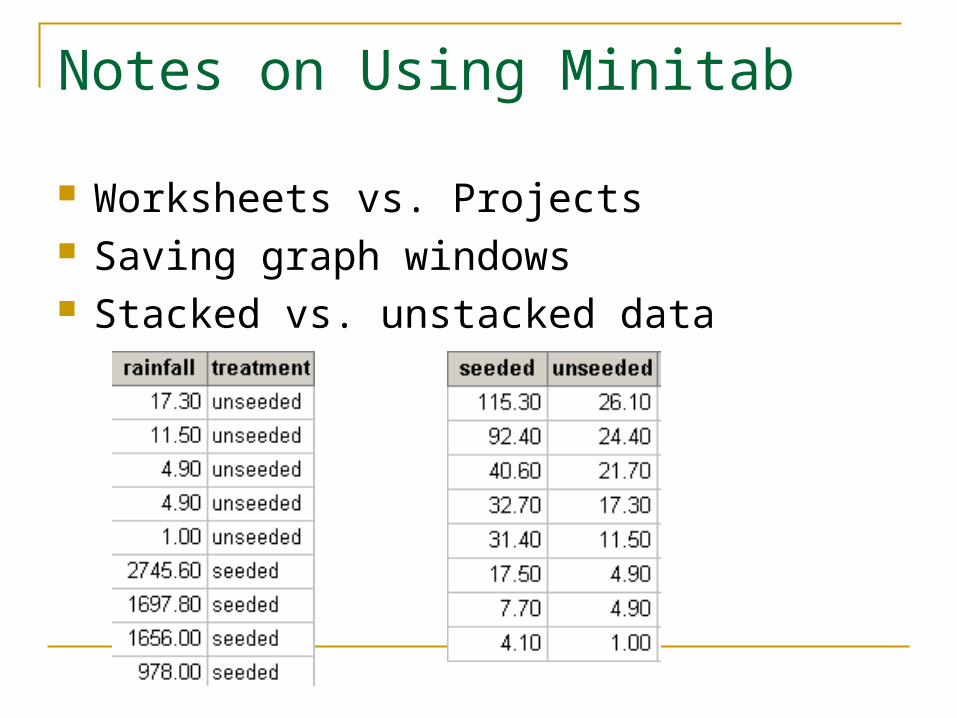
Notes on Using Minitab
Worksheets vs. Projects Saving graph windows Stacked vs. unstacked data

To Do
For Tuesday: PP 4 For Thursday: PP 5 and reading HW 3 by Friday
Heavy Minitab component Favor
Upcoming: Project proposal