stat 200 midterm exam ii (section 101)ugrad.stat.ubc.ca/~stat200/lang/midterm2solutions-101.pdfstat...
TRANSCRIPT

STAT 200 Midterm Exam II (Section 101)(Time: 50 minutes, Friday, November 10, 2006, 9:00 - 9:50am)
Name:
Student ID:
This exam is to be done with closed notes/books. One "cheat sheet" (8.5' x 11', two sided) isallowed. There are 5 problems, with a total of 100 points. Make sure you write your name andstudent [D. We prefer short answers without omitting key steps - you must show the key stepsfor Problems 3 - 5.
Problem 1 (15 pts). Circle the correct answer: true (T) or false (F).(1) 'vVemust know the approximate distribution of a statistic, which is used to estimate a pop-
ulation mean, in order to computer a confidence interval for that population mean. (!) F
(2) A t-distribution with small degree of freedom has heavier tails than the standard normal
distribution, but when the d~ee of freedom is large a t-distribution is very similar to the stan-dard normal distribution. l!J F
(3) Since there is sampling error in estimation, the sampling distrib~n has a standard de-viation which is larger than the population standard deviation. T <!.J
(4) If population, II has a larger true mean than population I, the sa~ mean from popu-lation II must be larger than the sample mean from population 1. T \!.)
(5) If a test is significant at 5% level, the probability of Ho being true is 0.05.
Problem 2 (36 pts). Circle the answer which is the closest to the correct answer (please chooseonly one answer).
(1). An engineer designs an improved light bulb. The previous design had an average life-time of 1200 hours. The new bulb had a lifetime of 1201 hours, using a sample of 2000 bulbs.Although the difference is quite small, the effect was statistically significant. The explanation is
~that new designs typically have more variability than standard designs.
b) that the sample size is very large.c that the mean of 1200 is large.d) all of the above.
(2) A simple random sample of size n is taken from a population with mean 10 and standard
deviation 5. If we use o~ half the sample, the mean of the sampling distribution of x would bea) 5 b) 10/0. (0to d) 2Jn/2
(3) The time it takes for a battery to fail is often not normally distributed. We select a simplerandom sample of 1000 batteries and compute the average of all the failure times. The sampling
distribution of this average may be approximated b~a) Binomial distribution b) uniform distribution 0normal distribution d) t distribution

(4). An agricultural researcher plants 25 plots with a new variety of corn. The average yield forthese plots is x = 150 bushels per acre. Assume that the yield per acre for the new variety ofcorn follows a normal distribution with unknown mean Il and that a 95% confidence interval forIl is fOund to be 150::1:3.29. Which of the following is true?a) A test of the hypotheses Ho : Il = 150 vs. Ha : Il =fi 150would be rejecLE'dat the 0.05 level.b) A test of the hypotheses Ho : Il = 150 vs. Ha : Il > 150 would be rejected at the 0.05 level.
fmA test of the hypotheses Ho : Il = 160 vs. Ha : Il =fi 160 would be rejected at the 0.05 level.\...d} All the above.
(5) In hypothesis testing, the term "significant difference" refers to(a) the difference between the critical value and the test statistic.
~ the difference between the sample standard deviation and the population mean.@the difference between the sample mean and the hypothetical population mean that leads to
the rejection of the null hypothesis.(d) none of the above.
(6) For a two-sample testing problem, if the mean of the first sample is greater than the meanof the second sample,(a) the null hypothesis must be false.(b) the alternative hypothesis must be false.
~ the mean of the first population must be greater than the mean of the second population.
~it is possible for the mean of the sampling distribution of differences to be equal to zero.
(7) If there is a statistically significant difference between the means of two populations,(a) the means of the two populations must be different.(b) the alternative hypothesis must be two-sided.(c) the alternative hypothesis must be one-sided.
JQ only one alternative hypothesis is possible.CjJ none of the above.
(8) In a hypothesis testing problem, the p-value tells usa) if the null hypothesis is true.
~if the alternative hypothesis is true.c he evidence against the null hypothesis.
the evidence against the alternative hypothesis.
(9) Consider testing Ho : 112- III = 0 versus Ha : 112- III =fi O. The 90% confidence interval for112- III is 14.6::1:7.80. Based on this confidence interval,
~ we would not reject the null hypothesisC?>'we would reject the null hypothesis of no difference at the 0.10 level
c) we would reject the null hypothesis of no difference at the 0.05 leveld) none of the above.
This table is for instructor use onlyProblem 1 Problem 2 Problem 3 Problem 4 Problem 5 Total Mark

Problem 3 (18 pts). In a large school, the time students spend on homework each week isnormally distributed with a mean of 15 hours and a standard deviation of 2 hours.
(a) (6 pts) The probability that a student spends at least 14 hours on homework iA..Q1JS { P (X~ \'t))For 100 randomly selected students, the average number of students who spend at least 14 hours
on homework is l1.V = .6Cf.15 , with a standard deviation of tin f (J-f) := -Jf,6-<. .
(b) (6 pts) For a group of 16 randomly selected students, what is the probability that the averagetime this group spends on homework in a given week is between 13 hours and 16 hours? (Assumethat each student works independently.)
r'\=:\b.
r C l3 <. X .<..lb )\ ~ -)S < ~ <
. P L .2/{16 <:
r
({,- l~).2/rT6
E:'t<2<2)
.::::- O. ~7,J.. -O\DOOJ.
~ D,~17(I
(c) (6 pts) For 100 randomly selected students, find an approximation to the probability that.!!lore than 40 Q..fthese students will need at least 14 hours on the homework (use continuitycorrection). .
f ( X >4-0 )- f (X;>.-+Dto,~)
-!J-!7S- 6q.~~ )>. . 4~ 6.;z,p. (.2
r(~ /. -6,J..D)
\ .

Problem 4 (18 pts). A researcher is interested in evaluating a "diet+exercise" program forweight loss. He randomly selects 20 students who are over-weight, and randomly assigns thesestudents into two groups, with 10 students in each group. Students in Group 1 will be on the"diet+exercise" program and students in Group 2 will be on the "diet only" program. For eachsubject, his/her weight is measured before he/she starts the program and after the end of theprogram, and the reduction in weight (before - after) is computed. The data approximatelyfollow a normal distribution. Part of the data and some summary statistics are shown below
ID12
Group 1 (diet+exercise)Before After
141 123129 125
Reduction184
ID12
Group 2 (diet only)Before After
132 133128 125
Reduction-13
10 139 128
sample mean X11= 135 X12 = 126sample SD 811= 15 812 = 11
pop. mean (SD) J.L11(0'11) J.L12(0'12)
11
Xl = 981 = 10J.Ll(0'1)
10 130 125
sample mean X21= 133 X22 = 128sample SD 821= 12 822 =9
pop. mean (SD) J.L2l(0'21) J.L22(0'22)
5
X2 = 5S2 = 11J.L2 (CT2)
(Note: ID = student ID number, SD = standard deviation, pop. = population. The sample means andsample standard deviations in the table8 are computed from the corresponding columns in the table. Inthe following questions, use the notation defined in the above table.)
(a) (6 pts) The 95% confidence interval for the average reduction in weight for students in the.
"diet+exercise" program (Group 1) is \~ q C r. ( CA- I J I:!)X :i. ~. y~ :::. c:r:i. :2.}6~*. l'W =- .t lIs ~- . .. t-O~.I lb, .
(b) (6 pts) Is there strong evidence that students in theweights? State your hypotheses and test the hypotheses.
\-\-0 ~ ).tt:. (). \/C ~lA ~ p,.:> u
"diet only" (Group 2) program lose
S-Dq / (', 0
':::. \, -+4- .
~ r (J(tt) :> k¥~')
~) fJ..US <. 'f - ~ <: (), lO
S6W'€.' €/V, ~(.Q. ~.~. yo yo"t .lAe tli.c!(A£*J U"\'\ \'~ ~ l) tvt-. ~~~ ~. ht.-k. lVJ)- ~ ~G!
(c) (6 pt~) Is there strong evidence that stud~nts in the "di . " 0 .more weIghtsthan those in the "diet only
"(G
et+exerclse program (Group 1) loseprogram roup 2)?
r-v~
The hypotheses to be tested are: (.h, ~ ..1L I -::;.)1t " \{( ~t\ ~
The value of the test statistic and its degrees of freedom are X; -Xl..
\A., >A t
- 0.. &-S06 . df=..1.,..,,, ""-"2-
~ (Yeso~o)Is the above result statistically significant at 1% level?
X'l - X~
4
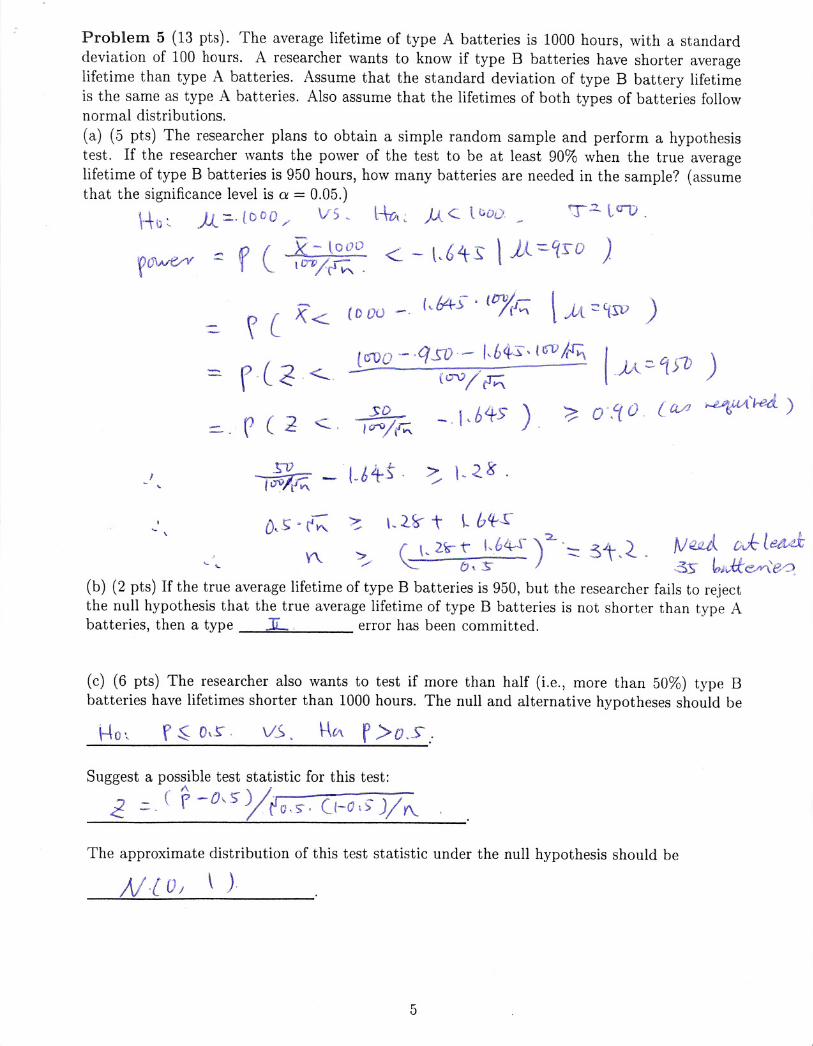
Problem 5 (13 pts). The average lifetime of type A batteries is 1000 hours, with a standarddeviation of 100 hours. A researcher wants to know if type B batteries have shorter averagelifetime than type A batteries. Assume that the standard deviation of type B battery lifetimeis the same as type A batteries. Also assume that the lifetimes of both types of batteries follownormal distributions.
(a) (5 pts) The researcher plans to obtain a simple random sample and perform a hypothesistest. If the researcher wants the power of the test to be at least 90% when the true averagelifetime of type B batteries is 950 hours, how many batteries are needed in the sample? (assumethat the significance level is O!= 0.05.)
\-\-u:. ~=-.{OOO/ VS~
- f (k - lovo
Vowerv' -. ID'V/~ .
l~ ~ .M. <. t (;00. -
< - l.6~s \». ~~S-D )
-~ C )(<-
f . ( ~ . <-.
r (2 <..
(0 DO -. 1..645""' (/}'VI-leJ""
I~ ..
~ . .~--~ - t-b4-~.
D S . {'~ ~ \~ 2&-- t \~ blf-~
, .. Y\. > (\. 2r t" ",64--,[)2. '::: 31-.~. tVeJUt M L~'- .. ,;< '-:: tJ \ ~ 35 ~JJte-v\~
(b) (2 pts) If the true average lifetime of type B batteries is 950, but the researcher fails to rejectthe null hypothesis that the true average lifetime of type B batteries is not shorter than type Abatteries, then a type JL, error has been committed.
,'-
\
(c) (6 pts) The researcher also wants to test if more than half (Le., more than 50%) type Bbatteries have lifetimes shorter than 1000 hours. The null and alternative hypotheses should be
v.s. r >O.S:
Suggest a possible test statistic for this test:
~ =.( r -o,s Yr'o,s-. ((-0 IS"J/Y\.
The approximate distribution of this test statistic under the null hypothesis should be
\ ).
5