start-up of anaerobic bioreactors on high strength industrial wastes
TRANSCRIPT

Biomass 13 (1987) 173-197
Start-up of Anaerobic Bioreactors on High Strength Industrial Wastes
S. M. S t r o n a c h , a T. R u d d b a n d J. N. L e s t e r a*
a Public Health Engineering Laboratory, Civil Engineering Department, Imperial College, London, SW7 2BU, UK
b Consultants in Environmental Sciences Ltd, 63 Croydon Road, London, SE20 7TW, UK
(Received 5 May 1987; revised version received 4 July 1987; accepted 8 July 1987)
ABS TRA CT
Anaerobic filters, anaerobic fluidized beds and upflow anaerobic sludge- blanket (UASB) reactors were started up on two types of pharmaceutical waste; anaerobic fluidized beds were also started up on glucose, fruit processing, soft drink manufacturing and pharmaceutical wastes. Flui- dized beds proved superior to UASB reactors and filters in COD removal capacity and pH stability during start-up, although methane production was greatest in the UASB systems. The industrial wastes proved recal- citrant to anaerobic conversion as they contained substances inhibitory to microorganisms but loadings of up to 7"5 kg COD m -3 day -1 could be applied with a COD removal of 78% achieved. The types of volatile acids produced in four of the units were found to relate closely to substrate composition.
Key words: Start-up, anaerobic fluidized beds, anaerobic filters, UASB reactors, industrial wastes, volatile acids.
I N T R O D U C T I O N
Th e efficiency of anaerobic digestion opera t ions depends to a great extent on the nature of the waste s t ream under treatment. T he sources of industrial effluents are diverse in compos i t ion and f low rates, and of ten variable in diurnal and seasonal characteristics. 1 Additionally, waste s treams may be segregated or mixed at source, depending u p o n their
* To whom all correspondence should be addressed. 173
Biomass 0144-4565/87/S03.50- © Elsevier Applied England, 1987. Printed in Great Britain
Science Publishers Ltd,

174 S. M. Stronach, T. Rudd, J. N. Lester
natures and the processes from which they arise. Chemical industry processing streams for example, may require pretreatment before mixing with the mainstream. 2 Food wastes are highly variable in content and are frequently seasonal in output. The specific composition of pharmaceuti- cal wastes is often difficult to obtain as a consequence of the industrial restrictions imposed upon the availability of data. However, industrial effluents frequently contain high concentrations of soluble organic matter which is potentially very suitable for high rate anaerobic conver- sion processes.
The microorganisms in anaerobic fluidized bed systems attach as a film around inert media particles such as sand, which is fluidized by a high vertical velocity achieved by high recycle flow. 1,3 Each single media grain does not have a fixed position within the bed and is not in contact with its neighbour, thus providing a high specific surface area for biomass growth. Fluidized beds have been used to treat a variety of industrial wastes including meat, dairy, chemical, whey permeate and soft drink bottling wastewaters. 4,5 Loading rates of up to 20 kg COD m- 3 day- 1 have been achieved. 6
The wastewater in the anaerobic filter reactor can pass the system in either upflow or downflow mode. 1 The microorganisms in the reactor attach to inert media which can be polyvinyl chloride, clay, polyester or gravel, 7-9 or become entrapped, existing as flocs between the media particles. Recycle is generally not included in the upflow system, i.e. plug flow is maintained, but the gas bubbles produced during reactor opera- tion tend to stir up flow. 1 Filters may block if very small media are employed; to minimize this, filter media should have diameters greater than 2-0 cm. 1 This results in lower specific surface areas for bacterial colonization than are possible in the fluidized bed. Anaerobic filters have been used in the treatment of molasses, pharmaceutical and vegetable processing wastes.1°.~
The microorganisms of the upflow anaerobic sludge blanket (UASB) reactor develop as a flocculant mass in the upward-flowing wastestream. The biomass is retained in the system by its own weight and by baffles, screens or a cone-shaped separator in the upper portion of the reactor vessel) The biomass occurs as compact pellets or granules up to 3-4 mm in diameter, which develop by a mechanism not yet fully understood. ~ 2.13 Larger granules form the sludge bed or lower portion of the reactor, above which the sludge blanket, consisting of smaller granules, flocs and gas bubbles, develops. A number of wastestreams including sugar beet, dried fruit processing and alcohol-containing effluents 14a5 have been applied to UASB reactors.
One of the few significant drawbacks in anaerobic treatment of wastewaters is the difficulty of start-up procedures, which can be time-

Start-up of anaerobic bioreactors 175
consuming and unproductive) The major problem frequently concerns the establishment of the most suitable microbial population for the waste to be treated, especially where the waste is a complex and recalcitrant industrial stream. Reactor operation is usually stable once the biomass is established. 16 Adequate seeding of the reactor is critical, as the growth rates of anaerobic microorganisms tend to be slow. Fixed film systems such as the anaerobic filter or fluidized bed require a seed of at least 10% of the reactor volume while suspended growth systems such as the UASB require an inoculum of about 30% reactor volume. 16 Use of a seed sludge from a reactor treating a similar waste will increase the rate of start-up. 12 Reseeding may be necessary during the start-up phase, and the provision of trace elements such as metals has been reported to improve operation.~4-16
One synthetic and four industrial wastes were used in the current study. Two pharmaceutical wastes were provided by a therapeutic chemicals manufacturer. The principal constituent of one was n- propanol and the second contained 30% dimethylformamide (DMF). A soft drinks manufacturing effluent was obtained from a factory produc- ing concentrated and carbonated soft drinks. The daily effluent volume of the factory is dependent upon production line start-up, spillages and clean-down operations, and is pumped to a pH correction tank before discharge to the municipal works. A wastewater from a fruit processing factory situated near the soft drinks outlet was also used. This factory produces jam and fruits for pie fillings and yoghurt manufacture, and effluents arise from plant washouts at the end of production runs, spil- lages, rewashing of containers and cooling waters from a vacuum jam- production operation. The wastewater is screened to remove solids, and the pH is corrected before discharge to the local sewage treatment works. The study presented here describes (a) the progress of start-up in anaerobic fluidized beds, anaerobic filters and UASB reactors treating pharmaceutical effluents and (b) the progress of start-up in anaerobic fluidized beds treating fruit processing, soft drinks manufacturing, pharmaceutical and glucose-based synthetic wastewaters.
MATERIALS AND METHODS
Anaerobic reactors
Fluidized beds Two of the laboratory scale fluidized bed reactors used were 4 litres in volume; their design and construction have been fully described else- where. 4 The biomass support matrix consisted of sand particles 0"22 mm

176 S. M. Stronach, T. Rudd, J. N. Lester
diameter and each reactor contained an unfluidized bed volume of 2 litres. The recycle flowrate was adjusted to provide a bed expansion of 20%, giving an expanded bed volume of 2.4 litres and temperature was maintained at 36 + 1 °C using heating belts. A schematic representation is shown in Fig. l(a).
Four smaller 2 litre fluidized beds were also employed. These have been described by Stephenson and Lester 17 and a schematic layout is shown in Fig. l(b). Each reactor contained 1 litre of sand and the upflow velocity was adjusted to achieve a bed expansion of 30%. Reactor temperature was maintained at 36 + 2°C by immersing a 2 m length of tubing on the recycle loop in a water bath.
Anaerobic filters Anaerobic filters were constructed from extruded acrylic tubing of 1 m in height, 8"8 cm i.d. and 0.6 cm wall thickness (Fig. l(c)). The detachable solid acrylic base, 7.5 cm in height, was machined internally to a conical shape to facilitate an even upward distribution of the waste. A perforated acrylic dispersion plate was fixed above the cone to support the media bed and allow passage of the influent. The base was attached to a Perspex collar around the reactor body by a rubber gasket seal, screw and wingnut arrangement. Dispersion rings, 5 mm thick and 2 mm wide, were attached inside the reactor body at heights of 0.3 and 0.6 m to prevent short circuiting at the media/column boundary. A steel influent pipe of 7 mm i.d. was let into the base of the reactor and bent downwards through 90 ° into the cone to assist influent dispersion. The detachable. top of the filter comprised a flat plate 15 cm in diameter attached to a collar around the reactor body by a rubber gasket seal, screw and wingnut arrangement. Gas and effluent left the filter 4 cm from the top to the overflow chamber, 34 cm in height, 5 cm i.d., where treated effluent was removed to waste and the gas was collected by displacement of acidified water. Effluent samples were removed by a three-way stopcock inserted into the effluent tubing, 0"5 m from the effluent port. Sampling ports were set into the reactor body at 20 and 50 cm from the base. The media consisted of particles of 'Lytag', a lightweight rocky aggregate, with diameters in the range 5-13 mm (Lytag Ltd, Tilbury, Essex, UK). The media rested on the dispersion plate and reached a height of 0.82 m, providing 5 litres of active volume. Heating belts were used to maintain the temperature at 36 + I°C.
Sludge blanket reactors The upflow anaerobic sludge blanket (UASB) reactors were similar to the filters, but with the following differences: the dispersion plate was

Start-up of anaerobic bioreactors 177
[]
2
4?
8
I--
8 q
2
[]
~ 4
5
iliiil
_1_ / - -
6
1 fluidised bed
2 waste vessel
3 feed pump
4 recycle chamber
5 recycle pump
6 overflow chamber
7 effluent gases
8 treated effluent
1 f luidised bed
2 waste vessel
3 feed pump
4 U - t u b e
5 heated water bath
$ recycle pump
7 effluent gases
8 treated eff luent
[ ]
1
2
3 1 waste vessel
2 feed pump
3 anaerobic filter
4 overflow chamber
5 elfluent gas
6 treated waste
3
1 iiiiiiii! • ~ ' - 2 iiiiiiiiiiiiii~
, 5
1 waste vessel
2 feed pump
3 upHow anaerobic sludge blanket
4 overflow chamber
5 eLquent gas
6 treated waste
Fig. 1. Schematic layouts of anaerobic bioreactors. (a) 4-1itre anaerobic fluidized bed; (b) 2-1itre anaerobic fluidized bed. (c) anaerobic filter; (d) upflow anaerobic
sludge-blanket.

178 S. M. Stronach, T. Rudd, J. N. Lester
omitted, resulting in a base height of 7.0 cm; the dispersion rings were omitted; a support ring 5 mm wide and 2 mm thick was incorporated into the body of the reactor at a height of 80 cm to support a conical liquid/solids separator; support media were not used and sampling ports were set into the reactor 10, 25 and 45 cm from the base [Fig. l(d)]. The solids/liquid separator consisted of an inverted polyacrylamide cone, with a 60 ° wall angle and slots 0.5 x 2 cm cut along the widest edge, 1 cm from the rim. An opening of 5 mm in the upper part of the cone per- mitted effiux of gas and liquid while the angled walls of the cone enhanced the settling of the solid granules, thus retaining them in the reaction vessel. Heating belts were used to maintain the temperature at 36 + I°C.
Seeding of reactors
The 4-1itre fluidized bed systems were filled with a 1:1 water and feed solution at the first feed dilution (1302 mg COD litre-l) to be used. The beds were then fluidized and injected with 40 ml anaerobically digested sludge from a municipal digester. A small inoculum volume was applied as this had proved successful in the start-up of similar fluidized bed systems. 18,~9 The use of seed from a digester treating a similar waste has been recommended as an aid to start-up, 12 but this was not available during the current study. The reactors were run in closed circuit for 2 days to encourage biomass attachment.
The 2-1itre fluidized beds were filled with filtered supernatant liquor from municipal secondary sludge digesters. The beds were then fluidized and run in closed circuit for 3 days before feeding commenced.
The two anaerobic filters were filled with a 1 : 1 mixture of water and the appropriate feed at the initial dilution, and seeded to 10% of their active volume with 500 ml anaerobically digested municipal sewage sludge. This seed volume has been recommended as suitable in one anaerobic filter study, 2° although another group used a 30% volume of seed inocu lum. 9 However, although large volumes of seed aid filter start- up by providing large microbial populations and promoting adhesion and flocculation, Young 21 concluded that such large volumes may cause media plugging and reduce effectiveness. Both filters were left in closed circuit for 2 days before feeding commenced.
The UASB reactors were each filled with a 1:1 water and waste solution and seeded at 10% of their active volume with a granulated biomass obtained from pilot scale UASB reactors operating on paper- mill effluent and kindly supplied by C. Davidson & Sons, Mugiemoss Mills, Aberdeen, Scotland, UK. The well-developed granules were

Start-up of anaerobic bioreactors 179
approx. 2 mm in diameter, with a specific gravity in excess of 1.0. Granu- lated seed was used, as granulation is generally considered the most diffi- cult and time-consuming part of UASB start-up and several studies have dealt with the problem. 12,13 These reactors were also left in closed system for 2 days.
Wastewater characteristics
Both pharmaceutical wastes made available for this study originated as aqueous filtrates from the manufacture of therapeutic chemicals. The major characteristics of the effluents are given in Table 1. These wastes were stored in polythene containers, transferred to 10-1itre aspirators and diluted with distilled water to the appropriate COD concentration as required. Both wastes were fully soluble and contained negligible suspended solids.
TABLE 1 Composition of Industrial Effluents Treated by Anaerobic Bioreactors
Waste Principal characteristics
concentration (mg litre- ~)
Pharmaceutical Water waste A n-propanol (aqueous filtrates) NaCI
COD NH3-N Total P pH
Pharmaceutical Water waste B dimethylformamide (aqueous filtrates) NaCI
COD NH3-N Total P pH
Soft drinks Suspended solids manufacturing COD
pH
Fruit processing Suspended solids COD pH
4950 174000
147 51
5"0
30% 4 125
325 000 15
Not detectable 6.0
160-360 9 000-15 000
3.7-6.7
180-520 5 800-13 100
4.0-7.4
180 S. M. Stronach, T. Rudd, J. N. Lester
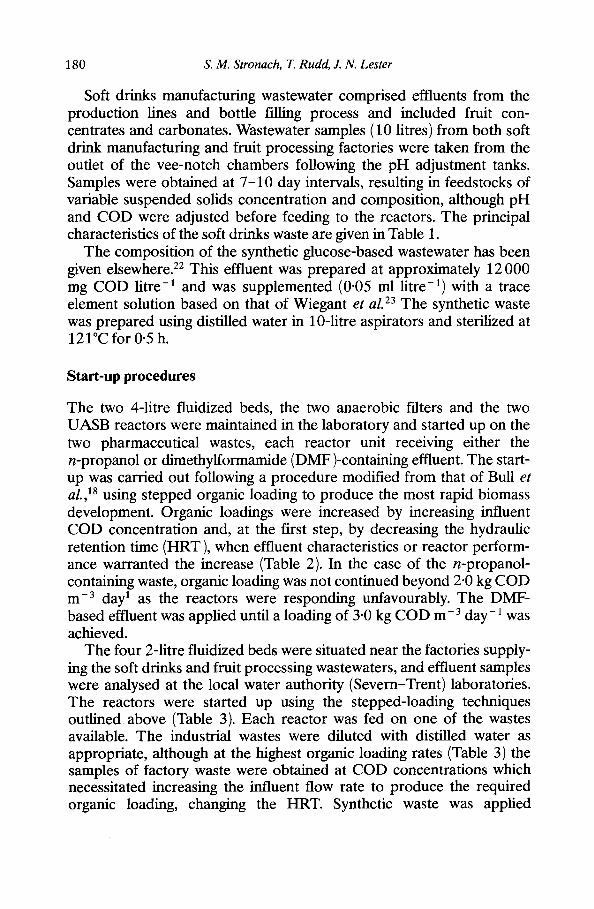
Soft drinks manufacturing wastewater comprised effluents from the production lines and bottle filling process and included fruit con- centrates and carbonates. Wastewater samples (10 litres) from both soft drink manufacturing and fruit processing factories were taken from the outlet of the vee-notch chambers following the pH adjustment tanks. Samples were obtained at 7-10 day intervals, resulting in feedstocks of variable suspended solids concentration and composition, although pH and COD were adjusted before feeding to the reactors. The principal characteristics of the soft drinks waste are given in Table 1.
The composition of the synthetic glucose-based wastewater has been given elsewhere. 22 This effluent was prepared at approximately 12 000 mg COD litre -1 and was supplemented (0-05 ml litre -1) with a trace element solution based on that of Wiegant et al. 23 The synthetic waste was prepared using distilled water in 10-1itre aspirators and sterilized at 121°C for 0.5 h.
Start-up procedures
The two 4-1itre fluidized beds, the two anaerobic filters and the two UASB reactors were maintained in the laboratory and started up on the two pharmaceutical wastes, each reactor unit receiving either the n-propanol or dimethylformamide (DMF)-containing effluent. The start- up was carried out following a procedure modified from that of Bull et
al. , 18 using stepped organic loading to produce the most rapid biomass development. Organic loadings were increased by increasing influent COD concentration and, at the first step, by decreasing the hydraulic retention time (HRT), when effluent characteristics or reactor perform- ance warranted the increase (Table 2). In the case of the n-propanol- containing waste, organic loading was not continued beyond 2.0 kg COD m -3 day 1 as the reactors were responding unfavourably. The DMF- based effluent was applied until a loading of 3.0 kg COD m -3 day-1 was achieved.
The four 2-1itre fluidized beds were situated near the factories supply- ing the soft drinks and fruit processing wastewaters, and effluent samples were analysed at the local water authority (Severn-Trent) laboratories. The reactors were started up using the stepped-loading techniques outlined above (Table 3). Each reactor was fed on one of the wastes available. The industrial wastes were diluted with distilled water as appropriate, although at the highest organic loading rates (Table 3) the samples of factory waste were obtained at COD concentrations which necessitated increasing the influent flow rate to produce the required organic loading, changing the HRT. Synthetic waste was applied

Start-up of anaerobic bioreactors 181
TABLE 2 Operational Parameters of Six Anaerobic Reactors Starting up on N-Propanol-
containing (A) and Dimethylformamide-containing (B) Pharmaceutical Wastes
Reactor Waste Days Organic loading Influent HRT Feed Flow (kg COD m- 3 day- i) COD (days) rate
(mg litre- ~) (litre day- 9
Anaerobic A 0-16 0.75 1302 1.74 2.88 filter 17-47 1.50 1500 1.00 5"00
48-69 2.00 2 000 1-00 5.00
Anaerobic B 0-16 0.75 1 302 1-74 2.88 filter 17-47 1.50 1 500 1-00 5.00
48-64 2.00 2000 1-00 5.00 65-75 3.00 3 000 1.00 5.00
UASB A 0-6 0-75 1 302 1.74 2.88 7-17 1-50 1 500 1.00 5.00
18-50 2.00 2 000 1.00 5-00
UASB B 0-6 0.75 1 302 1-74 2.88 7-17 1.50 1 500 1.00 5.00
18-34 2.00 2 000 1.00 5.00 35-50 3.00 3 000 1.00 5.00
Fluidized A 0-16 0-75 1 302 1.74 2.88 bed 17-47 1.50 1 500 1.00 5-00
48-69 2.00 2 000 1-00 5-00
Fluidized B 0-16 0.75 1302 1-74 2-88 bed 17-47 1.50 1500 1-00 5.00
48-64 2.00 2 000 1.00 5.00 65-75 3.00 3 000 1.00 5-00
undi luted to the fluidized bed to prevent deter iorat ion of the feed. A low flow rate and hence an extended H R T were employed to produce the required organic loading rate.
Analytical procedures
Concent ra t ions of C O D and suspended solids were de termined accord- ing to s tandard methods. 24,25 The pharmaceut ical wastes were analysed for chloride, ammonia -n i t rogen and total phosphorus by s tandard methods. 26 Concent ra t ions of suspended solids, total volatile acids and C O D in the effluent s t ream were measured daily. 24,25,27 Tempera ture and p H were also measured daily and effluent gas composi t ion in the labora- tory-based reactors was assessed periodically using the procedures of
182 $. M. Stronach, T. Rudd, J. N. Lester
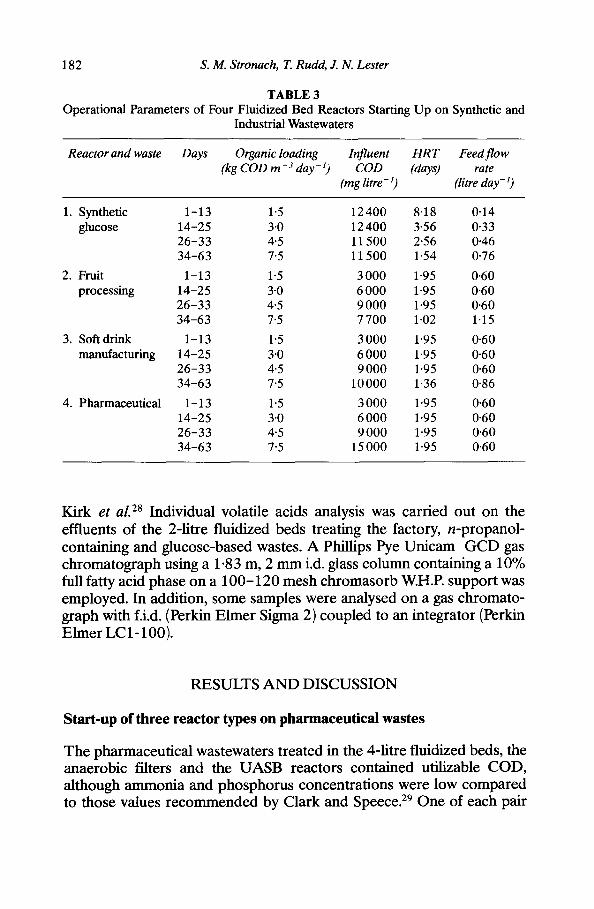
TABLE 3 Operational Parameters of Four Fluidized Bed Reactors Starting Up on Synthetic and
Industrial Wastewaters
Reactor and waste Days Organic loading lnfluent HRT Feed flow (kg COD m -3 day -I) COD (days) rate
(rag litre- i) (litre day- 9
1. Synthetic 1-13 1.5 12400 8.18 0.14 glucose 14-25 3.0 12400 3-56 0.33
26-33 4-5 11500 2.56 0-46 34-63 7.5 11500 1.54 0-76
2. Fruit 1-13 1-5 3000 1.95 0.60 processing 14-25 3-0 6 000 1.95 0.60
26-33 4.5 9000 1.95 0.60 34-63 7.5 7700 1.02 1.15
3. Soft drink 1-13 1"5 3000 1.95 0-60 manufacturing 14-25 3.0 6 000 1.95 0-60
26-33 4.5 9 000 1.95 0.60 34-63 7"5 10000 1.36 0.86
4. Pharmaceutical 1-13 1-5 3 000 1.95 0.60 14-25 3-0 6 000 1.95 0.60 26-33 4.5 9 000 1.95 0.60 34-63 7.5 15000 1.95 0.60
IClrk et aL 28 Individual volatile acids analysis was carr ied out on the effluents of the 2-1itre fluidized beds treating the factory, n-propanol- containing and glucose-based wastes. A Phillips Pye Unicam G C D gas ch romatograph using a 1"83 m, 2 m m i.d. glass co lumn containing a 10% full fatty acid phase on a 1 0 0 - 1 2 0 mesh chromasorb W.H.P. suppor t was employed. In addition, some samples were analysed on a gas chromato- graph with f.i.d. (Perkin E l m e r Sigma 2) coupled to an integrator (Perkin E lmer LCI-100) .
RESULTS A N D D I S C U S S I O N
Start-up of three reactor types on pharmaceutical wastes
T h e pharmaceut ica l wastewaters t reated in the 4-1itre fluidized beds, the anaerobic filters and the U A S B reactors conta ined utilizable COD, al though ammonia and phosphorus concentra t ions were low compared to those values r e c o m m e n d e d by Clark and Speece. 29 O n e of each pair

Start-up of anaerobic bioreactors
TABLE 4 Operational Performances of Two Anaerobic Filters During Start-Up on N-Propanol-containing (A) and Dimethylformamide-containing (B)
Pharmaceutical Wastewaters
183
Filter Days a Mean Mean Mean total Mean pH suspended volatile acids % removal
solids (rag litre- i) COD (mg litre- l)
A
B
0-6 6-97 127 115 54 7-13 6"76 107 160 44
14-20 6.51 62 184 48 21-27 5-98 81 150 40 28-34 6"47 85 98 44 35-41 5"78 100 141 34 42-48 5"83 91 194 40 49-55 5"99 123 233 35 56-62 5"89 148 228 28 63-69 6"05 136 213 32
0-6 7"92 69 63 57 7-13 8"40 44 107 41
14-20 8"51 48 116 47 21-27 8"58 35 92 43 28-34 8"70 40 80 45 35-41 7'59 43 107 43 42-48 7"13 120 141 48 49-55 7-37 88 114 55 56-62 7"20 88 116 56 63-69 7"59 113 104 54 70-75 b 7"57 118 135 54
a Mean values of 7 days. b Mean values of 6 days.
of reactors was fed with the n-propanol-conta in ing waste and the other with the DMF-conta in ing waste to provide a compar i son be tween the anaerobic systems as well as be tween the wastewaters. Tables 4 - 6 summarize the pe r fo rmance of reactors th roughout start-up.
At the lowest loading rate (0.75 kg C O D m -3 day - l ) , the filters pe r fo rmed well, with total volatile acids (TVA) levels of less than 240 mg litre -1 and effluent suspended solids concentra t ions be low 150 mg l i tre- 1 (Table 4). T h e p H of the filter fed on the n -p ropano l -based waste varied by only one unit th roughout start-up. T h e second filter, utilizing DMF-conta in ing waste, exhibited a high p H level which was maintained th roughout the study. Table 2 indicates that the second filter achieved a

184 S. M. Stronach, T. Rudd, J. N. Lester
TABLE 5 Operational Performances of Two UASB Reactors during Start-up on N-Propanol-containing (A) and Dimethylformamide-containing (B)
Pharmaceutical Wastewaters
UASB Days ~ Mean Mean Mean total Mean pH suspended volatile acids % removal
solids (mg litre- I) COD (rag litre- 9
A 0 - 6 6"60 458 22 69 7-13 5"87 295 108 51
14-20 6-51 295 88 64 21-27 5"99 207 155 44 28 -34 5"87 164 225 33 35-41 6"10 146 204 36 42 -48 6'23 117 281 30
" 4 9 - 5 0 h 6"35 94 139 26
B 0 - 6 6"83 401 19 68 7 -13 7"08 243 45 59
14-20 7-35 153 37 61 21 -27 7-30 234 65 62 2 8 - 3 4 7"35 202 132 56 35-41 7"78 107 191 53 4 2 - 4 8 7"81 62 189 47 4 9 - 5 0 b 7"91 49 123 50
a Mean values of 7 days. b Mean values of 2 days.
greater final organic loading rate than the other in addition to a higher COD removal. Young 21 has observed that anaerobic filters are most sensitive to pH changes during start-up and that a decrease in pH to 6.5 or less can increase the time required for start-up. In the current study, the n-propanol-fed system exhibited a consistently low pH and achieved a lower final organic loading rate and percentage of COD removal than did the second filter (Table 4), Suggesting that low pH and low opera- tional efficiency were interrelated. Total volatile acids concentrations in the first filter were greater than those of the DMF-fed system but were comparable with those reported by Seeler and Jennett 3° during start-up, although the latter introduced pharmaceutical waste into their anaerobic filter systems gradually with sodium acetate, and then methanol as the initial substrates. Effluent suspended solids concentrations in the DMF- fed reactor were less than those observed in the n-propanol-fed system but both were in agreement with suspended solids values reported in other studies involving pharmaceutical wastes. 8,~°,3°

Start-up of anaerobic bioreactors
TABLE 6 Operational Performances of Two Anaerobic Fluidized Beds during Start-up on N-Propanol-containing (A) and Dimethylformamide-containing (B) Pharm-
aceutical Wastewaters
185
Fluidized Days a Mean Mean Mean total Mean bed pH suspended volatile acids % removal
solids (rag litre- 1) COD (mg litre- i)
A
B
0-6 6.98 90 65 69 7-13 6-72 75 129 39
14-20 6"72 68 160 49 21-27 6"77 89 134 42 28-34 7.07 91 109 53 35-41 6.78 138 88 48 42-48 7"00 106 188 38 49-55 7"02 113 255 41 56-62 6-92 144 214 39 63-69 7"16 188 199 40
0-6 7.22 100 35 75 7-13 7.21 49 49 58
14-20 7.13 41 58 52 21-27 7.14 61 62 54 28-34 7.23 48 62 55 35-41 7.21 39 51 53 42-48 7.16 48 81 47 49-55 7-52 62 115 54 56-62 7"44 83 121 58 63-69 7"84 76 174 50 70-75 b 7"48 64 184 51
a Mean values of 7 days. bMean values of 6 days.
T h e greatest dispari ty be tween the per formances of the two filters was in C O D removal efficiency (Table 4), resulting f rom the different natures of the two pharmaceut ica l wastes and the p H levels maintained in the systems. Partial degradat ion of p ropano l under anaerobic condit ions has been documented . 31 T h e convers ion of the n -propanol c o m p o n e n t of the feed to p rop iona te seems likely and p rop iona te has of ten been im- pl icated as a major cause of digester failure. 32,3a T he second filter, fed on DMF-conta in ing wastewater , r emoved m o r e than 50% of the C O D at the final loading rate of 3"0 kg C O D m -3 day -1 (Table 4). As this removal was mainta ined f rom the beginning of start-up, the waste either conta ined an undegradab le fraction, or some waste c o m p o n e n t was

186 S. M. Stronach, T. Rudd, J. N. Lester
depressing the activity of part of the microbial population. Gas produc- tion in both systems was erratic throughout (Fig. 2), but final levels of C H 4 achieved in the DMF-fed filter exceeded the C H 4 obtained in the other.
Organic loading to both UASB reactors was increased rapidly (Table 5), as COD removal efficiencies were initially high, probably due to the use of active granulated biomass as seed. Total volatile acids concentra- tions in both reactors were similar to those in the filters, being slightly lower in that reactor treating the DMF-containing waste. The pH levels in the n-propanol-fed UASB tended towards the acidic, whereas the pH values recorded for the second reactor were greater, although not exceeding 8.0. This suggested that the UASB was more stable than the filter system, with good buffering capacity being developed.
The suspended solids concentrations of both UASB units were initially almost four times greater than those in the filters (Table 5). However, as start-up progressed, the suspended solids levels in both reactors settled to levels lower than those of the packed bed reactors, indicating the good settleability of the biomass. The initial washout of material was attributed to the transition from the papermill waste upon which the granular sludge had been grown to the pharmaceutical waste. Washout is a common phenomenon during the start-up of UASB systems ~ and the retained sludge is usually of superior settleability.
The COD removal efficiency at the final loading rates (Table 5) in both UASB reactors mirrored that of the filters and was therefore prob- ably a function of wastewater composition rather than reactor operation. Initial C H 4 production in the sludge blankets was much greater than that observed in the other reactors (Fig. 2), but decreased as start-up progressed, and the effects of the waste on the biomass became more pronounced as organic loading increased. However, CH 4 production increased again towards the end of the experimental period, indicating that tolerance to the pharmaceutical wastes was developing.
Volatile acids production and suspended solids concentration in the fluidized bed reactors were similar to those in both the filters and the UASB reactors (Table 6). The pH values of both fluidized beds over the period showed less fluctuation than the other systems, indicating the stability of this parameter in these reactors. Removal of COD from pharmaceutical wastes in the fluidized beds was also superior to that in the other reactors, probably due to the dilution caused by the high recycle rate in the fluidized systems. Methane production in both beds was poorer than in the filter and blanket reactors suggesting that the acidogenic, rather than the methanogenic populations were benefiting from the ameliorating affects of high recycle.

Start-up of anaerobic bioreactors 187
0.2
0.2
| i
r., 0-2 o 'T
"E o
~ 0"4
Z
~ 0.2
/
I
®!
0
_.®
0-I
®
® 0.2 ~ .-,,
0 I I t 510 L 0 10 20 30 40 60 70
Ed] Fig. 2. Methane production in six reactors treating n-propanol-containing (A) and dimethylformamide-containing (B) pharmaceutical wastes: (1) anaerobic filter treating waste A; (2) anaerobic filter treating waste B; (3) UASB treating waste A; (4) UASB
treating waste B; (5) fluidized bed treating waste A; (6) fluidized bed treating waste B.

188 s. M. Stronach, T. Rudd, J. N. Lester
There were differences in the operational performance of the three reactor configurations during start-up. The UASB reactors started up much more rapidly than both the filters and the fluidized beds because of the granulated biomass used as seed. Initially high COD removals and gas production were observed, although at higher organic loadings the advantage was lessened. Schwartz et al. 2° reported that sludge blanket reactors exhibit lower TVA concentrations than filters although this was not found to be the case here. In the current study, effluent suspended solids concentrations were much greater in the UASB reactors than in either filters or fluidized beds. However, overall, the fluidized units exhibited superior COD removal efflciencies and better pH stability than the other configurations.
Start-up of anaerobic fluidized beds on high strength wastes
Propanol-containing pharmaceutical waste, synthetic glucose waste, soft drinks manufacturing waste and a fruit processing effluent were used to start up four 2-1itre anaerobic fluidized bed reactors (Fig. l(b)). The operational performances of these reactors are shown in Table 7.
The digested sludge supernatant liquor used as seed for the four reactors provided more initial biomass than did the seed of the larger- scale fluidized beds. However, suspended solids concentrations in those systems treating the industrial wastes were similar to those recorded in the 4-litre beds (Table 7). In contrast, the reactor fed with the glucose waste produced suspended solids concentrations of more than 600 mg litre-1 at the higher organic loading rates. This was probably caused by either excess biomass growth on the easily degradable substrate, followed by washout or the reduction in HRT at successive stages of start-up (Table 3). The initial COD removal efficiency of the reactor was greater than that of the other reactors (Table 7), indicating that an extended HRT during the initial phases allowed the development of suitable bacterial populations.
Removal of COD in the four systems differed markedly. The glucose substrate was removed at high efficiency indicating that microbial acclimation to the feed was rapid at loadings of up to 4-5 kg COD m-3 day -1. The subsequent loading increase caused an increase in TVA production and a drop in COD removal but this stabilized at the end of the experimental period (Table 7). Low pH levels and inefficient COD removals were recorded at the initial low organic loadings in the fluid- ized bed treating pharmaceutical effluent (Table 7) but decreasing TVA concentration and increasing COD removal indicated that acclimation to the waste had taken place in the final week of operation.

Start-up of anaerobic bioreactors 189
TABLE 7 Operational Performances of Four Anaerobic Fluidized Beds during Start-up on High
Strength Wastes
Reactor Days Mean Mean Mean total Mean and waste pH suspended volatile acids % removal
solids (mg litre- i) COD (mg litre- i)
1. Synthetic 0-6 5.46 487 1686 67 g~cose 7-13 4.91 490 973 69
14-20 7.77 457 1664 64 21-27 8-53 683 1107 67 28-34 8.44 637 1695 68 35-41 7,30 487 977 66 42-48 6.49 368 1300 56 49-55 6.81 364 650 59
2. Fruit 0-6 4.39 130 743 26 processing 7-13 4.20 87 943 24
14-20 7.51 247 2450 13 21-27 8.36 192 1907 50 28-34 7.50 216 2393 51 35-41 7.04 253 2157 35 42-48 6.76 246 1379 41 49-55 6.50 168 850 25
3. Soft drink 0-6 4.93 96 586 29 manu~cturing 7-13 4.41 119 414 36
14-20 7.67 262 236 16 21-27 8-41 202 550 37 28-34 7.60 122 686 79 35-41 5.79 167 1129 68 42-48 6-94 104 900 67 49-55 6.81 216 550 55
4. Pharmaceutical 0-6 6.21 68 382 39 7-13 6.09 79 239 39
14-20 6.96 122 296 24 21-27 6.37 111 357 49 28-34 5.96 120 639 50 35-41 5.63 112 775 37 42-48 6.77 102 629 44 49-55 6"54 68 542 78
T h e f lu id ized b e d t r ea t ing f ru i t p r o c e s s i n g e f f luen t was n o t as ef f ic ient as the o t h e r uni ts in t e r m s o f subs t r a t e r e m o v a l (Table 7), t he slight i m p r o v e m e n t at the 4.5 kg C O D m -3 d a y -1 o rg an i c load ing ra te d r o p - p ing sha rp ly w h e n l oad ing was i n c r e a s e d to 7.5 kg C O D m -3 d a y - 1 .

190 S. M. Stronach, T. Rudd, J. N. Lester
However, TVA concentrations of 850 mg litre-1 were obtained at the end of the operational run. Similar patterns were observed for the soft drink effluent, although COD removal and acids production were superior. Both factories produce wastes that are high in easily degradable sugars but the preservative sodium metabisulphate and cleaning com- pounds appear in plant wastewaters. Hickey and Owens 5 found that degradation rates of soft drink bottling effluent were slow, despite the high content of refined sugars in the waste. The presence of bacterial inhibitors in the product were held to be responsible for this. 34
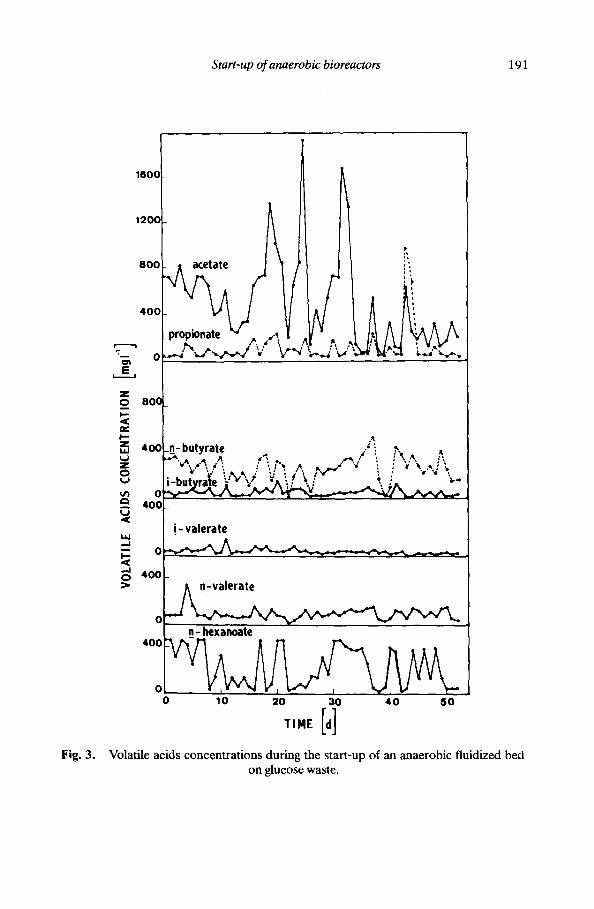
The most notable differences between the four 2-1itre fluidized beds and the reactors discussed previously were the high levels of volatile acids produced (Table 7). These reflected the reduced buffering capacity of the smaller fluidized beds and were probably influenced by the greater organic loadings applied (Table 3). Volatile acids analyses were carried out for the 2-litre reactors (Figs 3-6). The concentrations of acids produced by the beds indicated that acetogenic bacteria were the pre- dominant flora throughout start-up and for those reactors treating glucose, fruit processing and soft drinks manufacturing effluents, acetate was the principal product of their activity (Figs 3-5). Propionate was the major volatile acid generated in the reactor fed on pharmaceutical waste, probably as a result of the high n-propanol content of the feed.
Volatile acids accumulation usually occurs during digestion under shock loading conditions or at periods of reactor instability. 1'35 During increasing acids production due to organic loading increases, propionate levels tend to remain high for a long period, whereas acetate levels fall off more quickly. 36 In the pharmaceutical waste-fed reactor, propionic acid levels increased with COD loading throughout start-up as the n-propanol component of the feed increased. Propionate concentrations were also high in the bed treating fruit waste (Fig. 4). Propionate levels in these reactors did not decrease substantially at the end of the start-up period, but only a limited number of microorganisms are reported to break down this acid under anaerobic conditions. 37 The reactor fed on soft drinks effluent produced lower concentrations of volatile acids than those treating glucose and fruit processing wastes (Fig. 4). However, bacterial inhibitors in some wastes affect the rate of acid production by microorganisms 34 and acetogenic bacteria have been found to be more sensitive than methanogens to inhibition. 32
The concentrations of n-butyrate in the reactors treating glucose, fruit and soft drinks wastewaters fluctuated between 200 and 400 mg litre- 1. Sudden increases in the concentrations of either acetic or n-butyric acids have been reported to stimulate methanogens in anaerobic systems, 32 but gas production in the fluidized beds was erratic and generally negligible.
Start-up of anaerobic bioreactors 191
Fig. 3.
160C
1 2 0 0
8 0 0
4 0 0
, i
~-- o E
I I
i o 80C I-- ,< he. I,- z ,., 4 0 0 ~J Z 0
~ 4o
°
. , J c) 4 0 o
C
4 0 0
0 0
A n - b u t y r a t e , .." : .-.
-..~..,, ~ ,~ , , ..,~,." '. " ¶ ^ . :.,
i - b u t v r a t e ~ ~" ½: _ ~^ "7 ~ t :' ~ A ~ "
! - v a l e r a t e
n - hexanoa te
10 20 3 0 4 0 5 0
Volatile acids concentrations during the start-up of an anaerobic fluidized bed on glucose waste.

192 S. M. Stronach, T. Rudd, J. N. Lester
Fig. 4.
E
z _o
z ~L4 z 0
f l
0
200(~
160C acetate
120C / ~ '
0
400
0
400
0
400
_n - but yrate
. .r '%~¢, "v :k , . ,~ '° ,~ .~'~ •
:~, ." ' ~ ,~i-butyral~ :.. '° ". "~ .. v' "., V I t ~ , L - d ' 1: L . . ~ I P ~ "~
i - valerate
n-valerate
n- hexanoate
°° 1o 0 10 20 30 40 50
Volatile acids concentrations during the start-up of an anaerobic fluidized bed on fruit processing waste.
Hexanoate and n-valerate concentrat ions increased suddenly in the effluent of the soft drinks waste fed reactor (Fig. 5) as a result of the loading increase f rom 4-5 to 7"5 kg C O D m -3 day-1, al though the levels of these acids, butyrate and i-valerate were negligible in the effluent of

Start-up of anaerobic bioreactors 19 3
Fig. 5.
80q
40~
0 u
E J
Z 400 o
p -
Z
Z o
/i/:~.n-butyrate i ~ -.-~., ~...~ o.
4C t i-valerate
! 400~ n_- va lerate
40C
C ~ I I 1 0 10 20 30
n-hexanoate
Volati le acids c o n c e n t r a t i o n s du r ing the s ta r t -up of an a n a e r o b i c f luidized bed o n soft d r inks m a n u f a c t u r i n g waste.
the pharmaceutical waste fed system. In all four reactors, TVA concentrations decreased towards the end of the experimental period, indicating that digester conditions had stabilized.
The type and concentration of volatile acids produced were influenced by the feedstock of the systems. Glucose and fruit processing

194 S. M. Stronach, T. Rudd, J. N. Lester
Fig. 6.
400 acetate
o
800 _
, , 4 0 0 ~
=... o
E ~ 400 I
Z
o ! - but y rate m
I-- z 400
n - butyrate Z c~
0 ~
,< 400_ i- valerate
,.,.I
0 4O
n- valerate
4011
n - hexan0ate
0 ~ i J , ~ - - ~ - , , ~ - * ~ - - - ~ . - -~ , - 0 10 20 30 40 50
Volatile acids concentrations during tile start-up of an anaerobic fluidized bed on pharmaceutical waste.
wastes gave rise to products such as acetate, whereas the propanol- containing pharmaceutical effluent selected for microbial populations was capable of specific conversions. Other components of reactor sub- strates may produce specific breakdown products and alterations in influent composition may trigger changes in bacterial population or reac- tions.

Start-up of anaerobic bioreactors 195
Start-up of all 10 reactors was difficult and prone to instability upon changes in organic loading rates, COD concentrations and HRT. Limited pH control of the fruit processing and soft drinks effluents prior to their treatment in the fluidized bed reactors was ineffective. Bacterial in- hibitors in these effluents reduced reactor efficiency although COD reductions of 51% for fruit processing and 79% for soft drinks manu- facturing effluents could be achieved. Pre-granulated seed sludge decreased the starting up time of UASB reactors, although the pharma- ceutical wastes used for start-up were recalcitrant. The n-propanol- containing waste was more difficult to treat than the DMF-containing effluent in the filters, UASB reactors and fluidized beds and could not be applied at similar organic loading rates. However, the 2-1itre fluidized bed converting the n-propanol waste indicated that acclimation could occur, although the HRT in this system was 1.95 days, compared to the 1 day of the 4-litre unit.
CONCLUSIONS
Recalcitrant wastestreams such as fruit processing, soft drinks manufac- turing and pharmaceutical effluents can be used to start up high rate anaerobic bioreactors, Organic loadings of up to 7.5 kg COD m-3 day-1 were successfully applied to fluidized beds, although the bacterial in- hibitors present as part of the fruit processing and soft drinks manufac- turing streams reduced the full effectiveness of these systems. The pharmaceutical wastes also contained inhibitory substances although the DMF-based waste was more amenable to conversion than the n-pro- panol-containing effluent. Acclimation of the latter was observed in a 2-1itre fluidized bed, and 78% COD removal was achieved at a loading of 7.5 kg COD m -3 day -1.
Fluidized beds were found to be superior to both filters and UASB reactors in COD removal efficiency and pH stability, although CH4 production was greater in the UASB system.
The levels and types of volatile acids produced during anaerobic digestion were found to relate closely to the composition of the feed- stock treated, with sugar-rich wastes giving rise to high effluent con- centrations of acetate and propanol-containing wastes causing high effluent levels of propionic acid.
Start-up is a sensitive period in anaerobic reactor operation and although this was achieved in the current study using recalcitrant industrial wastes without benefit of nutrient or trace element addition, improved performances would probably have been achieved by start-up

196 s. M. Stronach, T. Rudd, J. N. Lester
on an easily-assimilable waste, followed by the gradual introduction of the recalcitrant effluent.
A C K N O W L E D G E M E N T
One of us (S.M.S.) is the recipient of a Science and Engineering Council Research Studentship.
R E F E R E N C E S
1. Stronach, S. M., Rudd, T. & Lester, J. N. (1986). Anaerobic digestion processes in industrial wastewater treatment. Biotechnology Monographs 2, Springer, Berlin.
2. Eckenfelder, W. W., Patoczka, J. & Watkin, A. T. (1985). Chem. Eng., 92, 60-74.
3. Henze, M. & Harremoes, P. (1983). WaterSci. Technol., 15, 1-102. 4. Bull, M. A., Sterritt, R. M. & Lester, J. N. (1982). Trans. I. Chem. Eo, 60,
373-6. 5. Hickey, R. E & Owens, R. W. (1981). Biotechnol. Bioeng. Syrup., 11,
399-413. 6. Sutton, P. M. & Li, A. (1981). Proc. 36th Ind. Waste Conf., Purdue Univer-
sity, Lafayette, IN, USA,. pp. 665-77. 7. Van den Berg, L. & Kennedy, K. J. ( 1981 ). Biotechnol. Lett., 3, 165-70. 8. Sachs, E. E, Jennett, J. C. & Rand, M. C., (1982). J. Env. Eng. Div. ASCE,
108, 297-314. 9. Wilkie, A. & Colleran, E. (1984). Biotechnol. Lett., 6, 735-40.
10. Sachs, E. F., Jennett, J. C. & Rand, M. C. (1978). Proc. 33rd Ind. Waste Conf., Purdue University, Lafayette, IN, USA, pp. 507-14.
11. Young, J. C. & Dahab, M. E (1983). WaterSci. Technol., 15,369-83. 12. Hulsoff-Pol, L. W., de Zeeuw, W., Dolfing, J. & Lettinga, G. (1983). Proc.
Eur. Symp. on Anaerobic Wastewater Treatment, November 1983, Noordwijkerhaout, Netherlands, pp. 40-3.
13. Ross, W. R. (1984). WaterSA, 10, 197-204. 14. Lettinga, G., van der Geest, A.Th., Hobma, S. & van der Laan, J. (1979).
WaterRes., 13, 725-37. 15. Lettinga, G., de Zeeuw, W. and Ouborg, E. (1981 ) Water Res., 15, 171-82. 16. Salkinoja-Salonen, M. S., Nuys, E.-J., Sutton, P. M., van den Berg, L. &
Wheatley, A. D. (1983). WaterSci. Technol., 15,305-8. 17. Stephenson, T. & Lester, J. N. (1986). Biotechnol. Bioeng., 28,372-80. 18. Bull, M. A., Sterritt, R. M. & Lester, J. N. (1983). Biotechnol. Lett., 5,
333-8. 19. Stronach, S. M., Rudd, T. & Lester, J. N. (1986). Biotechnol. Lett., 8,
512-14. 20. Schwartz, L. J., de Baere, L. A. & Lanz, R. W. (1981). Biotechnol. Bioeng.
Symp., 11,463-79.
Start-up of anaerobic bioreactors 197
21. Young, J. C. (1980). Proc. Seminar/Workshop on Anaerobic Filters, 9-10 January 1980, Howey-in-the-Hills, Florida, USA, pp. 159-70.
22. Bull, M. A., Sterfitt, R. M. & Lester, J. N. (1984). WaterRes., 18, 1017-20. 23. Wiegant, W. M., Claassen, J. A., Borghans, A. J. M. L. & Lettinga, G.
(1983). Proc. Eur. Syrup. on Anaerobic Wastewater Treatment, Noordwij- kerhaout, Netherlands, pp. 392-410.
24. Government of Great Britain (1977). Chemical oxygen demand (dichromate value) of polluted and waste waters. HMSO, London.
25. Government of Great Britain (1980). Suspended, settleable and total dis- solved solids in waters and effluents. HMSO, London.
26. American Public Health Association (1985). Standard methods for the examination of water and wastewater, 16th edn, American Public Health Association, Washington, DC.
27. Government of Great Britain (1979). Determination of volatile fatty acids in sewage sludge. HMSO, London.
28. Kirk, E W. W., Lester, J. N. & Perry, R. (1982). WaterRes., 16, 973-80. 29. Clark, R. H. & Speece, R. E. (1971). Proc. 5th Int. WaterPollut. Res. Conf.,
Pergamon, New York, p. II-27/1-14. 30. Seeler, T. A. & Jennett, J. C. (1978). Proc. 33rd Ind. Waste Conf., Purdue
University, Lafayette, IN, USA, pp. 686-95. 31. Lin Chou, W., Speece, R. E. & Siddiqi, R. H. (1978). Biotechnol. Bioeng.
Syrup., 8,391-414. 32. McCarty, E L. & Brossean, M. H. (1963). Proc. 18th Ind. Waste Conf.,
Purdue University, Lafayette, IN, USA, pp. 283-96. 33. Hobson, E N. & Shaw, B. J. (1976). WaterRes., 10, 849-52. 34. Blanc, F. C., O'Shaughnessy, J. C. & Miller, C. H. (1978). Proc. 33rd Ind.
Waste Conf., Purdue University, Lafayette, IN, USA, pp. 614-23. 35. Kennedy, K. J. & van den Berg, L. (1982). Biotechnol. Lett., 4, 137-42. 36. Barnes, D., Bliss, E J., Grauer, B. & Robins, K. (1983). Environ. Technol.
Lett., 6, 73-8. 37. Widdell, E & Pfennig, N. (1982). Arch. Microbiol., 131,360-5.