start-stop practice in small norwegian hydropower...
TRANSCRIPT
RE
PO
RT
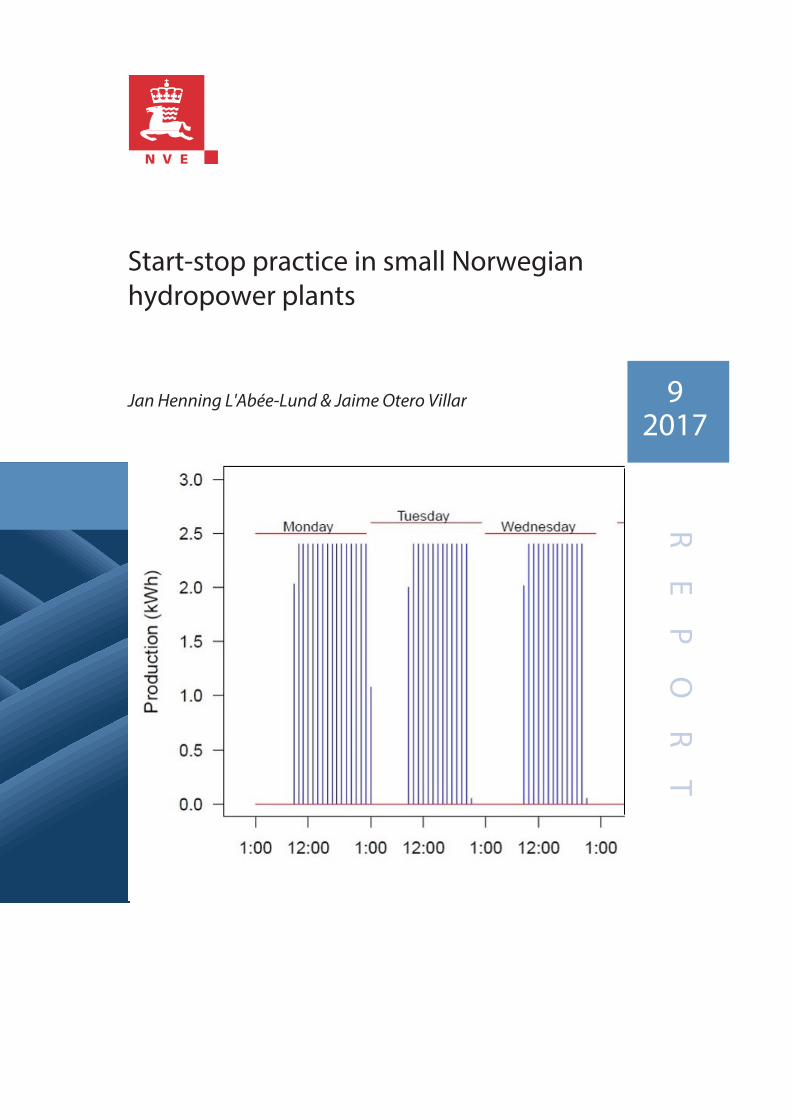
Start-stop practice in small Norwegianhydropower plants
Jan Henning L'Abée-Lund & Jaime Otero Villar 92017
2
Published by:
Editor:
Authors:
Printing: Circulation:Cover: ISBN
Summary:
Keywords:
Norwegian water resources and energy directorate (NVE)
Middelthunsgate 29 Postboks 5091 Majorstua 0301 OSLO
Telephone: 22 95 95 95 Web: www.nve.no
Start-stop practice in small Norwegian hydropower plants
Norges vassdrags- og energidirektorat
Jan Henning L'Abée-Lund & Jaime Otero Villar
NVEs hustrykkeri
978-82-410-1559-5ISSN 1501-2832
Start-stop practice was analysed in 256 Norwegian hydropower plants inconjunction to a set of characteristics. The plants were on grid 2005-20014, and production data from 2015. Number of starts were countedfor each plant finding a higher number in Kaplan turbines than in Francisand Pelton. Number of starts was not dependent on having a license topractice start-stop, and were related to the annual mean river dischargebeing negative for Francis, dome-shaped for Pelton, and no associationfor Kaplan.
Start-stop practice, small hydropower, water discharge, precipitation,turbine type
February 2017

1
Contents
Preface ................................................................................................. 2
Summary .............................................................................................. 3
Sammendrag ........................................................................................ 4
1 Introduction ................................................................................... 5
2 Material and Methods ................................................................... 6
2.1 Data set ........................................................................................... 6 2.2 Characteristics of hydropower plants .............................................. 7 2.3 Data analyses .................................................................................. 8
3 Results ......................................................................................... 10
3.1 Precipitation characteristics ........................................................... 10 3.2 Turbine characteristics and production .......................................... 11 3.3 Start-stop procedure ...................................................................... 14
4 Discussion ................................................................................... 20
5 Conclusions ................................................................................ 23
6 Acknowledgements .................................................................... 23
7 References ................................................................................... 23
8 Appendix ...................................................................................... 25

2
Preface
In the licensing procedure for hydropower development in Norway, costs and benefits connected to the project is evaluated. When a project gets a license this also contains a set of conditions. The conditions ensure specific environmental aspects that have been addressed in the licensing procedure. One such condition can be that the hydropower should be run smoothly and according to the discharge. Typical start-stop procedure to increase financial benefit is not allowed. Start-stop practice is negatively affecting the aquatic environment downstream the hydropower plant.
NVE is responsible to follow up the conditions set in the license for hydropower plants. Usually, supervision is targeting hydropower plants individually. With more than 1000 licenses, it is practically impossible to look after all this over a restricted time period. Thus, this project was initiated to get an overview of the production practice of small hydropower plants in Norway. The results can be used in targeting future supervision of small hydro power.
I konsesjonsbehandlingen av vannkraft blir fordeler og ulemper veid mot hverandre. Når fordelen er vurdert å overstige ulempene, blir det gitt tillatelse til tiltaket. Denne konsesjonen kan inneholde vilkår som gjenspeiler miljøforhold som ble belyst i konsesjonsprosessen. Et slikt vilkår kan være at kraftverket til enhver tid skal kjøres etter tilsiget, at alle endringer skal skje gradvis og at typisk start-stopp kjøring skal ikke forekomme. Typisk start-stopp kjøring vil kunne påvirke akvatiske organismer nedstrøms kraftverket negativt.
NVE følger opp at konsesjonsvilkår blir etterlevd. Vanligvis vil et slikt tilsyn være rettet mot konkrete anlegg. Med mer enn 1000 konsesjoner er det umulig å følge opp alle konsesjonsvilkår til alle anlegg innen en rimelig tidshorisont. Derfor ble dette prosjektet gjennomført for å få en oversikt over hvordan dette konkrete konsesjonsvilkåret blir etterlevd. Resultatene vil bli brukt i fremtidig tilsynsvirksomhet av små vannkraftverk.
Oslo, February 2017
Ingunn Åsgard Bendiksen Director Supervision and Contingency Department
Øyvind Leirset Head of Section Section for Environmental Supervision

3
Summary Start-stop practice was analysed in a total of 256 Norwegian hydropower plants in conjunction to a set of characteristics that define each plant such as production, turbine type, river discharge, precipitation, and geographic location. We selected hydropower plants on grid in 2005 or later, and chose 2015 as a stochastic and representative year for hourly production pattern. Among the analysed plants, a vast majority, 75.8%, did not have a license to practice start-stop dynamics.
Most of the plants had Pelton turbines installed (70.3%), followed by Francis (27%) and Kaplan (2.7%), and production typically showed daily, weekly and annual cycles though shapes varied depending on turbine type and location. Further, daily production showed a positive relationship with precipitation regardless of the installed turbine type.
The number of starts were counted for each plant finding a larger number in Kaplan turbines as compared to Francis and Pelton. The number of starts was not dependent on having a license to practice start-stop. However, average duration and production of starts were higher for plants allowed to practice start-stop. In general, the number of starts varied widely among plants and were related to the annual mean river discharge. However, this relationship differed among turbine types, being negative for Francis and dome-shaped for Pelton, while in the case of Kaplan turbines the number of starts did not show any association with mean discharge. We know that 2015 hydrologically was special. The melting of snow during spring was extremely late, and high precipitation represented an increase in production of 31.5 TWh. This may indicate that number of starts would have been higher in a drier year. Financial proceeds is probably the most important factor explaining the start-stop practice.

4
Sammendrag Start-stopp praktisering ble analysert for 256 norske konsederte kraftverk. Hvert enkelt kraftverk ble karakterisert ut fra produksjon, turbintype, vannføring i vassdraget, nedbør og geografisk plassering. Vi valgte ut kraftverk som var satt i drift i 2005 til 2014, og valgte 2015 som et stokastisk tilfeldig år til å dokumentere kraftproduksjon med timesverdier. Blant kraftverkene hadde de aller fleste (75,8 %) vilkår i konsesjonen om at start-stopp ikke var tillatt.
De fleste kraftverkene har installert Pelton turbin (70,3 %), deretter fulgte Francis med 27 % og Kaplan med 2,7 %. Forholdet mellom maksimal slukeevne til turbinen og årlig middelvannføring var i gjennomsnitt 1,9 for Pelton, 1,45 for Francis og 1,6 for Kaplan turbiner. Produksjonsmønstrene viste variasjon gjennom døgnet, uken og året selv om omfanget var avhengig av turbintype og geografisk plassering. Videre viste døgnproduksjonen en positiv sammenheng med nedbøren uavhengig av hvilken turbintype som var installert.
Antall starter gjennom året ble talt opp for hvert enkelt kraftverk og var ikke avhengig av konsesjonens ordlyd. Kraftverk som hadde forbud mot start-stopp hadde i gjennomsnitt flere starter enn kraftverk uten restriksjon. Forskjellen var ikke statistisk signifikant. Innen alle tre turbintypene ble det registrert kraftverk som hadde meget høye antall starter i 2015 – Pelton >250 starter, Francis >100, og for Kaplan >175. Av disse tre ekstremverdiene var det kun Francis turbinen som ikke hadde restriksjon i konsesjonen.
Den store forskjellen i antall starter blant kraftverkene var knyttet til middelvannføring ved inntaket. Sammenhengen var imidlertid forskjellig mellom turbintypene. Den var negativ for Francis, ikke-lineær for Pelton mens det for Kaplan ikke var noen sammenheng. For Pelton var det flest starter i elver med middelvannføring på 0,6 m3/s. For Francis var det flest starter i elvene med den minste middelvannføringen (0,45m3/s) der disse var installert. 2015 var et hydrologisk vått år. Dette kan indikere at antall starter ville ha vært høyere i et tørt år. Økonomisk fortjeneste er trolig den viktigste årsaken til start-stopp praktiseringen.

5
1 Introduction Annual and weekly variation in water discharge in rivers is a normal phenomenon. This variation reflects climatic changes on a broad scale (e.g. Stahl et al. 2010). The shift occurs at a slow rate. Water discharge may also vary over short time periods such as several days. Heavy rainfall or torrential rain results in a significant increase in discharge, whereas the discharge is reduced much slower and over several days. The period of reduction reflects the characteristics of the watershed. Lakes and bog areas retain water making a long period of reduction. On the other hand, when the watershed has large areas of bare bedrock the discharge is reduced faster.
Development of hydropower has significantly changed the normal run off characteristics in rivers leading to multiple effects on the habitats and biota inhabiting the rivers (e.g. Pracheil et al. 2016; Nieminen et al. 2017). When a reservoir is included in the hydropower scheme, annual flows are lacking and the river discharge reflects the amount of flow released as compensation flow. Small hydropower schemes (<10 MW) build as run-of-the-river project affect the river differently. Their storage capacity of water is small or insignificant resulting in a “loss of water” when the discharge is higher than the turbine capacity. Downstream the intake, the dewatered reach will benefit from the “loss of water”. Thus, some of the natural discharge variation, but at a lower scale, is maintained in the river. Most of the year, this river reach is characterised by the compensation flow.
In Norway, the distance from the intake to the small hydropower station is often 1000−1500 m. The watershed, directly connected to this dewatered river reach, is restricted in area implying that the contribution to the river discharge is small. Small hydropower schemes are typically situated in rivers with a distinct and high gradient. Before a hydropower scheme can be constructed an application should be evaluated by the authority. In the case when no public interests will be affected by the project, it may be classified as not subject to licensing and can be built without any conditions except release of compensation flow. However, when the project is judged by the authority to negatively affect public interests, a license is needed. This license also contains a set of conditions.
If the outlet from the plant is directly connected to a river reach that is assessable for anadromous fish species, the license includes a requirement prohibiting to practice start-stop production. This procedure is identical with the more common used term of hydropeaking. Hydropeaking can be characterised as a rapid and more frequent change in water discharge and water level than occurring in pristine rivers. The reason for this restriction is that a start-stop practice will automatically result in swift changes in discharge of which the reduction is much faster than under natural conditions. This reduction will affect aquatic organisms. Several studies have been conducted to show the consequences, and is best documented for salmonids (Bakken et al. 2016). Rapid reduction in water level may influence growth (Flodmark et al. 2004, Puffer et al. 2015) and survival of juvenile salmonids (Saltveit et al. 2001) as well as behaviour of river mussel (Bakken et al. 2016). Rapid increase in water discharge, on the other hand, severely affects the invertebrate fauna by a catastrophic drift shortly after the peak (Imbert & Perry 2000).
The aim of the present study was to elucidate how the start-stop restriction in the license was followed up by the owner. We hypothesised that number of starts during a specific year was lower for hydropower plants with restriction than those without such restriction.

6
2 Material and Methods 2.1 Data set The study started selecting hydropower plants (HP) set in operation in the period 2005−2014. The reason for this selection was twofold. First, few licenses given before 2005 had any requirement regarding start-stop practice. Second, we used the 2015 as a random year to describe how the owner ran the HP. Then, we focused on small HP (installed effect <10 MW) with few exceptions. These criteria resulted in a data set of 256 HP distributed all along Norway (Fig. 1, Table S1).
Fig. 1. Geographical distribution of 256 hydropower plants used in the study (the dot size varies according to the installed maximum capacity). Triangles indicate the position of meteorological stations recording daily precipitation.
For each HP there were collated basic characteristic information such as turbine type, annual average river discharge, maximum turbine capacity, volume of intake when this was a
7
reservoir, and whether the HP was allowed to practice start-stop dynamics (http://nve.no). Statnett SF provided hourly production (in kWh) data in 2015 for every HP (http://Statnett.no).
Daily precipitation (in mm) data for 2015 were obtained for a total of 132 weather stations representative of rainfall conditions for all hydropower plants (Fig. 1, Table S1). Data were downloaded from the Norwegian Meteorological Institute (http://met.no).
2.2 Characteristics of hydropower plants The data set consists of five different types of turbines: Pelton, Francis, Kaplan, Brekke and Turgo. The latter two were installed in only three HPs. Their characteristics resembles very much to a Pelton turbine and were treated as such in the analyses. Three HPs had two different turbine types installed, namely one Pelton and one Francis, but of different capacity. In the analyses, we classified the HP according to the turbine with the smallest capacity. This resulted in 180 HPs with a Pelton turbine, 69 HPs with a Francis turbine, and 7 HPs with a Kaplan turbine.
Due to climatic conditions, geomorphological characteristics of the watershed and characteristics of the turbine, the concise turbine type is selected for each hydropower plant. The Kaplan turbine are characterised by low head and large volume of water, and are therefore used in large rivers with low pressure usually <30 m head. The Pelton turbine are suitable for power extraction when the water energy is available at high head (often >500 m) and low flow rate. The Francis turbine operates in a water head from 40 to 600 m.
The seasonal run off varies considerably among Norwegian counties, as does the altitudinal conditions. High gradient watersheds and high annual precipitation are found on the west coast of Norway, namely the counties of Hordaland and Sogn og Fjordane. On the other hand, areas with low annual precipitation and low gradient watersheds are found in the eastern areas namely the counties of Finnmark and Hedmark (Fig. 1).
When a license for production of hydroelectric power includes start-stop restriction the license is not specific in how this should be expressed. However, the restriction is followed by an explanatory sentence saying that all changes in water discharge should occur at a slow rate. The intention is to secure a stable discharge in the river downstream the hydropower plant. In this study, we classified every hourly datum as start or stop if the HP was producing or not. Then, we counted the number of start and stop periods without taking into account any other rule, that is, the duration of the periods was not important for considering that a plant was on or off (Fig. 2A). In some cases, the periods with production and periods without production are very regular with production during daytime and stop during night (Fig. 2B). In addition, the time from zero to maximum production and from maximum to zero production is very short, apparently within few minutes. The finest time scale for available production data is on an hourly basis. Thus, there are no possibility to analyse the practice at a finer timescale.

8
Fig. 2. (A) Schematic illustration of the start-stop procedure where five OFF and four ON events occurred with a given duration and average production for the ON events. (B) Example of hourly production during one week by a hydropower plant practicing start-stop procedure.
2.3 Data analyses Daily precipitation dynamics for all stations were described using a generalized additive model (GAM, Wood 2006) according to the following general formulation:
s,i α g DoY ,La ϵs,i [1]
where P denotes the precipitation recorded at a station s on a day i, α is an intercept, g is a two-dimensional non-parametric smoothing function describing the interactive effect of DoY (day of the year) and La (Latitude) that was fit by a thin plate regression spline using a maximum of 12 knots, and ϵ is the error term.
9
Hourly HP production dynamics were also described for each turbine type using a GAM as follows:
s,h,d,w α g ,La g DoY ,La g ,La ϵs,h,d,w [2]
where EP denotes the energy production recorded for a hydropower plant s in an hour h, on a day d and in a week w. α is an intercept, gn are two-dimensional non-parametric smoothing functions describing the interactive effects of H (hour of the day), DoY (day of the year) and W (week) with La (latitude) that were fit by thin plate regression splines using a maximum of 12 knots, and ϵ is the error term.
Daily energy production for each turbine type was further modelled as a function of precipitation and geographic location using also GAMs as follows:
s,d α f DoY f g Lo ,La ϵs,d [3]
where EP denotes the summed energy production recorded for a hydropower plant s, in day d. α is an intercept, fn and g are 1- and two-dimensional non-parametric smoothing functions describing the effects of DoY (day of the year), P (precipitation) and Lo (longitude) and La (latitude) that were fit by a cyclic cubic regression spline, a cubic regression spline and a thin plate regression spline using a maximum of 6, 3 and 12 knots, respectively. ϵ is the error term.
Differences in average values of any quantity characterizing the HPs between a given categorical factor (e.g. type of turbine, license) were evaluated using analysis of variance (ANOVA) and Tukey HSD post-hoc tests.
To study the among-HPs (i) variability in the start-stop procedure for each turbine type we modelled the number of starts using generalized linear models (GLMs, McCullagh & Nedler 1989) assuming a negative binomial (NB) distribution as follows:
NumStarts ∼NB ,k [4]
where the mean and variance are given by:
NumStarts μ and var NumStarts μ [5]
log η [6]
α β β β [7]
Covariates were used for the negative binomial models including license to practice start-stop (L), water discharge (QR) and precipitation (P). Two interactions were also explored, first, L by QR, and second, L by P. βs are regression coefficients to be estimated.
All treatment of data and analyses were performed on R software (version 3.3.2, R Core Team 2016).
10
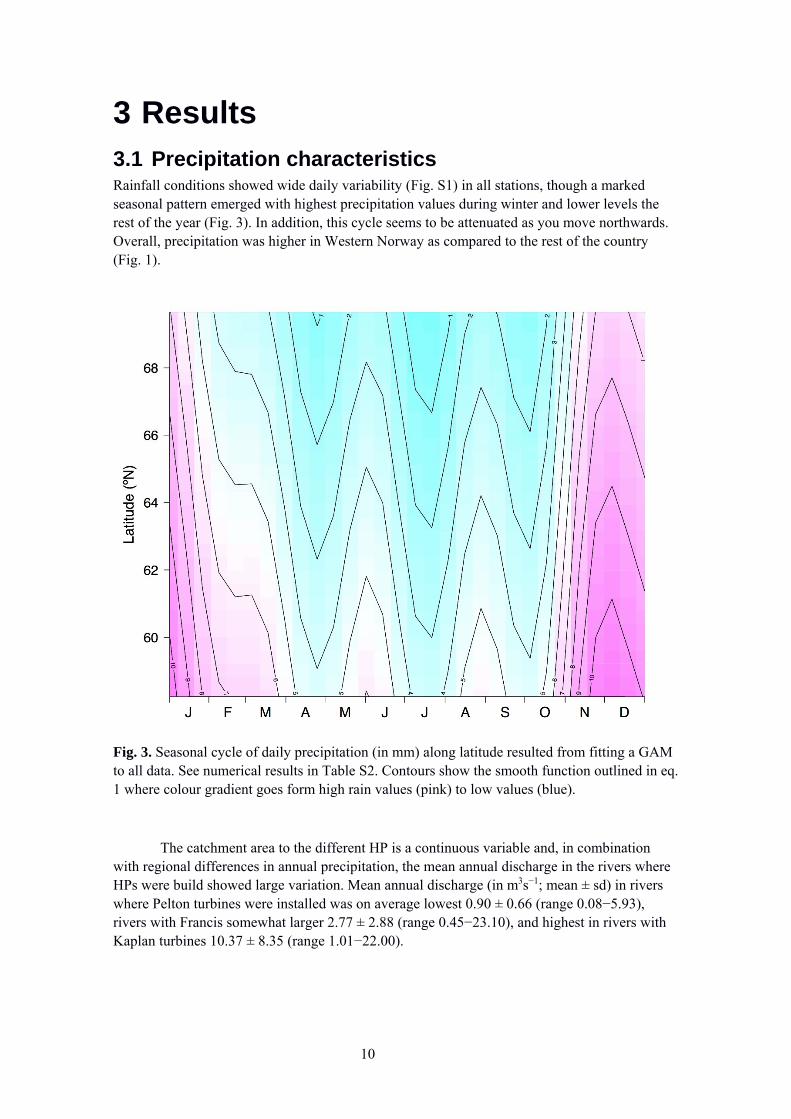
3 Results 3.1 Precipitation characteristics Rainfall conditions showed wide daily variability (Fig. S1) in all stations, though a marked seasonal pattern emerged with highest precipitation values during winter and lower levels the rest of the year (Fig. 3). In addition, this cycle seems to be attenuated as you move northwards. Overall, precipitation was higher in Western Norway as compared to the rest of the country (Fig. 1).
Fig. 3. Seasonal cycle of daily precipitation (in mm) along latitude resulted from fitting a GAM to all data. See numerical results in Table S2. Contours show the smooth function outlined in eq. 1 where colour gradient goes form high rain values (pink) to low values (blue).
The catchment area to the different HP is a continuous variable and, in combination with regional differences in annual precipitation, the mean annual discharge in the rivers where HPs were build showed large variation. Mean annual discharge (in m3s−1; mean ± sd) in rivers where Pelton turbines were installed was on average lowest 0.90 ± 0.66 (range 0.08−5.93), rivers with Francis somewhat larger 2.77 ± 2.88 (range 0.45−23.10), and highest in rivers with Kaplan turbines 10.37 ± 8.35 (range 1.01−22.00).

11
3.2 Turbine characteristics and production Pelton turbine was the most common installed type (70.3%), followed by Francis (27%) and Kaplan (2.7%) ones. The variation in climatic and geomorphological conditions, in combination with turbine characteristics, result in an unevenly distribution of turbine types across Norwegian counties (Fig. 4). In general, Francis and Pelton turbines are installed in HPs in almost all counties.
Fig. 4. Distribution of hydropower plants in Norwegian counties for each of the three turbines. For each column the number (upper value) of HPs and the proportion (lower value) of HPs with license to practice start-stop (i.e. no restrictions) are shown.
Maximum turbine capacity (in m3s−1; mean ± sd) varied considerable both among and within different turbine types. Pelton turbines were on average smallest 1.53 ± 0.93 (range 0.95−4.5), Francis somewhat larger 4.03 ± 2.65 (range 0.8−18.0), and Kaplan much larger 16.95 ± 15.22 (range 1.01−27.5). Maximum turbine capacity was related to the mean annual discharge in all turbine types (Fig. 5). The turbine capacity was chiefly higher than the mean annual discharge except for eight Pelton, six Francis, and one Kaplan turbine.

12
Fig. 5. Relationship between maximum turbine capacity and mean annual discharge per turbine type. The dotted line indicates the 0:1 relationship. Note that values were ln-transformed.
Overall, hydropower production showed clear daily, weekly and annual patterns though shapes varied depending on turbine type and the geographic location (Fig. 6). In general, the production showed great latitudinal variability for all turbine types. Highest values were recorded at 60−61 and 67−68°N. The production is mostly uniform throughout the day, although there are indications of highest production in the evening at least for Francis. On a weekly basis, higher production tended to occur from Wednesday until Saturday in both Pelton and Francis at lower and higher latitudes. In the case of Kaplan turbine, the larger production was during the weekend at 61ºN. The annual production by Francis and Pelton was similar with a higher production in summer months. Additionally, a secondary peak of production in December was mostly performed for Francis. The annual variation in production for Kaplan turbines was more heterogeneous showing high values in May, August/September and December. The maximum in May and December coincide with Francis and Pelton, whereas that in August/September could be an amplification of what it is seen in Francis and Pelton turbines.

13
Fig. 6. Contour plots of daily (left panels), weekly (centre panels) and annual (right panels) production cycles along latitude for hydropower plants with Pelton (upper panels), Francis (middle panels) and Kaplan (lower panels) turbines installed. Each panel shows the three smooth functions outlined in eq. 2 where colour gradient goes from low production values in blue to high production values in pink. See numerical results in Table S3 (Pelton), S4 (Francis) and S5 (Kaplan).
Apart from the different temporal cycles, production on a daily basis was positively related to precipitation for all types of turbines, though the strength of the relationship was somewhat higher for Pelton (Fig. 7).

14
Fig. 7. Relationship between daily production and precipitation for each turbine type accounting for the seasonality in production and the geographic location of each HP (eq. 3). See numerical results in Table S6 and complementary plots in Fig. S2.
3.3 Start-stop procedure A vast majority of HPs (75.8 %) had restrictions in the production and should secure a water discharge without swift changes. The rest (n = 62) could produce hydropower without having reflections to the aquatic environment (i.e. they were allowed to practice start-stop dynamics).
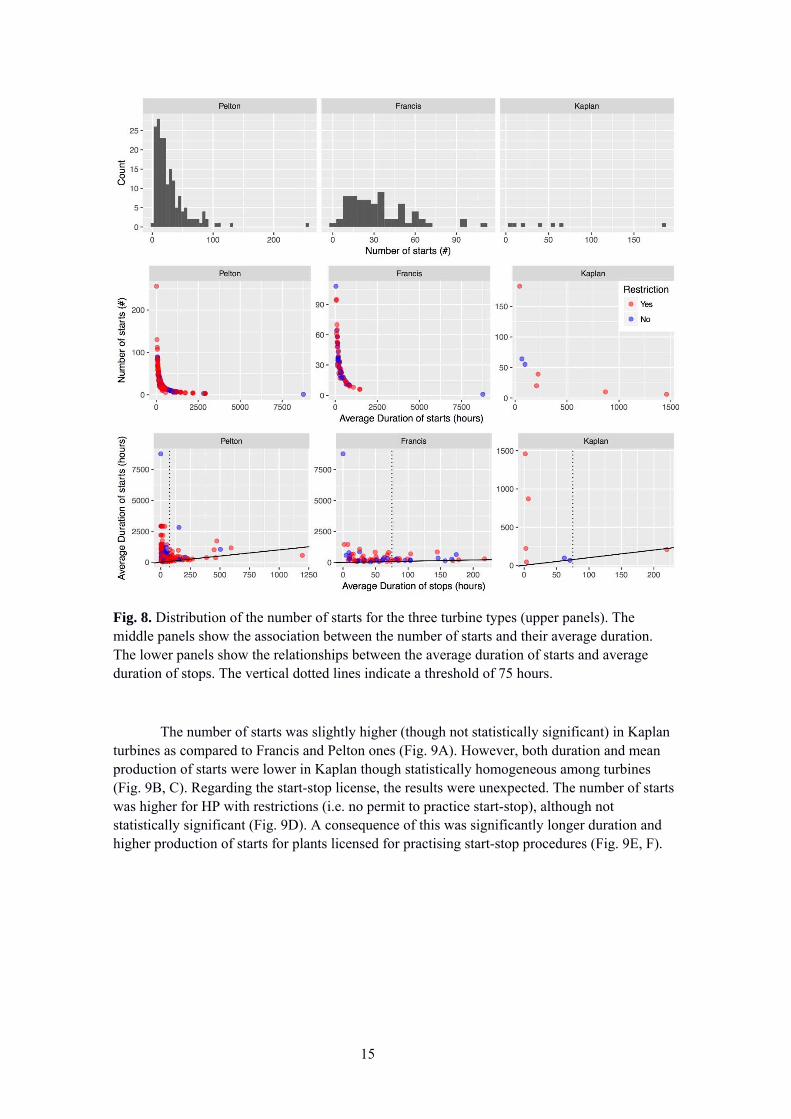
The number of starts ranged from 1 (two plants that never stopped during 2015) to 256, with a wide heterogeneous average duration of the starts (Fig. 8). For all three turbine types, one HP showed considerable higher number of starts than the rest. The highest number of starts was 256 for one Pelton, >100 for one Francis, and >175 for one Kaplan turbine. Of these three, the Pelton and the Kaplan had restriction in practising start-stop. For most Pelton (74.4%) and Francis (72.5%) turbines, the average duration of stops was less than 75 hours, and at the lower extreme of the distribution of the average duration of starts these were closely related to the duration of stops (Fig. 8).
15
Fig. 8. Distribution of the number of starts for the three turbine types (upper panels). The middle panels show the association between the number of starts and their average duration. The lower panels show the relationships between the average duration of starts and average duration of stops. The vertical dotted lines indicate a threshold of 75 hours.
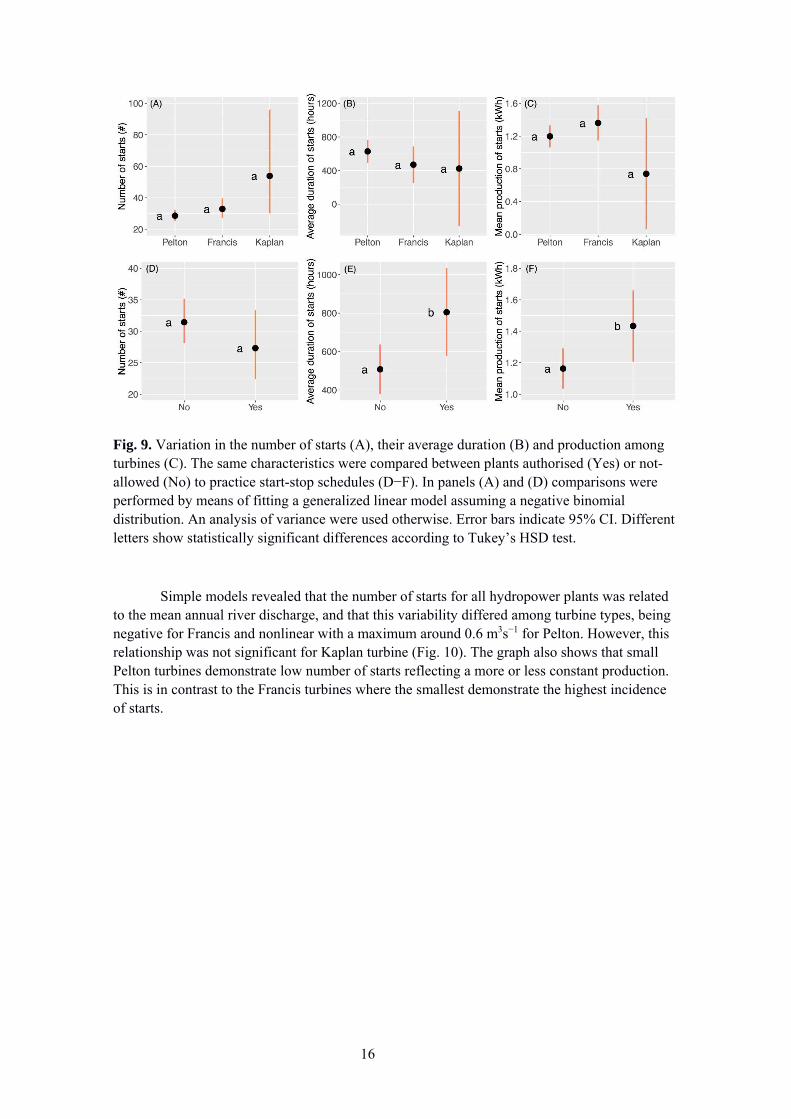
The number of starts was slightly higher (though not statistically significant) in Kaplan turbines as compared to Francis and Pelton ones (Fig. 9A). However, both duration and mean production of starts were lower in Kaplan though statistically homogeneous among turbines (Fig. 9B, C). Regarding the start-stop license, the results were unexpected. The number of starts was higher for HP with restrictions (i.e. no permit to practice start-stop), although not statistically significant (Fig. 9D). A consequence of this was significantly longer duration and higher production of starts for plants licensed for practising start-stop procedures (Fig. 9E, F).
16
Fig. 9. Variation in the number of starts (A), their average duration (B) and production among turbines (C). The same characteristics were compared between plants authorised (Yes) or not-allowed (No) to practice start-stop schedules (D−F). In panels (A) and (D) comparisons were performed by means of fitting a generalized linear model assuming a negative binomial distribution. An analysis of variance were used otherwise. Error bars indicate 95% CI. Different letters show statistically significant differences according to Tukey’s HSD test.
Simple models revealed that the number of starts for all hydropower plants was related to the mean annual river discharge, and that this variability differed among turbine types, being negative for Francis and nonlinear with a maximum around 0.6 m3s−1 for Pelton. However, this relationship was not significant for Kaplan turbine (Fig. 10). The graph also shows that small Pelton turbines demonstrate low number of starts reflecting a more or less constant production. This is in contrast to the Francis turbines where the smallest demonstrate the highest incidence of starts.

17
Fig. 10. Relationship between the number of starts and the mean annual river discharge (ln-transformed) for each turbine type. Lines are the result of fitting a negative binomial generalized linear model to the per turbine data. The crosses show the average number of starts for each turbine type.
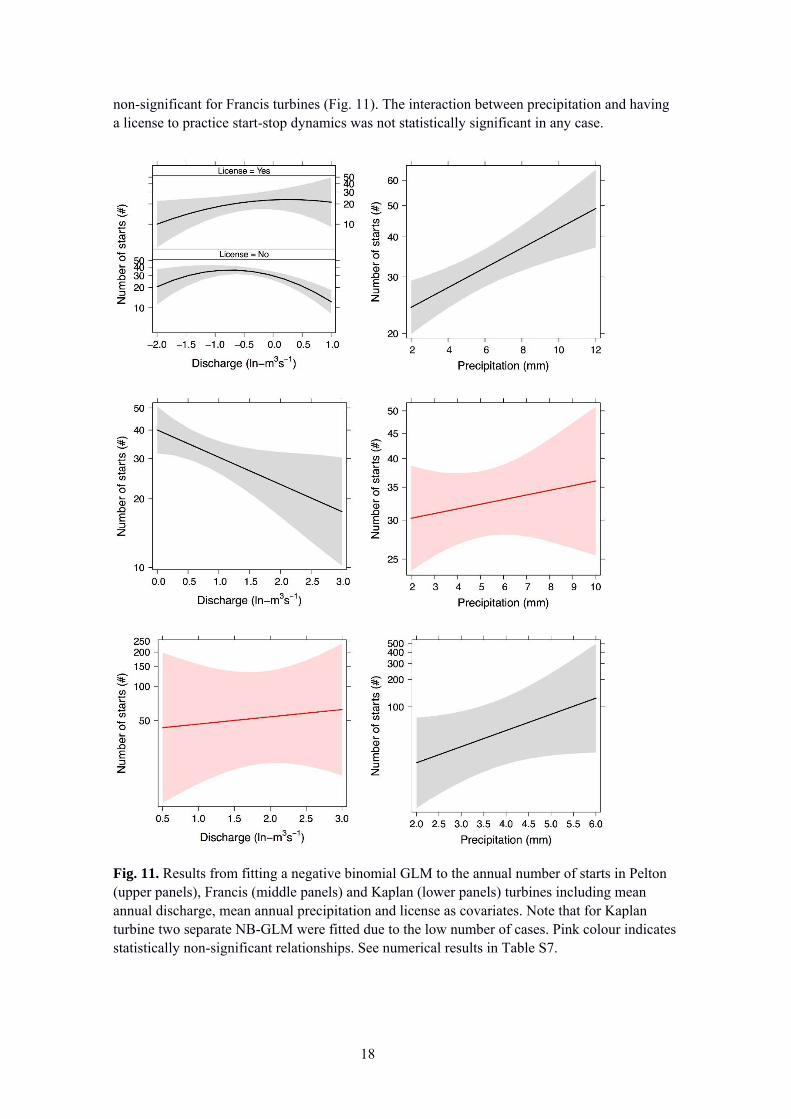
When fitting the full model (eq. 7) including river discharge, rainfall and license as covariates (annual rainfall and river discharge were not correlated; slope = −0.03, p-value = 0.17) different patterns emerged depending on turbine type. First, the shape of the relationship with mean annual discharge varied within Pelton turbines if the hydropower plant had a license to practice start-stop procedures being roughly positive if the license was approved and dome-shaped if the plants did not have the permission (Fig. 11). Mean annual discharge was negatively associated to the number of starts in Francis turbines (Fig. 11), and did not have any influence in Kaplan ones (Fig. 11). Regarding annual precipitation, this factor had a positive effect on the number of starts for both Pelton (Fig. 11) and Kaplan (Fig. 11) turbines, and was
18
non-significant for Francis turbines (Fig. 11). The interaction between precipitation and having a license to practice start-stop dynamics was not statistically significant in any case.
Fig. 11. Results from fitting a negative binomial GLM to the annual number of starts in Pelton (upper panels), Francis (middle panels) and Kaplan (lower panels) turbines including mean annual discharge, mean annual precipitation and license as covariates. Note that for Kaplan turbine two separate NB-GLM were fitted due to the low number of cases. Pink colour indicates statistically non-significant relationships. See numerical results in Table S7.

19
We also modelled other characteristics of the start-stop procedure. In particular, we evaluated the effects of the environmental variables and licensing on the average production of the starts. In doing so, we found a positive water discharge effect on production for both Pelton and Francis (Fig. 12). On the other hand, precipitation had a positive significant effect for Pelton turbine with a stronger effect in the case of having a license to practice start-stop procedure (Fig. 12). Regarding Francis turbine, the effect of precipitation was not significant (Fig. 12). Neither discharge nor precipitation had a significant effect on Kaplan average production of the starts (Fig. 12).
Fig. 12. Effects plots depicting the relationships of water discharge (left panels) and precipitation (right panels) with the average production of starts for Pelton (upper panels), Francis (middle panels), and Kaplan (lower panels) turbines. Pink colour indicates statistically non-significant relationships.

20
Finally, the average duration of starts was positively and negatively related with discharge and precipitation, respectively, in Pelton turbines (Fig. 13). Environmental parameters did not affect average duration of starts either for Francis or Kaplan turbines.
Fig. 13. Effects plots depicting the relationships of water discharge, precipitation and license to practice start-stop procedures with the average duration of starts for Pelton turbines. Note that one HP that never stoped was removed from the model because of the large influence of this observation.
4 Discussion The detailed analysis of the production data from each hydropower plant revealed two major results:
Hydropower plants with restriction to practice start-stop demonstrated higher number of starts than those without restrictions.
Many turbines have an approved maximum capacity that is too high in relation to the mean annual river discharge to secure that the restriction in the license can be complied.
Our analyses are based on the unbiased observation of running practice. One should bear in mind that precipitation is not evenly distributed all year round. This means that the number of starts recorded is occurring during short time intervals. As our analysis only covered one specific year cycle, we are not able to consider the consequences of the hydrological regime of another year. In any case, 2015 was a special year in hydrological terms. The spring was cold and the melting of snow started later and continued therefore into a period of the year that usually is less humid. On an annual basis, 2015 received more precipitation than a “normal” year. Converted into HP production, the precipitation increase was equivalent to 31.5 TWh or 24% of a “normal” year. As 2015 was a wet year, there are reasons to believe that our results are conservative. In a dry year, the number of starts are expected to be higher as the discharge is reduced. How this will affect the difference between HP with restrictions and those without, can only be speculations. However, as HPs with and without restrictions experience the same hydrological regime, we should expect that any differences would be the result of running of the HP and not attributable to the water discharge.
Another important point is that mean annual discharge is the basis for several analysis. Specific seasonal run-off would have improved the modelling, but likely not the main

21
conclusion. Thus, our results are a result of a whole-year analysis. In fact we know that a start-stop procedure when the discharge is higher than maximum turbine capacity would result in a reduction in financial profit. This means that number of starts are restricted to the periods when discharge is lower than the maximum turbine capacity.
We found that mean number of starts for hydropower plants with restrictions had a tendency to be higher than those without restrictions. In addition, the average duration of starts was significantly shorter for plants with restrictions compared to those without restrictions. The latter demonstrate that HPs with restrictions more frequently shift between production and no production than those without restrictions. This implies that HPs with restrictions make more variable and harsher aquatic environment than the other group. Thus, the environmental factors that the restriction was supposed to take care of (most often anadromous salmonids), are mostly affected. To quantify the effect is complicated, however, several studies show that variable water level/discharge affect aquatic environment negatively (review by Bakken et al. 2016). The main conclusions of this review are:
Aquatic insects demonstrate reduced density and biodiversity when exposed to variable water level in rivers, and a catastrophic drift may occur during the first 15 minutes of peaking.
Studies on river mussels are not conclusive. Norwegian studies of mussel behaviour showed increased movements of those exposed to changing water level, and no increased mortality during the experiment. International studies have shown increased mortality in populations exposed to fluctuating water level.
Fluctuating water level affects salmonids in different ways. Stranding of juveniles is of most concern. The extent depends on the season of the year (summer is more critical than winter), time of day (day is more critical than night in winter), fish size (fry is most vulnerable), species (juvenile brown trout is more exposed than juvenile Atlantic salmon), and habitat characteristics (low transect gradient is more critical than steep).
In periods where the run off is larger than the maximum capacity of the HP, start-stop practice has now value. The HP is run constantly for a long period. Otherwise, the company will lose income. In periods where run off is lower than maximum capacity, the HP can be run in two different ways. Either reduce the production in accordance with the discharge, or keep production at maximum as long as possible and stop when appropriate. In the latter case, the intake will be drained in few hours and the HP must stop. After some hours, the intake is filled and the HP can start production again. In the present study there is one example demonstrating this very clear (Fig. 2B). The water level in the intake for this power plant may be regulated by 1 meter making a volume of water available for 14 hours maximum production without any addition of water. The mean duration of starts for this plant was 19.8 hours and mean duration of stops 14.4 hours. This HP has restriction in practicing start-stop schedules, and the application confirmed that the purpose of the intake was to secure a stable and smooth production. In another HP observed in 2008, the intake was much smaller and the production continued for 1 hour (observational data, not modelled) that was identical for emptying the intake. There are no restrictions for this HP.
In addition to these general conditions, efficiency of turbines to produce electricity depends on type and the discharge led through the turbine in relation to the maximum capacity. Pelton turbine is less sensitive to the amount of water for production than Francis and Kaplan.
22
That implies that Pelton turbines are run over a wider interval of water discharges (especially at low values) than Francis and Kaplan. Our results lend support to this. Given these conditions, we argue for two reasons to explain the comprehensive start-stop practice in small Norwegian hydropower plants.
First, large economic interests are connected to hydropower production. The economic value of the produced electricity varies between months, between days of the week, and between daily hours. High prices are achieved in cold periods with low run off, in the week when the demand is high (Monday through Friday), and during the day when consumption is high (daytime). For small HPs especially, daily aspects are mostly important when determining how the plant should be run if there are not sufficient water for continuous high production. Thus, in periods with restricted discharge in the river, there are economic incentives to maximize economic income. The consequence will be daily periods with maximum production and periods with zero production. The production will be coincident with high demand at daytime. Our results demonstrate large variation in daily production with reduced production during night. Maximum may vary among counties, but maximum is chiefly recorded at daytime and early evening.
Liberalization of the energy market has created incentives for hydropower suppliers to behave competitively (Cherry et al. 2005). The market prices affect the companies and the higher the price, the more firms are able to produce (Yucekaya & Metin 2013). In our context, this implies an active handling of the start-stop procedure when deficit in water supply occurs which are in summer and winter. During winter, changes in water flow in the tailrace can be difficult to observe due to snow cover, whereas in summer changing water flow is visible. However, the consequences for aquatic organisms may vary according to time of year. Juvenile salmonids are most sensible to seasonal changes. For instance, due to nocturnal behaviour at low temperature, juvenile brown trout (Salmo trutta) are more susceptible for stranding due to reduction in water flow at day time than at night during winter (Heggenes et al. 1993).
Second, the run of small HP is often outsourced. The owner is usually the landowner who through contracts have made agreements with larger companies to run the power plant. These companies may run many HPs, and there are no mechanisms to secure that they are aware of the details in each specific license. They are not responsible for an accordance between run of the HP and conditions in the license. This responsibility belongs to the owner. Thus, this separation between responsibility and daily running may lead to unintended results.
We found differences between Pelton and Francis turbines in number of starts related to river discharge. Being negative for the Francis turbine and nonlinear with a maximum around 0.6 m3s−1 for the Pelton turbine. The results of nonlinear for Pelton is probably that very small turbines have been installed and that their maximum capacity is considerably lower than the mean annual discharge. The negative relationship between number of starts in Francis and mean annual discharge is probably a result of the function of this turbine. When the discharge decreases to low values, there are two options either increasing the frequency of start-stop or turn it off. The increasing number of start-stop at lower discharge indicates that turn it off is not the first option. This suggests that there seems to be a mismatch between the approved installed capacity and restrictions given in the license. A similar consequence appears for Francis turbines, but contrary to Pelton turbines, the mismatch occurs for the turbines with the smallest capacity. Thus, the approved maximum capacity installed is in many cases in contradiction to
23
the restriction in the license to practice start-stop. This difference between Francis and Pelton is probably a result of their efficiency in power production over a variety of water discharges.
Norway is rich in water, and more than 99% of the Norwegian electricity production comes from hydropower. Thus, precipitation is a crucial factor. Considerable annual variation in precipitation exist, and the North Atlantic oscillation (NAO) is the most important factor explaining 55% of this variation (Cherry et al. 2005). Almost 30% of the variance of Norway’s hydropower output has been explained by variation in the NAO index (Cherry et al. 2005). This shows that changes in climate will affect hydropower production and, consequently, the owners’ management of the hydropower plants. Hamududu & Killingtveit (2012) estimated approximately a 1.5% increase until 2050 in hydropower production in Northern Scandinavia because climate change and increased precipitation. Although the change is small, it may lead to a reduction in number of starts during a year cycle.
5 Conclusions The results of analysing hourly production data in 2015 from 256 small hydropower plants in Norway revealed two major results:
Restriction in the license to practice start-stop did not affect the number of starts.
There is a mismatch between this restriction, approved maximum installed capacity and turbine type.
6 Acknowledgements This project has received financial funds from NVE.
7 References Bakken, T.H., Forseth, T. & Harby, A. (eds.) 2016. Environmental implications of hydro-
peaking – State of the art and recommendations for managers and industry. (Miljøvirkninger av effektkjøring: kunnskapsstatus og råd til forvaltning og industri.) NINA – Temahefte 62. 205 pp. (In Norwegian with summary in English].
Cherry, J., Cullen, H., Visbeck, M., Small, A. & Uvo, C. 2005. Impacts of the North Atlantic Oscillation on Scandinavian hydropower production and energy markets. Water Resources Management, 19, 673−691.
Flodmark, L.E.W., Vøllestad, L.A. & Forseth, T. 2004. Performance of juvenile brown trout exposed to fluctuating water level and temperature. Journal of Fish Biology, 65, 460−470.
Hamududu, B. & Killingtveit, A. 2012. Assessing climate change impacts on global hydropower. Energies, 5, 305−322.
24
Heggens, J. Krog, O.M.W., Lindas, O.R., Dokk, J.G. & Bremnes, T. 1993. Homeostatic behavioural-responses in a changing environment – brown trout (Salmo trutta) become nocturnal during winter. Journal of Animal Ecology, 62, 295−308.
Heggenes, J., Saltveit, S.J., Bird, D. & Grew, R. 2002. Static habitat partitioning and dynamic selection by sympatric young Atlantic salmon and brown trout in south-west England streams. Journal of Fish Biology, 60, 72−86.
Imbert, J.B. & Perru, J.A. 2000. Drift and benthic invertebrate responses to stepwise and abrupt increase on non-scouring flow. Hydrobiologia, 436, 191−208.
McCullagh, P. & Nelder, J. 1989. Generalized Linear Models. 2nd ed. Chapman & Hall, London.
Nieminen, E., Hyytiäinen, K. & Lindroos, M. 2017. Economic and policy considerations regarding hydropower and migratory fish. Fish and Fisheries, 18, 54−78.
Pracheil, B.M., DeRolph, C.R., Schramm, M.P. & Bevelhimer, M.S. 2016. A fish-eye view of riverine hydropower systems: the current understanding of the biological response to turbine passage. Reviews in Fish Biology and Fisheries, 26, 153−167.
Puffer, M., Berg, O.K., Huusko, A., Vehanen, T., Forseth, T. & Einum, S. 2015. Seasonal effects of hydropeaking on growth, energetics and movement of juvenile Atlantic salmon (Salmo salar). River Research and Applications, 31, 1101−1108.
R Core Team (2016) R: A language and environment for statistical computing. In: R Foundation for Statistical Computing. ISBN 3-900051-07-0, URL http://R-project.org
Saltveit, S.J., Halleraker, J. Arnekleiv, J.V., & Harby, A. 2001. Field experiments on stranding in juvenile Atlantic salmon (Salmo salar) and brown trout (Salmo trutta) during rapid flow decrease caused by hydropeaking. River Research and Applications, 17, 609−622.
Stahl, K., Hisdal, H., Hannaford, J., Tallaksen, L.M., van Lanen, H.A.J., Sauquet, E.M. Demuth, S., Fendekova, M., & Jódar, J. 2010. Streamflow trends in Europe: evidence from a dataset of near-natural catchments. Hydrology and Earth System Sciences, 14, 2367−2382.
Wood, S.N. 2006. Generalized Additive Models: An introduction with R. Chapman & Hall/CRC Press, Boca Raton, FL.
Yucekaya, A. & Metin, S.S. 2013. Scheduling pumped hydro power storage systems under price and flow uncertainty. International Journal of Environmental Monitoring and Analysis, 1, 188−193.

25
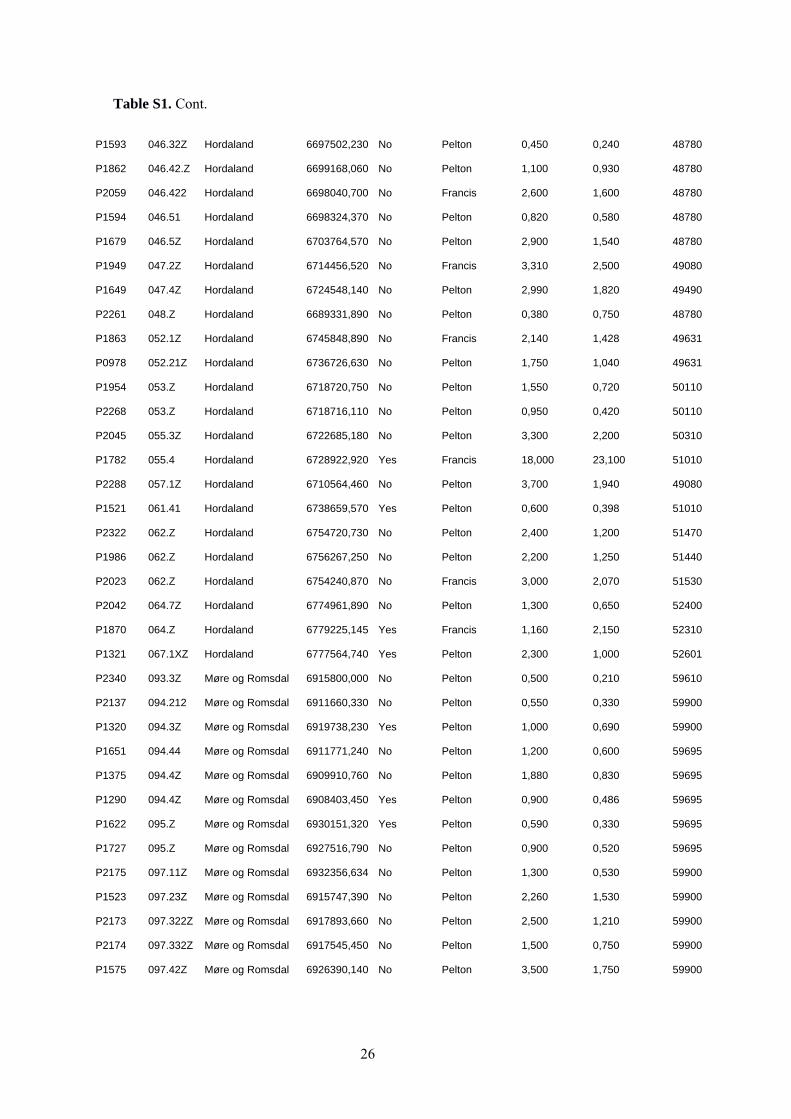
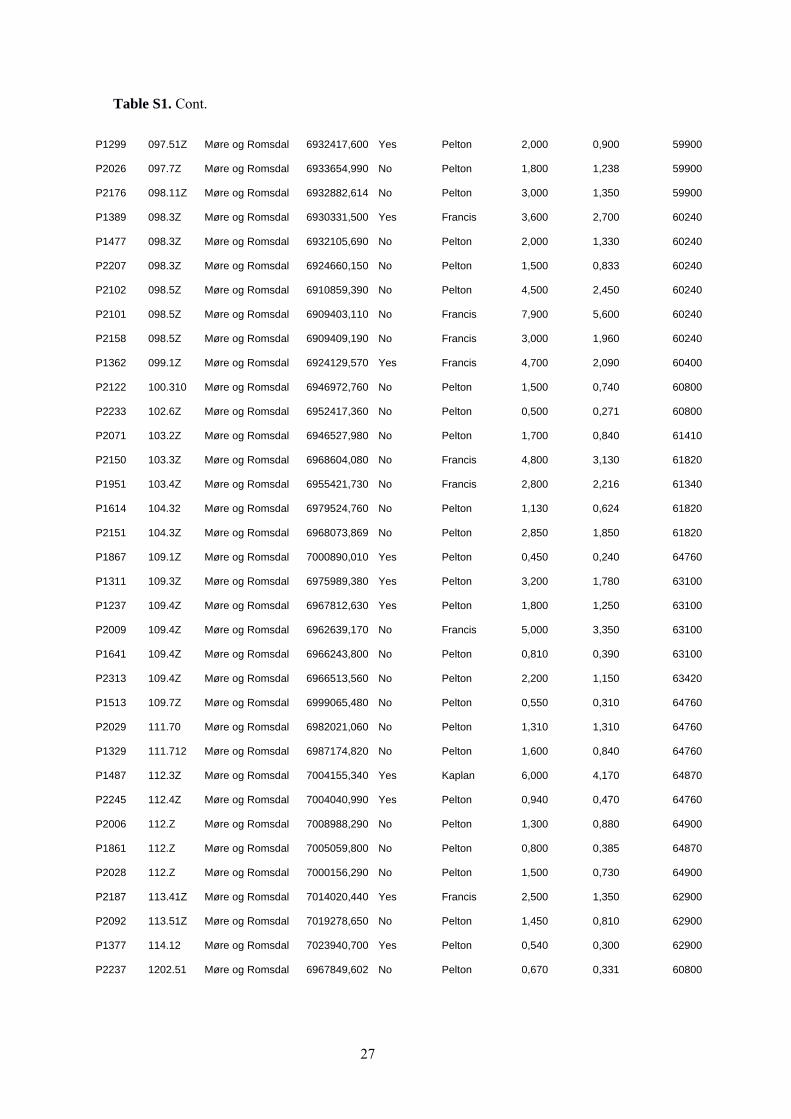
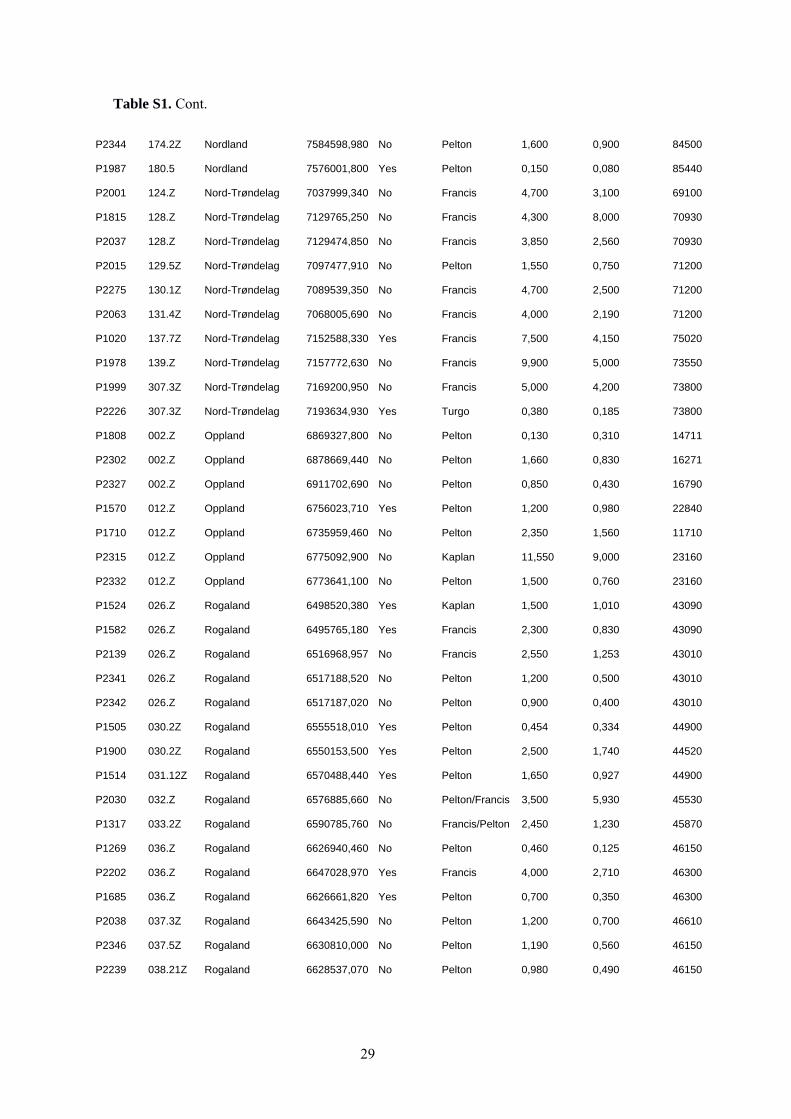
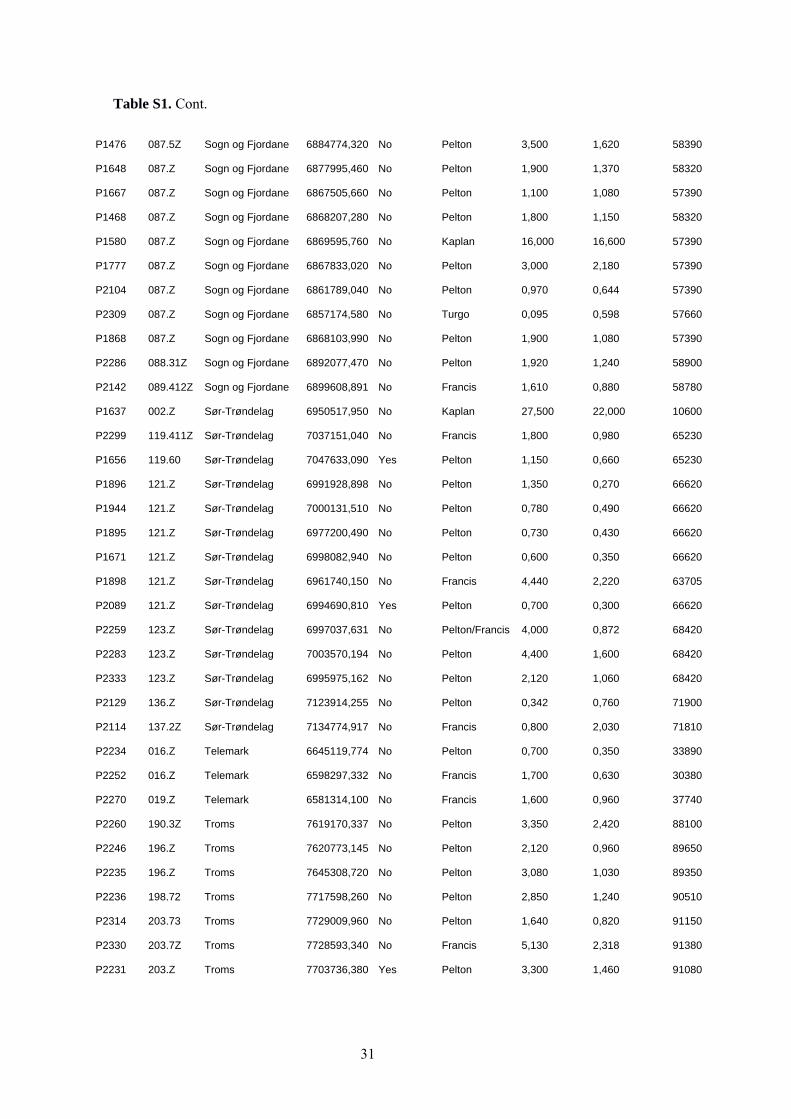
8 Appendix Table S1. Characteristics of the hydropower plants (P-code) used in the analysis. Precipitation station ID as coded by the Norwegian Meteorological Institute (http://met.no).
P-code River-ID County
Latitude (UTM33 grid system)
License to practice start/stop Turbine
Max turbine capacity (m3/s)
Mean annual disch. (m3/s)
Precipitation station ID
P1583 020.Z Aust-Agder 6523245,440 Yes Francis 4,500 2,700 39750
P2334 020.Z Aust-Agder 6511557,770 No Kaplan 26,000 17,500 36110
P2141 021.Z Aust-Agder 6580277,640 No Pelton 1,700 0,700 40250
P1325 021.Z Aust-Agder 6518777,920 No Francis 6,150 3,430 39750
P1584 012.Z Buskerud 6742073,130 Yes Pelton 3,600 2,600 25320
P2326 012.Z Buskerud 6737437,500 No Pelton 1,450 0,644 25320
P2338 012.Z Buskerud 6708314,660 No Pelton 1,000 0,564 20301
P1300 015.Z Buskerud 6722708,030 Yes Pelton 1,200 1,240 25630
P2113 015.Z Buskerud 6695411,640 No Pelton 0,800 0,500 29350
P2075 247.71 Finnmark 7817210,130 Yes Francis 3,200 2,140 99460
P2073 247.71 Finnmark 7812031,410 Yes Francis 2,800 1,480 99460
P2000 002.Z Hedmark 6860396,670 No Pelton 0,600 0,420 7660
P1695 002.Z Hedmark 6813587,900 No Pelton 1,200 0,670 7420
P2032 002.Z Hedmark 6811554,340 No Francis 4,400 2,900 7950
P2196 002.Z Hedmark 6725271,776 No Kaplan 46,000 2,280 6020
P2240 002.Z Hedmark 6856827,668 Yes Francis 3,250 1,640 8450
P2290 002.Z Hedmark 6864926,360 No Pelton 1,100 0,520 7660
P1696 036.Z Hordaland 6656908,230 No Pelton 0,980 0,650 46430
P2317 036.Z Hordaland 6658518,870 No Pelton 2,900 1,671 46430
P1753 041.4 Hordaland 6647712,250 No Pelton 0,200 0,090 47600
P2267 042.11Z Hordaland 6654545,080 No Pelton 0,670 0,380 47600
P1982 042.3Z Hordaland 6671490,160 No Pelton 1,330 0,880 47820
P2061 042.61Z Hordaland 6662036,920 No Pelton 1,000 0,710 47890
P2263 042.61Z Hordaland 6662065,740 No Pelton 2,170 1,100 47890
P2264 042.711Z Hordaland 6664363,990 No Pelton 0,500 0,250 47890
P2067 042.712Z Hordaland 6666108,605 Yes Pelton 1,500 0,820 47890
P2056 045.31Z Hordaland 6675944,190 No Pelton 1,380 0,880 47890
P2126 045.4Z Hordaland 6701715,530 No Pelton 1,760 0,950 48780
26
Table S1. Cont.
P1593 046.32Z Hordaland 6697502,230 No Pelton 0,450 0,240 48780
P1862 046.42.Z Hordaland 6699168,060 No Pelton 1,100 0,930 48780
P2059 046.422 Hordaland 6698040,700 No Francis 2,600 1,600 48780
P1594 046.51 Hordaland 6698324,370 No Pelton 0,820 0,580 48780
P1679 046.5Z Hordaland 6703764,570 No Pelton 2,900 1,540 48780
P1949 047.2Z Hordaland 6714456,520 No Francis 3,310 2,500 49080
P1649 047.4Z Hordaland 6724548,140 No Pelton 2,990 1,820 49490
P2261 048.Z Hordaland 6689331,890 No Pelton 0,380 0,750 48780
P1863 052.1Z Hordaland 6745848,890 No Francis 2,140 1,428 49631
P0978 052.21Z Hordaland 6736726,630 No Pelton 1,750 1,040 49631
P1954 053.Z Hordaland 6718720,750 No Pelton 1,550 0,720 50110
P2268 053.Z Hordaland 6718716,110 No Pelton 0,950 0,420 50110
P2045 055.3Z Hordaland 6722685,180 No Pelton 3,300 2,200 50310
P1782 055.4 Hordaland 6728922,920 Yes Francis 18,000 23,100 51010
P2288 057.1Z Hordaland 6710564,460 No Pelton 3,700 1,940 49080
P1521 061.41 Hordaland 6738659,570 Yes Pelton 0,600 0,398 51010
P2322 062.Z Hordaland 6754720,730 No Pelton 2,400 1,200 51470
P1986 062.Z Hordaland 6756267,250 No Pelton 2,200 1,250 51440
P2023 062.Z Hordaland 6754240,870 No Francis 3,000 2,070 51530
P2042 064.7Z Hordaland 6774961,890 No Pelton 1,300 0,650 52400
P1870 064.Z Hordaland 6779225,145 Yes Francis 1,160 2,150 52310
P1321 067.1XZ Hordaland 6777564,740 Yes Pelton 2,300 1,000 52601
P2340 093.3Z Møre og Romsdal 6915800,000 No Pelton 0,500 0,210 59610
P2137 094.212 Møre og Romsdal 6911660,330 No Pelton 0,550 0,330 59900
P1320 094.3Z Møre og Romsdal 6919738,230 Yes Pelton 1,000 0,690 59900
P1651 094.44 Møre og Romsdal 6911771,240 No Pelton 1,200 0,600 59695
P1375 094.4Z Møre og Romsdal 6909910,760 No Pelton 1,880 0,830 59695
P1290 094.4Z Møre og Romsdal 6908403,450 Yes Pelton 0,900 0,486 59695
P1622 095.Z Møre og Romsdal 6930151,320 Yes Pelton 0,590 0,330 59695
P1727 095.Z Møre og Romsdal 6927516,790 No Pelton 0,900 0,520 59695
P2175 097.11Z Møre og Romsdal 6932356,634 No Pelton 1,300 0,530 59900
P1523 097.23Z Møre og Romsdal 6915747,390 No Pelton 2,260 1,530 59900
P2173 097.322Z Møre og Romsdal 6917893,660 No Pelton 2,500 1,210 59900
P2174 097.332Z Møre og Romsdal 6917545,450 No Pelton 1,500 0,750 59900
P1575 097.42Z Møre og Romsdal 6926390,140 No Pelton 3,500 1,750 59900
27
Table S1. Cont.
P1299 097.51Z Møre og Romsdal 6932417,600 Yes Pelton 2,000 0,900 59900
P2026 097.7Z Møre og Romsdal 6933654,990 No Pelton 1,800 1,238 59900
P2176 098.11Z Møre og Romsdal 6932882,614 No Pelton 3,000 1,350 59900
P1389 098.3Z Møre og Romsdal 6930331,500 Yes Francis 3,600 2,700 60240
P1477 098.3Z Møre og Romsdal 6932105,690 No Pelton 2,000 1,330 60240
P2207 098.3Z Møre og Romsdal 6924660,150 No Pelton 1,500 0,833 60240
P2102 098.5Z Møre og Romsdal 6910859,390 No Pelton 4,500 2,450 60240
P2101 098.5Z Møre og Romsdal 6909403,110 No Francis 7,900 5,600 60240
P2158 098.5Z Møre og Romsdal 6909409,190 No Francis 3,000 1,960 60240
P1362 099.1Z Møre og Romsdal 6924129,570 Yes Francis 4,700 2,090 60400
P2122 100.310 Møre og Romsdal 6946972,760 No Pelton 1,500 0,740 60800
P2233 102.6Z Møre og Romsdal 6952417,360 No Pelton 0,500 0,271 60800
P2071 103.2Z Møre og Romsdal 6946527,980 No Pelton 1,700 0,840 61410
P2150 103.3Z Møre og Romsdal 6968604,080 No Francis 4,800 3,130 61820
P1951 103.4Z Møre og Romsdal 6955421,730 No Francis 2,800 2,216 61340
P1614 104.32 Møre og Romsdal 6979524,760 No Pelton 1,130 0,624 61820
P2151 104.3Z Møre og Romsdal 6968073,869 No Pelton 2,850 1,850 61820
P1867 109.1Z Møre og Romsdal 7000890,010 Yes Pelton 0,450 0,240 64760
P1311 109.3Z Møre og Romsdal 6975989,380 Yes Pelton 3,200 1,780 63100
P1237 109.4Z Møre og Romsdal 6967812,630 Yes Pelton 1,800 1,250 63100
P2009 109.4Z Møre og Romsdal 6962639,170 No Francis 5,000 3,350 63100
P1641 109.4Z Møre og Romsdal 6966243,800 No Pelton 0,810 0,390 63100
P2313 109.4Z Møre og Romsdal 6966513,560 No Pelton 2,200 1,150 63420
P1513 109.7Z Møre og Romsdal 6999065,480 No Pelton 0,550 0,310 64760
P2029 111.70 Møre og Romsdal 6982021,060 No Pelton 1,310 1,310 64760
P1329 111.712 Møre og Romsdal 6987174,820 No Pelton 1,600 0,840 64760
P1487 112.3Z Møre og Romsdal 7004155,340 Yes Kaplan 6,000 4,170 64870
P2245 112.4Z Møre og Romsdal 7004040,990 Yes Pelton 0,940 0,470 64760
P2006 112.Z Møre og Romsdal 7008988,290 No Pelton 1,300 0,880 64900
P1861 112.Z Møre og Romsdal 7005059,800 No Pelton 0,800 0,385 64870
P2028 112.Z Møre og Romsdal 7000156,290 No Pelton 1,500 0,730 64900
P2187 113.41Z Møre og Romsdal 7014020,440 Yes Francis 2,500 1,350 62900
P2092 113.51Z Møre og Romsdal 7019278,650 No Pelton 1,450 0,810 62900
P1377 114.12 Møre og Romsdal 7023940,700 Yes Pelton 0,540 0,300 62900
P2237 1202.51 Møre og Romsdal 6967849,602 No Pelton 0,670 0,331 60800

28
Table S1. Cont.
P2121 145.2Z Nordland 7236759,060 No Pelton 3,400 1,700 76100
P2180 151.1Z Nordland 7297799,700 Yes Francis 7,000 3,650 77230
P2132 152.3 Nordland 7314784,314 No Pelton 1,900 0,880 78250
P2336 155.21Z Nordland 7333162,630 No Pelton 2,400 1,670 78360
P2131 155.31 Nordland 7334899,140 No Francis 3,280 2,090 79700
P2337 155.3Z Nordland 7335019,880 No Francis 2,310 1,160 78360
P2003 155.4Z Nordland 7336884,742 No Pelton 1,530 0,830 78370
P2307 155.Z Nordland 7325175,940 No Pelton 2,100 1,000 78610
P2328 155.Z Nordland 7325175,940 No Pelton 0,800 0,540 78370
P2343 155.Z Nordland 7324482,640 No Pelton 0,800 0,330 78370
P2118 156.22 Nordland 7345748,320 No Pelton 1,350 0,705 79220
P1635 156.Z Nordland 7366555,909 No Pelton 1,500 1,137 79700
P1946 156.Z Nordland 7369335,050 No Pelton 1,300 0,870 79480
P2203 156.Z Nordland 7365333,604 Yes Francis 9,000 3,700 79700
P2331 156.Z Nordland 7363150,560 No Pelton 1,500 0,750 79480
P1652 156.Z Nordland 7367704,810 No Francis 4,000 4,170 79480
P1597 159.52Z Nordland 7390428,110 No Francis 2,800 1,890 80200
P2046 160.20 Nordland 7410020,640 No Pelton 1,340 0,670 80705
P1585 160.51Z Nordland 7424607,210 No Pelton 1,000 0,510 80740
P2282 160.Z Nordland 7409082,690 No Francis 3,000 2,000 80740
P1650 161.1Z Nordland 7425393,830 No Francis 9,000 6,800 80705
P1326 161.4Z Nordland 7439682,760 Yes Francis 1,450 1,580 82110
P2298 161.Z Nordland 7427974,360 No Pelton 1,400 1,030 81650
P2285 161.Z Nordland 7410407,124 No Pelton 1,500 0,920 81775
P1571 162.6Z Nordland 7442902,830 Yes Francis 1,900 0,937 82000
P2110 163.2Z Nordland 7449395,800 Yes Francis 4,080 1,900 82000
P2184 163.5Z Nordland 7443781,810 No Francis 7,200 3,150 82000
P0768 166.4Z Nordland 7466518,500 Yes Francis 2,900 1,800 82000
P2183 168.4Z Nordland 7509055,230 No Pelton 0,750 1,950 83520
P2266 170.2Z Nordland 7537508,880 Yes Pelton 0,400 2,500 83520
P2265 170.2Z Nordland 7536992,420 Yes Francis 4,000 2,500 83520
P2148 171.Z Nordland 7551845,070 No Pelton 1,620 0,540 83710
P1713 173.4 Nordland 7586405,440 No Pelton 1,930 0,640 84070
P2224 173.6Z Nordland 7565155,682 No Pelton 1,350 0,560 83880
P2044 173.71Z Nordland 7567908,760 No Pelton 1,000 0,480 84190
29
Table S1. Cont.
P2344 174.2Z Nordland 7584598,980 No Pelton 1,600 0,900 84500
P1987 180.5 Nordland 7576001,800 Yes Pelton 0,150 0,080 85440
P2001 124.Z Nord-Trøndelag 7037999,340 No Francis 4,700 3,100 69100
P1815 128.Z Nord-Trøndelag 7129765,250 No Francis 4,300 8,000 70930
P2037 128.Z Nord-Trøndelag 7129474,850 No Francis 3,850 2,560 70930
P2015 129.5Z Nord-Trøndelag 7097477,910 No Pelton 1,550 0,750 71200
P2275 130.1Z Nord-Trøndelag 7089539,350 No Francis 4,700 2,500 71200
P2063 131.4Z Nord-Trøndelag 7068005,690 No Francis 4,000 2,190 71200
P1020 137.7Z Nord-Trøndelag 7152588,330 Yes Francis 7,500 4,150 75020
P1978 139.Z Nord-Trøndelag 7157772,630 No Francis 9,900 5,000 73550
P1999 307.3Z Nord-Trøndelag 7169200,950 No Francis 5,000 4,200 73800
P2226 307.3Z Nord-Trøndelag 7193634,930 Yes Turgo 0,380 0,185 73800
P1808 002.Z Oppland 6869327,800 No Pelton 0,130 0,310 14711
P2302 002.Z Oppland 6878669,440 No Pelton 1,660 0,830 16271
P2327 002.Z Oppland 6911702,690 No Pelton 0,850 0,430 16790
P1570 012.Z Oppland 6756023,710 Yes Pelton 1,200 0,980 22840
P1710 012.Z Oppland 6735959,460 No Pelton 2,350 1,560 11710
P2315 012.Z Oppland 6775092,900 No Kaplan 11,550 9,000 23160
P2332 012.Z Oppland 6773641,100 No Pelton 1,500 0,760 23160
P1524 026.Z Rogaland 6498520,380 Yes Kaplan 1,500 1,010 43090
P1582 026.Z Rogaland 6495765,180 Yes Francis 2,300 0,830 43090
P2139 026.Z Rogaland 6516968,957 No Francis 2,550 1,253 43010
P2341 026.Z Rogaland 6517188,520 No Pelton 1,200 0,500 43010
P2342 026.Z Rogaland 6517187,020 No Pelton 0,900 0,400 43010
P1505 030.2Z Rogaland 6555518,010 Yes Pelton 0,454 0,334 44900
P1900 030.2Z Rogaland 6550153,500 Yes Pelton 2,500 1,740 44520
P1514 031.12Z Rogaland 6570488,440 Yes Pelton 1,650 0,927 44900
P2030 032.Z Rogaland 6576885,660 No Pelton/Francis 3,500 5,930 45530
P1317 033.2Z Rogaland 6590785,760 No Francis/Pelton 2,450 1,230 45870
P1269 036.Z Rogaland 6626940,460 No Pelton 0,460 0,125 46150
P2202 036.Z Rogaland 6647028,970 Yes Francis 4,000 2,710 46300
P1685 036.Z Rogaland 6626661,820 Yes Pelton 0,700 0,350 46300
P2038 037.3Z Rogaland 6643425,590 No Pelton 1,200 0,700 46610
P2346 037.5Z Rogaland 6630810,000 No Pelton 1,190 0,560 46150
P2239 038.21Z Rogaland 6628537,070 No Pelton 0,980 0,490 46150

30
Table S1. Cont.
P2004 038.2Z Rogaland 6627912,210 No Francis 5,730 3,430 46150
P0512 038.3Z Rogaland 6638216,620 No Pelton 4,250 3,100 46850
P2152 039.12 Rogaland 6616582,770 No Pelton 0,530 0,300 46930
P2221 039.2 Rogaland 6617865,034 No Pelton 1,040 0,500 46930
P2324 041.320 Rogaland 6646809,410 No Pelton 0,488 0,488 46930
P1322 068.61 Sogn og Fjordane 6799195,190 Yes Pelton 2,700 0,680 52860
P1298 073.11 Sogn og Fjordane 6800495,070 Yes Pelton 2,000 0,340 54110
P2297 073.Z Sogn og Fjordane 6784508,626 Yes Francis 3,900 2,390 54420
P2107 074.4Z Sogn og Fjordane 6812148,850 No Pelton 2,100 1,380 54780
P1714 075.5Z Sogn og Fjordane 6835827,390 Yes Francis 5,000 3,360 55300
P1627 076.Z Sogn og Fjordane 6853824,410 No Pelton 0,930 0,550 55300
P2036 077.1Z Sogn og Fjordane 6809734,880 No Pelton 1,530 0,602 55770
P2025 078.6Z Sogn og Fjordane 6823862,540 No Brekke 1,500 0,840 55928
P2143 079.310 Sogn og Fjordane 6805652,600 Yes Pelton 0,610 0,304 55928
P2022 079.54 Sogn og Fjordane 6812239,840 No Pelton 2,500 1,790 52990
P2191 080.4Z Sogn og Fjordane 6818001,520 No Francis 2,100 1,340 52970
P2031 083.12Z Sogn og Fjordane 6838548,610 No Pelton 1,600 0,840 56780
P1206 083.4Z Sogn og Fjordane 6843355,420 Yes Pelton 1,900 1,080 56420
P1511 084.612 Sogn og Fjordane 6852547,230 No Pelton 0,830 0,567 57660
P1638 084.72 Sogn og Fjordane 6852551,900 No Pelton 0,900 0,618 57660
P1240 084.Z Sogn og Fjordane 6841990,030 Yes Pelton 0,980 1,140 57660
P1330 084.Z Sogn og Fjordane 6850598,040 Yes Pelton 1,920 1,070 57660
P1469 084.Z Sogn og Fjordane 6840985,070 No Francis 1,390 0,830 57660
P1534 084.Z Sogn og Fjordane 6850910,250 No Pelton 1,800 1,310 58320
P2088 084.Z Sogn og Fjordane 6851086,720 No Pelton 0,700 0,527 57660
P2105 084.Z Sogn og Fjordane 6849280,060 No Pelton 3,000 2,000 57660
P2153 084.Z Sogn og Fjordane 6851729,020 No Pelton 0,850 0,500 57660
P2124 084.Z Sogn og Fjordane 6851382,430 No Pelton 1,300 0,670 57660
P2164 085.3Z Sogn og Fjordane 6866130,581 No Pelton 0,800 0,513 57660
P1592 085.Z Sogn og Fjordane 6873273,670 No Francis 2,300 2,000 58320
P1611 086.81Z Sogn og Fjordane 6888715,090 No Francis 4,300 3,200 58320
P1256 086.8Z Sogn og Fjordane 6877661,170 No Francis 7,000 5,500 57990
P2093 086.920 Sogn og Fjordane 6879780,000 Yes Pelton 0,700 0,380 57940
P1334 086.Z Sogn og Fjordane 6870376,090 No Pelton 1,900 1,370 57990
P1328 087.40 Sogn og Fjordane 6881345,250 Yes Pelton 0,500 0,350 58390
31
Table S1. Cont.
P1476 087.5Z Sogn og Fjordane 6884774,320 No Pelton 3,500 1,620 58390
P1648 087.Z Sogn og Fjordane 6877995,460 No Pelton 1,900 1,370 58320
P1667 087.Z Sogn og Fjordane 6867505,660 No Pelton 1,100 1,080 57390
P1468 087.Z Sogn og Fjordane 6868207,280 No Pelton 1,800 1,150 58320
P1580 087.Z Sogn og Fjordane 6869595,760 No Kaplan 16,000 16,600 57390
P1777 087.Z Sogn og Fjordane 6867833,020 No Pelton 3,000 2,180 57390
P2104 087.Z Sogn og Fjordane 6861789,040 No Pelton 0,970 0,644 57390
P2309 087.Z Sogn og Fjordane 6857174,580 No Turgo 0,095 0,598 57660
P1868 087.Z Sogn og Fjordane 6868103,990 No Pelton 1,900 1,080 57390
P2286 088.31Z Sogn og Fjordane 6892077,470 No Pelton 1,920 1,240 58900
P2142 089.412Z Sogn og Fjordane 6899608,891 No Francis 1,610 0,880 58780
P1637 002.Z Sør-Trøndelag 6950517,950 No Kaplan 27,500 22,000 10600
P2299 119.411Z Sør-Trøndelag 7037151,040 No Francis 1,800 0,980 65230
P1656 119.60 Sør-Trøndelag 7047633,090 Yes Pelton 1,150 0,660 65230
P1896 121.Z Sør-Trøndelag 6991928,898 No Pelton 1,350 0,270 66620
P1944 121.Z Sør-Trøndelag 7000131,510 No Pelton 0,780 0,490 66620
P1895 121.Z Sør-Trøndelag 6977200,490 No Pelton 0,730 0,430 66620
P1671 121.Z Sør-Trøndelag 6998082,940 No Pelton 0,600 0,350 66620
P1898 121.Z Sør-Trøndelag 6961740,150 No Francis 4,440 2,220 63705
P2089 121.Z Sør-Trøndelag 6994690,810 Yes Pelton 0,700 0,300 66620
P2259 123.Z Sør-Trøndelag 6997037,631 No Pelton/Francis 4,000 0,872 68420
P2283 123.Z Sør-Trøndelag 7003570,194 No Pelton 4,400 1,600 68420
P2333 123.Z Sør-Trøndelag 6995975,162 No Pelton 2,120 1,060 68420
P2129 136.Z Sør-Trøndelag 7123914,255 No Pelton 0,342 0,760 71900
P2114 137.2Z Sør-Trøndelag 7134774,917 No Francis 0,800 2,030 71810
P2234 016.Z Telemark 6645119,774 No Pelton 0,700 0,350 33890
P2252 016.Z Telemark 6598297,332 No Francis 1,700 0,630 30380
P2270 019.Z Telemark 6581314,100 No Francis 1,600 0,960 37740
P2260 190.3Z Troms 7619170,337 No Pelton 3,350 2,420 88100
P2246 196.Z Troms 7620773,145 No Pelton 2,120 0,960 89650
P2235 196.Z Troms 7645308,720 No Pelton 3,080 1,030 89350
P2236 198.72 Troms 7717598,260 No Pelton 2,850 1,240 90510
P2314 203.73 Troms 7729009,960 No Pelton 1,640 0,820 91150
P2330 203.7Z Troms 7728593,340 No Francis 5,130 2,318 91380
P2231 203.Z Troms 7703736,380 Yes Pelton 3,300 1,460 91080

32
Table S1. Cont.
P2293 204.82 Troms 7695744,760 No Pelton 1,600 0,870 91380
P2200 204.92 Troms 7702327,097 No Pelton 0,727 0,330 91380
P2210 204.Z Troms 7688221,450 No Pelton 0,920 0,410 91380
P2262 210.3Z Troms 7784568,850 No Pelton 2,300 1,180 91380
P1919 022.Z Vest-Agder 6527500,492 No Pelton 0,480 0,209 41550
P2053 022.Z Vest-Agder 6513934,770 No Francis 1,700 0,715 41200
P2140 023.Z Vest-Agder 6487185,240 No Francis 1,300 0,670 41200
P1660 023.Z Vest-Agder 6471945,390 No Pelton 1,250 0,800 41200
P1700 023.Z Vest-Agder 6480717,000 Yes Francis 3,000 1,600 41200
P1904 025.Z Vest-Agder 6516252,500 Yes Francis 3,500 2,190 42520
P1419 025.Z Vest-Agder 6524783,970 No Pelton 1,800 1,140 42520
P1439 025.Z Vest-Agder 6493610,260 Yes Pelton 0,600 0,400 41860
P1917 025.Z Vest-Agder 6518149,570 Yes Francis 0,900 0,450 42520
P2035 025.Z Vest-Agder 6496312,890 No Pelton 2,700 1,360 41860
P2251 025.Z Vest-Agder 6512604,090 No Francis 5,700 2,700 42520
P1926 026.Z Vest-Agder 6523342,370 Yes Francis 2,050 1,410 42810
P2281 026.Z Vest-Agder 6518987,530 Yes Francis 5,100 4,900 42810
P1473 026.Z Vest-Agder 6518699,910 Yes Pelton 1,400 0,900 42810

33
Table S2. Numerical results for the generalized additive model (equation 1 in the main text) fitted to the daily precipitation data (P). SE = Standard Error, EDF = estimated degrees of freedom, DE = deviance explained.
Parameter Estimate (SE) t-value EDF F-value P-value
Intercept 5.12 (0.04) 121.7 <0.0001
DoY, La 10.95 285.2 <0.0001
N = 48068 DE = 6.1%
Table S3. Numerical results for the generalized additive model fitted to the hourly production data for Pelton plants (equation 2 in the main text). SE = Standard Error, EDF = estimated degrees of freedom, DE = deviance explained.
Parameter Estimate (SE) t-value EDF F-value P-value
Intercept 1.33 (0.001) 1131 <0.0001
H, La 10.99 335.7 <0.0001
W, La 9.99 2815.6 <0.0001
DoY, La 10 24453.6 <0.0001
N = 1576620 DE = 15.3%
Table S4. Numerical results for the generalized additive model fitted to the hourly production data for Francis plants (equation 2 in the main text). SE = Standard Error, EDF = estimated degrees of freedom, DE = deviance explained.
Parameter Estimate (SE) t-value EDF F-value P-value
Intercept 1.49 (0.002) 674 <0.0001
H, La 6.62 14.01 <0.0001
W, La 10 1357.18 <0.0001
DoY, La 10 2000.09 <0.0001
N = 604371 DE = 5.4%
34
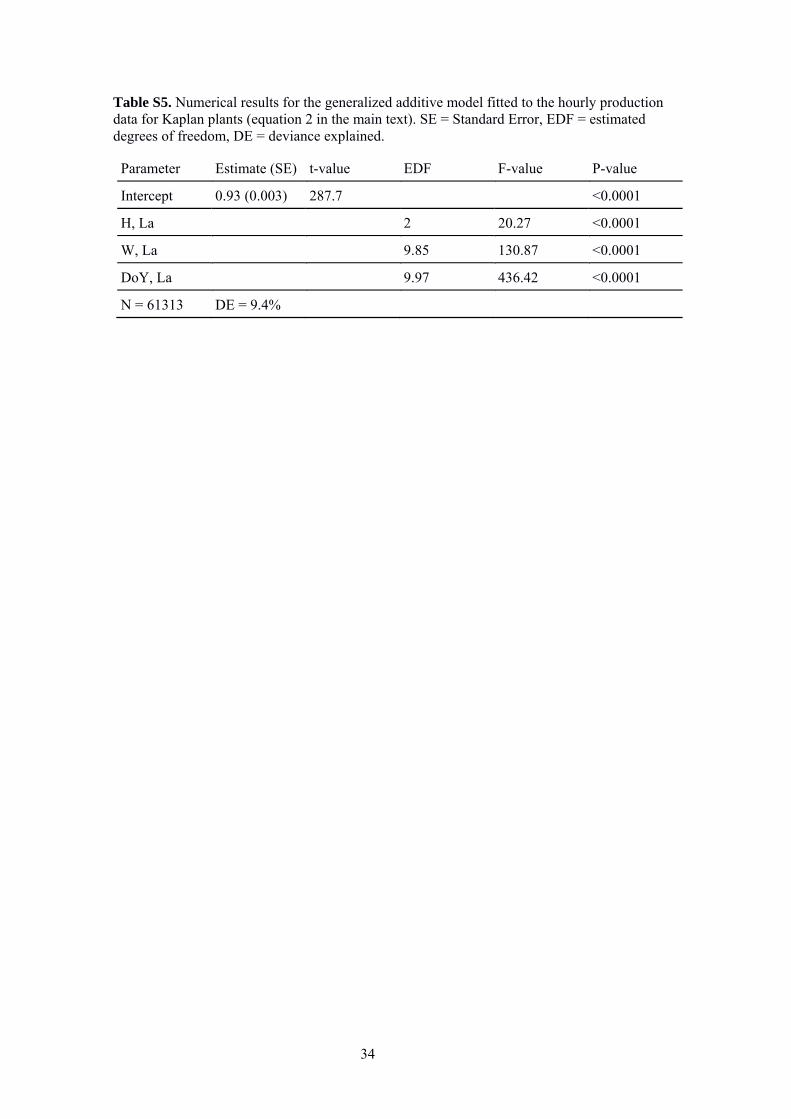
Table S5. Numerical results for the generalized additive model fitted to the hourly production data for Kaplan plants (equation 2 in the main text). SE = Standard Error, EDF = estimated degrees of freedom, DE = deviance explained.
Parameter Estimate (SE) t-value EDF F-value P-value
Intercept 0.93 (0.003) 287.7 <0.0001
H, La 2 20.27 <0.0001
W, La 9.85 130.87 <0.0001
DoY, La 9.97 436.42 <0.0001
N = 61313 DE = 9.4%

35
Table S6. Numerical results for the generalized model (equation 3 in the main text) fitted to the daily production data as a function of precipitation, day of the year and geographic location for each turbine type (A−C). Note that production and precipitation were natural log transformed. Note also that due to the low number of Kaplan plants the two-dimensional smoother was replaced by a HP factor. SE = Standard Error, EDF = estimated degrees of freedom, DE = deviance explained.
(A) Pelton
Parameter Estimate (SE) t-value EDF F-value P-value
Intercept 2.69 (0.005) 532.1 <0.0001
P 1.98 2208 <0.0001
DoY 4 3048 <0.0001
Lo, La 10.83 277 <0.0001
N = 65604 DE = 23.2%
(B) Francis
Parameter Estimate (SE) t-value EDF F-value P-value
Intercept 2.76 (0.009) 294.7 <0.0001
P 1.93 462.6 <0.0001
DoY 3.99 205.8 <0.0001
Lo, La 10.88 67.1 <0.0001
N = 25146 DE = 9%
(C) Kaplan
Parameter Estimate (SE) t-value EDF F-value P-value
Intercept 2.38 (0.061) 38.95 <0.0001
P1524 −1.14 (0.086) −13.22 <0.0001
P1580 0.87 (0.087) 10.09 <0.0001
P1637 0.48 (0.087) 5.48 <0.0001
P2196 0.93 (0.087) 10.73 <0.0001
P2315 −0.82 (0.087) −9.45 <0.0001
P2334 0.57 (0.086) 6.65 <0.0001
P 1 58.87 <0.0001
DoY 3.60 19.73 <0.0001
N = 2555 DE = 32.4%

36
Table S7. Numerical results for the generalized linear model (equation 7 in the main text) fitted to the data on number of starts as a function of annual discharge, precipitation and license for each turbine type (A−C). Note that in the case of Pelton a quadratic term was included in the model. Note also that for Kaplan turbine two separate NB-GLM were fitted due to the low number of cases that prevented fitting the full model (eq. 7 in the main text). Interactive effects are shown only if they were statistically significant.
(A) Pelton
Parameter Estimate (SE) z-value P-value
Intercept 2.97 (0.13) 23.48 <0.0001
QR −2.17 (0.92) −2.36 0.01818
QR2 −3.39 (0.96) −3.53 0.0004
P 0.07 (0.02) 3.68 0.0002
L* −0.35 (0.15) −2.30 0.0214
QR:L 4.09 (1.86) 2.20 0.0282
QR2:L 1.84 (1.92) 0.95 0.3403 *Note that the reference level for License (L) is yes (Y).
(B) Francis
Parameter Estimate (SE) z-value P-value
Intercept 3.58 (0.20) 17.98 <0.0001
QR −0.27 (0.12) −2.33 0.0196
P 0.02 (0.03) 0.69 0.493
(C) Kaplan
Parameter Estimate (SE) z-value P-value
Intercept 3.70 (0.73) 5.06 <0.0001
QR 0.15 (0.34) 0.44 0.661
Intercept 2.37 (0.75) 3.17 <0.0015
P 0.41 (0.18) 2.24 0.0252

37
Fig. S1. Daily precipitation recorded in each weather station as downloaded from http://met.no. Numbers on top correspond to each station’s code as classified on the web page (see Table S1 to match with the corresponding river).
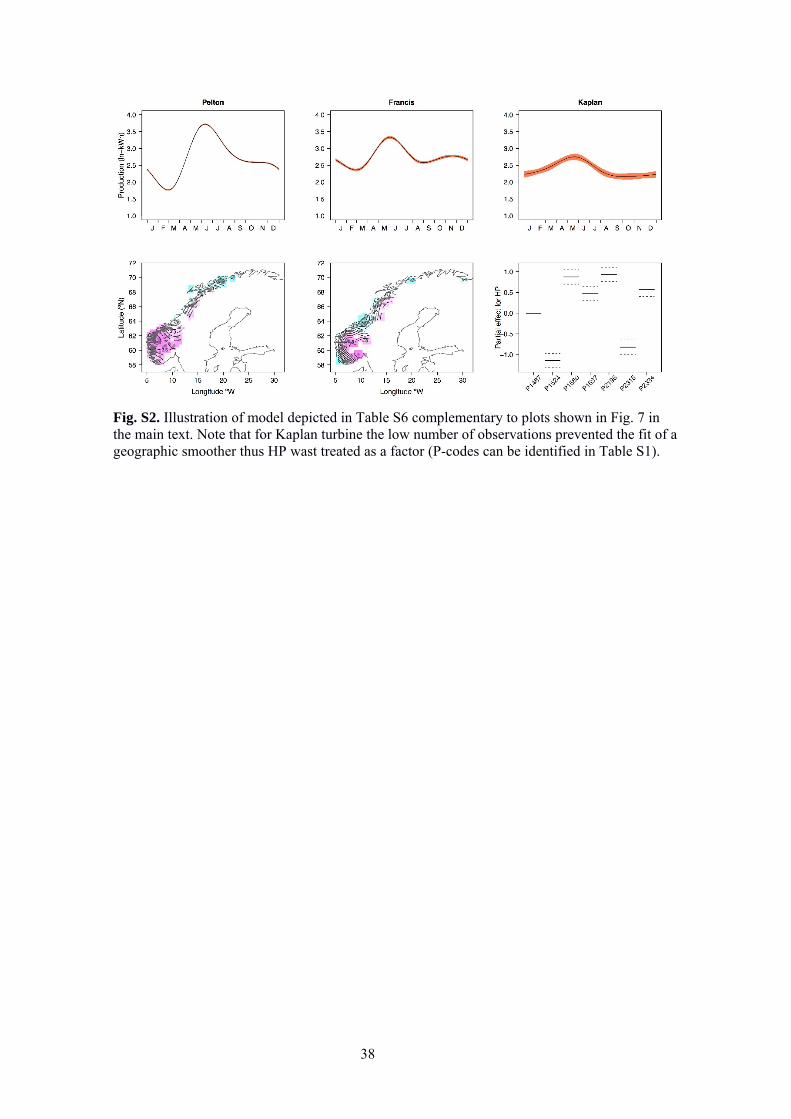
38
Fig. S2. Illustration of model depicted in Table S6 complementary to plots shown in Fig. 7 in the main text. Note that for Kaplan turbine the low number of observations prevented the fit of a geographic smoother thus HP wast treated as a factor (P-codes can be identified in Table S1).

Norwegian Water Resources and Energy Directorate
Middelthunsgate 29Postboks 5091 Majorstuen0301 Oslo
Telephone: 09575 Internet: www.nve.no