stark county32fa3a56-b3f6-4b8b-a428... · 2 population stark county’s population has shown a slow...
TRANSCRIPT
i
STARK COUNTY
BACKGROUND REPORT
UPDATE
2010

i
Table of Contents
OVERVIEW OF THE UPDATED BACKGROUND REPORT .......................................... 1
POPULATION ................................................................................................................. 2
Racial & Ethnic Background ..................................................................................8
LOCAL ECONOMIC FACTORS ..................................................................................... 9
MANUFACTURING ...................................................................................................... 21
TOURISM ..................................................................................................................... 22
TRANSPORTATION ..................................................................................................... 35
ROAD NETWORKS ...................................................................................................... 39
EMPLOYMENT ............................................................................................................. 40
RETAIL SALES ............................................................................................................. 42
HEALTH SERVICES ..................................................................................................... 44
HOUSING ..................................................................................................................... 46
EDUCATION ................................................................................................................. 52
WASTE DISPOSAL ...................................................................................................... 57
PUBLIC UTILITIES ....................................................................................................... 58
GOVERNMENT AND GOVERNMENT FINANCES ...................................................... 59
LAND AND MINERAL OWNERSHIP ............................................................................ 63
Coal .....................................................................................................................66 Oil ........................................................................................................................68
Uranium Development .........................................................................................70 Wind Energy Development ..................................................................................71
Ethanol Production ..............................................................................................71

ii
Table of Tables
Table #
1: 1920 REGION VIII POPULATION .......................................................................... 2
2: POPULATION ..............................................................................................................3
3: POPULATION CHANGE 1930 TO 2005 ..................................................................... 5
4: POPULATION DENSITY PER SQUARE MILE ........................................................... 5
5: CITY POPULATION IN 2000 ...................................................................................... 6
6: REGION VIII & NORTH DAKOTA MEDIAN AGE ....................................................... 6
7: POPULATION PROJECTIONS .................................................................................. 7
8: SELECTED POPULATION CHARACTERISTICS, STARK COUNTY ........................ 8
9: AVERAGE SIZE, NUMBER AND LAND IN FARMS 1987-2007 ................................. 9
10: AGRICULTURAL LAND VALUES REGION VIII ..................................................... 10
11: AG COUNTY RANKING 2007 REGION VIII: CROP PRODUCTION, LIVESTOCK 11
12: LIVESTOCK COMPARISON 2008 AND 5-YEAR AVERAGE 2004-2008 ............... 12
13: CROP COMPARISON 2007 5-YEAR AVERAGE: WHEAT .................................... 13
14: CROP COMPARISON 2007 5-YEAR AVERAGE: BARLEY ................................... 14
15: CROP COMPARISON 2007 5-YEAR AVERAGE: OATS ....................................... 15
16: CROP COMPARISON 2007 5-YEAR AVERAGE: SUNFLOWERS ........................ 16
17: CROP COMPARISON 2007 5-YEAR AVERAGE: ALL HAY .................................. 17
18: CROP COMPARISON 2007 5-YEAR AVERAGE: ALFALFA HAY ......................... 18
19: CROP COMPARISON 2007 5-YEAR AVERAGE: CORN SILAGE ......................... 19
20: AGRICULTURAL LAND RENT VALUE REGION VIII CROP LAND & PASTURE .. 20
21: CITY OF DICKINSON HOSPITALITY TAX ............................................................. 28
22: NUMBER OF TOURISM ENTITIES SERVING SW ND BY COUNTY .................... 29
23: DICKINSON LODGING TAX ................................................................................... 31
24: LABOR FORCE SUB-STATE REGION VIII 2004-2008 .......................................... 40
25: UNEMPLOYMENT RATES REGION VIII 1990-2009 ............................................. 41
26: COMPARISON OF TAXABLE SALES AND TAXABLE PURCHASES ................... 42
27: TAXABLE SALES AND PURCHASES BY STARK COUNTY CITIES .................... 42
28: 2008 PROPERTY RATE AND COUNTY RANK IN STATE .................................... 43
29: MEDIAN FAMILY NCOME ...................................................................................... 43
30: HOUSING STOCK PROFILE/YEAR STRUCTURE BUILT ..................................... 47
31: TENURE BY HOUSEHOLD .................................................................................... 49
32: STARK COUNTY HOUSING CHARACTERISTICS 2009 ....................................... 50
33: OWNER OCCUPIED HOMES AND MEDIAN VALUE IN 2000 ............................... 50
iii
34: 2000 HOUSING VALUES OF SPECIFIED OWNER OCCUPIED HOMES ............. 51
35 BUILDING PERMITS 2009 ...................................................................................... 51
36: STARK COUNTY SCHOOL DISTRICTS: STUDENTS, VALUATION & COSTS .... 54
37: REGION VIII AND ND POPULATION UNDER AGE 18.......................................... 55
38: 2000 EDUCATIONAL ATTAINMENT OF PERSONS 25 YRS. AND OLDER ......... 55
39: AREA SCHOOL ENROLLMENT (K-12) .................................................................. 56
40. 2009 ABSTRACT OF TAX LEVIES, STARK COUNTY........................................... 62
41: MONTHLY OIL PRODUCTION FOR LOCAL COUNTIES ...................................... 68
42: OIL AND GAS PRODUCTION STARK COUNTY ................................................... 69
Table of Maps
Map #
1: STARK COUNTY 2000 POPULATION BY CENSUS TRACTS ...................................4
2. BELFIELD SITE .........................................................................................................22
3. NORTH DICKINSON SITE .......................................................................................23
4. SOUTH DICKINSON SITE ........................................................................................24
5. T.R. DICKINSON AIRPORT SITE ............................................................................25
6. EAST DICKINSON SITE ...........................................................................................26
7. RICHARDTON SITE .................................................................................................27
8. STARK COUNTY ZONING/LAND USE ....................................................................32
9. STARK COUNTY LAND USE ...................................................................................33
10: STARK COUNTY PUBLIC LAND ............................................................................34
11: STATE HIGHWAY PERFORMANCE CLASSIFICATION SYSTEM.........................36
12: STARK COUNTY TRANSPORTATION ...................................................................37
13: DICKINSON THEODORE ROOSEVELT REGIONAL AIRPORT .............................38
14: STARK COUNTY HEALTH SERVICES ...................................................................45
15: STARK COUNTY SCHOOL DISTRICTS .................................................................53
16: STARK COUNTY LEGISLATIVE DISTRICTS .........................................................60
17: STARK COUNTY FIRE DISTRICTS ........................................................................61
18: FEDERAL MINERAL OWNERSHIP.........................................................................64
19: BURLINGTON NORTHERN OWNERSHIP .............................................................65
20. STARK COUNTY KNOWN COAL RESERVES .......................................................67
1
OVERVIEW OF THE UPDATED BACKGROUND REPORT
The contents of the following report are intended as an update to the existing 1981 Stark
County, North Dakota, Background Report. The discussion in this report supplements the 1981 report and attempts to bridge the gap in time on factors of local importance. Selected categories are addressed for those topics that are dynamic in nature and continually change over time.

2
POPULATION
Stark County’s population has shown a slow but steady growth since it became a county. In
1920, 13,542 people resided in the county. That number increased to 22,635 by the year 2000 (2000 Census data). Stark County did not experience the same population declines that its neighboring counties did over this period of time. As the economic hub of southwestern North Dakota, Stark County was insulated from many of the factors leading to population out-migration.
Estimates for the years since the 2000 tally by the Federal Census Bureau indicate a slight
increase in the county population; a 0.9% increase to 22,847 residents. These numbers do not reflect the increases attributable to the current energy development within the county and region. The 2010 Census data should give a clearer picture as to the current population of the county. The number is expected to increase substantially.
Table 1
1920 REGION VIII POPULATION
Area 1920 Population
Adams 5,593
Billings 3,126
Bowman 4,768
Dunn 8,828
Golden Valley 4,832
Hettinger 7,685
Slope 4,940
Stark 13,542
Total 53,314
Source: U.S. Census Bureau

3
Table 2
POPULATION
c 1930 1940 1950 1960 1970 1980 1990 2000
Adams 6,343 4,664 4,910 4,449 3,832 3,584 3,174 2,593
Billings 3,140 2,531 1,777 1,513 1,198 1,138 1,108 888
Bowman 5,119 3,860 4,001 4,154 3,901 4,229 3,596 3,242
Dunn 9,566 8,376 7,212 6,350 4,895 4,627 4,005 3,600
Golden Valley 4,122 3,498 3,499 3,100 2,611 2,391 2,108 1,924
Hettinger 8,796 7,457 7,100 6,317 5,075 4,275 3,445 2,715
Slope 4,150 2,932 2,315 1,893 1,484 1,157 907 767
Stark 15,340 15,414 16,137 18,451 19,613 23,697 22,832 22,636
Region VIII 56,576 48,732 46,951 46,227 42,609 45,098 41,175 38,365
State 680,845 641,935 619,636 632,446 617,761 652,717 638,800 642,200
Source: U.S. Census Bureau

4
Map 1

5
Table 3
POPULATION CHANGE 1930 TO 2000
Area Percent
Adams
-41%
Billings -72%
Bowman -47%
Dunn -62%
Golden Valley -54%
Hettinger -69%
Slope -92%
Stark 47%
Region VIII -33%
State -6%
Table 4
POPULATION DENSITY PER SQUARE MILE
Area Square miles 1920 1990 2000
Adams
987.91
5.56
3.21
2.6
Billings 1,151.41 2.74 0.97 0.8
Bowman 1,162.05 4.07 3.07 2.8
Dunn 2,009.60 4.43 2.01 1.8
Golden Valley 1,001.99 4.76 2.08 1.9
Hettinger 1,132.25 6.77 3.04 2.4
Slope 1,217.94 4.03 0.74 0.6
Stark 1,338.16 13.5 17.35 16.9
Average na 5.7 4.1 3.7
Source: U.S. Census Bureau, N.D. State Data Center
6
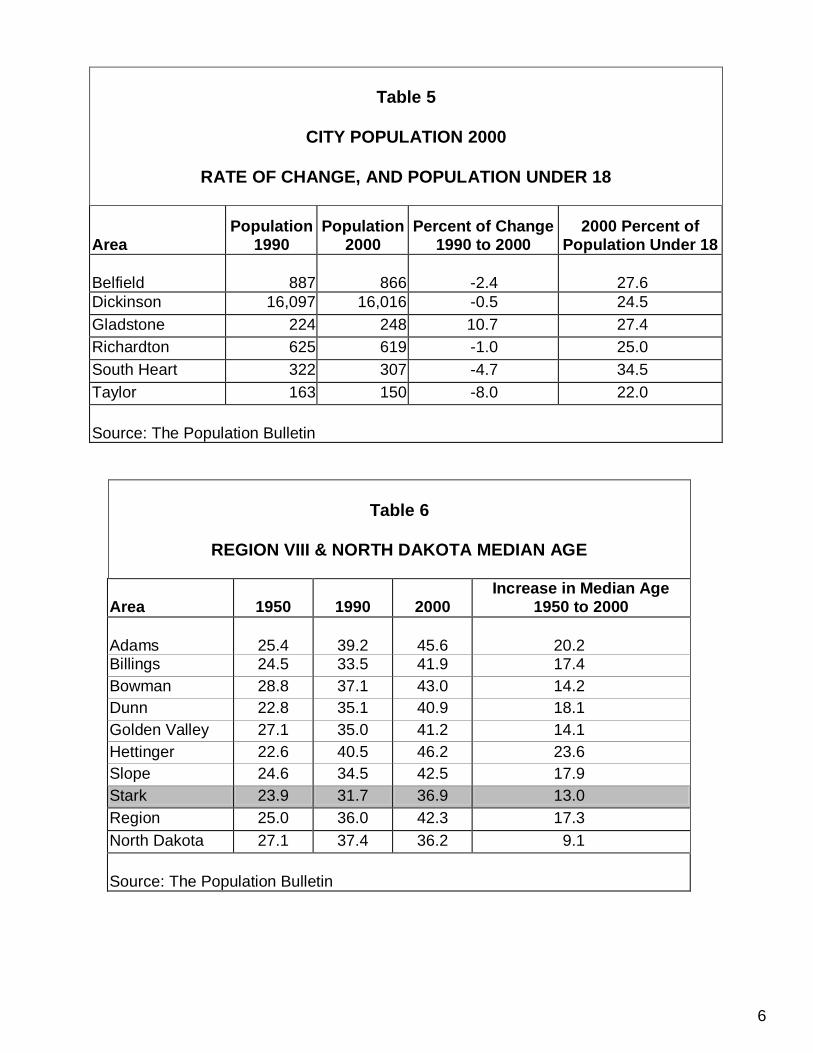
Table 5
CITY POPULATION 2000
RATE OF CHANGE, AND POPULATION UNDER 18
Area Population
1990 Population
2000 Percent of Change
1990 to 2000 2000 Percent of
Population Under 18
Belfield
887
866
-2.4
27.6
Dickinson 16,097 16,016 -0.5 24.5
Gladstone 224 248 10.7 27.4
Richardton 625 619 -1.0 25.0
South Heart 322 307 -4.7 34.5
Taylor 163 150 -8.0 22.0
Source: The Population Bulletin
Table 6
REGION VIII & NORTH DAKOTA MEDIAN AGE
Area
1950
1990
2000
Increase in Median Age 1950 to 2000
Adams
25.4
39.2
45.6
20.2
Billings 24.5 33.5 41.9 17.4
Bowman 28.8 37.1 43.0 14.2
Dunn 22.8 35.1 40.9 18.1
Golden Valley 27.1 35.0 41.2 14.1
Hettinger 22.6 40.5 46.2 23.6
Slope 24.6 34.5 42.5 17.9
Stark 23.9 31.7 36.9 13.0
Region 25.0 36.0 42.3 17.3
North Dakota 27.1 37.4 36.2 9.1
Source: The Population Bulletin
7
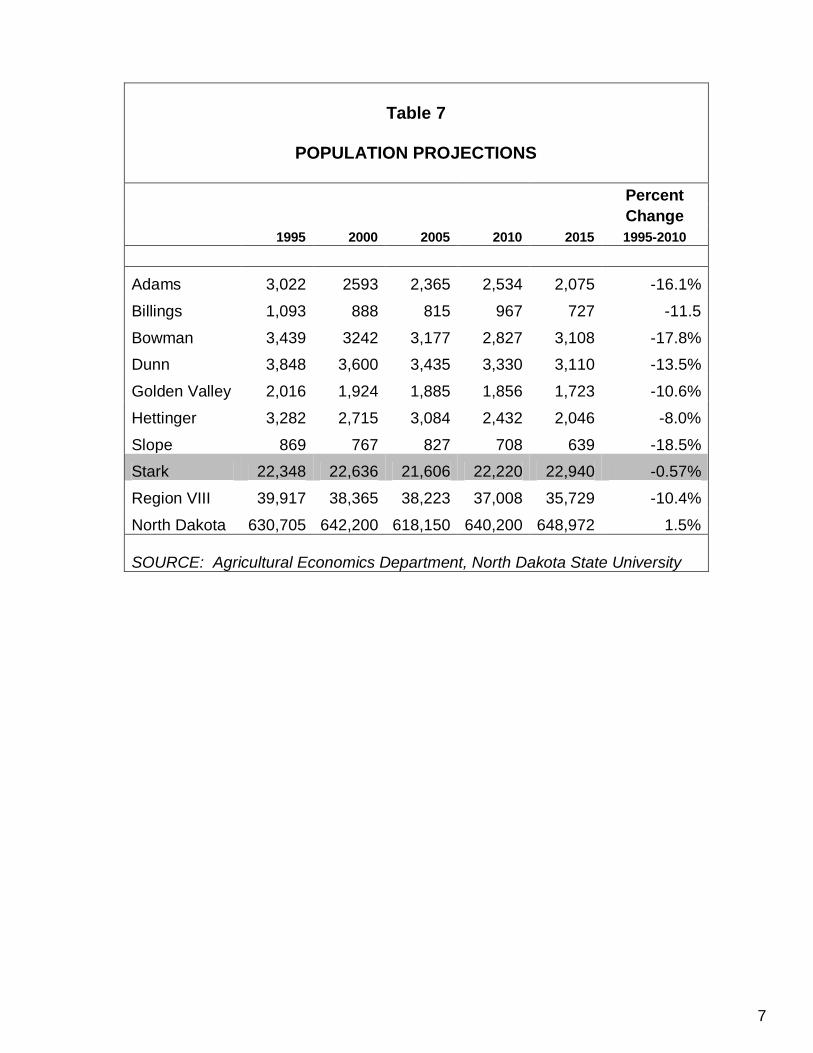
Table 7
POPULATION PROJECTIONS
Percent
Change
1995 2000 2005 2010 2015 1995-2010
Adams 3,022 2593 2,365 2,534 2,075 -16.1%
Billings 1,093 888 815 967 727 -11.5
Bowman 3,439 3242 3,177 2,827 3,108 -17.8%
Dunn 3,848 3,600 3,435 3,330 3,110 -13.5%
Golden Valley 2,016 1,924 1,885 1,856 1,723 -10.6%
Hettinger 3,282 2,715 3,084 2,432 2,046 -8.0%
Slope 869 767 827 708 639 -18.5%
Stark 22,348 22,636 21,606 22,220 22,940 -0.57%
Region VIII 39,917 38,365 38,223 37,008 35,729 -10.4%
North Dakota 630,705 642,200 618,150 640,200 648,972 1.5%
SOURCE: Agricultural Economics Department, North Dakota State University
8
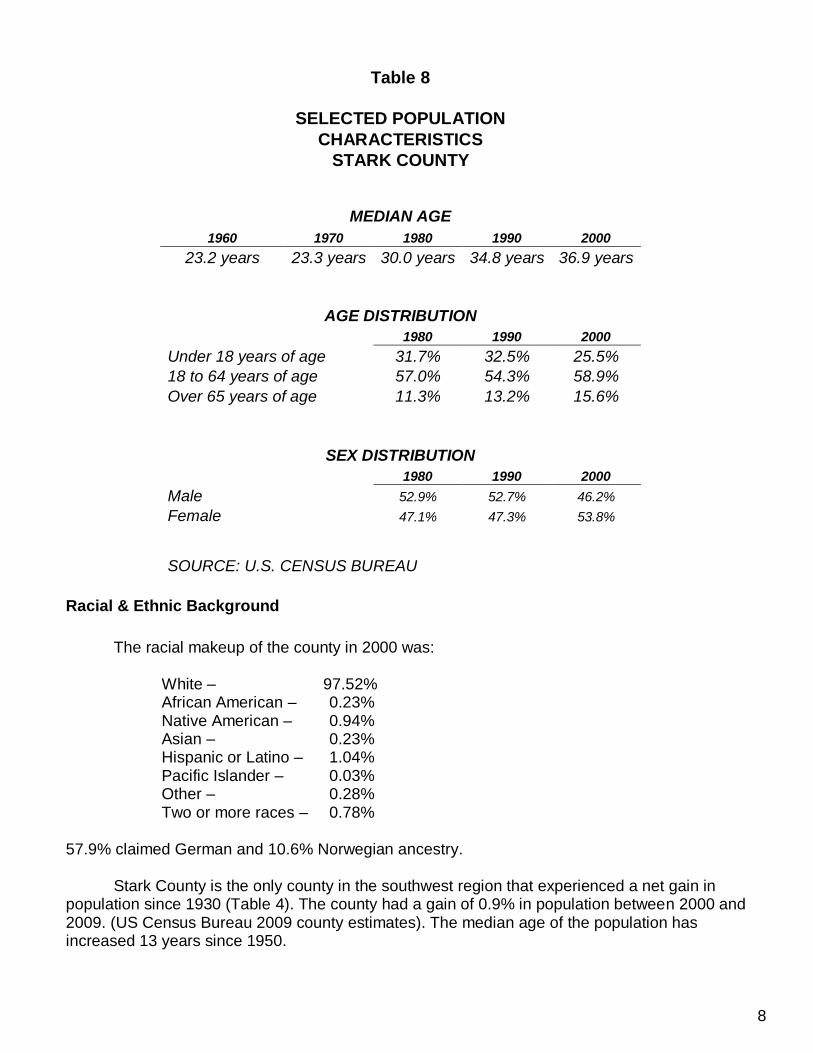
Table 8
SELECTED POPULATION
CHARACTERISTICS
STARK COUNTY
MEDIAN AGE
1960 1970 1980 1990 2000
23.2 years 23.3 years 30.0 years 34.8 years 36.9 years
AGE DISTRIBUTION
1980 1990 2000
Under 18 years of age 31.7% 32.5% 25.5%
18 to 64 years of age 57.0% 54.3% 58.9%
Over 65 years of age 11.3% 13.2% 15.6%
SEX DISTRIBUTION
1980 1990 2000
Male 52.9% 52.7% 46.2%
Female 47.1% 47.3% 53.8%
SOURCE: U.S. CENSUS BUREAU
Racial & Ethnic Background
The racial makeup of the county in 2000 was:
White – 97.52% African American – 0.23% Native American – 0.94% Asian – 0.23% Hispanic or Latino – 1.04% Pacific Islander – 0.03% Other – 0.28% Two or more races – 0.78%
57.9% claimed German and 10.6% Norwegian ancestry.
Stark County is the only county in the southwest region that experienced a net gain in population since 1930 (Table 4). The county had a gain of 0.9% in population between 2000 and 2009. (US Census Bureau 2009 county estimates). The median age of the population has increased 13 years since 1950.

9
LOCAL ECONOMIC FACTORS
All economic segments of Stark County continue to grow and diversify. As the economic hub
of the southwest region of North Dakota, the county has avoided the dislocation and population outmigration trends throughout the rest of the region. This is in part because of the energy development in the region. Agriculture remains the mainstay of the local economy
Table 9
AVERAGE SIZE, NUMBER AND LAND IN FARMS
SUB-STATE REGION VIII COUNTIES 1987, 1992, 1997, 2002, 2007
Place 1987 1992 1997 2002 2007
Adams Average size of farms (acres) 1,528 1,684 1,716 1,535 1,471
Number of farms 410 353 367 394 426
Billings
Average size of farms (acres) 2,994 3,384 3,350 3,407 2,982
Number of farms 267 242 237 238 243
Bowman
Average size of farms (acres) 1,849 1,977 1,998 2,109 2,042
Number of farms 390 343 358 360 353
Dunn
Average size of farms (acres) 1,854 2,081 2,161 1,900 1,854
Number of farms 733 650 618 582 563
Golden Valley
Average size of farms (acres) 2,039 2,308 2,372 2,513 2,347
Number of farms 261 219 244 231 243
Hettinger
Average size of farms (acres) 1,381 1,621 1,622 1,392 1,296
Number of farms 525 427 436 489 546
Slope
Average size of farms (acres) 2,705 2,910 2,879 2,944 3,231
Number of farms 299 270 263 259 238
Stark
Average size of farms (acres) 978 1,068 1,005 1,004 968
Number of farms 822 788 802 774 865
Source: The U.S. Census of Agriculture

10
Table 10
AGRICULTURAL LAND VALUES
REGION VIII
2010 2005-2010 Average
COUNTY Cropland/Acre
Pasture/Acre
Cropland/Acre
Pasture/ Acre
ADAMS $537 $362 $452 $287
BILLINGS $643 $459 $434 $331
BOWMAN $526 $340 $437 $267
DUNN $530 $380 $413 $303
GOLDEN VALLEY $535 $319 $422 $265
HETTINGER $712 $412 $577 $349
SLOPE $604 $375 $453 $263
STARK $745 $466 $526 $366
REGION VIII $604 $389 $464 $304
STATE $877 $707 $636 $318
11
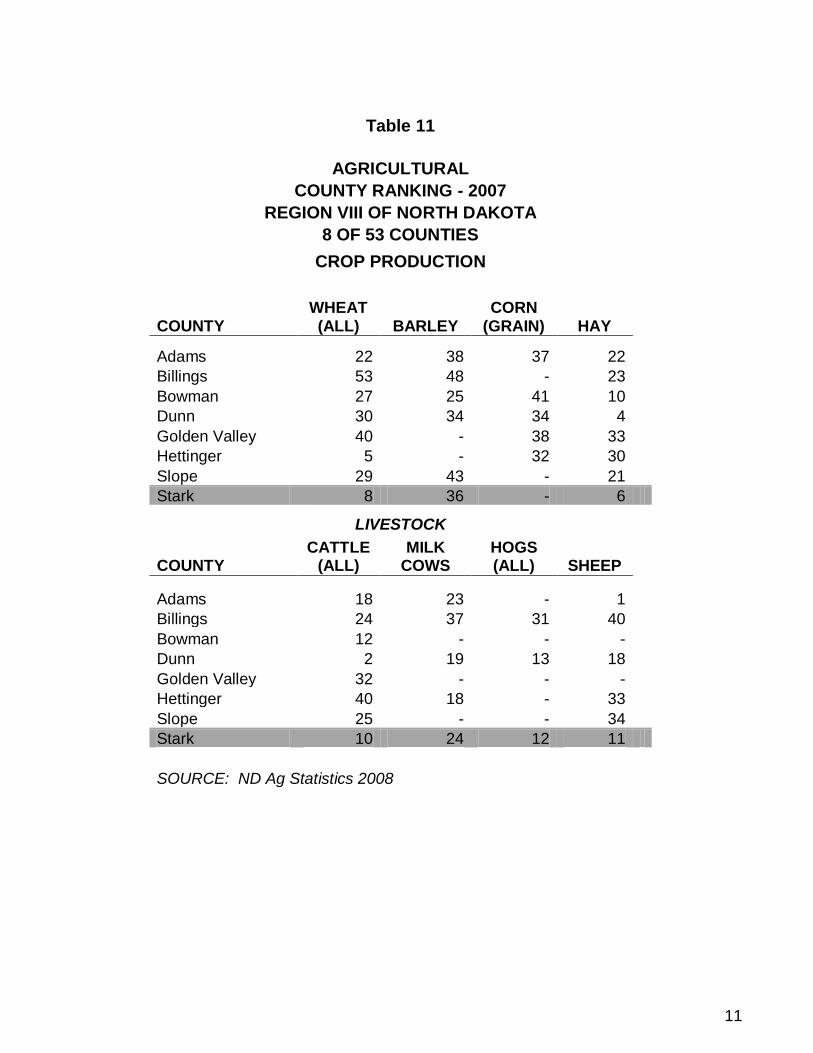
Table 11
AGRICULTURAL
COUNTY RANKING - 2007
REGION VIII OF NORTH DAKOTA
8 OF 53 COUNTIES
CROP PRODUCTION
COUNTY WHEAT (ALL) BARLEY
CORN (GRAIN) HAY
Adams 22 38 37 22
Billings 53 48 - 23
Bowman 27 25 41 10
Dunn 30 34 34 4
Golden Valley 40 - 38 33
Hettinger 5 - 32 30
Slope 29 43 - 21
Stark 8 36 - 6
LIVESTOCK
COUNTY CATTLE
(ALL) MILK
COWS HOGS (ALL) SHEEP
Adams 18 23 - 1
Billings 24 37 31 40
Bowman 12 - - -
Dunn 2 19 13 18
Golden Valley 32 - - -
Hettinger 40 18 - 33
Slope 25 - - 34
Stark 10 24 12 11
SOURCE: ND Ag Statistics 2008
12
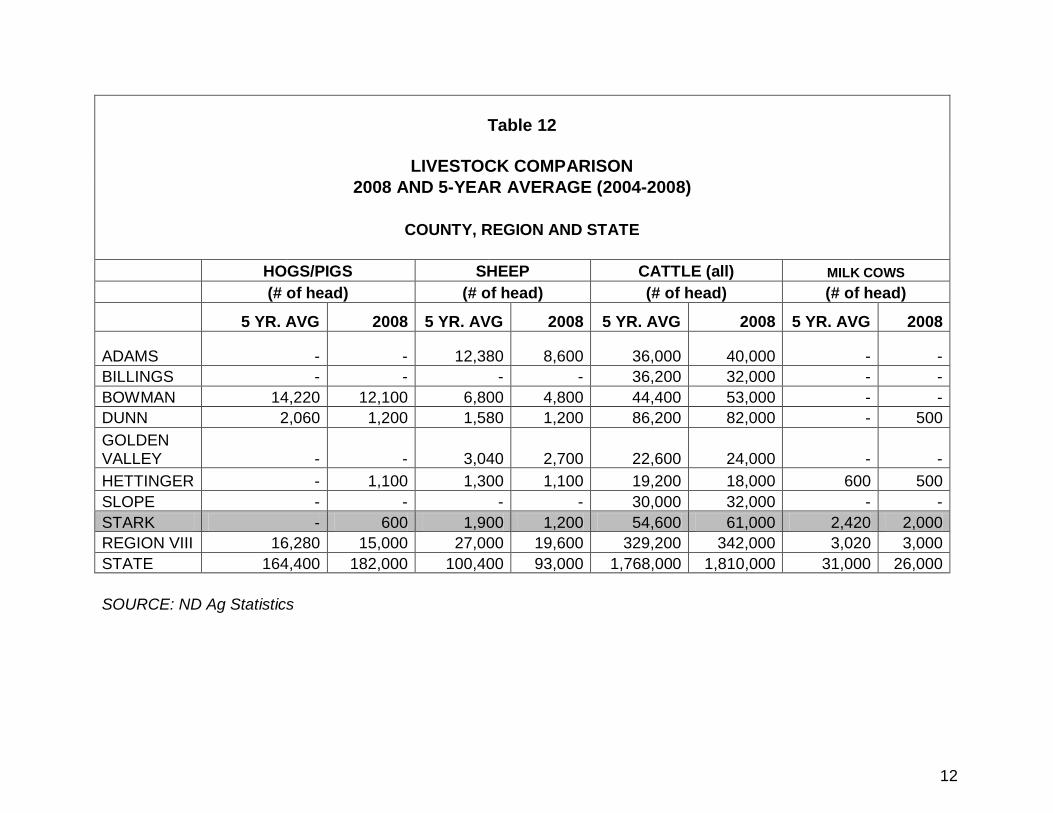
Table 12
LIVESTOCK COMPARISON
2008 AND 5-YEAR AVERAGE (2004-2008)
COUNTY, REGION AND STATE
HOGS/PIGS SHEEP CATTLE (all) MILK COWS
(# of head) (# of head) (# of head) (# of head)
5 YR. AVG 2008 5 YR. AVG 2008 5 YR. AVG 2008 5 YR. AVG 2008
ADAMS - - 12,380 8,600 36,000 40,000 - -
BILLINGS - - - - 36,200 32,000 - -
BOWMAN 14,220 12,100 6,800 4,800 44,400 53,000 - -
DUNN 2,060 1,200 1,580 1,200 86,200 82,000 - 500
GOLDEN VALLEY - - 3,040 2,700 22,600 24,000 - -
HETTINGER - 1,100 1,300 1,100 19,200 18,000 600 500
SLOPE - - - - 30,000 32,000 - -
STARK - 600 1,900 1,200 54,600 61,000 2,420 2,000
REGION VIII 16,280 15,000 27,000 19,600 329,200 342,000 3,020 3,000
STATE 164,400 182,000 100,400 93,000 1,768,000 1,810,000 31,000 26,000
SOURCE: ND Ag Statistics
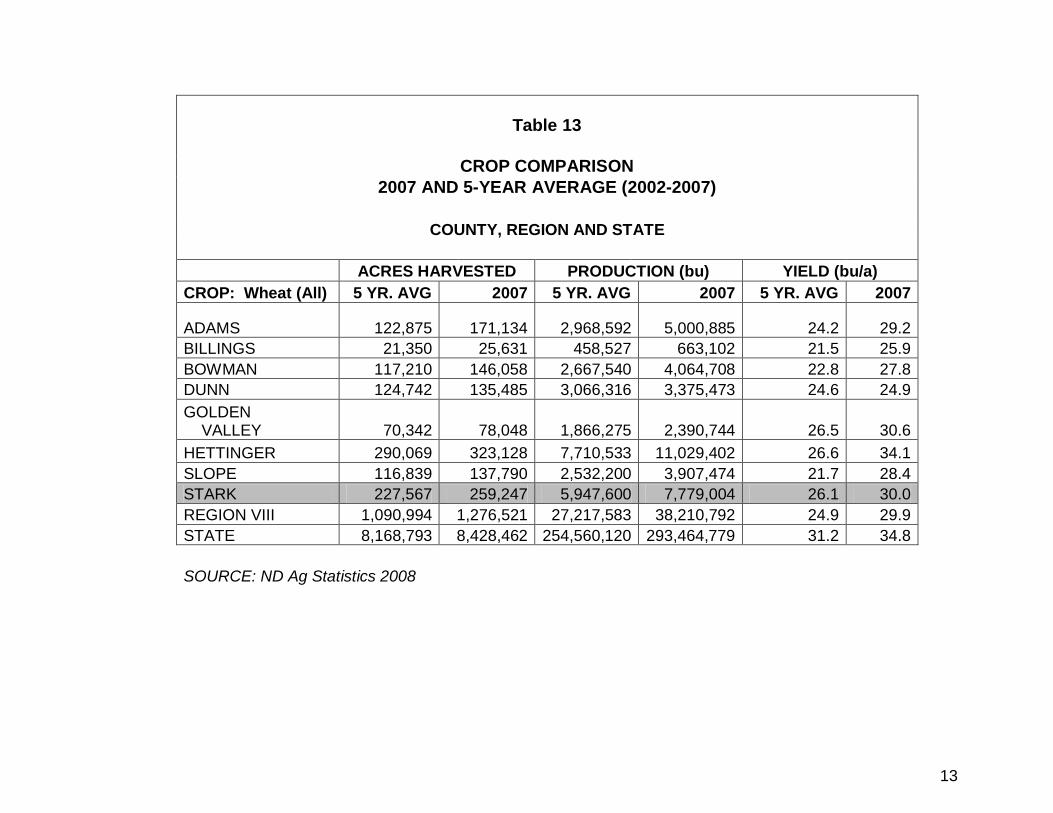
13
Table 13
CROP COMPARISON
2007 AND 5-YEAR AVERAGE (2002-2007)
COUNTY, REGION AND STATE
ACRES HARVESTED PRODUCTION (bu) YIELD (bu/a)
CROP: Wheat (All) 5 YR. AVG 2007 5 YR. AVG 2007 5 YR. AVG 2007
ADAMS 122,875 171,134 2,968,592 5,000,885 24.2 29.2
BILLINGS 21,350 25,631 458,527 663,102 21.5 25.9
BOWMAN 117,210 146,058 2,667,540 4,064,708 22.8 27.8
DUNN 124,742 135,485 3,066,316 3,375,473 24.6 24.9
GOLDEN VALLEY 70,342 78,048 1,866,275 2,390,744 26.5 30.6
HETTINGER 290,069 323,128 7,710,533 11,029,402 26.6 34.1
SLOPE 116,839 137,790 2,532,200 3,907,474 21.7 28.4
STARK 227,567 259,247 5,947,600 7,779,004 26.1 30.0
REGION VIII 1,090,994 1,276,521 27,217,583 38,210,792 24.9 29.9
STATE 8,168,793 8,428,462 254,560,120 293,464,779 31.2 34.8
SOURCE: ND Ag Statistics 2008
14
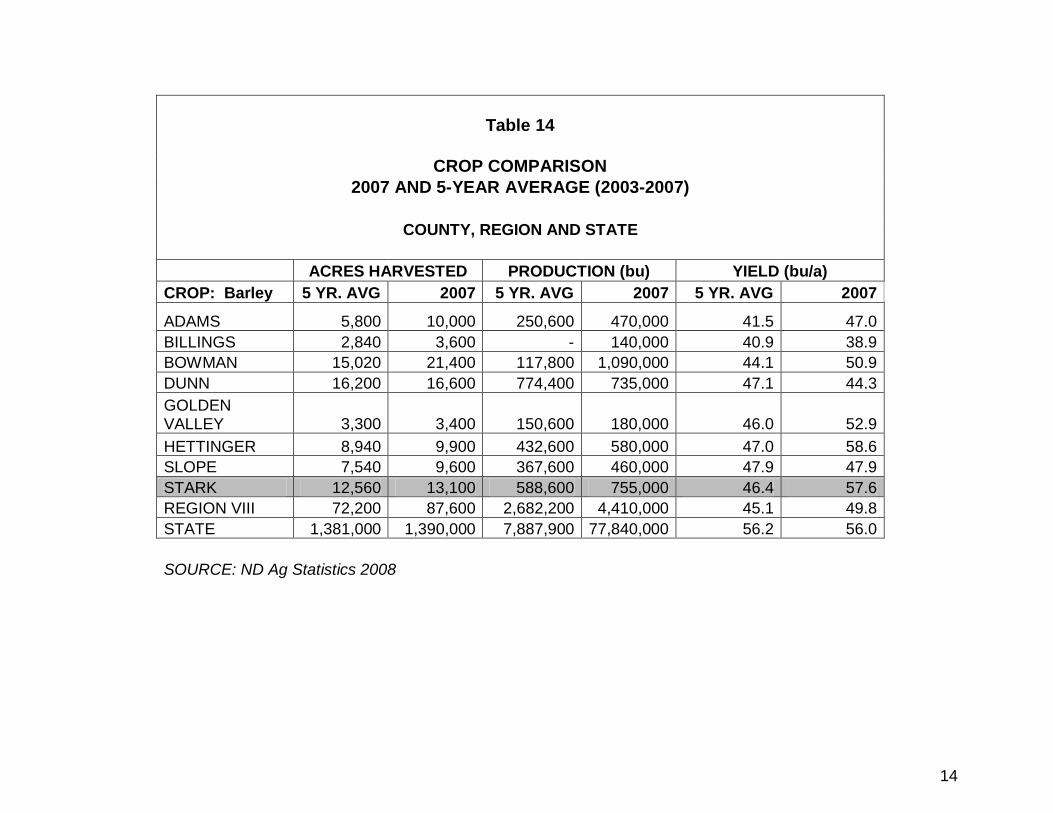
Table 14
CROP COMPARISON
2007 AND 5-YEAR AVERAGE (2003-2007)
COUNTY, REGION AND STATE
ACRES HARVESTED PRODUCTION (bu) YIELD (bu/a)
CROP: Barley 5 YR. AVG 2007 5 YR. AVG 2007 5 YR. AVG 2007
ADAMS 5,800 10,000 250,600 470,000 41.5 47.0
BILLINGS 2,840 3,600 - 140,000 40.9 38.9
BOWMAN 15,020 21,400 117,800 1,090,000 44.1 50.9
DUNN 16,200 16,600 774,400 735,000 47.1 44.3
GOLDEN VALLEY 3,300 3,400 150,600 180,000 46.0 52.9
HETTINGER 8,940 9,900 432,600 580,000 47.0 58.6
SLOPE 7,540 9,600 367,600 460,000 47.9 47.9
STARK 12,560 13,100 588,600 755,000 46.4 57.6
REGION VIII 72,200 87,600 2,682,200 4,410,000 45.1 49.8
STATE 1,381,000 1,390,000 7,887,900 77,840,000 56.2 56.0
SOURCE: ND Ag Statistics 2008

15
Table 15
CROP COMPARISON
2007 AND 5-YEAR AVERAGE (2003-2007)
COUNTY, REGION AND STATE
ACRES HARVESTED PRODUCTION (bu) YIELD (bu/a)
CROP: Oats 5 YR. AVG 2007 5 YR. AVG 2007 5 YR. AVG 2007
ADAMS 3,020 3,800 127,200 178,000 38.5 46.8
BILLINGS 2,220 1,700 116,600 65,000 47.6 38.2
BOWMAN 2,480 1,700 104,800 63,000 39.6 37.1
DUNN 8,660 9,200 522,400 435,000 57.6 47.3
GOLDEN VALLEY 5,740 5,100 307,600 270,000 53.0 52.9
HETTINGER 1,420 1,200 62,600 70,000 45.4 58.3
SLOPE 1,500 1,800 72,600 105,000 47.9 58.3
STARK 8,620 12,700 470,600 759,000 51.6 59.8
REGION VIII 33,660 37,200 1,784,400 1,945,000 47.7 49.8
STATE 140,000 260,000 13,948,000 15,340,000 56.4 59.0
SOURCE: ND Ag Statistics 2008

16
Table 16
CROP COMPARISON
2007 AND 5-YEAR AVERAGE (2003-2007)
COUNTY, REGION AND STATE
ACRES HARVESTED PRODUCTION (lbs) YIELD (lbs/a)
CROP: Sunflowers 5 YR. AVG 2007 5 YR. AVG 2007 5 YR. AVG 2007
ADAMS 8,600 10,400 8,091,181 12,584,342 941 1,210
BILLINGS - 1,761 - 2,060,410 - 1,170
BOWMAN 3,945 3,637 3,937,019 4,125,500 998 1,134
DUNN 6,314 7,555 6,762,749 8,123,969 1,071 1,075
GOLDEN VALLEY 3,460 4,072 3,844,207 4,559,053 1,111 1,120
HETTINGER 16,322 19,826 18,983,506 27,201,835 1,163 1,372
SLOPE 4,989 6,667 4,926,099 8,004,986 987 1,201
STARK 10,020 13,037 13,528,836 17,778,420 1,350 1,364
REGION VIII 53,650 66,955 60,073,597 84,438,515 1,120 1,261
STATE 1,091,154 1,055,000 1,452,595,822 1,496,184,686 1,331.2 1,419
SOURCE: ND Ag Statistics
17
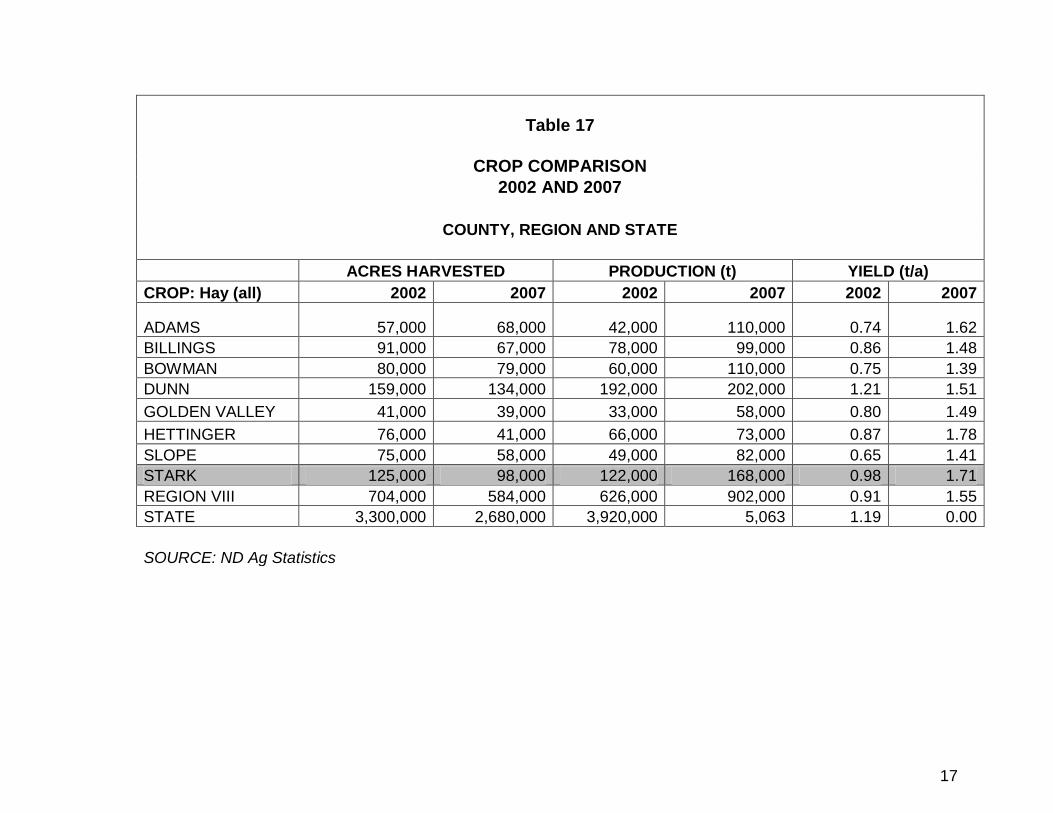
Table 17
CROP COMPARISON
2002 AND 2007
COUNTY, REGION AND STATE
ACRES HARVESTED PRODUCTION (t) YIELD (t/a)
CROP: Hay (all) 2002 2007 2002 2007 2002 2007
ADAMS 57,000 68,000 42,000 110,000 0.74 1.62
BILLINGS 91,000 67,000 78,000 99,000 0.86 1.48
BOWMAN 80,000 79,000 60,000 110,000 0.75 1.39
DUNN 159,000 134,000 192,000 202,000 1.21 1.51
GOLDEN VALLEY 41,000 39,000 33,000 58,000 0.80 1.49
HETTINGER 76,000 41,000 66,000 73,000 0.87 1.78
SLOPE 75,000 58,000 49,000 82,000 0.65 1.41
STARK 125,000 98,000 122,000 168,000 0.98 1.71
REGION VIII 704,000 584,000 626,000 902,000 0.91 1.55
STATE 3,300,000 2,680,000 3,920,000 5,063 1.19 0.00
SOURCE: ND Ag Statistics

18
Table 18
CROP COMPARISON
2002 AND 2007
COUNTY, REGION AND STATE
ACRES HARVESTED PRODUCTION (t) YIELD (t/a)
CROP: Alfalfa Hay 2002 2007 2002 2007 2002 2007
ADAMS 19,000 44,000 13,000 64,000 0.68 1.45
BILLINGS 51,000 47,000 44,000 62,000 0.86 1.32
BOWMAN 28,000 52,000 16,000 75,000 0.57 1.44
DUNN 95,000 92,000 115,000 145,000 1.21 1.58
GOLDEN VALLEY 15,000 22,000 16,000 36,000 1.07 1.64
HETTINGER 35,000 27,000 30,000 51,000 0.86 1.89
SLOPE 33,000 37,000 22,000 52,000 0.67 1.41
STARK 74,000 66,000 69,000 105,000 0.93 1.59
REGION VIII 350,000 387,000 325,000 590,000 0.86 1.54
STATE 1,450,000 1,550,000 1,885,000 3,255,000 1.3 2.1
SOURCE: ND Ag Statistics
19
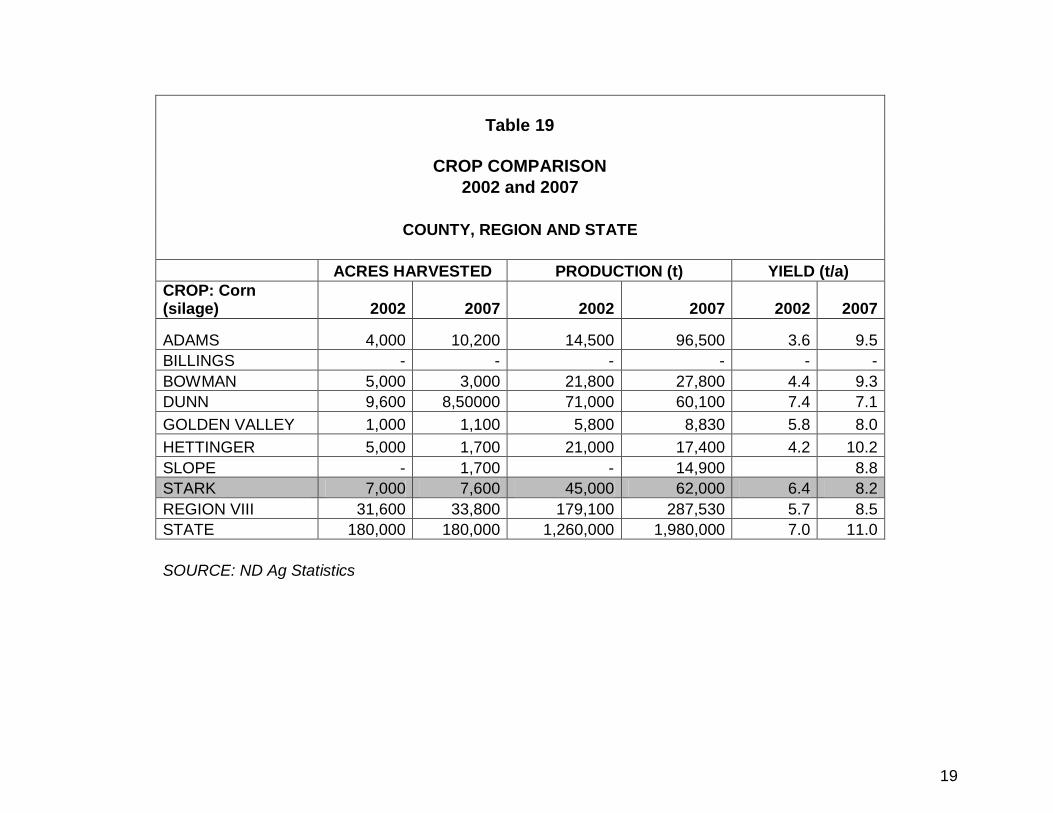
Table 19
CROP COMPARISON
2002 and 2007
COUNTY, REGION AND STATE
ACRES HARVESTED PRODUCTION (t) YIELD (t/a)
CROP: Corn (silage) 2002 2007 2002 2007 2002 2007
ADAMS 4,000 10,200 14,500 96,500 3.6 9.5
BILLINGS - - - - - -
BOWMAN 5,000 3,000 21,800 27,800 4.4 9.3
DUNN 9,600 8,50000 71,000 60,100 7.4 7.1
GOLDEN VALLEY 1,000 1,100 5,800 8,830 5.8 8.0
HETTINGER 5,000 1,700 21,000 17,400 4.2 10.2
SLOPE - 1,700 - 14,900 8.8
STARK 7,000 7,600 45,000 62,000 6.4 8.2
REGION VIII 31,600 33,800 179,100 287,530 5.7 8.5
STATE 180,000 180,000 1,260,000 1,980,000 7.0 11.0
SOURCE: ND Ag Statistics

20
Table 20
AGRICULTURAL LAND RENT VALUES
REGION VIII CROPLAND
2010 2005-2009 Average
COUNTY RENT PER ACRE RENT PER ACRE
ADAMS $29.70 $26.30
BILLINGS $30.90 $24.90
BOWMAN $29.50 $27.60
DUNN $28.30 $25.10
GOLDEN VALLEY $27.30 $24.90
HETTINGER $36.50 $31.10
SLOPE $30.70 $28.10
STARK $34.30 $29.90
REGION $30.90 $26.90
PASTURE
2010 2005-2009 Average
COUNTY RENT PER ACRE RENT PER ACRE
ADAMS $14.00 $12.80
BILLINGS $16.80 $14.30
BOWMAN $12.60 $12.00
DUNN $15.00 $13.00
GOLDEN VALLEY $11.20 $10.30
HETTINGER $14.70 $13.80
SLOPE $13.50 $12.30
STARK $16.40 $15.50
REGION $14.28 $13.00

21
MANUFACTURING AND INDUSTRIAL EXPANSION
The major manufacturing sector is found in or near the city of Dickinson. In 2000, 40
manufacturing companies employing 964 persons were located in Stark County. In 2009 that number dropped to 37 employing 1,237 employees. The number of manufacturing businesses decreased by 8% during that time frame. At the same time employment at those manufacturing businesses increased by 29% (ND Job Service).TMI Systems Design Corporation, Baker Boy Supply, Steffes Corporation, Fisher Industries, Consolidated Communications, and Killdeer Mountain Manufacturing all employ 100 or more people.
Each of the manufacturing companies has been detrimentally affected to some degree by the sluggish national economy. It is anticipated that the companies’ overall economic status will improve with a rebounding national economy.
The expansion of the energy sector and anticipated improvement in the
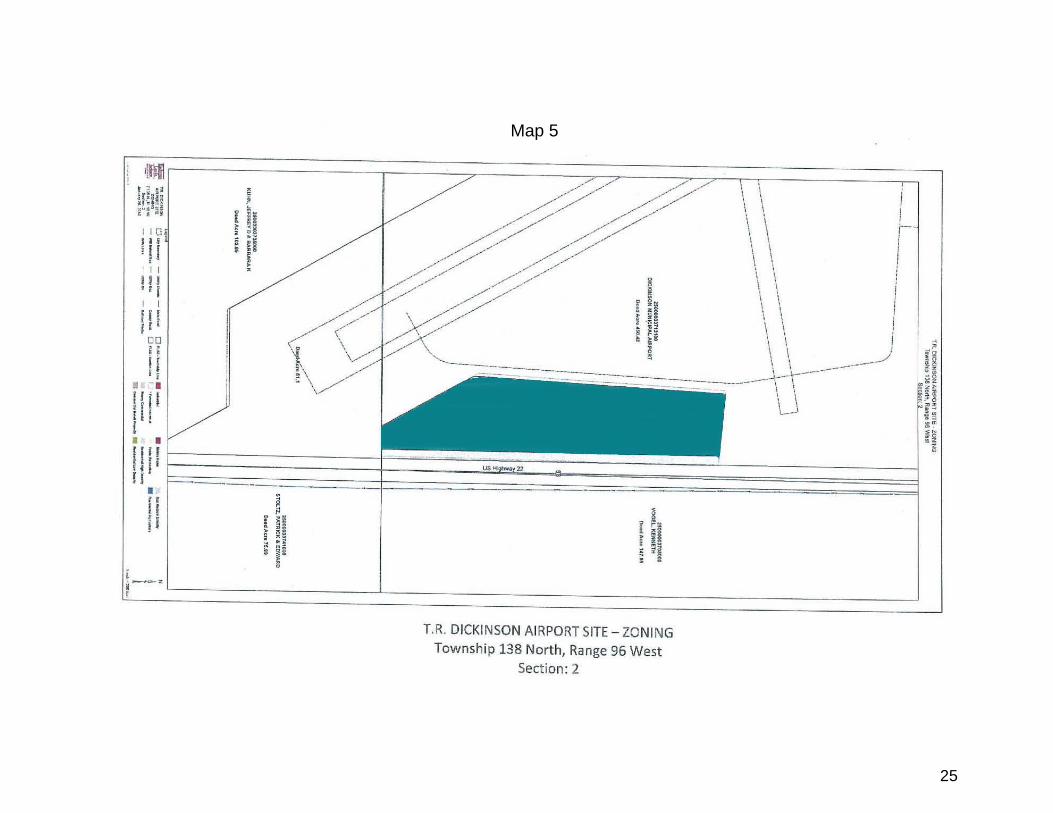
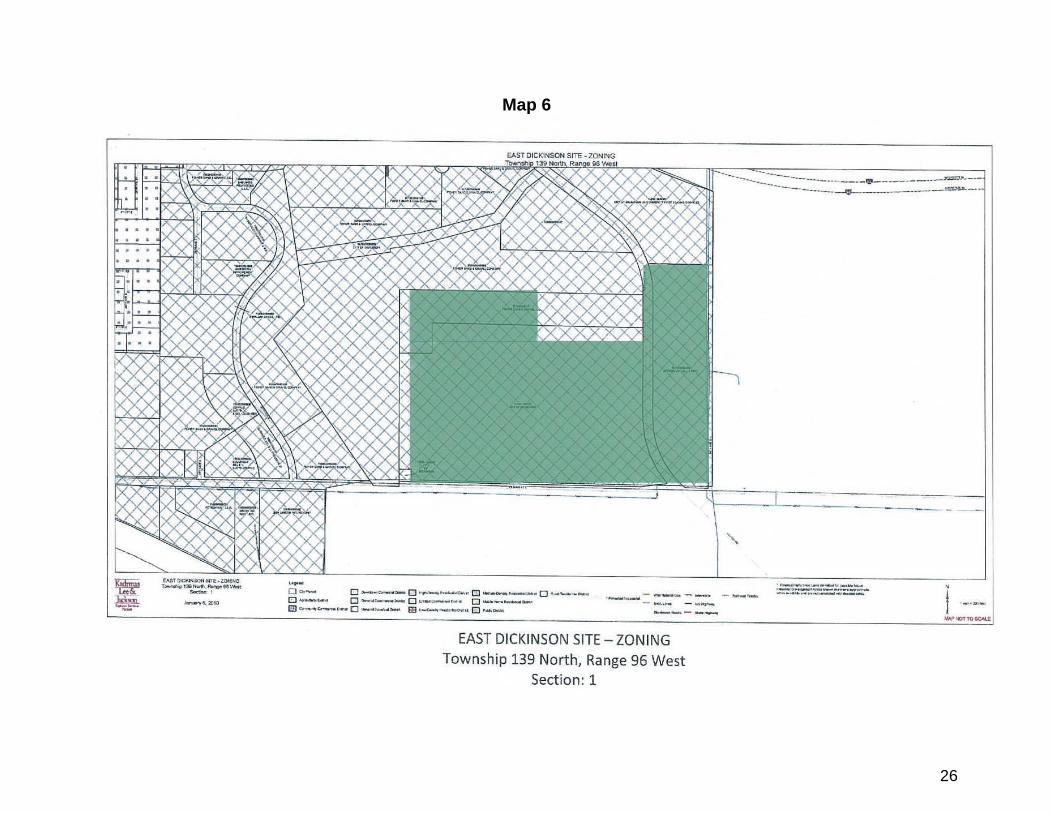
manufacturing sector has raised the need for the development of additional industrial park sites. The Stark Development Corporation commissioned a feasibility study for that purpose. The study was conducted by Kadrmas Lee & Jackson, engineers. Based on a study of highway, rail, and airport access; access to electrical power and natural gas; topography; and development costs six potential sites locations were identified:
1) Belfield site located east of Belfield bordered by I-94 on the north, US 85 on the west and Old Highway 10 on the south (approximately 164 acres) (Map 2).
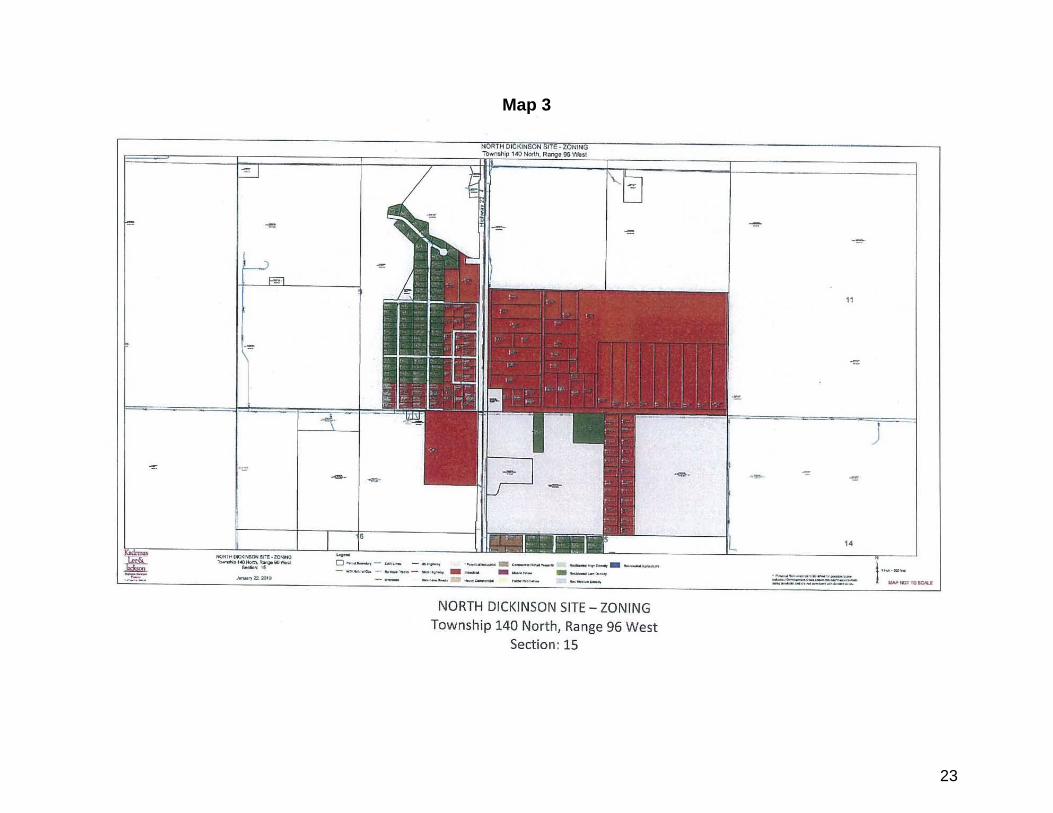
2) North Dickinson site located north of the Dickinson City Limits in and around currently zoned and developed industrial property (approximately 480 acres) (Map 3).
3) South Dickinson site located within the Dickinson City Limits along Broadway street West (approximately 30 acres) (Map 4).
4) Dickinson Airport site located by/on Dickinson/Theodore Roosevelt Airport property (approximately 30 acres) (Map 5).
5) East Dickinson site located in southeast Dickinson within the Dickinson City Limits (approximately 45 acres) (Map 6).
6) Richardton site located immediately southeast of Richardton near and around the current ethanol refinery (approximately 80 acres) (Map 7).
(Source: Industrial Park Feasibility Study, March 2010 prepared for Stark Development by
Kadrmas, Lee & Jackson)

22
Map 2
23
Map 3

24
Map 4
25
Map 5
26
Map 6

27
Map 7

28
TOURISM
Tourism in North Dakota in 2008 was a $4.13 billion industry. In Region 8, tourism
generated $301.6 million in revenue (ND Department of Commerce). Tourism is defined as travel to enjoy recreational and leisure activities, business travel, visiting friends and relatives, and activities outside of one’s normal working or living area. This general definition is heavily weighted toward the business traveler. Tourism in Stark County in 2008 accounted for $88.33 million. This represented a 13% increase in the last two years. (IHS Global Insight)
The City of Dickinson levies a 1% lodging and 1% hospitality tax. The proceeds of the taxes are distributed according to a formula promulgated by the city. The amounts collected have increased on an annual basis (Table 21).
Table 21
CITY OF DICKINSON (Hospitality Tax)
RESTAURANT/LODGING TAX
2006 2007 2008 2009 2010
January $35,146.88 $41,211.65 $41,211.22 $38,499.96 $35,946.40
February $27,798.09 $31,199.50 $29,820.49 $38,919.05 $42,068.15
March $31,758.64 $31,658.50 $35,797.18 $38,346.19 $53,203.28
April $33,070.60 $34,467.79 $35,790.00 $45,106.69 $45,139.42
May $27,610.69 $27,990.73 $38,442.76 $37,101.30 $46,081.91
June $35,874.84 $39,683.25 $41,660.46 $45,059.59 $0.00
July $32,387.56 $46,131.95 $32,856.28 $52,816.51 $0.00
August $35,820.86 $28,446.71 $56,328.90 $56,874.47 $0.00
September $49,258.54 $53,409.51 $45,725.05 $47,716.59 $0.00
October $35,394.90 $37,565.62 $52,378.69 $49,942.68 $0.00
November $44,364.44 $46,617.14 $48,448.93 $49,572.91 $0.00
December $30,418.52 $43,681.13 $94,030.25 $54,053.19 $0.00
Earned Interest $17,465.51 $29,118.57 $33,417.13 $18,818.70 $3,968.54
Annual Total $436,370.07 $491,182.05 $585,907.34 $572,827.83 $226,407.70 Source: City of Dickinson
29
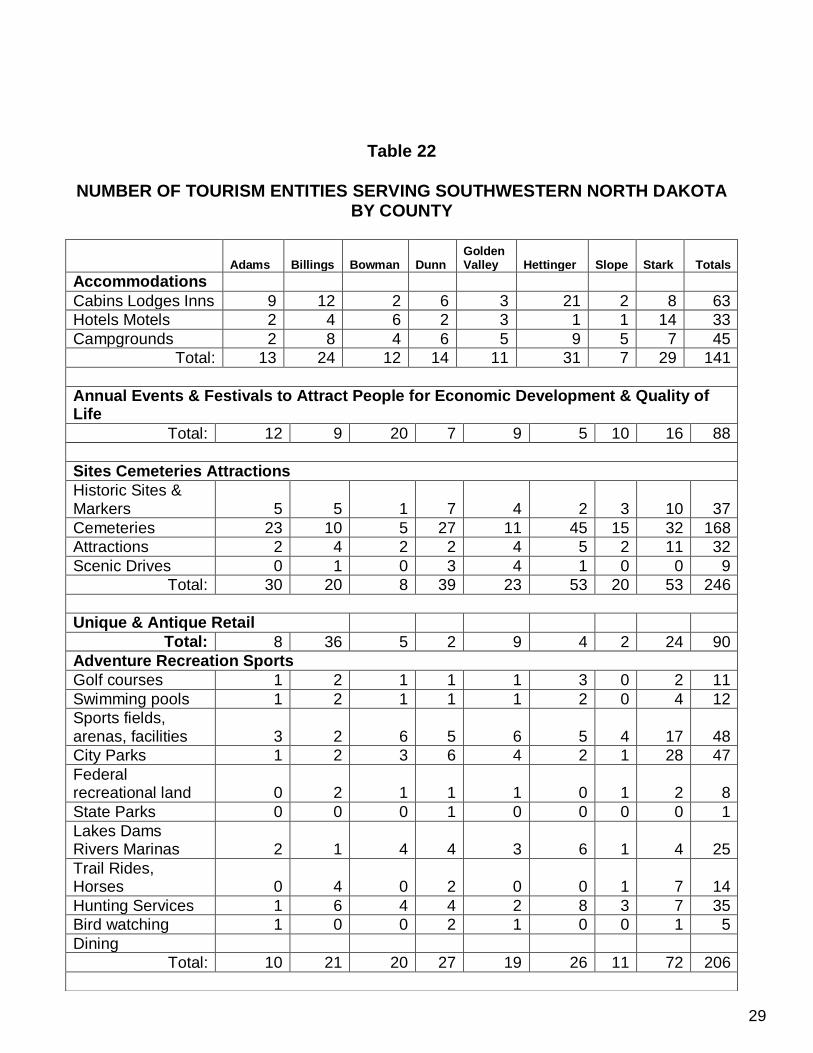
Table 22
NUMBER OF TOURISM ENTITIES SERVING SOUTHWESTERN NORTH DAKOTA BY COUNTY
Adams Billings Bowman Dunn Golden Valley Hettinger Slope Stark Totals
Accommodations
Cabins Lodges Inns 9 12 2 6 3 21 2 8 63
Hotels Motels 2 4 6 2 3 1 1 14 33
Campgrounds 2 8 4 6 5 9 5 7 45
Total: 13 24 12 14 11 31 7 29 141
Annual Events & Festivals to Attract People for Economic Development & Quality of Life
Total: 12 9 20 7 9 5 10 16 88
Sites Cemeteries Attractions
Historic Sites & Markers 5 5 1 7 4 2 3 10 37
Cemeteries 23 10 5 27 11 45 15 32 168
Attractions 2 4 2 2 4 5 2 11 32
Scenic Drives 0 1 0 3 4 1 0 0 9
Total: 30 20 8 39 23 53 20 53 246
Unique & Antique Retail
Total: 8 36 5 2 9 4 2 24 90
Adventure Recreation Sports
Golf courses 1 2 1 1 1 3 0 2 11
Swimming pools 1 2 1 1 1 2 0 4 12
Sports fields, arenas, facilities 3 2 6 5 6 5 4 17 48
City Parks 1 2 3 6 4 2 1 28 47
Federal recreational land 0 2 1 1 1 0 1 2 8
State Parks 0 0 0 1 0 0 0 0 1
Lakes Dams Rivers Marinas 2 1 4 4 3 6 1 4 25
Trail Rides, Horses 0 4 0 2 0 0 1 7 14
Hunting Services 1 6 4 4 2 8 3 7 35
Bird watching 1 0 0 2 1 0 0 1 5
Dining
Total: 10 21 20 27 19 26 11 72 206

30
Dining
Total: 8 9 12 5 7 10 3 52 106
Transportation
Rental Vehicles: 1 0 1 0 1 0 0 3 6
Air service/Airstrip 1 0 1 1 1 1 0 2 7
Bus Service 0 1 0 0 1 0 0 2 4
U-haul 0 0 0 0 1 0 0 2 3
Cab, limousine service 0 0 0 0 0 0 0 2 2
Total: 2 1 2 1 4 1 0 11 22

31
Table 23
DICKINSON LODGING TAX
Months 2006 2007 2008 2009 YTD-2009 2010 YTD-2010 2009-2010 Ytd
Comp.
January $10,692.82 $12,366.18 $12,660.26 $12,968.38 $12,968.38 $21,866.90 $21,866.90 $8,898.52
February $6,749.17 $12,744.41 $10,096.13 $23,228.51 $36,196.89 $8,869.59 $30,736.49 ($5,460.40)
March $5,703.34 $6,757.39 $7,582.74 $9,905.87 $46,102.76 $19,649.58 $50,386.07 $4,283.31
April $8,448.45 $10,304.03 $10,596.88 $15,609.27 $61,712.03 $18,150.89 $68,536.96 $6,824.93
May $6,565.32 $7,100.26 $12,648.33 $15,607.91 $77,319.94 $17,715.97 $86,252.93 $8,932.99
June $8,596.90 $11,319.94 $16,595.59 $14,156.78 $91,476.72
July $8,493.91 $17,147.36 $13,830.76 $16,006.72 $107,483.44
August $12,384.09 $4,633.33 $27,917.83 $31,044.24 $138,527.68
September $20,021.68 $32,371.38 $20,223.89 $24,685.28 $163,212.96
October $16,997.20 $11,664.94 $29,768.65 $26,346.37 $189,559.33
November $23,265.74 $24,911.04 $23,281.83 $37,978.18 $227,537.51
December $14,631.83 $21,635.56 $31,380.04 $19,895.95 $247,433.46
Totals $142,550.45 $172,955.82 $216,582.93 $247,433.46 $247,433.46
% Prev Yr. UP 19% UP 21% UP 25% UP 14% UP 11%

32
Map 8
Stark County Zoning/Land Use

33
Land Uses
Map 9

34
Map 10

35
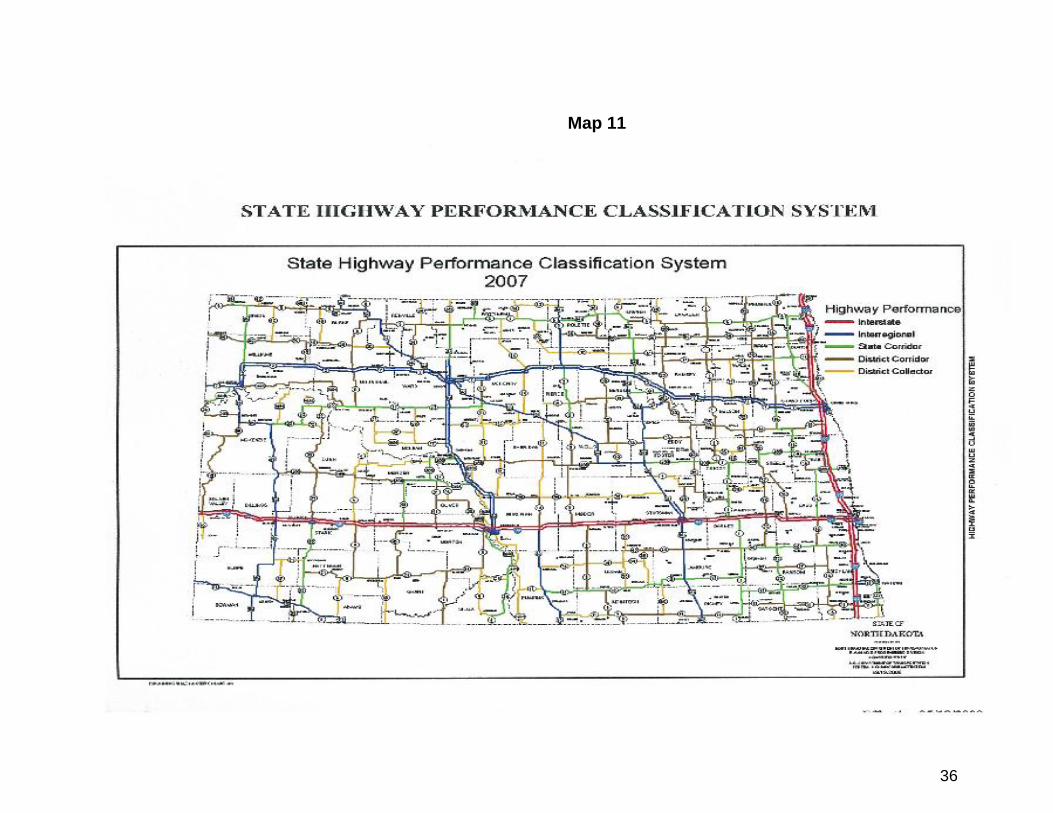
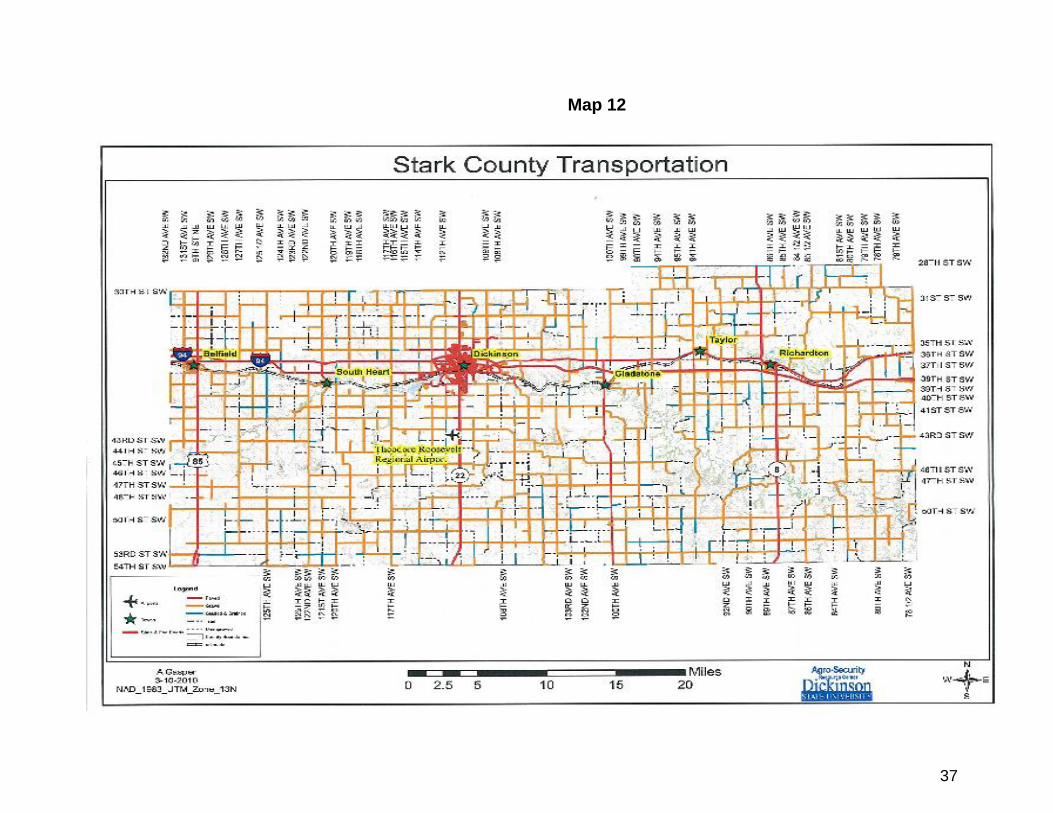
TRANSPORTATION
The Stark County road system consists of ND Hwy 22, Hwy 8, Interstate 94, US
Hwy 85, county farm to market roads, and local road systems. There are 135.9 state highway miles and 1,954.9 local road miles in this system (ND Department of Transportation).
To date, Hwy 22 north of Dickinson to the Dunn County line has been impacted by increased traffic resulting from the energy development in the region. This includes a major increase in heavy truck traffic affecting the sustainability of the road surface. The western portion of the county may also soon realize similar impacts with the beginning of an oil play in that region.
The county has bus service east and west along I-94 provided by Rimrock Bus Service of Billings, Montana. The only other bus service available is senior bus service from outlying communities to Dickinson.
The city of Dickinson subsidizes a city cab/bus service within the city. It is the
only cab service in the county.
36
Map 11
37
Map 12
38
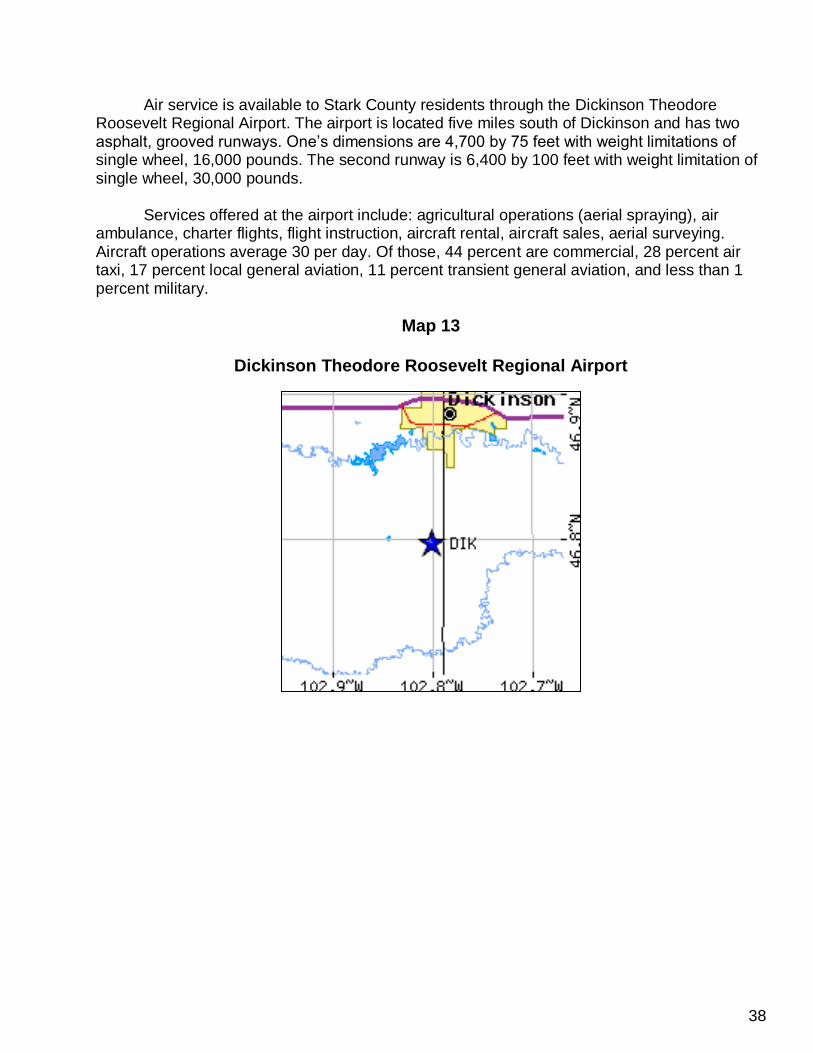
Air service is available to Stark County residents through the Dickinson Theodore Roosevelt Regional Airport. The airport is located five miles south of Dickinson and has two asphalt, grooved runways. One’s dimensions are 4,700 by 75 feet with weight limitations of single wheel, 16,000 pounds. The second runway is 6,400 by 100 feet with weight limitation of single wheel, 30,000 pounds.
Services offered at the airport include: agricultural operations (aerial spraying), air ambulance, charter flights, flight instruction, aircraft rental, aircraft sales, aerial surveying. Aircraft operations average 30 per day. Of those, 44 percent are commercial, 28 percent air taxi, 17 percent local general aviation, 11 percent transient general aviation, and less than 1 percent military.
Map 13
Dickinson Theodore Roosevelt Regional Airport
39
ROAD NETWORKS
Road traffic counts for July, 2009 were: 29th St. N – Hwy 22 (.3 miles north of Dickinson) — 6,195 per day (both directions) Hwy 22 north (Stark/Dunn County line) 3,240 Hwy 22: Dickinson City limits 3,515 Hwy 8: 4 miles north of Hettinger County line 360 Hwy 8: 12 mile south of I-94 710 Hwy 8: 2 miles north of Richardton 430 Hwy 85: 5 miles north of Slope County line 1,285
1 mile of Belfield 1,505 ½ mile north of I-94 2,360 Stark/Billings line 1,770
I-94: East of Belfield (both lanes average) 5,885

40
EMPLOYMENT
Table 24
LABOR FORCE SUB-STATE REGION VIII 2004-2008
Place 2004 2005 2006 2007 2008 2004-2008 % Change
Adams 1,275 1,306 1,299 1,297 1263 -1.0%%
Billings 491 502 510 529 515 4.9%
Bowman 1,722 1,725 1,760 1,748 1,738 0.1%
Dunn 1,705 1,723 1,727 1,631 1,721 0.1%
Golden Valley 929 907 842 847 860 -12%
Hettinger 1,208 1,185 1,175 1,107 1,122 -8.4%
Slope 444 524 517 609 765 72.3%
Stark 12,974 13,369 13,567 13,510 14,199 9.4%
Regional 20,748 21,241 21,397 21,278 22,183 6.9%
State 350,467 354,032 357,960 383,054 364,849 4.1%
Source: Job Service of North Dakota

41
Total employment in Stark County in 2008 was 14,119, with 1839 being in federal, state, or local government. The highest average wage was $76,188 (Mining). Mining, which includes employment in the energy sector, was the fastest growing employment segment. Construction accounted for the highest average wage growth, $56,228. (Job Service of North Dakota)
The unemployment rate in Stark County in March of 2010 was 2.7%. This was below the state average of 3.8% (Job Service of North Dakota).
Table 25
UNEMPLOYMENT RATES SUB-STATE REGION VIII
1990 THROUGH 2009 ANNUAL AVERAGES
Place 1990 1994 2000 2007 2009
Adams 2.1% 2.1% 2.6% 2.9% 2.8%
Billings 3.1% 4.4% 3.8% 4.3% 1.8%
Bowman 1.9% 3.2% 1.7% 2.5% 2.5%
Dunn 5.7% 3.2% 3.6% 5.0% 4.1%
Golden Valley 2.2% 3.7% 3.4% 3.9% 3.6%
Hettinger 4.4% 3.9% 2.7% 4.1% 3.5%
Slope 6.7% 9.1% 2.6% 2.6% 1.2%
Stark 4.2% 4.4% 3.1% 2.9% 2.9%
Regional 4.6% 4.3% 3.0% 3.5% 2.8%
State 3.9% 3.9% 3.0% 3.7% 4.1%
Source: Job Service of North Dakota
42
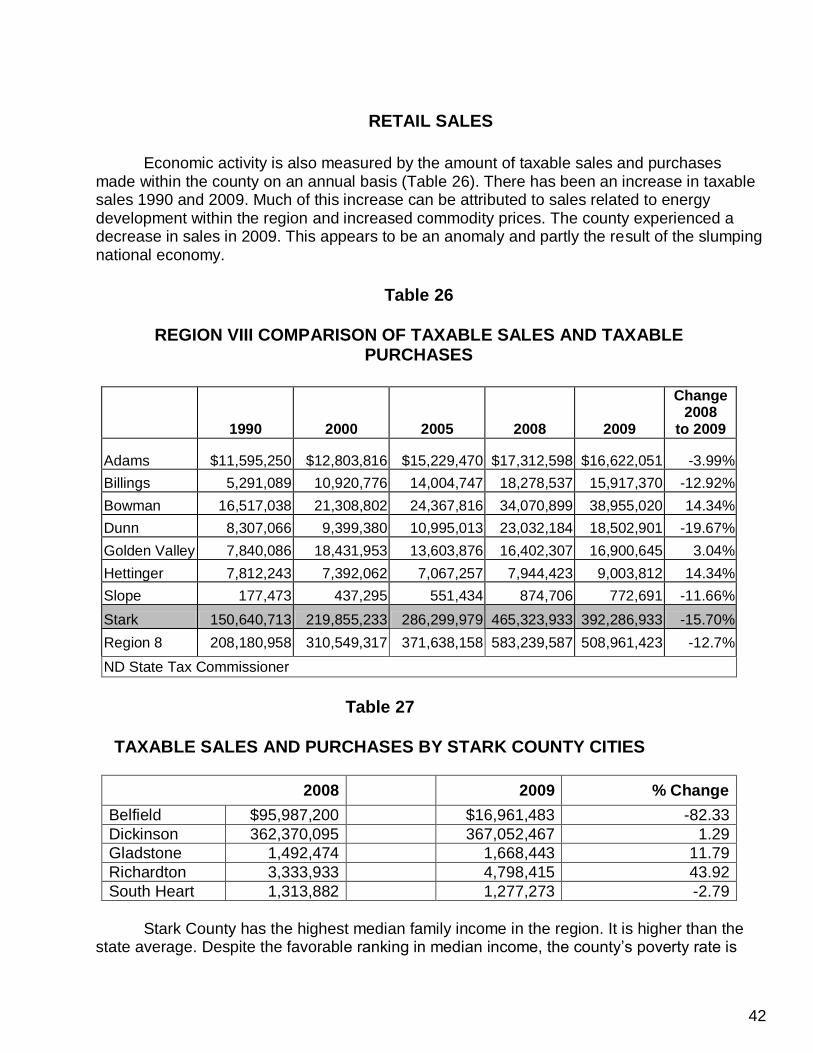
RETAIL SALES
Economic activity is also measured by the amount of taxable sales and purchases
made within the county on an annual basis (Table 26). There has been an increase in taxable sales 1990 and 2009. Much of this increase can be attributed to sales related to energy development within the region and increased commodity prices. The county experienced a decrease in sales in 2009. This appears to be an anomaly and partly the result of the slumping national economy.
Table 26
REGION VIII COMPARISON OF TAXABLE SALES AND TAXABLE
PURCHASES
1990 2000 2005 2008 2009
Change 2008
to 2009
Adams $11,595,250 $12,803,816 $15,229,470 $17,312,598 $16,622,051 -3.99%
Billings 5,291,089 10,920,776 14,004,747 18,278,537 15,917,370 -12.92%
Bowman 16,517,038 21,308,802 24,367,816 34,070,899 38,955,020 14.34%
Dunn 8,307,066 9,399,380 10,995,013 23,032,184 18,502,901 -19.67%
Golden Valley 7,840,086 18,431,953 13,603,876 16,402,307 16,900,645 3.04%
Hettinger 7,812,243 7,392,062 7,067,257 7,944,423 9,003,812 14.34%
Slope 177,473 437,295 551,434 874,706 772,691 -11.66%
Stark 150,640,713 219,855,233 286,299,979 465,323,933 392,286,933 -15.70%
Region 8 208,180,958 310,549,317 371,638,158 583,239,587 508,961,423 -12.7%
ND State Tax Commissioner SOURCE: N.D. Office of State Tax Department
Table 27
TAXABLE SALES AND PURCHASES BY STARK COUNTY CITIES
2008 2009 % Change
Belfield $95,987,200 $16,961,483 -82.33
Dickinson 362,370,095 367,052,467 1.29
Gladstone 1,492,474 1,668,443 11.79
Richardton 3,333,933 4,798,415 43.92
South Heart 1,313,882 1,277,273 -2.79
Stark County has the highest median family income in the region. It is higher than the
state average. Despite the favorable ranking in median income, the county’s poverty rate is
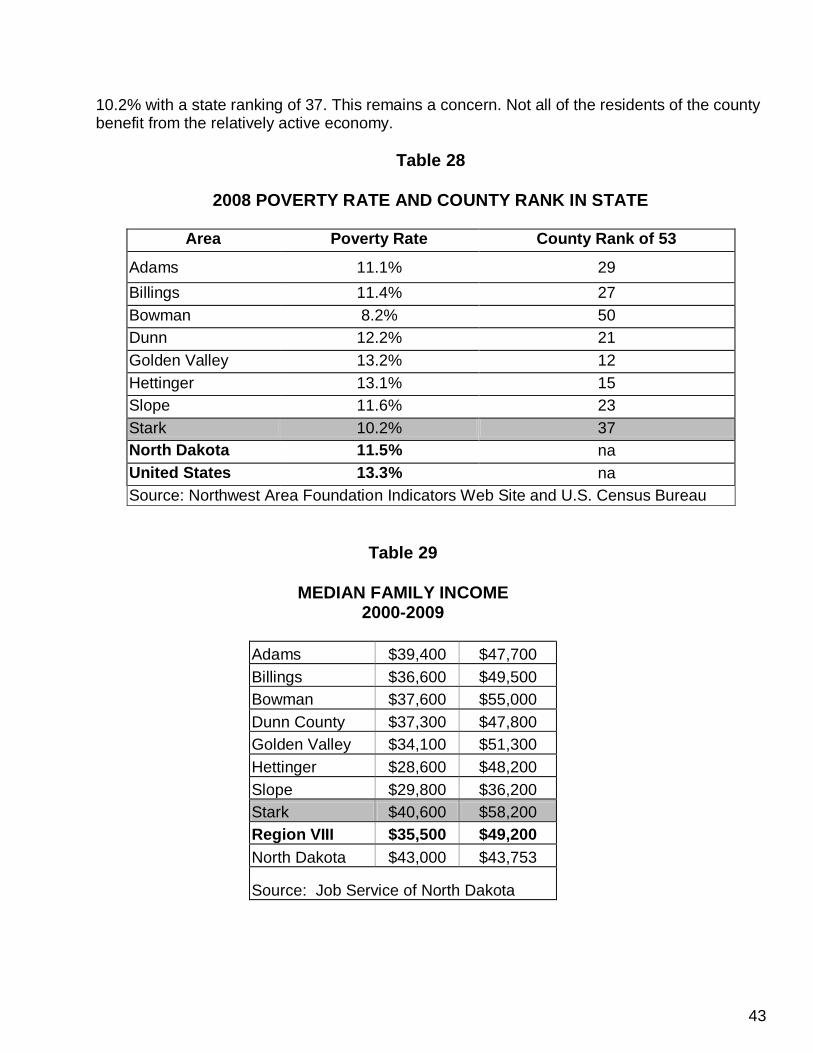
43
10.2% with a state ranking of 37. This remains a concern. Not all of the residents of the county benefit from the relatively active economy.
Table 28
2008 POVERTY RATE AND COUNTY RANK IN STATE
Area Poverty Rate County Rank of 53
Adams 11.1% 29
Billings 11.4% 27
Bowman 8.2% 50
Dunn 12.2% 21
Golden Valley 13.2% 12
Hettinger 13.1% 15
Slope 11.6% 23
Stark 10.2% 37
North Dakota 11.5% na
United States 13.3% na
Source: Northwest Area Foundation Indicators Web Site and U.S. Census Bureau
Table 29
MEDIAN FAMILY INCOME 2000-2009
Adams $39,400 $47,700
Billings $36,600 $49,500
Bowman $37,600 $55,000
Dunn County $37,300 $47,800
Golden Valley $34,100 $51,300
Hettinger $28,600 $48,200
Slope $29,800 $36,200
Stark $40,600 $58,200
Region VIII $35,500 $49,200
North Dakota $43,000 $43,753
Source: Job Service of North Dakota

44
HEALTH SERVICES
The majority of medical facilities in the county are located in Dickinson. St.
Joseph Hospital and Health Services of Dickinson is the only hospital in the county. It is a critical care facility and as such is limited to twenty-five (25) beds. The hospital administration is considering relocating the facility to the western edge of the city.
The city of Dickinson is also served by two clinics: Dickinson Clinic, affiliated with the Med Center One medical establishment of Bismarck, ND, and the Great Plains Clinic. A Veterans Administration clinic is currently under construction in Dickinson. The city of Richardton and Belfield also have medical clinics.
Dickinson has five nursing homes/assisted living facilities that provide for elder care: St. Benedict’s Nursing Home, St. Luke’s Nursing Home, Evergreen, Hawks Point, and Country House Residence.
The county is served by Six (6) EMT districts: Belfield, Dickinson, Richardton, Hebron, Regent, and New England.

45
Map 14

46
HOUSING
The housing market in Stark County is stressed by demands for suitable rental
units to satisfy the demands occasioned by the energy development in the county and surrounding counties. The number of housing units built in the county continues to grow, but supply does not meet demand particularly for low income, medium income housing, and housing for the elderly.
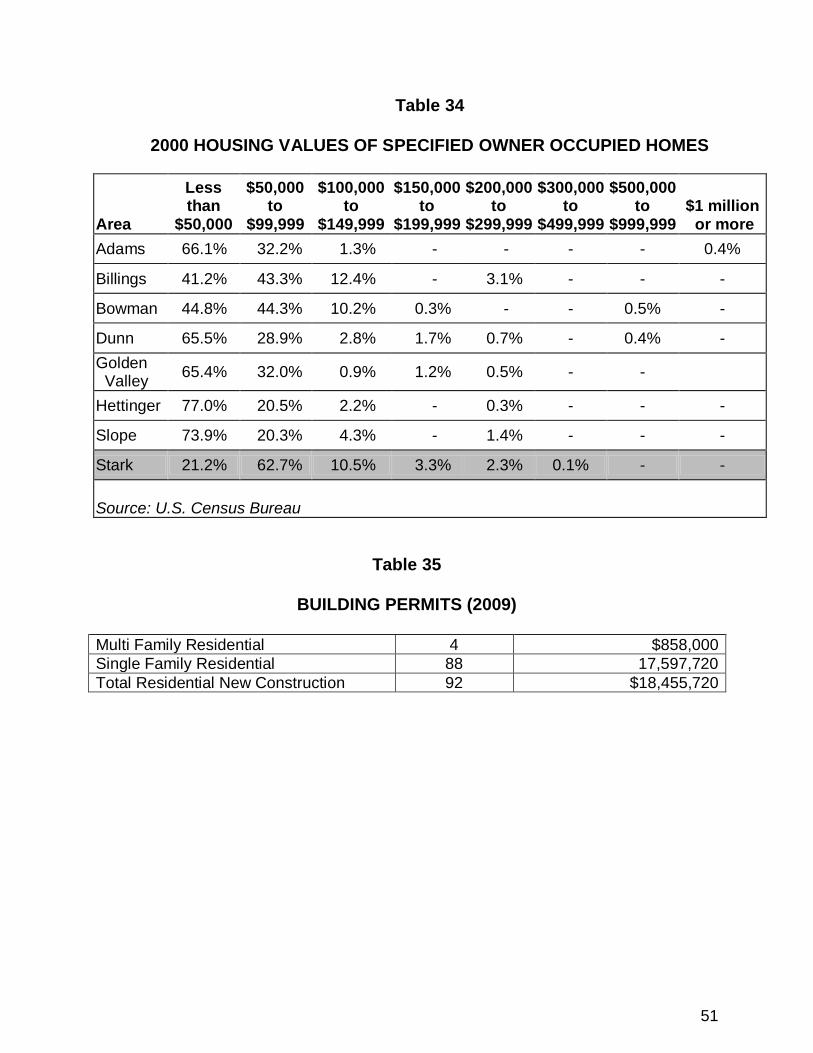
A concern is the increasing age of the housing stock. Forty-two (42) percent of
the existing housing units were constructed prior to 1959 (Table 30). Natural attrition and deterioration takes its toll allowing for substandard housing problems if routine maintenance and replacement is not conducted. The median value of the homes in Stark County is the highest in the region (Table 34). Overall vacancy rates of habitable premises within the county are low.
There are 123 housing subdivisions located in Stark County. Many of these
subdivisions provide minimal infrastructure and services. The widely scattered subdivisions place strain on the ability of the county to provide basic road and public safety services.
A recent housing study indicates a need by the year 2019 for 175 privately
owned homes and 70 rental unit in the county (excluding the city of Dickinson). The estimated cost of such development is $35.5 million dollars (Hanna:Keelan Associates 2009). Ninety-two permits for residential construction were issued in 2009. (Table 35).

47
Table 30
HOUSING STOCK PROFILE/YEAR STRUCTURE BUILT

48
Table 30
Continued
49
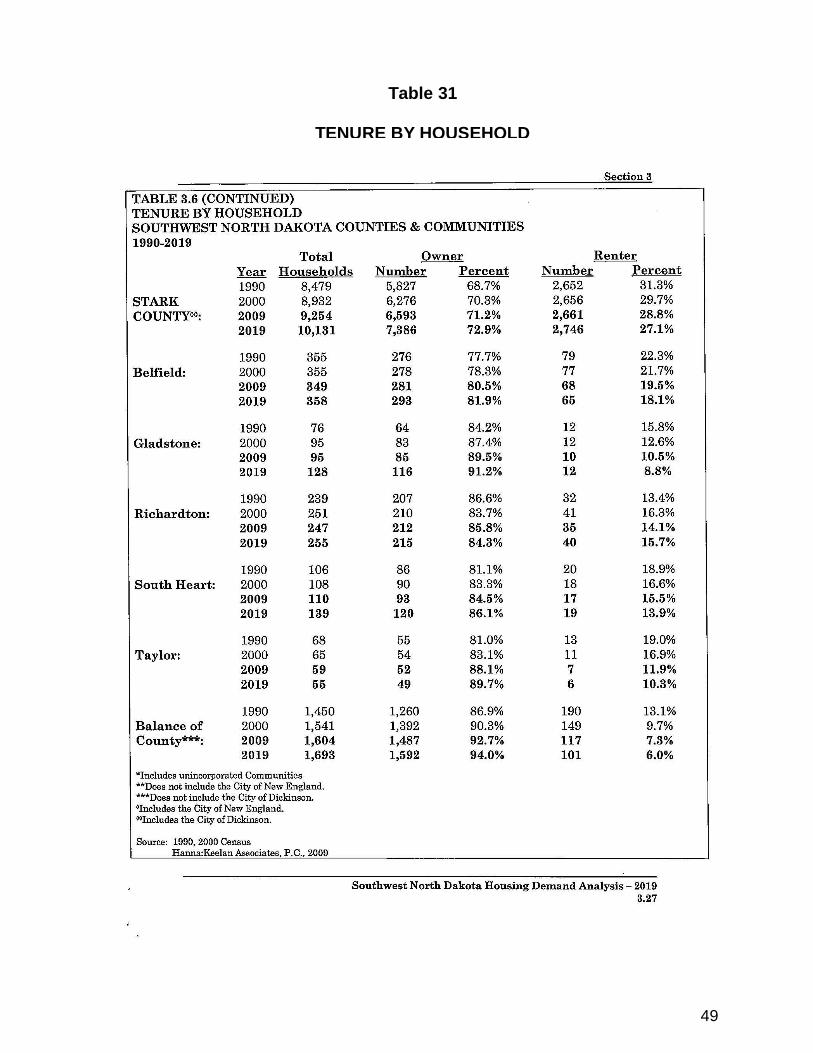
Table 31
TENURE BY HOUSEHOLD

50
Table 32
STARK COUNTY
HOUSING CHARACTERISTICS - 2009
A. Number of Housing Units
Stark County 9,254
Belfield 95
Richardton 349
Gladstone 247
South Heart 110
Taylor 59
Dickinson 7,033
Rural 1,361 Source: Job Service ND
Table 33
OWNER OCCUPIED HOMES AND MEDIAN VALUE IN 2000
Area Number
of Houses Median Value
Adams 466 $37,500
Billings 97 $56,500
Bowman 748 $53,600
Dunn 537 $37,400
Golden Valley 431 $40,600
Hettinger 649 $30,300
Slope 138 $23,900
Stark 4,970 $70,400
Source: U.S. Census Bureau
51
Table 34
2000 HOUSING VALUES OF SPECIFIED OWNER OCCUPIED HOMES
Area
Less than
$50,000
$50,000 to
$99,999
$100,000 to
$149,999
$150,000 to
$199,999
$200,000 to
$299,999
$300,000 to
$499,999
$500,000 to
$999,999 $1 million or more
Adams 66.1% 32.2% 1.3% - - - - 0.4%
Billings 41.2% 43.3% 12.4% - 3.1% - - -
Bowman 44.8% 44.3% 10.2% 0.3% - - 0.5% -
Dunn 65.5% 28.9% 2.8% 1.7% 0.7% - 0.4% -
Golden Valley
65.4% 32.0% 0.9% 1.2% 0.5% - -
Hettinger 77.0% 20.5% 2.2% - 0.3% - - -
Slope 73.9% 20.3% 4.3% - 1.4% - - -
Stark 21.2% 62.7% 10.5% 3.3% 2.3% 0.1% - -
Source: U.S. Census Bureau
Table 35
BUILDING PERMITS (2009)
Multi Family Residential 4 $858,000
Single Family Residential 88 17,597,720
Total Residential New Construction 92 $18,455,720
52
EDUCATION
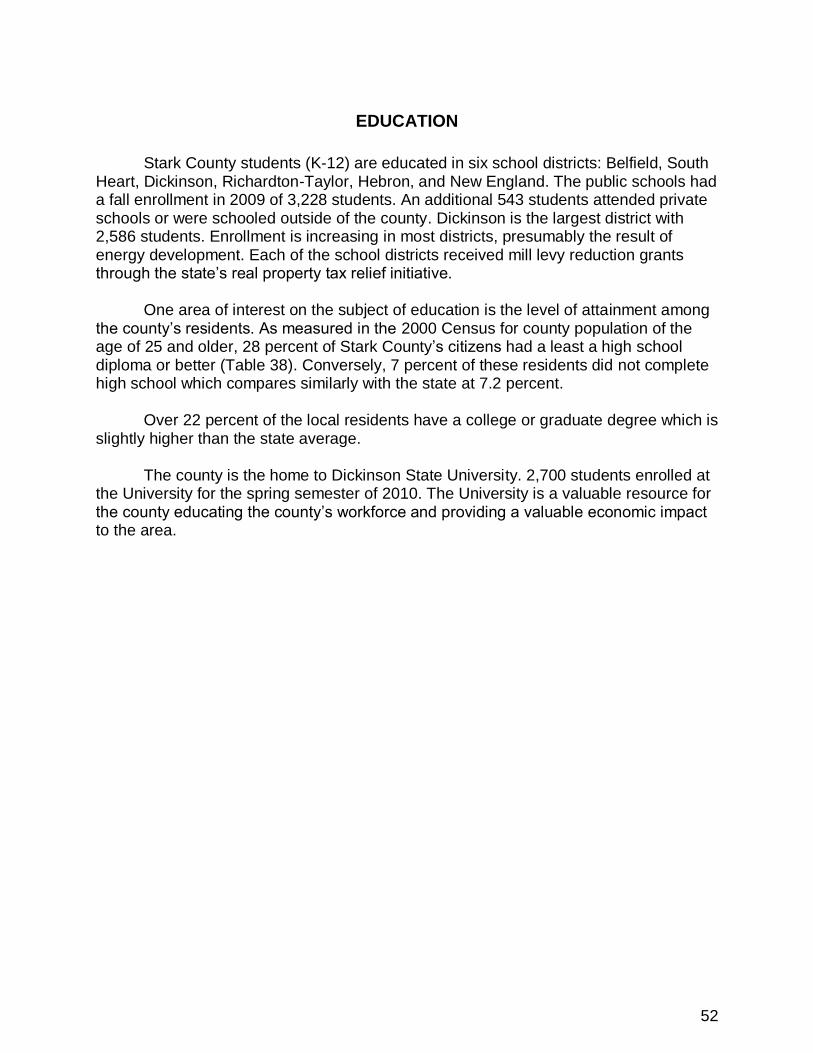
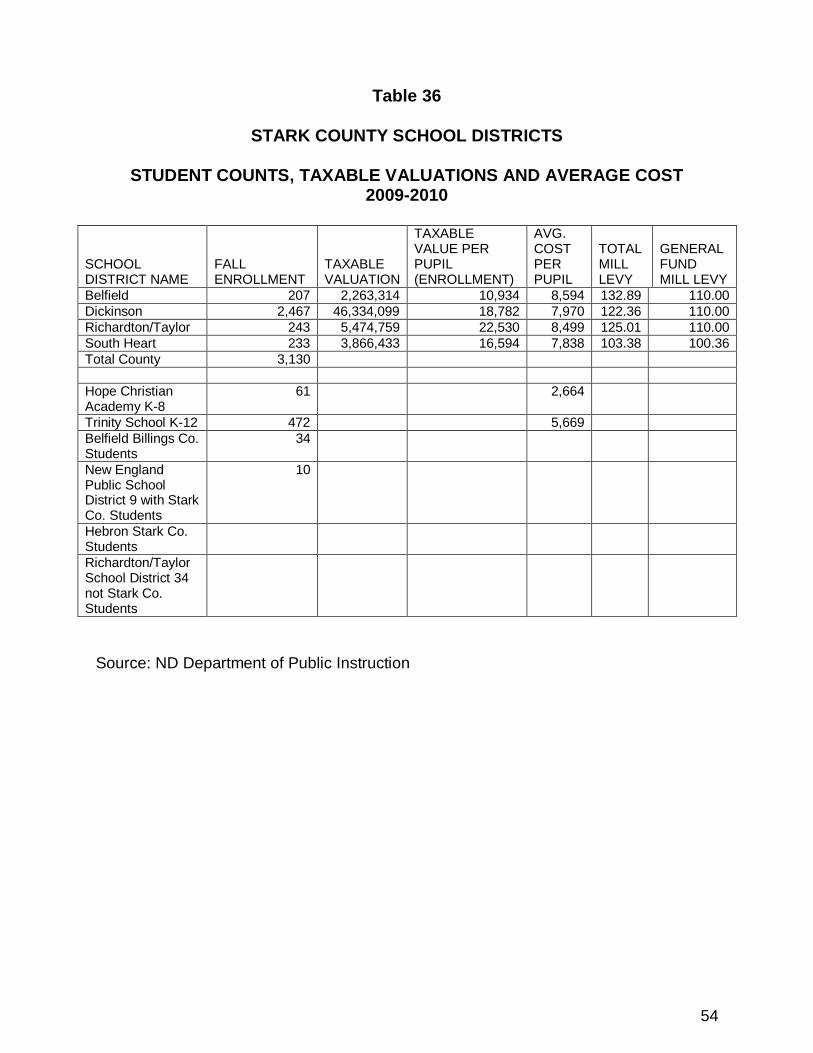
Stark County students (K-12) are educated in six school districts: Belfield, South
Heart, Dickinson, Richardton-Taylor, Hebron, and New England. The public schools had a fall enrollment in 2009 of 3,228 students. An additional 543 students attended private schools or were schooled outside of the county. Dickinson is the largest district with 2,586 students. Enrollment is increasing in most districts, presumably the result of energy development. Each of the school districts received mill levy reduction grants through the state’s real property tax relief initiative.
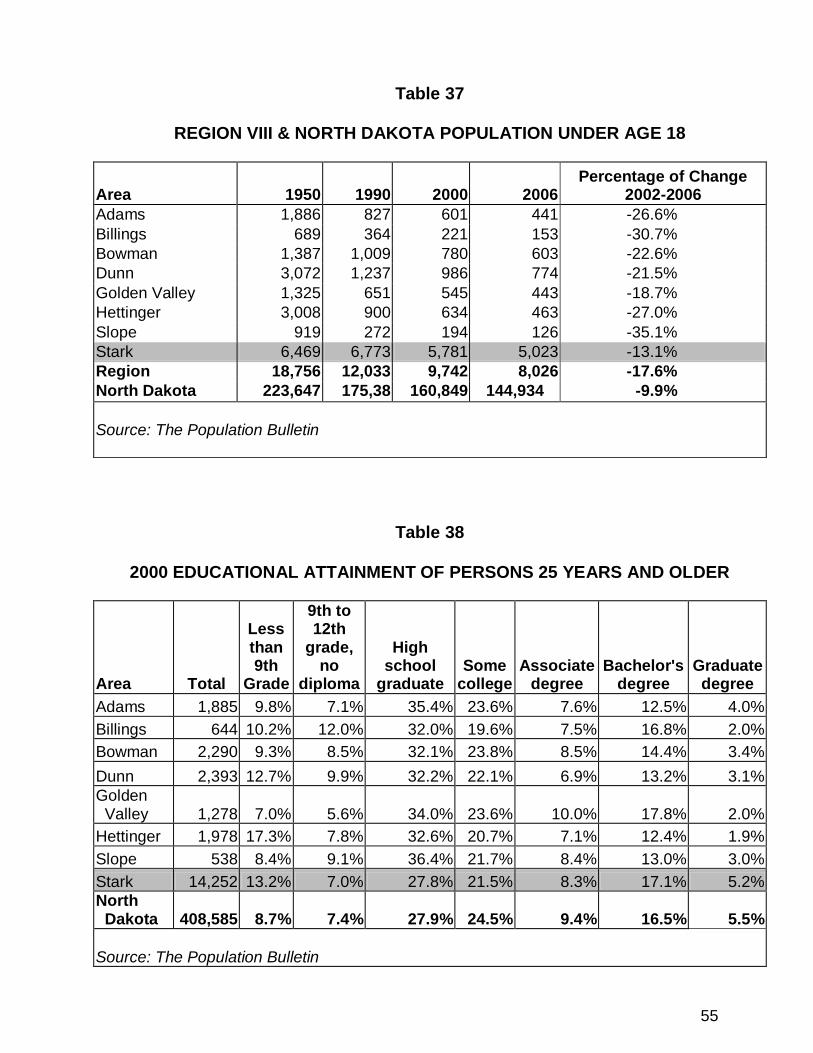
One area of interest on the subject of education is the level of attainment among the county’s residents. As measured in the 2000 Census for county population of the age of 25 and older, 28 percent of Stark County’s citizens had a least a high school diploma or better (Table 38). Conversely, 7 percent of these residents did not complete high school which compares similarly with the state at 7.2 percent.
Over 22 percent of the local residents have a college or graduate degree which is slightly higher than the state average.
The county is the home to Dickinson State University. 2,700 students enrolled at
the University for the spring semester of 2010. The University is a valuable resource for the county educating the county’s workforce and providing a valuable economic impact to the area.

53
Map 15
54
Table 36
STARK COUNTY SCHOOL DISTRICTS
STUDENT COUNTS, TAXABLE VALUATIONS AND AVERAGE COST 2009-2010
SCHOOL DISTRICT NAME
FALL ENROLLMENT
TAXABLE VALUATION
TAXABLE VALUE PER PUPIL (ENROLLMENT)
AVG. COST PER PUPIL
TOTAL MILL LEVY
GENERAL FUND MILL LEVY
Belfield 207 2,263,314 10,934 8,594 132.89 110.00
Dickinson 2,467 46,334,099 18,782 7,970 122.36 110.00
Richardton/Taylor 243 5,474,759 22,530 8,499 125.01 110.00
South Heart 233 3,866,433 16,594 7,838 103.38 100.36
Total County 3,130
Hope Christian Academy K-8
61 2,664
Trinity School K-12 472 5,669
Belfield Billings Co. Students
34
New England Public School District 9 with Stark Co. Students
10
Hebron Stark Co. Students
Richardton/Taylor School District 34 not Stark Co. Students
Source: ND Department of Public Instruction
55
Table 37
REGION VIII & NORTH DAKOTA POPULATION UNDER AGE 18
Area 1950 1990 2000 2006 Percentage of Change
2002-2006
Adams 1,886 827 601 441 -26.6%
Billings 689 364 221 153 -30.7%
Bowman 1,387 1,009 780 603 -22.6%
Dunn 3,072 1,237 986 774 -21.5%
Golden Valley 1,325 651 545 443 -18.7%
Hettinger 3,008 900 634 463 -27.0%
Slope 919 272 194 126 -35.1%
Stark 6,469 6,773 5,781 5,023 -13.1%
Region 18,756 12,033 9,742 8,026 -17.6%
North Dakota 223,647 175,38 160,849 144,934 -9.9%
Source: The Population Bulletin
Table 38
2000 EDUCATIONAL ATTAINMENT OF PERSONS 25 YEARS AND OLDER
Area Total
Less than 9th
Grade
9th to 12th
grade, no
diploma
High school
graduate Some
college Associate
degree Bachelor's
degree Graduate degree
Adams 1,885 9.8% 7.1% 35.4% 23.6% 7.6% 12.5% 4.0%
Billings 644 10.2% 12.0% 32.0% 19.6% 7.5% 16.8% 2.0%
Bowman 2,290 9.3% 8.5% 32.1% 23.8% 8.5% 14.4% 3.4%
Dunn 2,393 12.7% 9.9% 32.2% 22.1% 6.9% 13.2% 3.1%
Golden Valley 1,278 7.0% 5.6% 34.0% 23.6% 10.0% 17.8% 2.0%
Hettinger 1,978 17.3% 7.8% 32.6% 20.7% 7.1% 12.4% 1.9%
Slope 538 8.4% 9.1% 36.4% 21.7% 8.4% 13.0% 3.0%
Stark 14,252 13.2% 7.0% 27.8% 21.5% 8.3% 17.1% 5.2%
North Dakota 408,585 8.7% 7.4% 27.9% 24.5% 9.4% 16.5% 5.5%
Source: The Population Bulletin

56
Table 39
AREA SCHOOL ENROLLMENT (K-12)
Area 1984 2004 2009 Projected
2014
Adams 550 355 283 159
Billings 138 76 44 26
Bowman 766 663 551 605
Dunn 705 529 437 659
Golden Valley 521 381 314 190
Hettinger 743 478 373 274
Slope 53 28 21 22
Stark 5,197 4,105 3,228 2,565
Region 9,476 6,995 5,779 4,768
Source: ND Department of Public Instruction

57
WASTE DISPOSAL
Solid commercial hauler waste regulations in the state changed in 1991 placing
new maintenance and management requirements on local cities and counties. Since the implementation of these new rules, the landfill facilities in many communities have closed. One inert and one solid waste disposal facility exist in the county. The facilities are operated by the City of Dickinson. Waste from the neighboring communities is deposited in this land fill. There is no hazardous waste disposal site in Stark County.
58
PUBLIC UTILITIES
The county is served by a number of entities that provide basic telephone, gas and electric utilities.
Telephone service is provided by Consolidated Telephone Cooperative
headquartered in Dickinson and Qwest Communications. Electrical services are provided by Montana-Dakota Utilities Co. and rural service by Roughrider Electric Cooperative Inc.
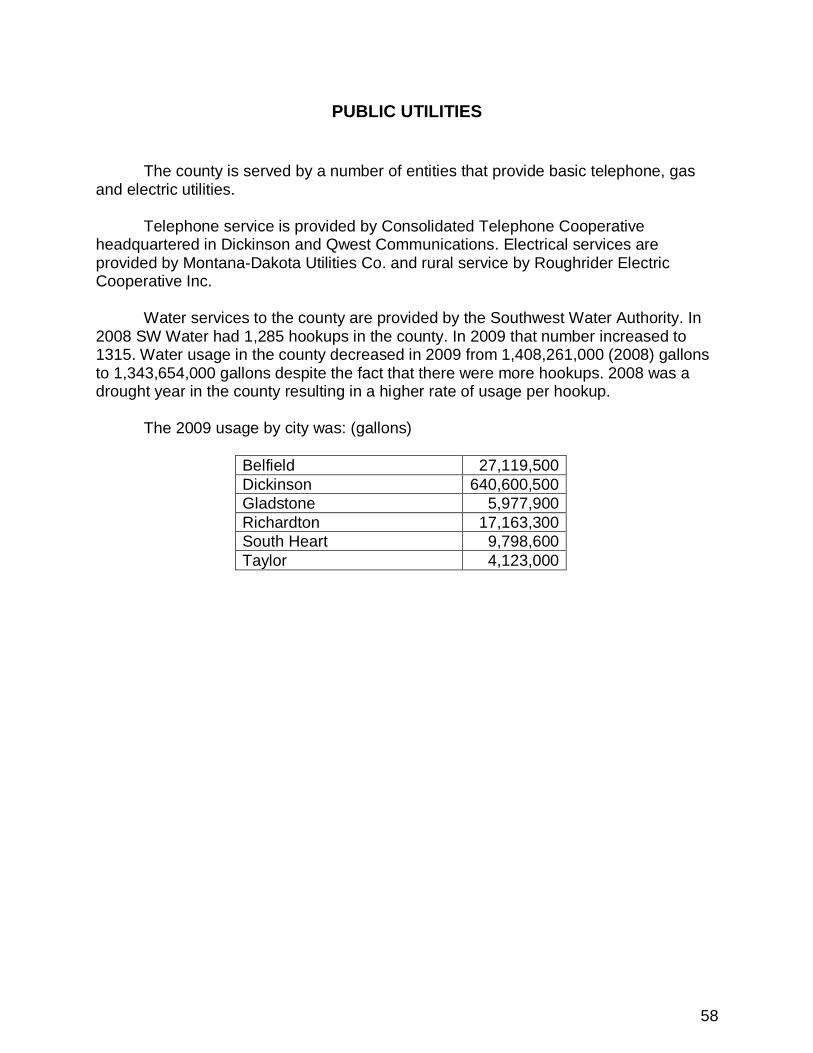
Water services to the county are provided by the Southwest Water Authority. In
2008 SW Water had 1,285 hookups in the county. In 2009 that number increased to 1315. Water usage in the county decreased in 2009 from 1,408,261,000 (2008) gallons to 1,343,654,000 gallons despite the fact that there were more hookups. 2008 was a drought year in the county resulting in a higher rate of usage per hookup.
The 2009 usage by city was: (gallons)
Belfield 27,119,500
Dickinson 640,600,500
Gladstone 5,977,900
Richardton 17,163,300
South Heart 9,798,600
Taylor 4,123,000

59
GOVERNMENT AND GOVERNMENT FINANCES
Stark County’s taxable valuation has risen steadily over the past ten years. The
mill levy for 2009 was reduced to comply with the state property tax relief program adopted by the state’s legislature (Table 40). The county’s income and expenditures have remained relatively stable over the last two years.
The County is served by parts of eight fire districts (Map 17); Billings County, South Heart, Dickinson, New England, Gladstone, Regent, Taylor, Richardton, and Hebron. Each of the districts is manned by volunteer personnel.
The County is represented in the state legislature by representatives from two legislative districts. Legislative District 37 comprises all but the southern part of the city of Dickinson. Legislative District 36 covers the rest of the county and surrounding counties.

60
Map 16

61
Map 17

62
2009
2009 ABSTRACT OF TAX LEVIES
STARK COUNTY, NORTH DAKOTA
TAXABLE RATE
VALUATION TOTAL RATE LEVY
STATE MEDICAL 62,302,343 1.00 62,302.34
WATER AUTHORITY 1.00 62,302.34
COUNTY " 95.87
GENERAL " 23.00 1,432,953.56
SPECIAL ROAD & BRIDGE " 1.61 100,306.86
FARM TO MARKET RDS (FED AID) " 10.00 623,023.43
SOCIAL SERVICES/COUNTY POOR " 25.92 1,614,876.80
JAIL " 10.00 623,023.43
SOCIAL SECURITY " 4.00 249,209.41
TECHNOLOGY " 4.00 249,209.41
COUNTY AGENT " 2.00 124,604.70
VETERANS SERVICE " 1.25 77,877.92
ADVERTISING " 0.50 31,151.15
INSURANCE RESERVE " 0.58 36,135.39
COMP HEALTH CARE " 4.00 249,209.41
COUNTY FAIR ASSOCIATION " 1.50 93,453.55
JOB DEVELOPMENT " 2.00 124,604.70
VECTOR CONTROL " 1.00 62,302.34
SENIOR CITIZENS " 1.00 62,302.34
WATER RESOURCES " 0.00
SW DISTRICT HEALTH " 3.51 218,681.17
AIRPORT (EX DIX) 23,510,870 1.00 23,510.87
WEED CONTROL (EX DIX) 23,510,870 4.00 94,043.55
LIBRARY (EX DIX) 23,510,870 4.00 94,043.55
CO PARK (EX SM CITIES) 59,922,721 0.50 29,961.36
ROAD-UNORGANIZED 21,025,512 25.47 538,213.19
TOTAL MILLS
CITY SCHOOL FIRE SOIL CONS 2008 2009
1-DICKINSON 41 1 W 424.75 342.56
1-DF 1 1 C 344.84 269.34
1-DF 1 1 W 344.65 269.21
1-GF 1 2 C 341.84 266.33
1-TF 1 3 C 336.84 261.33
1-NEF 1 10 C 333.73 258.60
1-NEF 1 10 W 333.54 258.47
1-REGF 1 7 C 336.84 261.33
1-GLAD 44 1 2 C 423.94 339.86
3-TAYLOR 43 34 3 C 390.99 313.89
3-TF 34 3 C 339.34 263.98
3-RF 34 4 C 339.34 264.13
3-GF 34 2 C 344.34 268.98
3-REGF 34 7 C 339.34 263.98
4-RICH 42 34 4 C 402.61 323.79
4-RF 34 4 C 339.34 264.13
4-HF 34 14 C 340.01 264.60
4-TF 34 3 C 339.34 263.98
6-MF 6 6 C 314.18 258.75
9-SO HEART 45 9 9 W 367.27 296.45
9-DF 9 1 W 309.75 250.23
9-NEF 9 10 W 298.64 239.49
9-SHF 9 9 W 301.75 242.22
10-NEF 10 10 W 326.01 250.11
10-NEF 10 10 C 326.20 250.24
10-SHF 10 9 W 329.12 252.84
10-REGF 10 7 C 329.31 252.97
10-TF 10 3 C 329.31 252.97
10-MF 10 6 C 329.18 252.75
13-BELFIELD 46 13 W 426.87 351.63
13-SHF 13 9 W 348.91 271.73
13-BFC 13 13 W 353.65 275.89
14 14 C 313.10 251.45
Table 41
Table 40
2009 ABSTRACT OF TAX LEVIES, STARK COUNTY
63
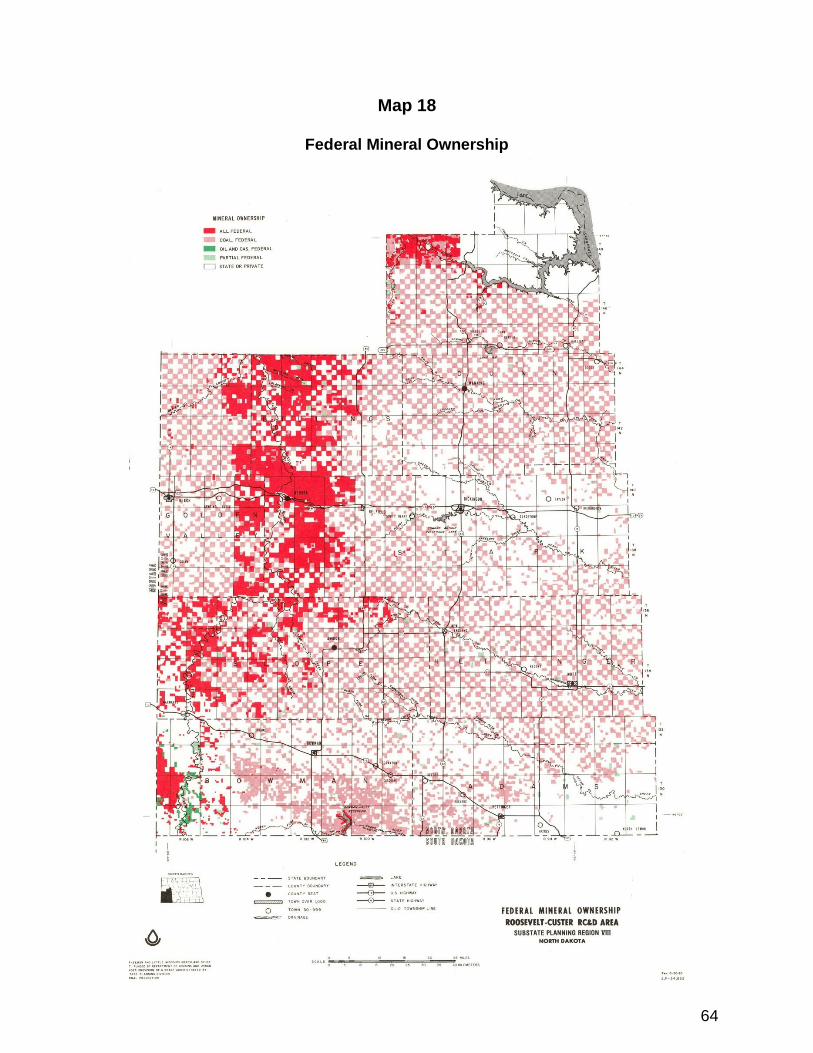
LAND AND MINERAL OWNERSHIP
The large proportion of mineral rights that are owned by the United States
government and railroad companies will influence the development of mineral reserves
within the region. Maps show the areas impacted by this ownership.
64
Map 18
Federal Mineral Ownership

65
Map 19
66
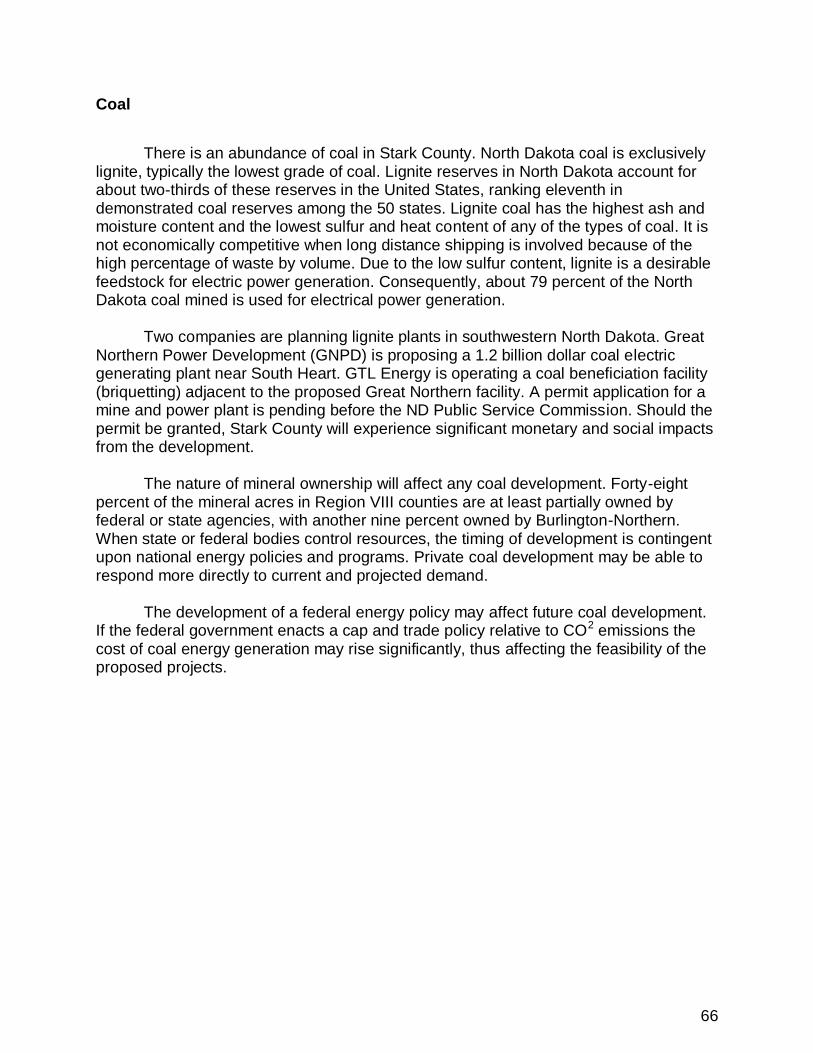
Coal
There is an abundance of coal in Stark County. North Dakota coal is exclusively
lignite, typically the lowest grade of coal. Lignite reserves in North Dakota account for about two-thirds of these reserves in the United States, ranking eleventh in demonstrated coal reserves among the 50 states. Lignite coal has the highest ash and moisture content and the lowest sulfur and heat content of any of the types of coal. It is not economically competitive when long distance shipping is involved because of the high percentage of waste by volume. Due to the low sulfur content, lignite is a desirable feedstock for electric power generation. Consequently, about 79 percent of the North Dakota coal mined is used for electrical power generation.
Two companies are planning lignite plants in southwestern North Dakota. Great Northern Power Development (GNPD) is proposing a 1.2 billion dollar coal electric generating plant near South Heart. GTL Energy is operating a coal beneficiation facility (briquetting) adjacent to the proposed Great Northern facility. A permit application for a mine and power plant is pending before the ND Public Service Commission. Should the permit be granted, Stark County will experience significant monetary and social impacts from the development.
The nature of mineral ownership will affect any coal development. Forty-eight percent of the mineral acres in Region VIII counties are at least partially owned by federal or state agencies, with another nine percent owned by Burlington-Northern. When state or federal bodies control resources, the timing of development is contingent upon national energy policies and programs. Private coal development may be able to respond more directly to current and projected demand.
The development of a federal energy policy may affect future coal development. If the federal government enacts a cap and trade policy relative to CO2 emissions the cost of coal energy generation may rise significantly, thus affecting the feasibility of the proposed projects.

67
Map 20

68
Oil
Oil activity in Stark County has ridden the economic roller coaster over th years.
With an increasing level of production in the early 1980’s, the county’s output in 1985 was over 1.2 million barrels. (Table 41). Thereafter production declined until the development of the Lodgepole formation in the late 1990’s. Production at that time, both oil and gas increased dramatically only to decline again. Production numbers should increase again if exploration in western Stark County in the Three Forks/Sanish/Bakken formations is successful
Revenue from the North Dakota Oil and Gas Production Tax is distributed back to local county, school and cities via prescribed legislative formula. These entities enjoyed significant payouts through the first half of the 1980’s followed by a decline in the late 1980’s and early 1990’s.
Table 41

69
Table 42
OIL PRODUCTION
IN STARK COUNTY
(IN BARRELS)
FISCAL YEAR PRODUCTION
1985 1,229,787
2000 6,507,280
2009 1,229,757
Gas Production (MCF)
___FISCAL YEAR____ PRODUCTION
1990 559,113
2000 3,212,516
2009 975,622
70
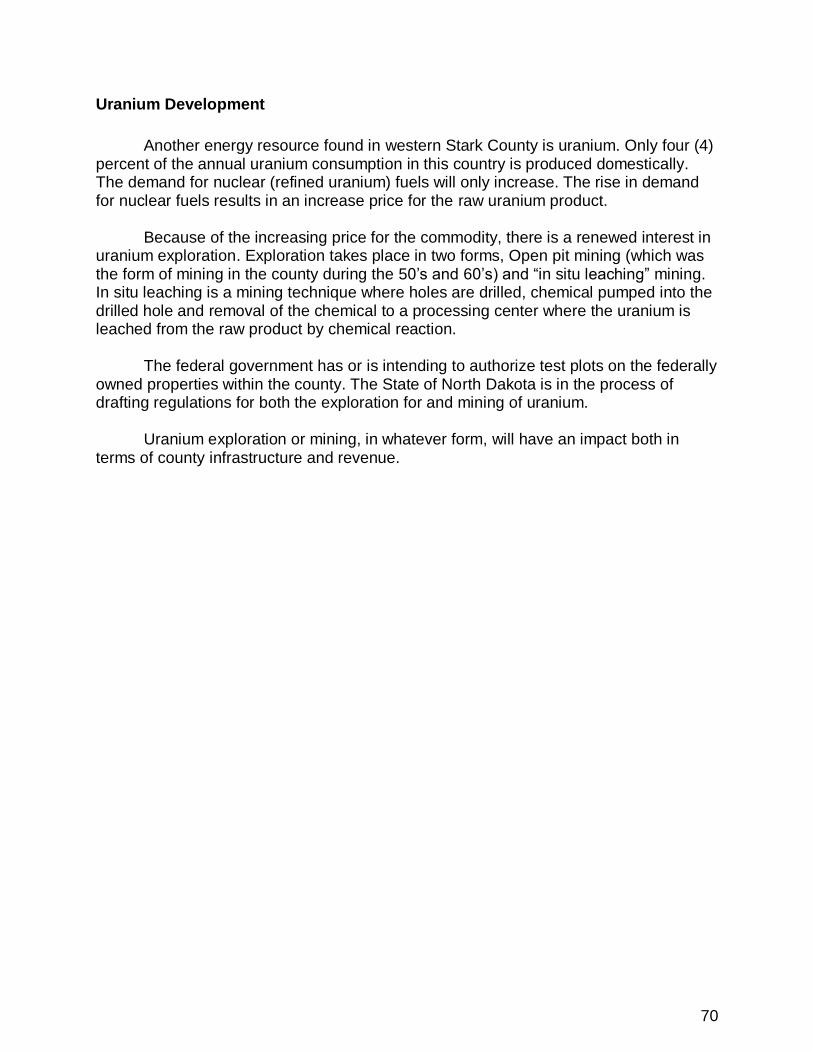
Uranium Development
Another energy resource found in western Stark County is uranium. Only four (4)
percent of the annual uranium consumption in this country is produced domestically. The demand for nuclear (refined uranium) fuels will only increase. The rise in demand for nuclear fuels results in an increase price for the raw uranium product.
Because of the increasing price for the commodity, there is a renewed interest in uranium exploration. Exploration takes place in two forms, Open pit mining (which was the form of mining in the county during the 50’s and 60’s) and ―in situ leaching‖ mining. In situ leaching is a mining technique where holes are drilled, chemical pumped into the drilled hole and removal of the chemical to a processing center where the uranium is leached from the raw product by chemical reaction.
The federal government has or is intending to authorize test plots on the federally owned properties within the county. The State of North Dakota is in the process of drafting regulations for both the exploration for and mining of uranium.
Uranium exploration or mining, in whatever form, will have an impact both in terms of county infrastructure and revenue.

71
Wind Energy Development
North Dakota and Stark County have an abundance of wind. Wind energy
development is now economically viable. The energy produced is both clean and green. Wind energy development in western North Dakota is hampered by a lack of transmission capability. There is presently no adequate transmission capability in Stark County which would allow for wind energy development.
Basin Electric recently constructed a transmission line from Belfield, ND to Rhame, ND. This line may someday provide a means of transmission of wind generated electricity. There are sure to be serious attempts to build wind energy facilities in the county in the future. If such development occurs there will be an impact on the county both in terms of county infrastructure and revenue.
Ethanol Production
In 2007 Red Trail Energy, LLC opened a 50 million gallon ethanol production
facility in Richardton, ND. The facility on a yearly basis will mill 3 million bushels of corn producing not only the volume of ethanol but by-products such as grain meal which can be utilized by area farmers/ranchers as a rich feed source for animal feedlot operations. The demand for corn for the facility resulted in an additional cash grain crop for area farmers. Previously, corn was grown in the region primarily as a feed crop. The demand for corn ethanol production has raised the prices of farm commodities generally thereby improving local farm balance sheets, at least temporarily. In 2008 plants in North Dakota produced 353 million gallons of ethanol. The Red Trail plant produced 14% of the total.