stardust technical report
TRANSCRIPT
Northwest Copper Corp.
2021 Stardust Project Technical Report
Page i
Stardust Project
Updated Mineral Resource Estimate
NI 43-101 Technical Report
Omineca Mining Division, British Columbia
Effective Date: May 17, 2021
Prepared for:
Northwest Copper Corp.
Prepared by:
Ronald G. Simpson P.Geo., Geosim Services Inc.
Report Date: July 2, 2021

Northwest Copper Corp.
2021 Stardust Project Technical Report
Page ii
DATE AND SIGNATURE PAGE
The effective date of this NI 43-101 Technical report, entitled “Stardust Project, Updated Mineral Resource
Estimate, NI 43-101 Technical Report,” is May 17, 2021.
___________________________________
Ronald G. Simpson, P.Geo.
Date: July 2, 2021.

Northwest Copper Corp.
2021 Stardust Project Technical Report
iii
Table of Contents
1.0 Summary .................................................................................................................................. 1
Introduction ......................................................................................................................................................... 1
Project History .................................................................................................................................................... 1
Mineral Tenure ................................................................................................................................................... 1
Geology and Mineralization ........................................................................................................................ 2
Metallurgical Testwork ................................................................................................................................... 2
Exploration ........................................................................................................................................................... 3
Mineral Resource Estimation ....................................................................................................................... 4
Interpretation and Conclusions.................................................................................................................. 4
Recommendations............................................................................................................................................ 5
2.0 Introduction ............................................................................................................................ 7
Terms of Reference .......................................................................................................................................... 7
Qualified Persons .............................................................................................................................................. 7
Effective Dates .................................................................................................................................................... 7
Information Sources and References ...................................................................................................... 7
Previous Technical Reports .......................................................................................................................... 8
3.0 Reliance on Other Experts .................................................................................................... 9
4.0 Property Description and Location ................................................................................... 10
Tenure History .................................................................................................................................................. 10
Mineral Tenure ................................................................................................................................................. 11
Surface Rights ................................................................................................................................................... 14
Agreements........................................................................................................................................................ 14
Royalties .............................................................................................................................................................. 14
Permitting Considerations .......................................................................................................................... 14
Environmental Considerations.................................................................................................................. 14
Comments on Section 4 .............................................................................................................................. 15
5.0 Accessibility, Climate, Local Resources, Infrastructure, and Physiography................ 16
Accessibility ........................................................................................................................................................ 16
Climate ................................................................................................................................................................. 16
Local Resources and Infrastructure ........................................................................................................ 16
Physiography ..................................................................................................................................................... 17
Seismicity ............................................................................................................................................................ 17
Comments on Section 5 .............................................................................................................................. 17

Northwest Copper Corp.
2021 Stardust Project Technical Report
iv
6.0 History .................................................................................................................................... 18
Mineral Resource Estimates ....................................................................................................................... 22
Production .......................................................................................................................................................... 22
7.0 Geological Setting and Mineralization ............................................................................. 23
Regional Geology............................................................................................................................................ 23
Property Geology ............................................................................................................................................ 27
7.2.1 Supracrustal Rocks........................................................................................................................... 30
7.2.2 Intrusive Rocks .................................................................................................................................. 31
7.2.3 Structural Geology ........................................................................................................................... 33
7.2.4 Mineralization .................................................................................................................................... 34
7.2.5 Zn-Pb-As-Sb Vein Zone: Number 1 Zone .............................................................................. 37
7.2.6 Zn-Au-Ag-Pb CRD Mineralization: Number 2, 3, 3 Extension, 4b and East Zones 37
7.2.7 Canyon Creek Skarn (Number 4 Zone) .................................................................................... 39
Comments on Section 7 .............................................................................................................................. 41
8.0 Deposit Types........................................................................................................................ 42
Carbonate Replacement Deposits .......................................................................................................... 43
Porphyry Cu±Mo±Au Deposits................................................................................................................ 48
Comments on Section 8 .............................................................................................................................. 50
9.0 Exploration ............................................................................................................................ 51
Topographic Survey & Imagery ............................................................................................................... 51
Geological Mapping and Prospecting .................................................................................................. 51
9.2.1 2018 Field Mapping and Prospecting ...................................................................................... 51
Geochemical Sampling................................................................................................................................. 51
Geophysics ......................................................................................................................................................... 54
9.4.1 2018 Airborne Geophysics............................................................................................................ 54
9.4.2 2018 Borehole Geophysics ........................................................................................................... 55
9.4.3 2019 EM Ground Survey................................................................................................................ 55
9.4.4 Magnetotelluric Survey .................................................................................................................. 55
9.4.5 2019 Borehole Geophysics ........................................................................................................... 55
9.4.6 2020 Borehole Geophysics ........................................................................................................... 56
Comments on Section 9 .............................................................................................................................. 56
10.0 Drilling ................................................................................................................................... 57
Historic Drilling................................................................................................................................................. 57
2018 Drilling ...................................................................................................................................................... 58
2019 Drilling ...................................................................................................................................................... 61
2020 Drilling ...................................................................................................................................................... 65

Northwest Copper Corp.
2021 Stardust Project Technical Report
v
Core Recovery ................................................................................................................................................... 68
Drill Hole Location Surveys ........................................................................................................................ 68
Downhole Surveys .......................................................................................................................................... 69
Sample Length/True Thickness ................................................................................................................ 69
Comments on Section 10 ............................................................................................................................ 69
11.0 Sample Preparation, Analyses, and Security ................................................................... 70
Sampling Methods ......................................................................................................................................... 70
11.1.1 Soil Samples ....................................................................................................................................... 70
11.1.2 Rock Samples ..................................................................................................................................... 70
11.1.3 Drill Core .............................................................................................................................................. 70
Density Determinations ............................................................................................................................... 71
Analytical and Test Laboratories.............................................................................................................. 71
Sample Preparation and Analysis............................................................................................................ 71
Quality Assurance and Quality Control ................................................................................................ 72
11.5.1 Drill Core QAQC ................................................................................................................................ 72
11.5.2 Soil Sample QAQC ........................................................................................................................... 75
11.5.3 Rock Sample QAQC......................................................................................................................... 75
Sample Security ............................................................................................................................................... 75
Databases............................................................................................................................................................ 76
Comments on Section 11 ............................................................................................................................ 76
12.0 Data Verification .................................................................................................................. 77
Site Visit Verification...................................................................................................................................... 77
12.1.1 Drill Hole Location ........................................................................................................................... 77
12.1.2 Drill Core Logging ............................................................................................................................ 78
12.1.3 Validation of Sampling and Core Storage Facilities ........................................................... 81
12.1.4 Independent Sampling .................................................................................................................. 82
Database Validation ....................................................................................................................................... 83
Comments on Section 12 ............................................................................................................................ 83
13.0 Mineral Processing and Metallurgical Testing ................................................................ 84
Head Assaying .................................................................................................................................................. 84
Metallurgical Testing ..................................................................................................................................... 85
13.2.1 Gravity Performance ....................................................................................................................... 85
13.2.2 Flotation Optimization ................................................................................................................... 86
Conclusion & Recommendations ........................................................................................................... 88
Comments on Section 13 ............................................................................................................................ 88
14.0 Mineral Resource Estimates................................................................................................ 89

Northwest Copper Corp.
2021 Stardust Project Technical Report
vi
Key Assumptions and Basis of Estimate .............................................................................................. 89
Geological Models .......................................................................................................................................... 89
Exploratory Data Analysis ........................................................................................................................... 91
Grade Capping and Outlier Restriction ................................................................................................ 92
Density Assignment ....................................................................................................................................... 94
Variography ....................................................................................................................................................... 95
Estimation/Interpolation Methods ......................................................................................................... 95
Block Model Validation ............................................................................................................................. 103
Classification of Mineral Resources..................................................................................................... 104
Reasonable Prospects of Economic Extraction.............................................................................. 106
Mineral Resource Statement .................................................................................................................. 107
Grade Sensitivity Analysis ........................................................................................................................ 108
Factors That May Affect the Mineral Resource Estimate .......................................................... 109
Comment on Section 14 ........................................................................................................................... 110
15.0 Mineral Reserves Statement ............................................................................................. 111
16.0 Adjacent Properties ........................................................................................................... 112
17.0 Other Relevant Data and Information ............................................................................ 113
18.0 Interpretation and Conclusions ....................................................................................... 114
19.0 Recommendations ............................................................................................................. 116
20.0 References ........................................................................................................................... 117
Tables
Table 1-1 Stardust Mineral Resource Estimate – Canyon Creek Skarn Zone ............................................................... 4
Table 4-1 Stardust Claim Status ................................................................................................................................................... 11
Table 6-1 Exploration History ........................................................................................................................................................ 20
Table 10-1 Drilling Summary by Year (1991-2020) .............................................................................................................. 57
Table 10-2 2018 Drill Hole Locations ......................................................................................................................................... 58
Table 10-3 Significant Intercepts - 2018 Drill Program ...................................................................................................... 61
Table 10-4 2019 Drill Hole Locations ......................................................................................................................................... 62
Table 10-5 Significant Intercepts - 2019 Drill Program ...................................................................................................... 64
Table 10-6 2020 Drill Hole Locations ......................................................................................................................................... 65
Table 10-7 Significant Intercepts - 2020 Drill Program ...................................................................................................... 67
Table 11-1 Analytical Methods - BV ........................................................................................................................................... 71
Table 11-2 Certified Reference Materials ................................................................................................................................. 73
Table 12-1 Independent sample results.................................................................................................................................... 82
Table 13-1 Feed assay summary .................................................................................................................................................. 84

Northwest Copper Corp.
2021 Stardust Project Technical Report
vii
Table 13-2 Chemical Analysis Summary ................................................................................................................................... 85
Table 13-3 Benchmark Grade Composites .............................................................................................................................. 87
Table 14-1 Composite Statistics ................................................................................................................................................... 92
Table 14-2 Grade Caps..................................................................................................................................................................... 94
Table 14-3 Capped Composite Statistics .................................................................................................................................. 94
Table 14-4 Variogram Models ...................................................................................................................................................... 95
Table 14-5 Block Model Extents ................................................................................................................................................... 95
Table 14-6 Global Mean Grade Comparison ...................................................................................................................... 104
Table 14-7 Cost Assumptions used in Cut-off Determination ...................................................................................... 107
Table 14-8 Stardust Mineral Resource Estimate – Canyon Creek Skarn Zone........................................................ 107
Table 14-9 Indicated Mineral Resources by Zone.............................................................................................................. 108
Table 14-10 Inferred Mineral Resources by Zone .............................................................................................................. 108
Table 14-11 Resource Sensitivity - Indicated Class ........................................................................................................... 109
Table 14-12 Resource Sensitivity - Inferred Class .............................................................................................................. 109
Figures
Figure 4-1 General Location Map ................................................................................................................................................ 10
Figure 4-2 Stardust Claim Boundaries and Local Physiography...................................................................................... 13
Figure 7-1 British Columbia Terrane Geology (Source: British Columbia Geological Survey, 2011) ................ 24
Figure 7-2 Regional Geology (Source: British Columbia Geological Survey, 2018) ................................................. 26
Figure 7-3 Property Geology ......................................................................................................................................................... 29
Figure 7-4 Mineralized Zones ....................................................................................................................................................... 36
Figure 8-1 Schematic model of possible links between porphyry districts and sedimentary deposits........... 42
Figure 8-2 Stardust conceptual model ...................................................................................................................................... 43
Figure 8-3 Spectrum of Carbonate Replacement Deposits (Megaw, 2001) ............................................................... 47
Figure 9-1 2018 Geochemical Sampling Grids ....................................................................................................................... 53
Figure 10-1 2018 Drill Hole Locations ....................................................................................................................................... 60
Figure 10-2 2019 Drill Hole Locations ....................................................................................................................................... 63
Figure 10-3 2020 Drill Hole Locations ....................................................................................................................................... 67
Figure 11-1 Log Scatterplot of Field Duplicates for Au ...................................................................................................... 73
Figure 11-2 Log Scatterplot of Field Duplicates for Ag ...................................................................................................... 74
Figure 11-3 Log Scatterplot of Field Duplicates for Cu ...................................................................................................... 74
Figure 12-1 Drill hole collar and marker - site reclamation in progress (Sept 23, 2020) ..................................... 78
Figure 12-2 Core Logging Facility (Sept 23, 2020)................................................................................................................ 79
Figure 12-3 Core Markup for splitting (Sept 23, 2020) ....................................................................................................... 79
Figure 12-4 Core Photography Station (Sept 23, 2020)...................................................................................................... 80
Figure 12-5 SG Measurement Station - Water Immersion Method (Sept 23, 2020).............................................. 80

Northwest Copper Corp.
2021 Stardust Project Technical Report
viii
Figure 12-6 Core Storage Area (Sept 23, 2020) ..................................................................................................................... 81
Figure 12-7 Core Sawing Room (Sept 23, 2020).................................................................................................................... 82
Figure 14-1 Mineral Zone Wireframes – Plan View .............................................................................................................. 90
Figure 14-2 Mineral Zone Wireframes – Looking West ...................................................................................................... 91
Figure 14-3 CPP Charts and Capping Thresholds - Au ....................................................................................................... 93
Figure 14-4 CPP Charts and Capping Thresholds - Ag ....................................................................................................... 93
Figure 14-5 CPP Charts and Capping Thresholds - Cu ....................................................................................................... 94
Figure 14-6 Block model Au grades ........................................................................................................................................... 96
Figure 14-7 Block model Ag grades ........................................................................................................................................... 97
Figure 14-8 Block model Cu grades ........................................................................................................................................... 98
Figure 14-9 Section 6162125N - Au and Ag Grades............................................................................................................ 99
Figure 14-10 Section 6162125N - Cu Grades ...................................................................................................................... 100
Figure 14-11 Section 6162050N - Au and Ag Grades ...................................................................................................... 101
Figure 14-12 Section 6162050N - Cu Grades ...................................................................................................................... 102
Figure 14-13 Section 6162705N - Au and Ag Grades ...................................................................................................... 103
Figure 14-14 Section 6162125N Block Classification........................................................................................................ 105
Figure 14-15 Perspective View of Estimated and Classified Blocks ............................................................................ 105
Figure 14-16 Longitudinal Section showing Block Classification ................................................................................. 106

Northwest Copper Corp.
2021 Stardust Project Technical Report
1
1.0 Summary
Introduction
Geosim Services Inc. (“Geosim”) was requested by Northwest Copper Corp. (“Northwest
Copper” or “the Company”) to prepare a Technical Report in compliance with National
Instrument 43-101 – Standards of Disclosure for Mineral Projects (the “Instrument” or “NI
43-101”) and Form 43-101F1 for the Stardust Project located in central British Columbia.
The Stardust Property (“the Property”, the “Project” or the “Stardust Project), was formerly
known as ‘Lustdust’ and lies in the Omineca Mining Division of north-central British
Columbia, approximately 150km north of Fort St. James. It consists of 20 contiguous
claims owned 100% by Tsayta Resources Corporation (“Tsayta”), a wholly owned
subsidiary of Northwest Copper Corp. There are no title encumbrances, surface rights
issues or legal access obligations that must be met in order for Northwest Copper to
retain the Property. The Stardust Property is not subject to any royalty terms, back-in
rights, payments or any other agreements or encumbrances.
Project History
The Property has been explored since 1944 when the Takla silver vein (No. 1 Zone) was
discovered. Alpha Gold Corporation (“Alpha Gold”) carried out exploration on the
Property between 1991 and 2012. In June of 2016, Lorraine Copper Corp. (“Lorraine
Copper”) entered into an agreement to purchase a 100% interest in the Property from
Alpha Gold.
In September 2017, 1124245 B.C. Ltd. (subsequently renamed “Sun Metals Corp.” (“Sun
metals”) was granted an option to acquire a 100% interest in the Property subject to
certain royalties and terms. Sun Metals fulfilled the 2017 expenditure requirement by
completing an exploration program by year end.
In April 2019, Sun Metals acquired all outstanding shares of Lorraine Copper in order to
own a 100% interest in the Property.
In March 2021, Sun Metals and Serengeti Resources Inc. (“Serengeti”) announced the
completion of a merger and a name change to Northwest Copper Corp.
Mineral Tenure
Northwest Copper, indirectly through its wholly-owned subsidiary Tsayta, owns a 100%
interest in the Stardust Project. The Stardust Project encompasses 24 mineral claims
covering 11,156 hectares.

Northwest Copper Corp.
2021 Stardust Project Technical Report
2
Geology and Mineralization
The Property is located within the Cache Creek Terrane of the Intermontane Belt west of
the Pinchi Fault. Once a major thrust fault, the Pinchi was later reactivated as a major
right-lateral strike-slip fault which can now be traced roughly 600 kilometers through
north-central British Columbia. At Stardust, the Pinchi delineates the terrain contact
between the Pennsylvanian-Permian Cache Creek terrane to its southwest and the
Quesnellia Terrane, which includes and Jurassic Hogem Batholith and Triassic-Jurassic
Takla rocks to the northeast.
Most of the Property is underlain by very strongly deformed Pennsylvanian to Permian
Cache Creek units. Much of the mapped regions of the Property contains an assortment
of intrusions that cut carbonate rocks interbedded with graphitic, siliceous, and
calcareous phyllites, cherts, cherty argillites, and mafic flows. Intrusions are found
throughout the Property, except in the far north of the claims, where they may just be
buried under deep overburden.
Several styles of mineralization that are zonally related to each other are present on the
Property. From most proximal to most distal from the Glover Stock, they are:
• Molybdenum-Copper-Gold Porphyry consisting of quartz-K-spar, pyrite,
molybdenite and/or chalcopyrite veinlets associated with potassic, sericitic, and
propylitic alteration in intrusive rocks (Glover Stock).
• Multi-stage Garnet-Diopside skarn cut by Cu-Au-Ag-Zn bearing structures with
surrounding dispersed Cu-Au mineralization (Canyon Creek Skarn).
• Structurally and stratigraphically controlled massive sulfide Zn, Au, Pb,
• Ag, Cu replacement bodies [CRD] (4b, 3, and 2 Zones) and their oxidized
equivalents.
• Sulfosalt-rich veins (Zone 1) which follow faults and are strongly associated with
fine-grained, linear, felsic dykes containing high values of Au, Ag, Pb, Zn, Sb and
Mn.
• Mercury mineralization in limestone proximal to the Pinchi Fault.
• Sediment-hosted gold mineralization in limestone.
Metallurgical Testwork
Metallurgical testwork was completed by Base Metallurgical Laboratories Ltd. in
Kamloops, BC. A scoping level metallurgical study was undertaken to evaluate the

Northwest Copper Corp.
2021 Stardust Project Technical Report
3
flotation response of three composites prepared to represent a gradient of feed grades.
Testing optimized conditions using the high-grade composite; a series of three rougher
kinetic flotation tests evaluated the sensitivity of primary grind before optimizing the
cleaner circuit with a further five tests. A single cleaner test was performed for each of
the low grade and medium grade composites applying established conditions used for
the high-grade composite.
The final flowsheet used for testing included gravity concentration of gold by Centrifugal
Gold Concentration (CGC) using a laboratory Knelson, followed by cleaning using a
Mozley Table at 150 microns. The combined Knelson and Mozley tails were advanced to
10 minutes of rougher flotation, the rougher concentrate was reground to a target of 40
to 50 microns and cleaned, requiring 2 to 3 stages of dilution cleaning.
The test work showed copper recovery had limited sensitivity to grind sizes between 75
and 150 microns. Gold showed much higher recoveries at 75 microns vs. 100 or 150
microns but the inclusion of a gravity circuit appears to remove the need for a finer
primary grind. The inclusion of the gravity circuit allows for a relatively coarse primary
grind size of 150 microns. Gravity recovered between 24% and 42% of the gold in the
three tests.
Combined gravity and flotation produced copper recoveries from 94.2% to 98.6% and
gold recoveries from 93.0% to 93.9%. Those tests produced copper in concentrate grades
from 21.8% to 26.2%.
Recoveries used in calculation of the base case cut-off were based on these metallurgical
test results and were assumed to be 94% for gold and copper and 86% for silver.
Exploration
The earliest publicly available reports on exploration on the Property date from 1944
with the discovery of Zone 1 (Zn-Pb-As-Sb veins). Later exploration programs resulted
in the discovery of several targets that were drilled sporadically between 1966 and 1981.
Major drill programs began in 1991 when Alpha Gold was the operator. Most of the
exploration carried on the Property since 1999 has focused on the Canyon Creek Skarn
Zone and peripheral areas. Sun Metals has conducted three drill programs on the
Property since 2018 to further delineate and explore for extensions of the Canyon Creek
Skarn Zone. These programs resulted in the discovery of the 421 Zone in 2018. Follow-
up drilling from this discovery established that the 421 Zone was part of the Canyon
Creek Skarn Zone.

Northwest Copper Corp.
2021 Stardust Project Technical Report
4
Mineral Resource Estimation
The updated Stardust mineral resource estimate for the Stardust Project Canyon Creek
Skarn Zone is presented in Table 14-8. It is based on a cut-off of US $65/tonne and 2.5
metre minimum mining width.
Table 1-1 Stardust Mineral Resource Estimate – Canyon Creek Skarn Zone
Class Tonnes (000)
Grades
%Cu g/t Au g/t Ag CuEq
Indicated 1,963 1.31 1.44 27.1 2.59
Inferred 5,843 0.86 1.17 20.0 1.88
Notes:
1. CIM Definition standards (2014) were used for reporting the mineral resources.
2. Mineral resources are not mineral reserves and do not have demonstrated economic viability.
3. Mineral resource estimate prepared by Ronald G. Simpson of GeoSim Services Inc. with an effective date of May 17,
2021.
4. Reasonable prospects for economic extraction were determined by applying a minimum mining width of 2.5 m. and
excluding isolated blocks and clusters of blocks that would likely not be mineable.
5. The base case cut-off of US$65/t was determined based on metal prices of $1,600/oz gold. $20/oz silver and $3.25/lb
copper, underground mining cost of US$45/t, processing cost of US$15/t and G&A cost of US$5/t. Recoveries based
on recent metallurgical test results were assumed to be 94% for gold and copper and 86% for silver.
6. Block tonnes were estimated using a density of 3.4 g/cm3 for mineralized material.
7. Copper Equivalent was calculated using the metal price assumptions stated above: CuEq = Cu + Au * 0.718 + Ag *
0.009.
8. Six separate mineral domains models were used to constrain the estimate. Minimum width used for the wireframe
models was 1.5 m.
9. For grade estimation, 2.0-meter composites were created within the zone boundaries using the best-fit method.
10. Capping values on composites were used to limit the impact of outliers. For Zone 102, gold was capped at 15 g/t, silver
at 140 g/t and copper at 7.5%. For all other zones, gold was capped at 6 g/t, silver at 140 g/t and copper at 5%.
11. Grades were estimated using the inverse distance cubed method. Dynamic anisotropy was applied using trend surfaces
from the vein models. A minimum of 3 and maximum of 12 composites were required for block grade estimation.
12. Blocks were classified based on drill spacing. Blocks falling within a drill spacing of 30m within Zones 2, 3, and 6 were
initially assigned to the Indicated category. All other estimated blocks within a maximum search distance of 100 m
were assigned to the Inferred category. Blocks were reclassified to eliminate isolated Indicated resources within inferred
resources.
13. Totals may not sum due to rounding.
Interpretation and Conclusions
Geosim has prepared a Mineral Resource estimate for the Stardust Project Canyon Creek
Zone. The following observations and conclusions were drawn:
• The Canyon Creek zone is a skarn-hosted mineral occurrence hosted by Permian
Cache Creek group sediments in proximity to the Glover stock. The presently

Northwest Copper Corp.
2021 Stardust Project Technical Report
5
defined mineralized zones extend approximately 1200 m along strike and 1000 m
down dip.
• The adequacy of sample preparation, security and analytical procedures are
sufficiently reliable to support an Indicated and Inferred mineral resource
estimation and that sample preparation, analysis, and security are generally
performed in accordance with exploration best practices at the time of collection.
• The resource estimate is based on analytical data from 206 drill holes representing
80,700 m of drilling. Fifty-eight of these holes (38,329 m) were completed in the
most recent drill programs carried out in 2018, 2019 and 2020. Block grade
estimation is based on samples from 186 of these drill holes.
• Statistical analysis of gold grade distribution indicates that cutting or capping of
high grades is warranted.
• There is significant potential for expanding the current resource and for discovering
additional mineral deposits on the Property and extensions to known mineral
showings.
Areas of uncertainty that may materially impact the Project’s potential economic viability
or continued viability include:
• Commodity price assumptions
• Assumptions that all required permits will be forthcoming
• Metallurgical recoveries
• Mining and process cost assumptions
• Ability to meet and maintain permitting and environmental license conditions and
the ability to maintain the social license to operate.
There are no other known factors or issues that materially affect the project other than
normal risks faced by mining projects the province of British Colombia in terms of
environmental, permitting, taxation, socio economic, marketing, and political factors.
Geosim is not aware of any known legal or title issues that would materially affect the
Project’s potential economic viability.
Recommendations
The results of the recent exploration programs clearly demonstrate that additional
exploration is warranted. The program should continue to focus on expanding the

Northwest Copper Corp.
2021 Stardust Project Technical Report
6
Canyon Creek Skarn zone as well as testing for additional skarn lenses along the
siliciclastic sedimentary – carbonate contact. Infill drilling should be carried out to
upgrade Inferred resources to Measured or Indicated. Advanced metallurgical testing
should also be carried out. Specific recommendations for a first phase program include:
• Resource expansion drilling in order to potentially expand the mineral resources
within the Canyon Creek Skarn Zone.
• Infill drilling to potentially upgrade inferred mineral resources to measured or
indicated.
• Further metallurgical testing including comminution testing, locked cycle tests on
main rock types, variability testing and detailed concentrate analysis to identify
any potential deleterious elements that might impact marketability of the final
concentrates.
A second phase of work would consist of a Preliminary Economic Assessment (PEA) once
the first phase drilling is complete. The second phase work program would be contingent
on the results of the first phase drill program.

Northwest Copper Corp.
2021 Stardust Project Technical Report
7
2.0 Introduction
Northwest Copper is engaged in the exploration of the Stardust Property, Omineca
Mining Division, British Columbia, in which it has a 100% ownership. The Property was
historically known as ‘Lustdust’. Geosim was retained by the Company to estimate a
mineral resource for the Canyon Creek copper-gold skarn deposit and complete a
Technical Report summarizing the findings of the study to meet the requirements of NI
43-101 and Form 43-101F1.
Terms of Reference
Geosim is independent of Northwest Copper and has no beneficial interest in the
Property. Fees for this Technical Report are not dependent in whole or in part on any
prior or future engagement or understanding resulting from the conclusions of this
report.
All measurement units used in this report are metric, and currency is expressed in United
States dollars unless stated otherwise.
The geographic projection used for the project maps and surveys is UTM Zone 10, NAD
83.
Qualified Persons
Ronald G. Simpson, P Geo. (Geosim Services Inc.) served as the Qualified Person (QPs) as
defined in NI 43-101.
Effective Dates
The effective date of this Technical Report is May 17, 2021. The data cut-off date is
March 31, 2021.
Information Sources and References
Information used to support this Technical Report was derived from two previous
Technical Reports (Simpson, 2010 & Simpson, 2018) and assessment reports filed by
Northwest Copper and previous operators.
The author visited the site on June 14, 2010, October 19, 2017, and September 23, 2020.
Details are described in Section 12. 1.
Other supplemental sources of information are cited in the text of this report and listed
in Section 20 of this Report.

Northwest Copper Corp.
2021 Stardust Project Technical Report
8
Previous Technical Reports
Two previous NI43-101 Technical Reports have been completed on the Project:
Simpson, R.G., (2010): Technical Report, Canyon Creek Copper-Gold Deposit, Stardust
Property, Omineca Mining Division, British Columbia, Canada
Simpson, R.G., (2018): Stardust Project NI43-101 Technical Report, Omineca Mining
Division, British Columbia, Canada
A Technical Report was prepared by Snowden in 2005 for Alpha Gold but it was never
filed on SEDAR. (Palmer & Hanson, 2005).

Northwest Copper Corp.
2021 Stardust Project Technical Report
9
3.0 Reliance on Other Experts
The QP author of this Technical Report states that he is a qualified person for those areas
as identified in the "Certificate of Qualified Person", as included in this Technical Report.
The author has not conducted independent land status evaluations and has relied and
believe there is a reasonable basis for this reliance, upon information from Northwest
Copper and the Mineral Titles Branch, Energy and Minerals Division of the Ministry of
Energy and Mines for British Columbia regarding Property status, and legal title for the
Property (Sections 4.2 to 4.4), which the author believes to be accurate.

Northwest Copper Corp.
2021 Stardust Project Technical Report
10
4.0 Property Description and Location
The Property is located approximately 150 km north of Fort St. James in the Omineca
Mining Division of north-central British Columbia on NTS 93N/11W at latitude 55° 34'
North (Northing 6160175) and 125° 25' West (Easting 347850), UTM Zone 10, NAD 83
(Figure 4-1).
Figure 4-1 General Location Map
.
Tenure History
Pursuant to agreements dated July 15, 1989, and February 21, 1992, Alpha Gold acquired
interest in 77 mineral claims known as the Lustdust Property, Omineca Mining Division.
In 2003, Alpha acquired the retained 5% net profits interest and the 2% net smelter return
royalties. In 2003, net smelter returns were purchased for these claims. Also, during 2003,
an additional 8 two-post claims overlying the historic Takla Bralorne Mercury Mine were

Northwest Copper Corp.
2021 Stardust Project Technical Report
11
acquired by purchase. In June 2005 all these claim holdings were converted to eleven
“cell” claims.
In 2006, six additional “cell” claims were acquired bringing the total to seventeen
contiguous claims covering an area of 8,560.75 hectares (Figure 4-2). In 2011 and
additional 3 claims were acquired brining the total area to 9,583 hectares. “Cell” claims
are geographic blocks with boundaries defined by a computer mapping system. No
fractions or ownership disputes are possible with this type of claim.
In August 2013, Alpha Gold was re-named ALQ Gold Corp.
In June of 2016, Lorraine Copper acquired the Property from Alpha Gold. The completion
of the sale was announced in a news release dated September 26. 2016. It was stated
that “Lorraine Copper purchased a 100% interest in the Lustdust Property by (i) issuing
ALQ 5.5 million LLC common shares and (ii) paying ALQ $50,000 in cash. After
acquisition, Lorraine Copper decided to change the Property name to ‘Stardust’.
In September 2017, 1124245 B.C. Ltd. (subsequently renamed “Sun Metals Corp.”) was
granted an option to acquire a 100% interest in the Property subject to certain royalties
and terms. Sun Metals fulfilled the 2017 expenditure requirement by completing an
exploration program by year end.
In April 2019, Sun Metals acquired all outstanding shares of Lorraine Copper in order to
own a 100% interest in the Stardust Project.
In March 2021, Sun Metals and Serengeti announced the completion of a merger and a
name change to Northwest Copper Corp.
Mineral Tenure
Northwest Copper owns a 100% interest in the Stardust Project. The claims are
registered to Tsayta, a wholly owned subsidiary of Northwest Copper. The Stardust
Project encompasses 24 mineral claims covering 11,156 hectares. Claim details are
presented in Table 4-1 and Figure 4-2. A single small claim in the centre of the Property
covers the site of a historic mining drift into the Number 1 Vein Zone that is excluded
from the Project claims.
Table 4-1 Stardust Claim Status
Title Number Claim Name Map Number
Issue Date Good to Date Status Area (ha)
505166 Alpha 1 093N 2005/JAN/29 2026/DEC/15 GOOD 347.16
514104
093N 2005/JUN/07 2026/DEC/15 GOOD 603.62
514105
093N 2005/JUN/07 2026/DEC/15 GOOD 493.88
514106
093N 2005/JUN/07 2026/DEC/15 GOOD 365.99
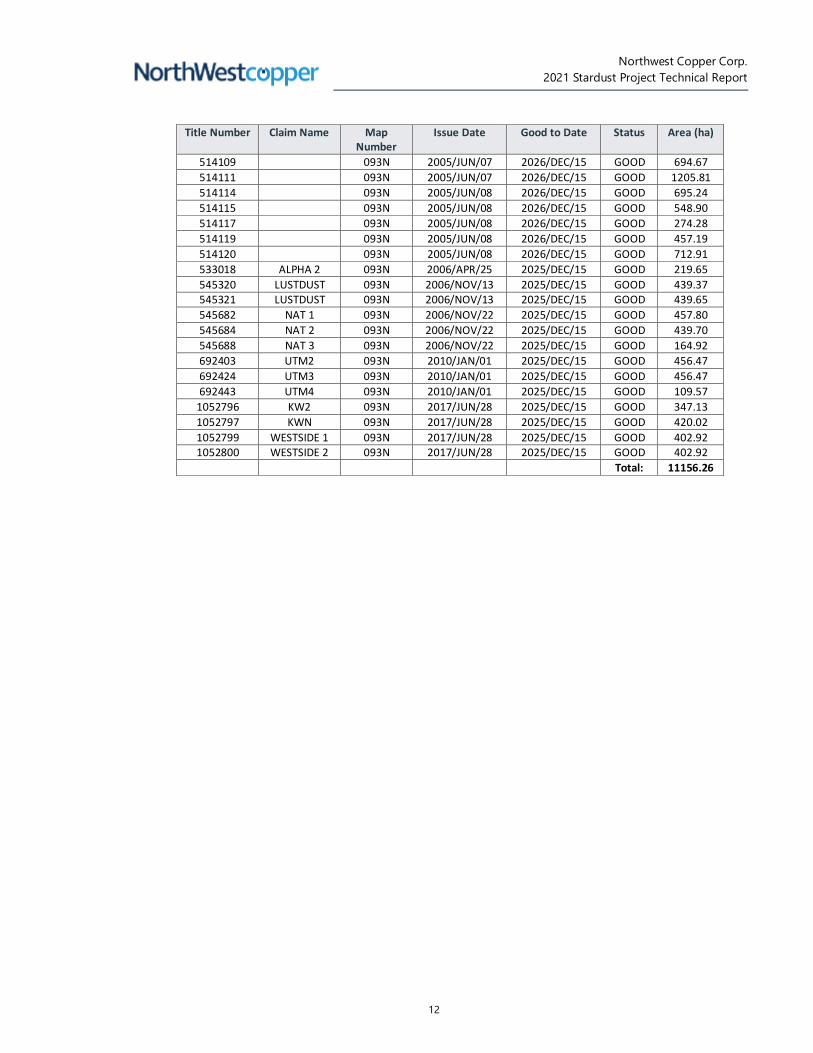
Northwest Copper Corp.
2021 Stardust Project Technical Report
12
Title Number Claim Name Map Number
Issue Date Good to Date Status Area (ha)
514109
093N 2005/JUN/07 2026/DEC/15 GOOD 694.67
514111
093N 2005/JUN/07 2026/DEC/15 GOOD 1205.81
514114
093N 2005/JUN/08 2026/DEC/15 GOOD 695.24
514115
093N 2005/JUN/08 2026/DEC/15 GOOD 548.90
514117
093N 2005/JUN/08 2026/DEC/15 GOOD 274.28
514119
093N 2005/JUN/08 2026/DEC/15 GOOD 457.19
514120
093N 2005/JUN/08 2026/DEC/15 GOOD 712.91
533018 ALPHA 2 093N 2006/APR/25 2025/DEC/15 GOOD 219.65
545320 LUSTDUST 093N 2006/NOV/13 2025/DEC/15 GOOD 439.37 545321 LUSTDUST 093N 2006/NOV/13 2025/DEC/15 GOOD 439.65
545682 NAT 1 093N 2006/NOV/22 2025/DEC/15 GOOD 457.80
545684 NAT 2 093N 2006/NOV/22 2025/DEC/15 GOOD 439.70
545688 NAT 3 093N 2006/NOV/22 2025/DEC/15 GOOD 164.92
692403 UTM2 093N 2010/JAN/01 2025/DEC/15 GOOD 456.47
692424 UTM3 093N 2010/JAN/01 2025/DEC/15 GOOD 456.47
692443 UTM4 093N 2010/JAN/01 2025/DEC/15 GOOD 109.57
1052796 KW2 093N 2017/JUN/28 2025/DEC/15 GOOD 347.13
1052797 KWN 093N 2017/JUN/28 2025/DEC/15 GOOD 420.02
1052799 WESTSIDE 1 093N 2017/JUN/28 2025/DEC/15 GOOD 402.92 1052800 WESTSIDE 2 093N 2017/JUN/28 2025/DEC/15 GOOD 402.92
Total: 11156.26

Northwest Copper Corp.
2021 Stardust Project Technical Report
13
Figure 4-2 Stardust Claim Boundaries and Local Physiography

Northwest Copper Corp.
2021 Stardust Project Technical Report
14
Surface Rights
Surface rights over the Stardust Property are owned by the Crown and administered by
the Government of BC and would be available for any eventual mining operation. The
ownership of other rights (placer, timber, water, grazing, trapping, outfitting, etc.)
affecting the Property were not investigated by the author.
Agreements
On August 19, 2020, a new Exploration Agreement was announced between Sun Metals
(now Northwest Copper) and the Takla First Nation (“Takla”). The new Exploration
Agreement replaces an expired agreement and is valid through to December 31, 2021.
Sun Metals and Takla’s initial two-year agreement was announced in 2018. The
agreement respects Aboriginal title, rights, and interests, and continues to recognize
Takla’s stewardship role in environmental and wildlife monitoring.
Royalties
The Property is not subject to any royalty terms, back-in rights, payments or any other
agreements or encumbrances.
Permitting Considerations
Northwest Copper has an exploration permit issued by the BC Ministry of Energy and
Mines and Low Carbon Innovation authorizing mineral exploration for the Stardust
Project. The permit is good until December 31, 2021, with the option to extend for an
additional 2 years at the discretion of the BC Ministry of Energy and Mines and Low
Carbon Innovation.
Environmental Considerations
The historic Bralorne Takla Mercury Mine is located within the Property boundaries. This
historic mine site is under the jurisdiction of the Crown Contaminated Sites Program.
The Crown Contaminated Sites Program (CCSP) in the Ministry of Forests, Lands, Natural
Resource Operations and Rural Development manages contaminated sites on Crown
land for which there is no existing responsible party. These are typically historic
abandoned mine sites and make up a small fraction of the contaminated sites on Crown
land. CCSP is not involved with contaminated sites on Crown land where there are
specified parties responsible for the contamination.

Northwest Copper Corp.
2021 Stardust Project Technical Report
15
A full remediation and cleanup program was completed on this site through CCSP in
2018. At this point, only ongoing monitoring through CCSP and their contractors is
required. Northwest Copper is not involved with or responsible for any of the ongoing
monitoring programs.
Comments on Section 4
To the extent known there are no other significant factors and risks besides noted in the
Technical Report that may affect access, title, or the right or ability to perform work on
the Property.

Northwest Copper Corp.
2021 Stardust Project Technical Report
16
5.0 Accessibility, Climate, Local Resources, Infrastructure, and
Physiography
Accessibility
The Property is located in the Omineca Mountains approximately 210 kilometers
northwest of Prince George, B.C., and 36 km east of Takla Landing (Figure 4-1). The claims
lie immediately west of the old Bralorne-Takla Mercury Mine (Minfile 093N 008) and
encompass the historic Takla Silver Mine (Minfile 093N 009).
The Property is accessible by road from Highway 16 at Fort St. James by traveling 30 km
along a paved road towards Tachie Lake, then north for 68 km along the all-weather Leo
Creek Forest Service Road (FSR), 54 km along the Driftwood FSR, 26 km along the Fall-
Tsayta logging road, and 3 km along the Silver Creek Road. Total distance by road is
approximately 215 km from Fort St. James and driving time is about 3 hours under good
road conditions. The Property is also accessible by float plane, about a 1-hour trip to
Tsayta Lake from either Prince George or Smithers, followed by a half an hour drive to
the site.
Climate
The climate is cool and moderate with warm, moist summers and cool winters. Snow
accumulations, during average winters, persist from late September through May-June
at the higher elevations. Winter temperatures are commonly below freezing and can fall
as low as -30°C for short periods of time. The region receives an average of 295 mm of
rainfall and 192 cm of snowfall annually with 138 days per year with precipitation
exceeding 0.2 mm. Most of the exploration programs conducted on the Property to date
have been completed during the June to October field season.
Local Resources and Infrastructure
The nearby centres of Prince George, Burns Lake, Houston, and Smithers (populations of
65500, 1930, 2100 and 5350 respectively) have provided all the necessary supplies and
services to operate past exploration programs. All these communities have a strong
mining history. Prince George is the regional centre with a mineral resource sector
economic base and is a five-hour drive from the Stardust Property.
Smaller population centres closer to the Property are Takla Landing and Fort St. James.
B.C. Railway Company maintains an active rail line to Fort St. James (approximately 215
km via road) that could potentially be used for concentrate transport.

Northwest Copper Corp.
2021 Stardust Project Technical Report
17
A core shack, core cutting shack, and an outhouse constructed in 2018 at 4km up the
Property road are the only usable structures on the Property. There are also several
collapsed cabin structures next to the small lake just south of the reclamation site in an
area formerly occupied by historic exploration camps, but these are in complete
disrepair. There are also several fishing lodges and guiding camps within the area,
including the Tsayta Lake Lodge at 7.5 km on the Fall-Tsayta Road, which was the
operations-base for the exploration programs carried out between 2017 and 2020.
Physiography
The terrain is moderate, ranging in elevation from 1000-1525 m on the Property with
little outcrop exposure. Lower elevations are covered by widely spaced lodgepole pine.
At elevations above 1200 m, forest cover consists of overmature spruce and balsam with
an undergrowth of white rhododendron. Despite fairly moist summers, many drainages
are seasonal in nature with progressively diminished flows during the late summer and
fall.
Seismicity
South of 60° N, seismicity in the interior and Rocky Mountain areas drops off rapidly. The
largest earthquake recorded in the southern Cordillera was a magnitude 6.0 in 1918 that
struck the Valemount area of the Rocky Mountain trench. In 1986 a magnitude 5.5
earthquake occurred near Prince George, causing some minor damage.
Comments on Section 5
The accessibility, climate, physiography, and seismic situation of the Stardust Project site
are sufficiently well understood to allow for mineral resource estimation.
Surface rights over the Stardust Property are owned by the Crown and administered by
the Government of BC and would be available for any eventual mining operation. The
Property has abundant water and water rights could be obtained for milling.
Further investigations will be required to identify potential tailings storage areas,
potential waste disposal areas, and potential processing plant sites to support a PEA or
Feasibility Study.

Northwest Copper Corp.
2021 Stardust Project Technical Report
18
6.0 History
The Stardust area was first staked in 1944 when the No. 1 Zone (Takla Silver Veins) was
discovered near the southern end of the Property. Since that time numerous operators
have investigated the Property and immediately surrounding area and a number of
mineralized zones have been identified.
The Bralorne Takla Mercury mine was in operation from November 1943 to September
1944 when mining ceased. During nine months of operation, 59,914 kg of mercury were
recovered from 10,206 tonnes of milled ore from the two largest orebodies (Geological
Survey of Canada Memoir 252, page 157).
Bralorne Mines Ltd. explored the Property from 1952-54. In 1960 Bralorne again
acquired the Property and from 1960 to 1962 carried out further work (drilling and
trenching) in a joint venture with Noranda Exploration Company, Ltd., and Canex Aerial
Exploration Ltd. A limited sampling program was also carried out by Bralorne alone in
1963.
The option held by Bralorne was transferred to Talka Silver Mines Ltd. which was
organized in September 1964 to explore and develop the Property. A new adit, bypassing
the old one, was begun in 1964 and advanced to a total length of 229 m in 1965.
Diamond drilling during 1965-1966 totaled 259 metres underground and more than 762
metres on surface. In July 1968, an agreement was reached with Anchor Mines Ltd. by
which a new company, Anchor-Takla Mines Ltd., was incorporated for the purpose of
performing joint venture work on the Property. Additional ground was acquired in the
A.G. 1-6, Ag 1-4, and Keno l-8 claims. Diamond drilling during the fall of 1968 totaled
573 metres in 17 holes underground, and 1337 metres in 13 holes on surface. The
underground work was confined to the No. 1 zone. The company (Anchor-Takla) was
dissolved in 1977.
In 1977, Granby located the K, L and M claims comprising 38 units to cover a large area
with apparent mineral potential. The M claims adjoined Crown Granted Mineral Claims
L.6181, 6184, 6186 and 6188 which formed part of the former Bralorne Takla Mercury
Mine Property. Pioneer Metals Corporation acquired 100% interest in the Property early
in 1985 and followed with some geological work in 1986.
The Air claim was added to the Property in late 1978, and in 1979 three fractions and 52
metric claim units were located.

Northwest Copper Corp.
2021 Stardust Project Technical Report
19
In 1978 Granby cut 67 km of grid line, carried out a soil geochemical survey and mapped
the Property at a scale of 1:5,000. In 1979 a Pulse E.M, survey was conducted by Glen
White Geophysics Ltd. followed by a diamond drill program later in the year.
In 1989 Alpha acquired the Property and in 1991 completed 988.2 m of drilling in 11
holes on Zone 3. They followed in 1992 with 30 diamond drill holes totaling 1520 metres
on Zone 4B. In 1993, Alpha Gold completed a further 24 diamond drillholes on Zone 4B
and purchased 8 two post claims which overlie the historic Bralorne Takla mine. A total
of four drillholes were collared in the mine area but only three were successfully
completed. An extensive soil geochemical survey was also conducted in the mine area.
Teck Exploration Ltd., under option from Alpha, drilled 16 holes totaling 3063 metres in
1997. Drilling targeted the manto and skarn styles of mineralization that were traced by
trenching in 1996. Alpha completed 1103 metres in a 14-hole diamond drilling program
in 1998 that targeted Zones 1, 2 and 3. In 1999, Alpha completed an 18-hole, 3045-metre
drilling program that accomplished two objectives. It extended the strike length of the
skarn zone 1000 metres further to the north (hole LD99-06 intersected 5.2 metres
grading 8.3 per cent copper) and provided very encouraging information on a previously
untested 400-metre gap between the most southerly skarn holes and most northerly
exposures of manto mineralization. In 2000, Alpha drilled 4680 metres of diamond
drilling in 29 holes. Most of the drill holes targeted prospective skarn zones, although
the company did test areas further west for potential porphyry mineralization. In 2001,
Alpha drilled 18 holes on the Canyon Creek Skarn Zone (CCS) and peripheral targets.
Alpha drilled 19 NQ bore holes totaling 7790 metres between July 8 and September 6,
2002, on the CCS deposit. An additional 42 NQ holes totaling 7908 metres, were
completed in 2003 and 32 holes totaling 6,010 m in 2004. Most of the drilling was on
the CCS deposit.
In 2005, Alpha Gold drilled 5,153 metres in 16 diamond drillholes. Drilling a coincident
gold-arsenic soil geochemistry anomaly 300 metres east of the CCS deposit resulted in
the discovery of the East zone. In 2005 Alpha also conducted a broad, grid-based soil
sampling and bedrock mapping program that covered not only the Dream Creek area
north of the Canyon skarn zone but also part of the Pinchi fault system at the former
Bralorne Takla mercury mine.
In 2005, a mineral resource estimate was prepared by Snowden reportedly in
conformance with the requirements set out in the standards defined by NI 43-101
(Palmer & Hanson, 2005 Palmer & Hanson, 2005). However, this report was never filed
publicly on SEDAR.

Northwest Copper Corp.
2021 Stardust Project Technical Report
20
In 2006, diamond drilling extended the sinuous geometry of the Canyon Creek copper
skarn system both down-dip and to the south. Alpha drilled 6855 metres in 31 NQ
diamond-drill holes and 3054 metres in 24 rotary holes. Trenching of a gold soil anomaly
southeast of the Canyon Creek zone discovered the GD zone. The company completed
a reverse circulation drilling program in an area surrounding the historic Bralorne-Takla
mercury mine to evaluate gold soil anomalies outlined in 2005.
In 2007, Alpha Gold completed 50-line km of soil geochemistry and IP, mapping, and 11
boreholes totaling about 2757 m. In 2008, Alpha completed about 2400 metres of
drilling on untested targets on the southern portion of the Property.
In 2009, Alpha completed 6367m of core drilling in 17 holes, mainly targeting the Canyon
Creek skarn zone. In 2010 Alpha drilled 14 holes (3987 m) in the Canyon Creek and
Canyon Creek Extension zones.
In 2012, Aurora Geoscience was engaged by Alpha Gold to carry out a data evaluation
and report on project potential.
No work was carried out between 2012 and the time the Stardust Project was acquired
by Lorraine Copper.
The 2017 exploration project carried out by Lorraine Copper, included a geochemical
survey, IP, and magnetometer surveys and a 3-hole diamond drill program.
Work by Sun Metals between 2018 and 2020 is described in Sections 9 and 10.
A summary of work performed by the various parties is shown in Table 6-1. Note that
what is listed in the table is not necessarily a complete compilation of exploration work
done on the Property, as some original reports on exploration activities could not be
located.
Table 6-1 Exploration History
Year Company Work Drill
Holes Drilling
(m) Mag (km)
VLF EM (km)
IP (km)
Soil Samp.
Rock Samp.
1944 zone 1 discovery; claim staking
1945 McKee Gp/Leta trenching; drilling 0
1952 Bralorne Mines trenching; drilling
1954 Bralorne Mines drilling 0
1958 Totem Minerals mag, geochem.
1960 Noranda Canex rock cuts; trenching; test pits
1963 Bralorne Mines sampling
1964 Takla Silver Mines drifting

Northwest Copper Corp.
2021 Stardust Project Technical Report
21
Year Company Work Drill
Holes Drilling
(m) Mag (km)
VLF EM (km)
IP (km)
Soil Samp.
Rock Samp.
1966 Takla Silver Mines underground drilling 5 500
1968 Takla Silver Mines surf/underg drilling; bulk sample
1968 Rip Van Mining Hg soil geochem; trenching
1978 Granby Mining geol; geochem; pulse EM 910
1979 Zapata Granby EM
1979 Zapata Granby drilling 3 615.4
1980 Noranda (Zapata) drilling 2 299.3
1981 Noranda (Zapata) geochem; drilling; EM; geol. 6 854 26.15 722
1983 Golden Porphyrite geol.; geochem. 521 56
1984 Golden Porphyrite geochem. 66 3
1984 Equinox Res. geochem. 62 14
1984 Golden Porphyrite geochem. 9
1986 Welcome North sampling
1986 Pioneer Metals geol.
1986 Equinox Res. geochem. 96 15
1989 Eastfield Res. geochem; mag; vlfem; geol. 21 21 570
1989 Eastfield Res. geochem.; geol. 0.45 29 25
1991 Alpha Gold drilling 11 988.2
1991 Alpha Gold resubmission of above AR?
1992 Alpha Gold drilling; trenching; geophys. 30 1520 12.5 23
1993 Alpha Gold summary report 24 2041.84
1996 Teck/Alpha geochem; geol.; trenching 513 259
1997 Teck/Alpha geochem; drilling 16 3062.8
1998 Teck/Alpha drilling 14 1105.3
1999 Alpha Gold drilling; geol. 18 3050
2000 Alpha Gold drilling; geol., mag 29 4680
2001 Alpha Gold drilling; geol. 18 5609
2002 Alpha Gold drilling 19 7790.4
2003 Alpha Gold drilling 42 7908 695
2004 Alpha Gold drilling; geochem. 21 6010 724
2005 Alpha Gold drilling; geochem, geol. 17 5152.9 587
2005 Alpha Gold resource comp. CCSZ
2006 Alpha Gold drilling; geochem, trenching 56 9909.2 7
2007 Alpha Gold airmag/em; drilling 34 8898
2008 Amark airmag 74
2008 Alpha Gold drilling 5 2140

Northwest Copper Corp.
2021 Stardust Project Technical Report
22
Year Company Work Drill
Holes Drilling
(m) Mag (km)
VLF EM (km)
IP (km)
Soil Samp.
Rock Samp.
2009 Alpha Gold drilling; trenching 17 6366.92
2009 Alpha Gold resource estimate
2010 Alpha Gold drilling; geol. 14 3986.7 12 28
2010 Alpha Gold resource comp. CCSZ
2011 Alpha Gold geol; geochem 285
2011 Alpha Gold airmag/ZTEM 330.6 330.6
2012 Alpha Gold Evaluation
2017 Lorraine Copper drilling; geochem; IP/Mag 3 343.5 28.1 28.1 744 45
2018 Sun Metals drilling; geochem; VTEM 23 6877.2 1128 2804 73
2019 Sun Metals drilling; geophysics 28 14024.2
2020 Sun Metals drilling; geophysics 16 11975.4
Totals 471 115708 453.7 1518.25 9340 557
Mineral Resource Estimates
Two previous NI43-101 compliant Mineral Resource Estimates were carried out on the
Project in 2010 and 2018 (Simpson, 2010 and Simpson, 2028). These estimates are no
longer considered current due to the additional exploration work carried out on the
Project since 2017.
Production
There has been no production from the Stardust Property.

Northwest Copper Corp.
2021 Stardust Project Technical Report
23
7.0 Geological Setting and Mineralization
Regional Geology
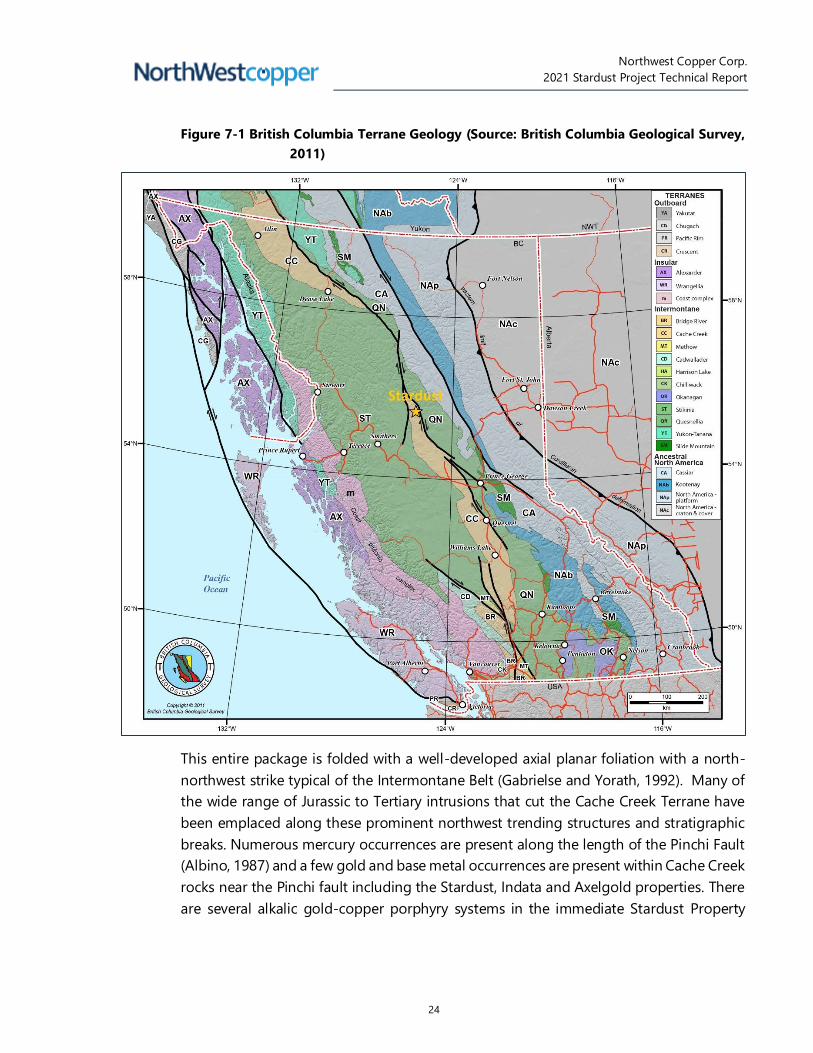
The Stardust Project is located within the Cache Creek Terrane of the Intermontane Belt
west of the Pinchi Fault, which roughly follows Silver Creek north-northwest along the
eastern bounds of the claim package. Once a major thrust fault, the Pinchi was later
reactivated as a major right-lateral strike-slip fault which can now be traced roughly 600
kilometers through north-central British Columbia (Paterson, 1977). At the Stardust
Project, the Pinchi delineates the terrain contact between the Pennsylvanian-Permian
Cache Creek terrane to its southwest and the Quesnellia Terrane, which includes and
Jurassic Hogem Batholith and Triassic-Jurassic Takla rocks to the northeast (Figure 7-1).
The Cache Creek Group comprises a 500-kilometer-long and 3-kilometer-thick
complexly deformed sequence of interbedded argillites, cherts, carbonates, and mafic to
ultramafic volcanic and plutonic igneous rocks with local alpine peridotites and ophiolite
fragments identified in regions to the north of the Stardust Property (Soregaroli, 1999,
Schiarizza and MacIntyre, 1999). The argillites and cherts are typically fine-grained, thinly
bedded deep-marine sediments (Monger, 1977). The volcanic rocks are tholeiitic, of
oceanic affinity and include andesitic to basaltic tuffs, flow-breccias, and pillow lavas. The
carbonates are predominantly bioclastic to micritic and algal-bound shallow-water facies
limestones, which have been interpreted to originate from carbonate bank or reef
depositional environments (Monger, 1977). Though regional studies suggest that
contacts between most of the different lithologies are abrupt and likely represent faults,
some detailed studies executed close to the Stardust Property, infer a more complex
relationship. In 1997, Sano and Struick found limestone conglomerate and sandstones
with volcanic fragments, and limestone fragments within the argillite-chert section just
south of Mt. Pope, 140km south-southeast of the Stardust Property. Similar relationships
are seen in core at the Stardust Property and locally show uninterrupted gradation from
massive limestones to mafic volcanic dominated successions. Though the overall
metamorphic grade is low throughout the Cache Creek Group, some rock units are locally
metamorphosed to blueschist facies.
Northwest Copper Corp.
2021 Stardust Project Technical Report
24
Figure 7-1 British Columbia Terrane Geology (Source: British Columbia Geological Survey,
2011)
This entire package is folded with a well-developed axial planar foliation with a north-
northwest strike typical of the Intermontane Belt (Gabrielse and Yorath, 1992). Many of
the wide range of Jurassic to Tertiary intrusions that cut the Cache Creek Terrane have
been emplaced along these prominent northwest trending structures and stratigraphic
breaks. Numerous mercury occurrences are present along the length of the Pinchi Fault
(Albino, 1987) and a few gold and base metal occurrences are present within Cache Creek
rocks near the Pinchi fault including the Stardust, Indata and Axelgold properties. There
are several alkalic gold-copper porphyry systems in the immediate Stardust Property
Northwest Copper Corp.
2021 Stardust Project Technical Report
25
area including Kwanika Creek to the immediate east of the Property. Regional-scale
geology is shown in Figure 7-2.

Northwest Copper Corp.
2021 Stardust Project Technical Report
26
Figure 7-2 Regional Geology (Source: British Columbia Geological Survey, 2018)

Northwest Copper Corp.
2021 Stardust Project Technical Report
27
Property Geology
Very strongly deformed Pennsylvanian to Permian Cache Creek units underlie about 80%
of the Stardust Property. These units form upright to overturned asymmetrical west-
dipping folds that plunge north at shallow angles. These folds are subparallel to the
north-northwest trending Pinchi Fault that lies along the eastern Property boundary.
Stratigraphy most commonly strikes at 320 to 330° and only 10% of strikes do not fall
within a west-northwest to north-northeast range. Strike often varies over tens of metres,
giving bedding a sinuous, rather than linear, appearance. Dips are generally vertical to
moderate westerly but do exhibit large variance due to the intense deformation in the
area. Other workers (Ash and MacDonald, 1993) have suggested that the intense
deformation of the Cache Creek Group adjacent to the Pinchi Fault in the Stuart Lake
area 140km to the south-southeast makes normal stratigraphic interpretation nearly
impossible. Likewise, since units on the Stardust Property have been thickened, thinned,
pinched, faulted off, or juxtaposed by the intense deformation that they have undergone
during continental accretion and the ensuing intrusive phases, interpreting stratigraphy
can be a difficult task. That said, previous reports (Ledwon and Beck, 2009 and 2010)
indicate conformability to the stratigraphic column at the local scale, making
stratigraphic interpretation feasible. There are slivers and lenses of units throughout the
Stardust Property when outcrop is present. Sedimentary slump structures have been
observed at Stardust, but limited outcrop makes finding them difficult (Ledwon, 2011).
Much of the mapped regions of the Property contains an assortment of intrusions that
cut carbonate rocks interbedded with graphitic, siliceous, and calcareous phyllites, cherts,
cherty argillites, and mafic flows. Intrusions are found throughout the Property, except
in the far north of the claims, where they may just be buried under deep overburden
(Ledwon, 2011). Though most commonly dioritic to monzonitic, intrusives also range
from felsic to tonalitic. A composite intrusive center and linear dyke array known as the
“Glover Porphyry”, occurs in the central and north-central portions of the Property.
Though elsewhere dykes appear to be subparallel to stratigraphy rather than
crosscutting it, here, intrusive body orientation is more northerly. Pervasiveness of Biotite
hornfels and skarn increases towards the stock (Evans, 1998) within the Canyon Creek
Skarn Zone. Some of the intrusive phases contain significant amounts of magnetite and
appear to be responsible for the large magnetic anomaly shown on published regional
maps and in Alpha's 2000 ground-magnetics survey (Butler and Jarvis, 2000), Alpha’s
2008 airborne aeromagnetic survey (St-Hilaire, 2008), and Alpha’s 2011 Airborne AFMAG
ZTEM geophysical survey (Legault et al., 2011), in the 2017 ground-magnetic survey
(Scott, 2017) and in the 2018 airborne electromagnetic survey (Prikhodko et al., 2018).

Northwest Copper Corp.
2021 Stardust Project Technical Report
28
Many of the unmineralized veins found on the Property were seen to emanate from
dykes and cross-cut all other stratigraphy suggesting that non-Glover dykes may be the
youngest rocks on the claims.
The majority of the mafic and andesitic volcanics have been found in the north and
western reaches of the claims. Moving eastward, a non-calcareous, often gradational
package of argillite-phyllite-siliceous phyllite-chert dominates the centre of the Property.
This is followed by swaths of limestone closer to the Pinchi Fault, and finally the Hogem
Batholith on the eastern edge of the claims. Linear dykes oriented subparallel to foliation
can be found throughout the claims. The Glover Stock occurs in the central to north-
central part of the Property. East-west running creeks (Dream Creek, Canyon Creek) likely
trace faults, and appear to have offset stratigraphy.
Newly acquired (in 2017) claims to the northeast of the Property (1052797 and 1052796)
are almost entirely to the east of the Pinchi Fault and, as indicated by 2005 BCGS regional
mapping, are underlain by rocks of the Hogem Plutonic Suite. These claims, plus slivers
of other claims to the east of the Pinchi, make up about 23km2 or roughly 20% of the
Property. Work previously completed by Serengeti at their Kwanika Creek property to
the immediate east of these claims describes multi-phase monzonitic to dioritic Hogem
Batholith intrusions within successions of andesitic Takla Volcanic Group rocks. Though
geology at the Stardust Property is likely similar, these claims were not mapped during
the 2017 field season. Property geology is shown in Figure 7-3.

Northwest Copper Corp.
2021 Stardust Project Technical Report
29
Figure 7-3 Property Geology

Northwest Copper Corp.
2021 Stardust Project Technical Report
30
7.2.1 Supracrustal Rocks
Interpretations of primary stratigraphy are challenged by the strong regional
deformation. In the area of extensive drilling of the 4b and Canyon Creek Skarn (CCS)
zones, several coherent rock panels may be described as follows:
Hanging-wall assemblages to the Canyon Creek Skarn are dominated by a sequence of
thinly compositionally laminated, siliceous and/or argillaceous phyllites often with strong
biotite compositional layers. These rocks are interpreted as ribbon cherts by British
Columbia Geological Survey geologists with extensive regional experience. The
argillaceous, clastic component, of these rocks may increase towards the skarn – calc
silicate horizon, particularly to the south towards the 4b zone.
Skarn assemblages are developed in weakly compositionally-layered limestones, in
calcareous mafic tuffs, or rarely in siliceous phyllites.
Footwall assemblages to the Canyon Creek Skarn are dominated by rocks which are
typically described as cherty argillites and/or cherts. Rocks in the footwall are similar to
hangingwall rocks but qualitatively appear to have a higher proportion of quartz
compositional layers and decreased biotite lamella.
Stratigraphic units are more fully described below:
Limestone (LS)
Light to medium grey, sucrosic, recrystallized limestone, locally with weak stylolitic
cleavages. These rocks bleach to off-white adjacent to skarn fronts. They may contain
numerous internal horizons of both dark grey clastic beds and mafic tuffaceous horizons.
Calcareous Phyllite (CP)
Dark grey-brown, argillaceous interbeds are intercalated with thin, centimetre scale,
calcareous lamella.
Calcite Knot Limestone (Lcs)
Calcite knot limestones may contain either white cm scale calcite aggregates within a
darker grey matrix, or they may be a gradational unit to mafic tuffs where10-30% oval to
cuspate calcite clasts are supported by a strongly calcareous, light to medium green
matrix.
Siliceous Phyllite (SP)

Northwest Copper Corp.
2021 Stardust Project Technical Report
31
These rocks are defined by compositional layers formed by alternating foliation parallel
biotite +/- lesser white micas, with quartz compositional layers. The protoliths of these
rocks is interpreted, by many workers, as ribbon cherts.
Chert (C)
With an increase in quartz content, to greater than 75% rock volume, the rocks are
logged as cherts. Minor increases in biotite compositional layers may shift these rocks
into a phyllitic chert (PC) field.
Argillite (A)
Argillite is a composite unit that includes a wide range of fine-grained, essentially non-
calcareous, carbonaceous, thinly bedded sedimentary rocks. It includes argillites (A),
cherty argillites (CA), thinly bedded cherts, carbonaceous argillites (CA). Graphitic layers
are common throughout. Locally, the thinly bedded units contain fine-grained,
continuous pyrite or pyrrhotite layers that appear to be part of the original sediments.
As with all supracrustal rocks, these units are strongly deformed.
Mafic Tuffs (MT)
Mafic tuffs are well-foliated and often well compositionally layered dark green, to green
and white mottled rocks with highly chloritic and locally calcitic matrices. The chlorite is
interpreted to result from alteration of mafic-intermediate tuffaceous materials. 1-30 cm
limestone fragments are the dominant clasts, but fragments of intermediate and mafic
volcanic rocks are also present. These rocks contain up to 2% finely disseminated pyrite
and/or pyrrhotite and are geochemically anomalous for Pb, Zn, and Cu. Grading in
limestone fragment size is common. Evans (1997, 1998) believed that there was only one
mafic tuff unit and that it was a good marker bed. Previous fieldwork and core logging
show that there are multiple mafic tuff units in the section, and they show enough lateral
variation that their utility as marker beds may be limited.
7.2.2 Intrusive Rocks
Mineralization throughout the Stardust Property shows a close association with the
Glover Porphyry - a composite intrusive complex consisting of stocks and dikes ranging
from diorite to monzonite to rhyodacite. Cu-Au skarn forms abundantly along stock and
dike contacts (and replaces these rocks) and Zn-Au-Pb-Ag-Cu replacement
mineralization is locally well developed along dike margins at more distal locales. Overall,
mineralization shows zonation relative to the inferred center of the Glover Porphyry
complex. Some of the compositional variations can be attributed to potassic alteration
and silicification, which change the original intrusive composition and appearance in

Northwest Copper Corp.
2021 Stardust Project Technical Report
32
hand specimen, but the majority of the phase differences are real. Intrusive rock units
include:
Monzonite (M)
A medium-grained equigranular to weakly porphyritic rock composed of plagioclase>K-
feldspar, abundant elongate hornblende, and euhedral biotite. Quartz is present, but in
minor amounts. This unit crops out extensively as dikes throughout the southern and
southwestern area, and the dikes seem to widen towards the 4b Zone. These dikes locally
host replacement mineralization along their flanks.
Megacrystic Monzonite (Mp)
This intrusive phase is defined by the presence of very strongly plagioclase +/- quartz
porphyritic monzonites. Contacts of these rocks with finer grained phases may be
gradational.
Quartz Monzonite (QM)
These rocks contain 10 -15% free quartz as discrete, millimetre scale phenocrysts. The
rock is also hornblende and biotite porphyritic and may be beginning to shift into a
granodiorite field.
Diorite (D)
Diorites are fine to medium-grained, medium to dark gray-green and composed of
plagioclase, biotite, and hornblende phenocrysts. Accessory magnetite is locally
abundant. The phases are distinguished largely on the presence and the abundance of
biotite and hornblende. This distinction can be difficult to make in the finer-grained units
where potassic alteration has replaced the hornblendes with secondary biotite. Color is
determined by mafic phenocryst content and the degree of chloritic alteration.
Monzodiorite (MD)
A shift to increased percentages of fine-grained matrix plagioclase and a decrease in
mafic phases, hornblende and biotite are the characteristics of this unit. Free quartz is
not identified.
Felsic Dykes (Fd)
Felsic dykes occur across the Property. These are weakly porphyritic felsic rocks with
sparse to prominent 1-3 mm quartz and feldspar phenocrysts set in a sugary fine-grained
matrix of quartz and feldspar. They are locally well flow-banded with banding generally
parallel to their overall orientation. Felsic dykes are often pervasively argillically altered
or silicified making them difficult to distinguish from altered fine-grained monzonite.

Northwest Copper Corp.
2021 Stardust Project Technical Report
33
Felsic dykes in the Number 1 Zone commonly have vein mineralization along one or both
contacts.
Felsic Dykes (Fpd) Plagioclase Porphyritic
Distinctive elongate, sericitized feldspar phenocrysts are abundant within this rock matrix
and may exceed 35% rock volume. The rock also contains 5-8% coarse quartz
phenocrysts.
Mafic Dykes (Bd)
Medium to fine-grained, undifferentiated mafic dykes. Ultramafics (UM) Green to dark
black, uralitically altered, ultramafic intrusions. In their unaltered state, the intrusions are
likely pyroxenites. Elevated interstitial magnetite is common. Pyrrhotite is locally noted.
The intrusions likely trace major strands of the Pinchi Fault. True brittle-ductile fabrics
are common within these intrusions.
7.2.3 Structural Geology
Rocks underlying the Stardust Property have experienced multiple deformational events.
In the absence of geochronological data, definitive age relations between these events
are difficult to establish. However, overall map patterns, rock fabrics and discordant rock
fabrics in drill core suggest that at least two penetrative deformational processes, D1 and
D2, have influenced the current map pattern.
The development of a pronounced planar S1 fabric, often co-planar to bedding and
primary compositional layers, defines an early D1, deformational process. These fabrics
are most likely axial planar to the tight to isoclinal, upright to west overturned, east-
verging folds. The data of Ray et al., (2002) suggest these folds plunge approximately
40-50° to the north-northwest. The distribution of bedrock lithology has been
profoundly influenced by this event.
The rotation of S1 fabrics is evidence for post D1 processes. Although S1 fabrics are
clearly rotated, S2 penetrative foliations are weakly developed and may be measured in
only very selective core and rock samples. Ray et al. (2002) suggest that D2 folds have
similar orientations to D1 folds, but tend to be slightly more open, and have shallower,
20° northwest plunges.
Regionally, folds in the Cache Creek assemblage are typically open (Schiarizza and
McIntyre, 1999), but on the Stardust Property folds are generally asymmetrical and
overturned with short, shallow, west-dipping western limbs and long, steep, west-
dipping eastern limbs. Locally they are isoclinal. Tight folding is likely due to buttressing
against the Pinchi Fault, which is believed to have originally been a major thrust fault

Northwest Copper Corp.
2021 Stardust Project Technical Report
34
(Paterson, 1977). Where observed, these folds have a 10-60 degree N-NW plunge and
minor axial plane shears are common. The noses of antiforms are structurally thickened
and fractured zones favorable for manto mineralization (Evans, 1998; Megaw, 1999).
The entire Property has a strong NW-trending, grain reflecting bedding, tight asymmetric
folding, and bedding plane faults. This structural fabric closely controls intrusive
emplacement and most of the dykes of the Glover stock are strongly elongated along
this N-NW structural grain. The most important, and consistent, fault structures
demonstrated in drill core are roughly coplanar to bedding. Some of these faults have
the appearance of early east verging reverse faults, which are largely lithologically
controlled and mostly identified in the immediate hangingwall to the Canyon Creek
Skarn. These faults may be rotated into slightly steeper positions by latter extension
faults.
The strongest and most strike discordant structural zone on the Property is the structural
zone and dyke system which hosts the Number 1 veins. This mineralized fault structure
has a nearly north-south strike and moderate to steep west dip. In marked contrast, all
structures, including lithology and major skarn bodies on the Stardust Property have
strike relationships which average 150° to 160° and steep westerly dips.
Compilation of the sub-surface data with the surface geological plans suggests that right
stepping lithologic offsets, which occur both to the north and south of Canyon Creek,
are related to fold vergance effects - an east verging, right stepping antiform - rather
than a fault related offset.
Mapping of carbonates on a property-wide scale (Evans 1997; 1998) shows a wide
outcrop band in the southern portion of the Property that appears to decrease in width
to the north, largely disappearing at Canyon Creek. This may be an artifact of limited
outcrop exposures as integration of the subsurface information from drilling suggests
the northern continuity of the most easterly limestone package may be significantly
better than initially interpreted (Figure 7-3). The limestone is asymmetrically folded and
plunges north at 15-20°.
7.2.4 Mineralization
Several styles of mineralization that are zonally related to each other are present on the
Property. From most proximal to most distal from the Glover Stock, they are:
• Molybdenum-Copper-Gold Porphyry consisting of quartz-K-spar, pyrite,
molybdenite and/or chalcopyrite veinlets associated with potassic, sericitic, and
propylitic alteration in intrusive rocks (Glover Stock).

Northwest Copper Corp.
2021 Stardust Project Technical Report
35
• Multi-stage Garnet-Diopside skarn cut by Cu-Au-Ag-Zn bearing structures with
surrounding dispersed Cu-Au mineralization (Canyon Creek Skarn).
• Structurally and stratigraphically controlled massive sulfide Zn, Au, Pb,
• Ag, Cu replacement bodies [CRD] (4b, 3, and 2 Zones) and their oxidized
equivalents.
• Sulfosalt-rich veins (Zone 1) which follow faults and are strongly associated with
fine-grained, linear, felsic dykes containing high values of Au, Ag, Pb, Zn, Sb and
Mn.
• Mercury mineralization in limestone proximal to the Pinchi Fault.
• Sediment-hosted gold mineralization in limestone.
The location of the historic and current mineralized zones on the Property are presented
in Figure 7-4.

Northwest Copper Corp.
2021 Stardust Project Technical Report
36
Figure 7-4 Mineralized Zones
Principle characteristics of the main mineralized zones may be summarized as follows:
Northwest Copper Corp.
2021 Stardust Project Technical Report
37
7.2.5 Zn-Pb-As-Sb Vein Zone: Number 1 Zone
The Number 1 Zone, located at the southern end of the Property, was the site of the
1944 discovery of mineralization on the Property. Here, the limestone and graphitic
phyllites are cut by numerous monzonite and felsic dikes. Sulfosalt veins composed of
nearly massive pyrite, sphalerite, galena, jamesonite, stibnite, arsenopyrite and
freibergite with lesser open-space filling quartz and calcite occur both within the
sedimentary rocks and along dike contacts. Dunne & Ray (2002) also report traces of
very fine-grained calc-silicates in these bodies. Three separate veins have been
recognized, all of which appear to dip steeply west. Felsic dikes are closely related to all
three veins, but the veins do extend beyond the dikes in many places. The Number 1
Zone has the strongest structural control of any occurrence on the Property. The
presence of a regional antiformal crest is likely to be important to the development of
significant mineralized zones as is the main fault structure. Argentiferous Manganese
Oxide Mineralization (AMOM) occurs throughout the Number 1-Zone. AMOM is a typical
distal alteration product in certain major CRD systems (Megaw, 1998) and the Number 1
Zone is strongly anomalous in Mn (Evans, 1997). Based on inclusion chemistry and
mineralogic relationships, Dunne & Ray (2002) suggested that the mineralization in this
zone might be related to high sulphidation-type veins. However, the alteration
mineralogy and textures of quartz and other gangue minerals do not support the high
sulphidation model for these veins.
The principal vein was explored by underground drifting and drilling in the 1945 and
1964-65 seasons. The three ore-shoots (minimum 2 m true widths) above the adit level
were reported to grade 3.6 g/t Au, 780 g/t Ag, and 5% combined Pb and Zn with 5% Sb.
Historic drilling had notoriously bad recovery problems, so in many cases grade was not
reported for potentially significant intersections. Compilation of all available data during
the 2003 exploration season clearly indicated that the currently known strike length of
the Number 1 Fault exceeds 750 m with a significant mineralized zone developed over
approximately 450 m.
7.2.6 Zn-Au-Ag-Pb CRD Mineralization: Number 2, 3, 3 Extension, 4b and East
Zones
Mineralization in these zones consists of roughly stratigraphically concordant massive
sulfide bodies ("mantos") and their oxidized equivalents. The mantos are best developed
along permeable and karsted (?) carbonate beds in close proximity to chlorite-altered
mafic tuff beds. The mantos occur through the Number 2 to Number 4b Zones and
appear to merge into the Canyon Creek Skarn Zone. Drilling results have failed to find
substantial discordant chimney feeders to these mantos, although narrow feeders may
Northwest Copper Corp.
2021 Stardust Project Technical Report
38
have been hit locally (Megaw, 1999). The mantos occur dominantly in structurally
thickened and deformed zones along the crests of antiforms. There is some evidence for
nesting, or repetition, of mantos in successive limestone beds, giving an overall
morphology reminiscent of the stacked "saddle-reef" mantos.
Number 2 Zone
The Number 2 Zone is a minor oxidized replacement zone similar to the Number 3 Zone.
The Number 2 Zone is located very close to the crest of a regional antiform which lies
just north of the Number 2 Zone trenches. Surface sampling indicates an average of 2.3
g/t Au, 109 g/t Ag, 2.16 % Zn and 2.09 % Pb across an average of 5.3 meters true width.
This zone has a strike length, based on surface oxidation, of approximately 200 meters.
Its continuity at depth is much more problematic as significant intersections have not
been obtained from drill holes to date.
Number 3 Zone
The Number 3 Zone contains the largest identified CRD resource identified to date at
Stardust. It is thoroughly oxidized to depths of greater than 100 meters from the surface.
The style of mineralization may be highly amenable to low-cost heap-leach extraction
processes.
The thickest portions of this manto zone occur in carbonates surrounding a mafic tuff
bed along the crest of a regional-scale antiform. The manto may have the form of an
oxidized saddle reef replacement body. Drilling has failed to find a feeder vertically
beneath it, suggesting that it was probably fed from one end with fluid migration
concentrated along the non-reactive tuff bed. Evans (1997) felt that the conduit for this
system was down dip along the west limb of the antiform (possibly with a NW rake). This
zone, based on the trace of oxidation exposed in surface trenches, has a strike length
exceeding 600 meters. The Number 3 zone appears to weaken to the south, south of the
Number 2 Zone trenches. The northern extension of the Number 3 Zone has received
very limited exploration, as has the down dip extensions to this mineralization.
Number 4b Zone
The Number 4b Zone CRD manto is developed along the 4b Antiform, a tight fold, with
60-degree west dips and a 10-15° plunge to the NW. The trace of this fold lies some 300
meters to the west of the Number 3 Zone antiform. The two zones are linked by a north-
northwest plunging synform. Mineralization occurs as a series of aligned, discontinuous
(?) massive sulfide pods (with sparse calc-silicate minerals) following the crest of the fold
and also along the contact between limestone on the east and hornfelsed graphitic
phyllites to the west. A mafic tuff horizon within the limestone appears to be a major

Northwest Copper Corp.
2021 Stardust Project Technical Report
39
conduit for fluid movement, as is seen in the Number 3 Zone. The 4b Zone is, however,
essentially unoxidized: sphalerite, arsenopyrite, coarse-grained well-zoned pyrrhotite,
and pyrite are prominently displayed in surface trenches along the zone.
East Zone
The East Zone was discovered in 2005 by drilling a coincident gold-arsenic soil
geochemistry anomaly approximately 300 metres east of the Canyon Creek Skarn. This
gold-silver-copper-zinc massive sulfide zone is completely “blind” and has been
intersected by five drill-holes over a strike length of 150 metres. It is open along strike
to the north and in both dip directions. The massive sulfide mineralization consists of
pyrite, sphalerite, arsenopyrite, and chalcopyrite. The preliminary interpretation is that
the zone is a carbonate replacement similar to the Number 3 and Number 4B zones.
7.2.7 Canyon Creek Skarn (Number 4 Zone)
The Canyon Creek Skarn [CCS] or the Number 4 Zone, is the skarn-replacement zone
lying north of the 4b Zone. The discovery of this skarn is recent enough that it was not
included in Ray and Dawson's (1998) compilation on B.C. skarns. Prior to the 2001 season,
this zone had been cut by 41 drill holes (97-9, 10, and 11; LD99-03 through 12; and LD00-
02 through 29) and a few trenches (Evans, 1997, 1998; Megaw 1999, 2000). A high
percentage of the pre-2001 holes in skarn intercept high-grade Cu-Au mineralization
along structures cutting garnet-pyroxene skarn. Some of these mineralized structures
were surrounded by zones of dispersed mineralization a few meters wide (Megaw, 1999;
2000).
At shallow levels, the skarn is composed of early coarse-grained green-tan grossular-
andradite garnet with minor fine-grained greenish-yellow diopside and rare vesuvianite
or pyroxene (Ray et al., 2002). Specularite is locally very common as euhedral plates. At
depth, a brown garnet stage crosscuts and overprints the green stage, and at even
greater depths, a red-brown garnet stage appears (Megaw, 1999). These minerals replace
massive limestone and locally replace intrusives (endoskarn). Drilling in 2001 showed
that endoskarn increases with depth (cf. LD01-44, 45). Biotite hornfelsed siliceous phyllite
is also overprinted by skarn, especially on the north side of Canyon Creek. Mafic tuff units
are altered to distinctive green, banded chlorite-garnet units with 5-15% disseminated
pyrite and trace chalcopyrite and sphalerite.
Retrograde hydration of the garnet-diopside skarn also increases with depth. In the
retrograde zones, the brown-red, brown, and green garnet stages are hydrated to a
cream-colored mass of very fine-grained amphibole, chlorite, quartz, and clays or dark
grayish-green masses of felted chlorite, locally preserving the shapes of dodecahedral
Northwest Copper Corp.
2021 Stardust Project Technical Report
40
garnet crystals. Retrograde alteration is often accompanied by a dramatic increase in
magnetite, both as fine-grained masses and as pseudomorphs after bladed specularite,
and increased amounts of chalcopyrite (Megaw, 2000, Ray et al., 2002)
Mineralization in the skarn occurs as Ag and Au-bearing chalcopyrite and bornite with
abundant pyrite, variable sphalerite, and rare arsenopyrite and stibnite emplaced along
and surrounding structures that cut the skarn (Megaw, 1999). Much of the sulfide
replaces skarn silicates. Numerous stages of sulfide mineralization are identified as:
1. Chalcopyrite deposited in interstices and along garnet grain boundaries.
2. Early pyrrhotite (often later pseudomorphed to pyrite) with minor chalcopyrite
and locally intergrown with sphalerite.
3. Pyrite or pyrrhotite (pseudomorphed to pyrite) that is brecciated and healed with
later sphalerite or replaced by chalcopyrite.
4. Massive to dispersed, banded and chaotic chalcopyrite along structures and
replacing adjoining skarn.
5. Magnetite with interstitial chalcopyrite and/or sphalerite, pyrite or pyrrhotite.
6. Sphalerite with chalcopyrite cut by later pyrite veinlets.
7. Massive sphalerite, brecciated and healed by chalcopyrite and sphalerite.
8. Mineralized skarn, brecciated and healed with epithermal style chalcedonic
quartz.
9. Calcite veins filled with Au sulfides/sulfosalts cutting skarn.
The skarn silicates tend to end abruptly and massive sphalerite-chalcopyrite-pyrite-
pyrrhotite mineralization is locally well-developed along the contact of skarn with
recrystallized limestone (marble front). It is near this front that the very high-grade gold
grades associated with the 2002 drilling have been recognized (Oliver, 2002). More
recent drilling by Sun Metals in 2018 resulted in the discovery of the 421 zone, a deeper
and wider extension of the previously explored zones. High-grade gold and sulphide-
rich replacement bodies may be considered transitional mineralization between the
skarn and 4b style of replacement mineralization.
All previous NI 43-101 compliant mineral resource estimates (Simpson, 2010 and
Simpson 2018) were confined to the Canyon Creek Skarn Zone.

Northwest Copper Corp.
2021 Stardust Project Technical Report
41
Comments on Section 7
The regional and deposit-scale geology and controls on mineralization the Property are
sufficiently well understood to permit the construction of geological models and
estimation of mineral resources on the Canyon Creek Skarn (or Number 4) Zone.
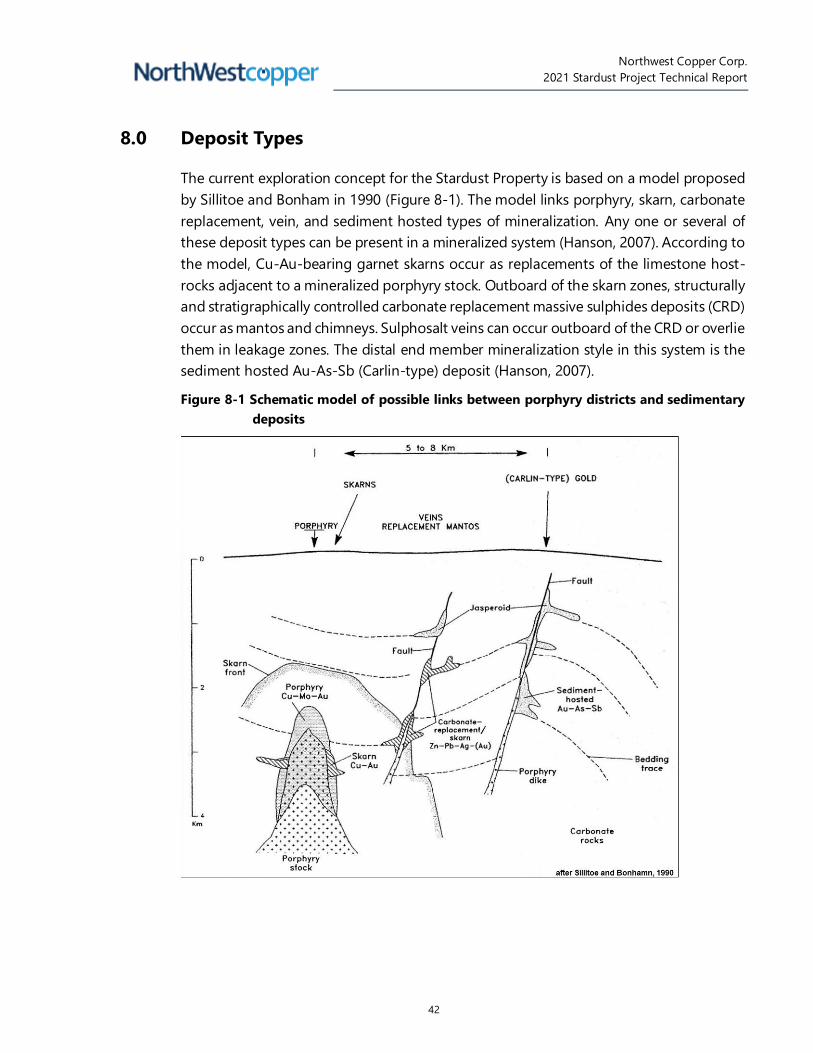
Northwest Copper Corp.
2021 Stardust Project Technical Report
42
8.0 Deposit Types
The current exploration concept for the Stardust Property is based on a model proposed
by Sillitoe and Bonham in 1990 (Figure 8-1). The model links porphyry, skarn, carbonate
replacement, vein, and sediment hosted types of mineralization. Any one or several of
these deposit types can be present in a mineralized system (Hanson, 2007). According to
the model, Cu-Au-bearing garnet skarns occur as replacements of the limestone host-
rocks adjacent to a mineralized porphyry stock. Outboard of the skarn zones, structurally
and stratigraphically controlled carbonate replacement massive sulphides deposits (CRD)
occur as mantos and chimneys. Sulphosalt veins can occur outboard of the CRD or overlie
them in leakage zones. The distal end member mineralization style in this system is the
sediment hosted Au-As-Sb (Carlin-type) deposit (Hanson, 2007).
Figure 8-1 Schematic model of possible links between porphyry districts and sedimentary
deposits

Northwest Copper Corp.
2021 Stardust Project Technical Report
43
A conceptual model for the Stardust Property showing the relative positions of the
various mineralized zones is illustrated in Figure 8-2.
Figure 8-2 Stardust conceptual model
Carbonate Replacement Deposits
Carbonate Replacement Deposits (CRDs) are epigenetic, intrusion-related, and high-
temperature sulfide-dominant Pb-Zn-Ag-Cu-Au-rich deposits. These CRD’s typically
grade from lenticular or podiform bodies developed along stock, dyke, or sill contacts to
elongate-tubular to elongate-tabular bodies referred to as chimneys and/or mantos
depending on their orientation. Limestone, dolomite, and dolomitized limestones are the
major host rocks. Ores grade outward from sulfide-rich skarns associated with
unmineralized or porphyry-type intrusive bodies to essentially 100% polymetallic
massive sulfide bodies. Both sulfide and skarn contacts with carbonate host rocks are
razor sharp and evidence for replacement greatly outweighs evidence for open-space
filling or syngenetic deposition (Titley & Megaw 1985). In reduced, high to low-
temperature systems, proximal to distal metal zoning generally follows: Cu (Au, W, MO),
Cu-Zn (Ag), Zn-Pb-Ag, Pb-Ag, Mn-Ag, Mn, and Hg. This zoning may be very subtle and

Northwest Copper Corp.
2021 Stardust Project Technical Report
44
large scale (Prescott 1916; Morris 1968; Megaw 1990) or tightly telescoped and smaller
scale (Graf 1997).
CRD mineralization is associated with polyphase intrusions that evolve from early
intermediate phases towards late, highly evolved felsic intrusions and related extrusive
phases. The intrusions most closely related to mineralization are usually the most evolved
phases and these are not exposed in many districts. However, they are often encountered
when the system is explored to depth.
CRD exploration is difficult enough that considerable care should be taken in selecting a
target district/deposit prior to high-cost detailed exploration. However, several features
make CRDs highly desirable mining targets including:
• Size-CRDs average 10-13 million tons of ore and the largest range up to ~50
million tons
• Grade-ores are typically polymetallic with metal contents ranging from 2-12% Pb;
2-18% Zn, 60-600 g/T Ag, Tr-2% Cu, and Tr-6 g/T Au. Many have by-product
credits for Cd, W, In, Ga, Ge, Bi, and S)
• Deposit morphology-orebodies are continuous and average 0.5 to 2 million tons
in size, with some up to 20 million tons
• Extraction and Beneficiation- CRDs are typically metallurgically docile, amenable
to low-cost mining methods and the environmental footprint is minimal
Many different features of CRDs tend to be well zoned at district, deposit and hand-
sample scales. The most important zonations are:
• Ore and gangue mineralogy and metal contents
• Orebody geometry
• Intrusive geometry and composition
• Structural controls on mineralization
• Alteration
• Isotopic characteristics of wallrocks.
In general, the largest systems show the best-developed zoning and repetition of zoning
and paragenesis. Zoning tends to be most extensive in the elongate manto and chimney
systems where individual zones may extend over kilometers vertically and laterally
(Megaw 1990, 1998). Zoning in large stock contact skarn systems is typically more

Northwest Copper Corp.
2021 Stardust Project Technical Report
45
compressed because of telescoping and repeated overprinting (Graf 1997). In all cases,
multi-phase mineralization is a reliable indicator of large systems.
The evolution of CRD-skarn systems in time and space, and the gradations seen in single
orebodies or districts suggests that the various manifestations of the deposit type can
be considered part of a spectrum (Einaudi et al. 1982; Megaw et al. 1988; Titley 1993;
Megaw et al. 1998) including:
• Stock contact skarns: formed against either barren or productive (i.e., Porphyry
Copper or Molybdenum) stocks
• Dike and sill contact skarns
• Dike and sill contact massive sulfide deposits
• Massive sulfide chimneys
• Massive sulfide mantos
• Epithermal veins (in some cases)
This conceptual framework allows examination of the mineralization, alteration, intrusion
types, host rock and other characteristics of a given deposit and determining where it
lies within the spectrum. Examination of the composition, geometry, and controls on
intrusion emplacement, if possible, is essential to determining district zoning and level
of exposure. Perhaps most importantly, understanding of the host rock tectono-
stratigraphy can allow rapid determination of the potential for more mineralization in
the host section at depth or laterally in the known favorable beds, or in previously
unconsidered host units.
Structural fabrics are the dominant control variable on mineralization in CRDs, as they
control intrusion emplacement and channel ore fluids into favorable host strata. Most
CRDs lie in fold-thrust belts on major structural domes, arches, anticlines, synclines or
homoclines, and most districts have structural grains controlled by faulting and
fracturing related to regional deformation (Megaw et al. 1988). Orebodies are often
elongate and parallel district-wide structural trends but may not be restricted to a given
structure over great lengths.
Intrusive stocks commonly occur beneath or adjacent to the most proximal portions of
CRD systems, although in many cases they do not crop out. Where intrusions are
exposed, they are generally less than 5 km2 in areal extent. These stocks are generally
polyphase with compositions grading from early diorite to late granite. Texturally, these
intrusions range from equigranular to porphyritic and massive to highly fractured

Northwest Copper Corp.
2021 Stardust Project Technical Report
46
depending on age and proximity to paleosurface. The central stocks may be barren,
contain porphyry copper or molybdenum systems, or have marginal zones with porphyry
copper or molybdenum affinities (Megaw, 1998). In many systems, the early phases of
the intrusion have associated skarnoid or barren skarn, whereas skarn and ore
mineralization are related to later, more highly differentiated phases (Meinert, 1995 and
1999; Graf, 1997; Megaw and others, 1998).
Dikes and sills characterize the intermediate reaches of CRDs and there is often evidence
for multiple dyke/sill emplacement events (Megaw 1990). These intrusions may be
compositionally homogeneous (Megaw 1990) or there may be compositional evolution
between dyke/sill phases (Graf 1997). Textures range from porphyritic to aphanitic,
locally with narrow gradations between textural domains (Megaw 1990). Chimney and
replacement veins are the most common orebody types associated with these intrusions,
although mantos locally occur along sill contact.
The distal zones of CRDs are characterized by massive sulfide bodies lacking an
associated intrusion. These commonly have the form of high angle to vertical slab-like
replacement veins or elongate pipe-like chimneys or low angle to horizontal tabular or
elongate tongue-shaped mantos, generally crudely stratabound. Mantos may be
developed entirely within selected beds or groups of carbonate beds, or may occur with
one or more non-reactive, relatively impermeable sedimentary or intrusive rock contacts.

Northwest Copper Corp.
2021 Stardust Project Technical Report
47
Figure 8-3 Spectrum of Carbonate Replacement Deposits (Megaw, 2001)
Development of carbonate rock alteration in CRDs, like mineralization, is highly variable
in type and in scale. The major alteration types are:
1. Skarnoid or hornfels: These are typically very fine-grained, mineralogically simple,
calc-silicate and silicate assemblages formed through thermal metamorphism without
significant addition of outside components. Skarnoid typically forms from a limestone or
shaly limestone precursor, whereas hornfels forms from shale or limy shale precursors.
Hornfels and skarnoid commonly develop in the thermal aureole around the largest
volume (often early) intrusive phase and may aid in ground preparation for later
metasomatic events. Hornfels mineralogy may be zoned with respect to the thermal
center, commonly with pyroxenes proximal and biotite more distal. Skarnoid and
hornfels often contain abundant fine-grained pyrite or pyrrhotite, but seldom significant
amounts of ore-metal sulfides unless it has been overprinted by subsequent
hydrothermal events.

Northwest Copper Corp.
2021 Stardust Project Technical Report
48
2. Skarn: Skarns are fine to very coarse-grained, often mineralogically complex, calc-
silicate or calcic-iron silicate assemblages formed through metasomatism with significant
addition of outside components. Endoskarn is skarn formed at the expense of intrusive
rock, exoskarn is skarn formed at the expense of wallrocks to the intrusion - most
commonly carbonates. Skarn commonly develops around lesser volume, more fluid-rich
intrusive phases and may overprint hornfels or skarnoid to varying degrees. Anhydrous
talc-silicate minerals (dominantly pyroxenes and garnets) characterize the early
“prograde” skarn phase generated during rising temperatures related to magma
emplacement. Hydrous talc-silicate minerals (dominantly amphiboles, chlorites, and
clays) formed at the expense of predecessor prograde minerals characterize the later
“retrograde” skarn assemblage. Retrograding occurs as temperatures drop and variable
amounts of magmatic fluids and groundwater invade the skarn zone. Skarns are said to
be mineralized when they contain sulfide minerals of economic interest. Said sulfides
may be co-deposited with the talc-silicates, but more commonly are introduced along
structures that cut the skarn, replacing skarn minerals and unaltered wallrocks. Complex
mineralized skarn systems typically show multiple intrusive phases and a repetition of
sulfides replacing talc-silicates presumably reflecting successive intrusive and
hydrothermal events. In some systems, different compositions of skarn and sulfides
characterize each phase (Megaw and others, 1998).
3. Marbleization and Recrystallization: These are present in virtually all CRD systems
and range from narrow zones around mineralization to zones hundreds of meters wide
(Titley & Megaw 1985; Megaw et al. 1988).
4. Silicification or Jasperoid development: These consist of fine-grained silica
replacements of carbonate rocks, with or without appreciable amounts of metals, and
are very common in the peripheries of some CRD systems (Titley & Megaw 1985; Megaw
et al. 1988; Megaw 1990).
Porphyry Cu±Mo±Au Deposits
Porphyry copper deposits are large, low grade, intrusion related deposits which provide
the major portion of the world’s copper and molybdenum and to a lesser degree gold.
The deposits are formed by a shallow magma chamber of hydrous, intermediate
composition at depths of less than five kilometers. When the magma crystallizes, fluids
are released; the fluids’ movement upwards through overlying rocks results in
hydrothermal alteration and deposition of sulphide minerals both as disseminations and
as stockwork mineralization. There is a clear spatial and genetic association between the
intrusion and the alteration zones at a regional and local scale.

Northwest Copper Corp.
2021 Stardust Project Technical Report
49
The defining characteristics that distinguish porphyry deposits are:
• Large size
• Widespread alteration
• Structurally controlled ore minerals superimposed on pre-existing host rocks
• Distinctive metal associations
• Spatial, temporal, and genetic relationships to porphyritic intrusions
These deposits in British Columbia typically occur in the Intermontane Belt, which is host
to the Quesnellia, Cache Creek, and Stikinia Terranes, and based on the composition of
the host rocks comprising three specific types: Alkalic, Transitional, and Calc-Alkalic.
The Glover Stock is an intrusion of Eocene age emplacement (circa 51-52 Ma by U-Pb
zircon dating; Ray et al., 2002). It is inferred to be emplaced between at a relatively
shallow 1.1 to 1.9 kilometer depth as supported by field structural relationships and fluid
inclusion work (Ray et al., 2002; Dunne and Ray, 2002) and less than five kilometers
(Megaw, 2001). The stock is a multiphase composite intrusive complex and most of its
rocks are weakly to strongly feldspar hornblende biotite porphyritic. Compositionally it
ranges from mafic diorite-monzodiorite to leucocratic monzonite-quartz monzonite (Ray
et al., 2002).
The Glover Stock shows many features prospective to host porphyry-style mineralization.
Molybdenite±chalcopyrite-bearing veinlets are associated with several generations of
veins containing quartz, K-feldspar, sericite, pyrite, and tourmaline (Ray et al., 2002).
Alteration assemblages include pervasive albitic or potassic (K-feldspar, sericite, and
biotite), silicic, pyritic, and argillic. A fluid inclusion study supports a combination of
highly saline and dilute fluids that show a transition from high-pressure lithostatic
conditions during porphyry emplacement to lower pressure hydrostatic conditions
during vein formation (Megaw, 2001). Such a transition may be indicative of a long-lived
shallow emplacement. ‘Pebble’ dykes logged in drill core are similar to breccia dykes
seen in major porphyry systems. These breccias are interpreted to record violent volatile
release events coincident with the transition from lithostatic to hydrostatic conditions
(Megaw, 1990; Frontier, 1999; Jones and Gonzalez-Partida, 2001).
Porphyry-related alteration styles include:
• Tourmaline-rich greisen along numerous structures cutting the biotite diorite in
LD20O1-30.
Northwest Copper Corp.
2021 Stardust Project Technical Report
50
• Potassic alteration consisting of secondary biotite selvages on mineralized
veinlets secondary euhedral and/or “shreddy” biotite affecting primary biotite and
hornblende and secondary K-feldspar flooding.
• Weak to pervasive sericitic alteration of intrusion
• Widespread chloritized and epidotized hornblende and feldspar
• Mineralization of the intrusions consists of crosscutting veinlets including:
• Quartz-K-feldspar-pyrite veinlets
• Quartz-K-spar-pyrite-chalcopyrite veinlets
• Quartz-K-spar-pyrite-molybdenite veinlets
• Hornblende replaced by specularite replaced by magnetite with interstitial
chalcopyrite.
• Open sigmoidal cavities
Comments on Section 8
The current mineral resource estimate is for the Canyon Creek Skarn Zone, regarded as
a skarn hosted carbonate replacement deposit and the exploration programs have been
planned on this basis.

Northwest Copper Corp.
2021 Stardust Project Technical Report
51
9.0 Exploration
Historic exploration work on the Property as outlined in Section 6 has been described in
previous Technical Reports (Simpson, 2010 & Simpson 2018).
Sun Metals has carried out three exploration programs between 2018 and the end of
2020.
Topographic Survey & Imagery
On June 23rd, 2018, McElhanney Consulting Services Ltd. (“McElhanney”) of Vancouver,
BC performed a Light Detection and Ranging survey (LiDAR) coupled with an aerial photo
acquisition over 88.3 km2 of the Stardust Property. LiDAR data was collected using the
Optech Galaxy scanner mounted in a twin-engine Piper Navaho.
Raw data was processed by McElhanney and included the extraction of 1-meter contours
and d igital elevation model (DEM) bare earth hill-shade images.
Geological Mapping and Prospecting
9.2.1 2018 Field Mapping and Prospecting
In 2018, a significant effort was made to compile, and field validate historic geology maps
and outcrop locations. An updated Property geology map is presented in Figure 7-3.
Because of limited exposure in many locations, relationships between various rock types
were often difficult to determine. In these areas, locations of outcrops were noted and
lithologies were checked against historic maps to check the validity. Special attention
was given to the identification of carbonate strata since it is necessary for Carbonate
Replacement Deposit (“CRD”) mineralization.
Geochemical Sampling
In 2018, 2804 soil samples were collected over eight separate grids (Figure 9-1). The soil
sample grids were designed to test potential targets previously identified by Aurora
Geoscience in 2012 and Sun Metals in 2017 based historic geochemical and geophysical
programs. Grids were orientated to be perpendicular to the strike of local stratigraphy
and sampling locations were specified prior to field collection. Sample and line spacing
were either 50 or 100 meters apart depending on the specific grid. Alternating lines
within a grid were offset by either 50 or 100 meters depending on the specific grid.
Sample locations were field located using a handheld GPS. Sampling targeted B and C
Horizon soils. Sample depth, soil horizon, and soil colour data were recorded for each
sample. Detailed soil sampling procedures are presented in Section 11.
Northwest Copper Corp.
2021 Stardust Project Technical Report
52
The 2804 soil samples taken in 2018 were integrated into a historic database of 6264
samples, making a total database of 9068 samples.
The 2018 soils sampling and prospecting program demonstrated that much of the
historical work is accurate and supports the idea that soil sampling is a good method for
direct targeting in this region. This was illustrated by the discovery of a new manto in
the GD zone that is seen in drill holes DDH18-SD-415 and DDH18-SD-417. Additionally,
the results reaffirm that the zone with most compelling surface geochemistry is south of
the glover intrusive complex where the different manto zones crop-out.

Northwest Copper Corp.
2021 Stardust Project Technical Report
53
Figure 9-1 2018 Geochemical Sampling Grids

Northwest Copper Corp.
2021 Stardust Project Technical Report
54
A total of 77 rock samples were collected during the 2018 exploration program. Location,
source, source size, and field descriptions including rock type and visible mineralization
were noted for each rock sample. Detailed rock sampling procedures are presented in
Section 11.
Geophysics
9.4.1 2018 Airborne Geophysics
From June 27th to July 17th, 2018, Geotech Ltd. (“Geotech”) of Aurora, Ontario carried
out a helicopter-borne geophysical survey. Principal geophysical sensors included a
versatile time domain electromagnetic (VTEM™plus) system and a horizontal magnetic
gradiometer with two caesium sensors. Ancillary equipment included a GPS navigation
system and a radar altimeter. A total of 1128 line-kilometres of geophysical data were
acquired during the survey.
Sun Metals tested 4 different VTEM anomalies with 5 diamond drill holes. All the
conductors were identified with the exception of one, Anomaly C.
Anomaly A was tested by DDH18-SD-412 which intersected 7.65m of massive sulphide
with pyrite – pyrrhotite ± chalcopyrite. This massive sulphide body is enough to explain
the VTEM anomaly observed, however, the Maxwell modelled plate and intersection are
approximately 30m off-set with the sulphide intersection being lower that anticipated.
No further testing is recommended.
Anomaly B was tested by two different holes, DDH18-SD-425 and DDH-SD-426. The EM
anomaly is not explained by anything seen in DDH18-SD-425. But, in DDH18-SD-426
the drill intersected a short interval of massive to semi-massive sulphide that could
explain the EM anomaly observed. No further testing is recommended in this area as
the host rock is not prospective, however, it encouraging to see base metal
mineralization in west on the Property. Future work should focus on identifying covered
carbonate stratigraphy (likely to the south) for future targeting.
Anomaly C (the strongest conductor identified in the 2018 VTEM survey) has not been
adequality explained by DDH18-SD-416 and DDH18-SD-418. This is significant because
this anomaly could represent the feeder zone to the 4b mantos zone. Further work is
needed to constrain the Maxell modelling and DDH-SD-416 & 418 should be re-logged
to try and identify a possible conductor that was missed. One possibility is, the feeder is
a shaped more like a chimney compared to the modeled plate shape and that is why the
drill missed. It is suggested to do a ground EM survey in this area during the 2019 survey
to help with further constraining a target.

Northwest Copper Corp.
2021 Stardust Project Technical Report
55
Anomaly F is coincident with the Hanging Wall Skarn Zone. The modelled Maxell plate
fits well with the skarn alteration and sulphides logged. No significant assays results
were received, and mineralization has been closed of in the area. No further work is
recommended.
9.4.2 2018 Borehole Geophysics
SJ Geophysics Ltd. (“SJ”) of Delta, BC completed a Volterra bore hole electromagnetic
and magnetic (“BHEM”) survey on diamond drill hole DDH18-SD-421 during September
27th to September 30th, 2018. in3D Geoscience Inc. (“in3D”) of Vancouver, BC completed
data post processing of the collected by SJ. Preliminary modelling suggests
mineralization intersected in DDH18-SD-421 dips to the west and shows greater
coupling to the south.
9.4.3 2019 EM Ground Survey
SJ Geophysics Ltd. (“SJ”) of Delta, BC completed Volterra fixed-loop surface
electromagnetic (“EM”) surveys during June 13th to September 3rd, 2019. The survey
consisted of 31 lines spaced 100 meters apart for a total of 71.85 line-kilometers
surveyed. in3D of Vancouver, BC completed post processing of data.
Results from the surface EM survey showed good correlation between anomalous EM
response and known zones of near surface mineralization. The survey was not effective
at identifying deeper mineralization.
9.4.4 Magnetotelluric Survey
SJ of Delta, BC completed a Volterra surface magnetotelluric (“MT”) survey from
September 5th to September 7th, 2019. The survey consisted of two near orthogonal 3
km lines. in3D of Vancouver, BC completed post processing of data.
The MT survey results did not correlate well with known zones of near surface
mineralization or mapped lithologies, nor did it identify significant geophysical
anomalies at depth.
9.4.5 2019 Borehole Geophysics
SJ of Delta, BC completed Volterra BHEM surveys on 17 diamond drill holes during June
21st to December 4th, 2019. in3D of Vancouver, BC completed post processing of data.
Results from the BHEM survey showed particularly good correlation between strongly
anomalous EM response and increased logged sulphide abundance in diamond drill
core. The surveys were also proven to be effective at detecting lateral sulphide
mineralization, proximal to surveyed drill holes.

Northwest Copper Corp.
2021 Stardust Project Technical Report
56
9.4.6 2020 Borehole Geophysics
SJ of Delta, BC completed Volterra BHEM surveys on 2 diamond drill holes during
September 24th to October 1st, 2020.
Comments on Section 9
Interpretation of the exploration data including drill core, airborne and ground
geophysics, borehole geophysics, geochemical sampling, and imagery is sufficiently
detailed to support additional exploration.

Northwest Copper Corp.
2021 Stardust Project Technical Report
57
10.0 Drilling
Historic drilling on the Property as outlined in Section 6 has been described and in
previous Technical Reports (Simpson, 2010 & Simpson 2017).
Sun Metals has completed 3 drilling programs between 2018 and the end of 2020. The
vast majority of this drilling has been located in the Canyon Creek Skarn zone (Zone 4).
Historic Drilling
Prior to 1991, drill records for the Property are missing or incomplete. Written accounts
indicate that at least 16 holes were completed between 1966 and 1980 by Takla Silver
Mines, Zapata Granby, and Noranda. Locations for these holes are uncertain or
approximate and they have not used in the Mineral Resource estimation.
Statistics for the drilling completed over the entire Property since 1991 are presented in
Table 10-1.
Table 10-1 Drilling Summary by Year (1991-2020)
Year Operator Drill
Holes Drilling
(m)
1991 Alpha Gold 11 988.20
1992 Alpha Gold 30 1,520.00
1997 Teck/Alpha 16 3,062.80
1998 Teck/Alpha 14 1,105.30
1999 Alpha Gold 18 3,050.00
2000 Alpha Gold 29 4,680.00
2001 Alpha Gold 18 5,609.00
2002 Alpha Gold 19 7,790.40
2003 Alpha Gold 42 7,908.00
2004 Alpha Gold 21 6,010.00
2005 Alpha Gold 17 5,152.90
2006 Alpha Gold 56 9,909.20
2007 Alpha Gold 34 8,898.00
2008 Alpha Gold 5 2,140.00
2009 Alpha Gold 17 6,366.92
2010 Alpha Gold 14 3,986.70
2017 Lorraine Copper 3 343.50
2018 Sun Metals 23 6,877.20
2019 Sun Metals 28 14,024.20
2020 Sun Metals 16 11,975.40

Northwest Copper Corp.
2021 Stardust Project Technical Report
58
Year Operator Drill
Holes Drilling
(m)
Total 431 11,975.40
2018 Drilling
The 2018 diamond drill program began on August 3rd and was completed on
September 27th. Drilling was conducted by Matrix Diamond Drilling of Kamloops,
BC using two Zinex A5 skid mounted drills. A total of 23 bore holes were drilled
from 15 sites, for a sum of 6877.2 meters. All core drilled was NQ diameter. Drill
site locations are shown in Table 10-2 and Figure 10-1.
A total of 1.1 kilometers of new road was constructed to connect new drill pads
to existing roads. Minor repairs of existing roads were also carried out. Road
construction and repair was carried out by Gleyzay Holdings ltd. using various
excavators and bulldozers.
Table 10-2 2018 Drill Hole Locations
Hole ID UTM East UTM North Elevation
(m) Azimuth
(0) Dip (0)
Length (m)
DDH18-SD-406 346728 6161707 1408 65 -50 208.2
DDH18-SD-407 346728 6161707 1408 65 -60 225.9
DDH18-SD-408 346759 6161720 1404 65 -50 154.5
DDH18-SD-409 346705 6161794 1382 61 -50 175.8
DDH18-SD-410 346705 6161794 1382 60 -65 186.2
DDH18-SD-411 346849 6161847 1361 79 -60 374.3
DDH18-SD-Abandoned 347353 6161755 1313 70 -50 39.62
DDH18-SD-412 347349 6161753 1307 70 -53 282.5
DDH18-SD-413 346854 6162159 1359 102 -64 432.2
DDH18-SD-414 347348 6161753 1306 80 -70 272.4
DDH18-SD-415 347532 6161650 1358 80 -50 297.8
DDH18-SD-416 346855 6162158 1359 102 -70 463.0
DDH18-SD-417 347634 6161529 1372 80 -50 114.9
DDH18-SD-418 346905 6161482 1463 70 -50 282.8
DDH18-SD-419 346905 6161482 1463 70 -70 337.4
DDH18-SD-420 345996 6162579 1588 90 -55 502.3
DDH18-SD-421 346766 6162123 1362 73 -68 717.5
DDH18-SD-422 346893 6162248 1391 76 -50 307.2
DDH18-SD-423 346891 6162239 1390 76 -65 347.8

Northwest Copper Corp.
2021 Stardust Project Technical Report
59
Hole ID UTM East UTM North Elevation
(m)
Azimuth
(0) Dip (0)
Length
(m)
DDH18-SD-424 346879 6162282 1397 76 -58 341.4
DDH18-SD-425 346185 6161881 1405 253 -50 244.1
DDH18-SD-426 346185 6161880 1405 231 -49 234.4
DDH18-SD-427 346878 6162282 1397 70 -66 335.0
Drilling targeted copper-gold-silver-zinc-lead mineralization at the Canyon Creek Skarn,
Glover Stock, and GD Zones as well as VTEM geophysical targets identified as Anomalies
A, B, and C.
Drilling results from the 2018 season show similar grade and width when compared to
historical drilling with the expectation of the DDH18-SD-421 which encountered a much
longer massive sulfide intercept than previous drilling. This intercept has been termed
the ‘421 Zone’.
Three different holes were drilled in the western part of the Property and encountered
thick sections of stratigraphy that is interpreted to be above the prospective carbonate
package. This suggests that the geology is plunging to the north and potential for
covered carbonate stratigraphy closer to surface in this corridor increases to the south.
A list of significant intercepts is shown in Table 10-3.

Northwest Copper Corp.
2021 Stardust Project Technical Report
60
Figure 10-1 2018 Drill Hole Locations

Northwest Copper Corp.
2021 Stardust Project Technical Report
61
Table 10-3 Significant Intercepts - 2018 Drill Program
Hole From To Interval Copper
(%) Gold (g/t)
Silver (g/t)
Zinc (%) Lead (%)
DDH18-SD-411 174.70 189.10 14.40 1.32 1.03 22.9 2.12 -
incl 178.20 183.90 5.70 1.57 1.38 33.1 5.20 -
DDH18-SD-411 226.75 228.90 2.15 3.81 0.75 498.4 23.31 3.71
DDH18-SD-412 42.75 50.40 7.65 0.03 1.31 62.3 0.78 0.45
DDH18-SD-413 232.50 238.00 5.50 1.72 0.93 29.1 0.01 -
DDH18-SD-413 245.00 246.00 1.00 0.02 2.52 11.1 0.09 0.07
DDH18-SD-414 63.30 63.90 0.60 0.05 0.59 382.8 21.22 3.60
DDH18-SD-415 34.60 34.90 0.30 0.01 4.23 3.2 0.04 -
DDH18-SD-415 44.60 46.80 2.20 0.28 5.25 16.4 3.79 0.21
DDH18-SD-415 55.90 60.50 4.60 0.09 4.17 34.5 1.60 0.09
DDH18-SD-416 281.70 282.70 1.00 1.70 1.25 27.2 0.01 -
DDH18-SD-417 35.70 39.00 3.30 0.01 0.21 3.9 1.35 0.04
DDH18-SD-417 50.50 57.80 7.30 0.04 0.48 7.7 7.42 0.06
DDH18-SD-418 218.80 220.20 1.40 0.03 0.88 9.5 4.60 0.02
DDH18-SD-418 224.90 225.60 0.70 0.09 0.08 6.7 25.67 -
DDH18-SD-418 233.10 234.80 1.70 0.05 4.37 15.4 4.39 0.12
DDH18-SD-418 242.80 243.20 0.40 0.03 0.11 7.6 11.79 0.01
DDH18-SD-418 249.10 252.20 3.10 0.10 5.05 55.3 5.23 0.18
DDH18-SD-421 433.80 435.00 1.20 1.07 0.16 17.4 0.01 -
DDH18-SD-421 506.60 507.30 0.70 1.29 1.45 22.3 0.02 -
DDH18-SD-421 517.00 617.00 100.00 2.51 3.03 52.5 0.41 -
incl 539.80 617.00 77.20 3.11 3.74 64.9 0.53 -
incl 539.80 576.30 36.50 3.89 4.47 84.6 1.06 -
incl 587.90 617.00 29.10 3.35 4.30 65.7 0.07 -
DDH18-SD-424 74.50 76.00 1.50 1.67 6.70 27.0 0.01 -
DDH18-SD-424 282.70 283.30 0.60 10.00 5.17 265.3 0.08 -
DDH18-SD-425 50.80 51.35 0.55 0.15 0.58 54.1 6.23 0.43
DDH18-SD-426 143.50 144.90 1.40 0.37 1.90 25.3 3.08 0.05
DDH18-SD-427 81.20 81.80 0.60 1.12 1.96 16.1 0.01 -
DDH18-SD-427 145.50 147.20 1.70 1.01 1.63 11.8 0.01 -
2019 Drilling
The 2019 diamond drill program began on May 23rd and was completed on December
15th. Drilling was conducted by Matrix Diamond Drilling of Kamloops, BC primarily using
two Zinex A5 skid mounted drills, with a third A5 drill mobilizing in November. Drilling
targeted copper-gold-silver-zinc mineralized skarn at the 421 Zone. A total of 28 bore
holes were drilled from 7 sites, for a sum of 14,024.2 meters. TECH Directional Services
of Sudbury, Ontario provided directional drilling and bore hole surveying services

Northwest Copper Corp.
2021 Stardust Project Technical Report
62
utilizing the DeviDrill Directional Core Barrel system. Use of the directional drilling system
allowed for deep targets to be hit with a high degree of precision. Core drilled was NQ
diameter except in sections drilled using the DeviDrill system where AQ diameter core is
recovered. Drill site locations are shown in Table 10-4 and Figure 10-2.
0.8 kilometers of new road was constructed to connect new drill pads to existing roads.
Minor repairs of existing roads were also carried out. Road construction and repair was
carried out by Gleyzay Holdings Ltd. of Takla Landing, BC using a Caterpillar 330
excavator.
Table 10-4 2019 Drill Hole Locations
Hole ID UTM East
UTM North
Elevation (m)
Azimuth (0)
Dip (0)
Cut-off Depth
(m)
Length EOH (m)
DDH19-SD-428D 346766 6162123 1362 76 -68 434.3 725.2
DDH19-SD-429M 346684 6162084 1368 80 -67.5 n/a 725.3
DDH19-SD-430D 346766 6162123 1362 76 -68 418.8 710.2
DDH19-SD-431M 346765 6162123 1362 76 -67 n/a 662.2
DDH19-SD-432D 346684 6162084 1368 80 -67.5 308.2 755.3
DDH19-SD-433D 346684 6162084 1368 80 -67.5 362.7 415.3
DDH19-SD-434D 346684 6162084 1368 80 -67.5 387.4 760.72
DDH19-SD-435D 346765 6162123 1362 76 -67 219.1 673.4
DDH19-SD-436D 346765 6162123 1362 76 -67 253.6 677.2
DDH19-SD-437M 346760 6162156 1368 75 -73 n/a 627.4
DDH19-SD-438D 346765 6162123 1362 76 -67 338.2 638.2
DDH19-SD-439D 346760 6162156 1368 75 -73 178.6 797.0
DDH19-SD-440M 346739 6162215 1380 80 -76 n/a 794.2
DDH19-SD-441M 346760 6162156 1368 80 -78 n/a 746.2
DDH19-SD-442D 346739 6162215 1380 80 -76 249.4 767.2
DDH19-SD-443D 346760 6162156 1368 80 -78 290.1 770.2
DDH19-SD-444D 346739 6162215 1380 80 -76 328.5 811.35
DDH19-SD-445D 346739 6162215 1380 80 -76 314.5 806.2
DDH19-SD-446M 346730 6162253 1386 73 -75 n/a 810.7
DDH19-SD-447D 346739 6162215 1380 80 -76 761.5 884.2
DDH19-SD-448M 346674 6162312 1405 76 -73.5 n/a 905.2
DDH19-SD-449D 346730 6162253 1386 73 -75 415.8 860.3
DDH19-SD-450D 346674 6162312 1405 76 -73.5 527.5 639.2
DDH19-SD-451D 346730 6162253 1368 73 -75 223.8 899.6
DDH19-SD-452D 346674 6162312 1405 76 -73.5 316.0 929.2
DDH19-SD-453M 346687 6162096 1368 94 -65 n/a 669.8
DDH19-SD-454D 346730 6162253 1368 73 -75 444.4 962.6
DDH19-SD-455D 346674 6162312 1405 76 -73.5 440.2 813.2

Northwest Copper Corp.
2021 Stardust Project Technical Report
63
Figure 10-2 2019 Drill Hole Locations
Drilling results from the 2019 season confirmed the presence of a large, mineralized
skarn system at depth in the 421 Zone. Seventeen diamond drill holes intersected
significant copper-gold-silver-zinc mineralization. These results expanded the zone in all
directions from mineralization previously intersecting in DHH18-SD-421.
Mineralization is hosted in skarn alteration within a pre mineral parasitic anticline fold
hinge of a broad anticline along the contact of overlying siliciclastic sedimentary rocks
and underlying carbonates. The trend of the fold hinge is interpreted to be plunging
down at 20° – 30° to the north-northwest. Intensity and thickness of skarn replacement
appears to be increasing to the north and down plunge, this implies the source of the
fluids in the system are to the north and/or below the 421 Zone. Additionally, the
decrease in thickness of mineralized intercepts on sections 6162275N and 6162325N
suggests an east – west trending fault(s) may down drop to the north offsetting
mineralization.

Northwest Copper Corp.
2021 Stardust Project Technical Report
64
DDH19-SD-453M is the most southerly test of the 421 Zone and intersected strong
copper-gold-silver mineralization. This indicates mineralization remains open in the
south as well as both up and down dip in this area.
Results from DDH19-SD-452D show that high grade copper-gold-silver mineralization is
present and open in this northerly part of the system.
A list of significant intercepts is shown in Table 10-5.
Table 10-5 Significant Intercepts - 2019 Drill Program
Hole From (m) To (m) Interval
(m) Copper
(%) Gold (g/t) Silver (g/t) Zinc (%)
DDH19-SD-428D 493.45 635.8 142.35 1.22 1.28 21.8 0.41
incl. 562.8 595.0 32.2 2.47 2.37 47.4 1.61
incl. 604.95 619.05 14.1 3.45 4.12 57.9 0.44
DDH19-SD-429M 564.0 654.05 90.05 1.08 1.4 21.6 0.22
incl. 586.5 593.0 6.5 4.61 7.05 60.2 1.68
incl. 649.45 654.05 4.6 2.96 5.31 131.8 1.65
DDH19-SD-430D 490.6 512.6 22.0 1.53 1.02 24.6 0.03
DDH19-SD-430D 546.0 653.0 107.0 1.64 1.77 28.6 0.03
incl. 572.2 630.3 58.1 2.49 2.61 44.3 0.04
DDH19-SD-432D 680.15 691.95 11.8 0.61 0.54 11.1 0.01
DDH19-SD-436D 502.6 548.15 45.55 1.44 1.18 27 0.04
incl. 542.3 548.15 5.85 5.13 3.78 91 0.18
DDH19-SD-436D 598.4 623.25 24.85 3.13 4.85 93.5 0.28
incl. 609.2 618.2 9.0 6.04 9.13 183.7 0.6
DDH19-SD-437M 537.6 624.0 86.4 1.65 1.56 28.8 0.28
incl. 585.7 607.0 21.3 3.13 2.14 51.4 1.08
DDH19-SD-438D 564.4 572.9 8.5 3.09 3.47 72 0.08
DDH19-SD-438D 594.0 597.05 3.05 1.08 1.26 21.8 0.02
DDH19-SD-439D 637.0 657.5 20.5 1.17 0.96 20.4 0.01
DDH19-SD-439D 714.5 724.45 9.95 0.78 0.7 97.1 0.28
DDH19-SD-440M 582.0 591.0 9.0 1.26 1.91 32.8 0.01
DDH19-SD-440M 708.9 724.8 15.9 2.38 2.68 66.6 0.1
DDH19-SD-441M 609.25 650.8 41.55 2.33 2.73 44.3 0.07
incl. 609.25 620.3 11.05 3.35 3.88 60.7 0.14
incl. 639.5 650.8 11.3 3.94 4.58 79.2 0.11
DDH19-SD-442D 669.75 720.7 50.95 0.64 0.67 10.6 0.01
incl. 669.75 693.2 23.45 0.92 0.92 14.4 0.01

Northwest Copper Corp.
2021 Stardust Project Technical Report
65
Hole From (m) To (m) Interval
(m) Copper
(%) Gold (g/t) Silver (g/t) Zinc (%)
DDH19-SD-443D 678.3 695.3 17.0 1.17 1.05 19.2 0.01
DDH19-SD-444D 735.0 738.2 3.2 1.65 1.3 29.4 0.01
DDH19-SD-444D 762.0 772.95 10.95 3.19 3.59 58.1 0.07
DDH19-SD-451D 807.0 810.7 3.7 1.64 1.36 25.8 0.01
DDH19-SD-452D 866.0 869.0 3.0 3.25 4.32 70.1 0.05
DDH19-SD-453M 540.7 567.0 26.3 1.45 1.48 22.2 0.01
incl. 553.8 557.4 3.6 3.98 3.45 66.6 0.02
DDH19-SD-453M 594.0 601.2 7.2 2.1 1.41 33.4 0.01
2020 Drilling
The 2020 diamond drill program began on June 26th and was completed on September
21st. Drilling was conducted by Matrix Diamond Drilling of Kamloops, BC using three
Zinex A5 skid mounted drills. Drilling targeted copper-gold-silver-zinc mineralized skarn
at the Canyon Creek, East, and 421 Zones. A total of 17 bore holes were drilled from 10
sites, for a sum of 11,975.4 meters. TECH Directional Services of Sudbury, Ontario
provided directional drilling and bore hole surveying services utilizing the DeviDrill
Directional Core Barrel system. Core drilled was NQ diameter except in sections drilled
using the DeviDrill system where AQ diameter core is recovered. Drill site locations are
shown in Table 10-6 and Figure 10-3. A list of significant intercepts is presented in Table
10-7
0.1 kilometers of new road was constructed to connect new drill pads to existing roads.
Minor repairs of existing roads were also carried out. Road construction and repair was
carried out by Gleyzay Holdings Ltd. of Takla Landing, BC using a Caterpillar 330
excavator.
Table 10-6 2020 Drill Hole Locations
Hole ID UTM East
UTM North
Elevation (m)
Azimuth (0)
Dip (0) Cut-off
Depth (m) Length
EOH (m)
DDH19-SD-455D 346676 6162311 1405 76 -73.5 440.2 1089.2
DDH20-SD-456M 346646 6162071 1366 82.5 -64 n/a 692.3
DDH20-SD-457M 346688 6162097 1365 81 -66 n/a 664.4
DDH20-SD-458M 346661 6162117 1370 80 -73.5 n/a 1037.6
DDH20-SD-459D 346646 6162071 1366 82.5 -64 289.4 741.0
DDH20-SD-460D 346688 6162097 1365 81 -66 324.0 710.0
DDH20-SD-461M 346646 6162071 1366 91 -59 n/a 647.0

Northwest Copper Corp.
2021 Stardust Project Technical Report
66
Hole ID UTM East
UTM North
Elevation (m)
Azimuth (0)
Dip (0) Cut-off
Depth (m) Length
EOH (m)
DDH20-SD-462 346941 6162267 1404 60 -66 n/a 803.5
DDH20-SD-463 346587 6161806 1383 60 -66 n/a 893.3
DDH20-SD-464D 346646 6162071 1366 81 -64 194.0 707.0
DDH20-SD-465 347051 6162299 1430 60 -63 n/a 855.5
DDH20-SD-466 346826 6161916 1360 52 -60 n/a 496.6
DDH20-SD-467 346559 6161841 1381 53 -61 n/a 815.3
DDH20-SD-468 346587 6161805 1383 76 -61 n/a 832.8
DDH20-SD-469 347051 6162299 1430 85 -69 n/a 992.5
DDH20-SD-470 346752 6162148 1365 64 -61 n/a 806.2
DDH20-SD-471 346587 6161805 1383 58 -61 n/a 812.0

Northwest Copper Corp.
2021 Stardust Project Technical Report
67
Figure 10-3 2020 Drill Hole Locations
Table 10-7 Significant Intercepts - 2020 Drill Program
Hole ID From (m)
To (m) Interval
(m) Copper (%) Gold (g/t) Silver (g/t) Zinc (%)
DDH19-SD-455D 903.8 905.8 2.0 1.05 1.26 26.5 0.02
DDH20-SD-456M 635.3 654.9 19.6 0.59 0.55 13.3 0.02
incl. 635.3 638.2 2.9 2.15 1.78 49.2 0.04
DDH20-SD-457M 505.7 549.7 44.0 1.57 1.08 28.2 0.01
incl. 535.8 549.7 13.9 3.05 2.12 53.6 0.01
DDH20-SD-459D 675.0 679.8 4.8 0.92 0.81 16.2 0.01
DDH20-SD-460D 588.0 628.4 40.4 1.74 1.41 26.6 0.01
incl. 588.0 604.0 16.0 3.12 2.55 48.2 0.01
DDH20-SD-461M 493.4 498.45 5.05 0.90 0.74 11.3 0.02

Northwest Copper Corp.
2021 Stardust Project Technical Report
68
Hole ID From (m)
To (m) Interval
(m) Copper (%) Gold (g/t) Silver (g/t) Zinc (%)
DDH20-SD-463 823.8 833.4 9.6 0.58 0.36 11.0 0.01
DDH20-SD-464D 499.0 506.3 7.3 1.18 1.07 14.4 0.02
DDH20-SD-464D 614.25 618.7 4.45 5.58 5.99 190.5 0.12
DDH20-SD-466 373.35 390.8 17.45 1.37 1.70 39.7 0.03
incl. 384.35 389.85 5.5 3.02 3.83 87.2 0.07
DDH20-SD-467 775.85 779.2 3.35 0.78 0.85 20.3 0.03
DDH20-SD-468 614.0 635.0 21.0 0.45 0.28 4.9 0.01
DDH20-SD-468 657.1 658.85 1.75 1.28 0.60 13.5 0.01
DDH20-SD-469 236.75 247.2 10.45 0.53 0.44 40.2 0.02
incl. 238.65 244.05 5.4 0.88 0.58 66.0 0.03
The 2020 drilling combined with Sun Metals previous drilling in 2017-2019, as well as
historic drilling on the Property was used to re-interpret the geological model and
mineralized domains. The structural framework that controls mineralization is currently
interpreted to be a series of parasitic folds and thrust faults formed where faults and
associated fault propagation folds create the architecture and plumbing system for the
skarn alteration, fluid flow, and base metal mineral deposition. Zone thickening is seen
at the intersection lineation between the faults and certain stratigraphic horizons.
Dilatational offset within the structures creates northerly plunging ore chutes within the
larger mineralized structure. The most prospective stratigraphic horizon for hosting the
high-grade zones is the carbonate unit that is deposited stratigraphically below the
clastic sediment unit and above the limestone clast tuff unit.
Core Recovery
Core recovery for the Sun Metals drill programs was good to excellent with an overall
average of 95% and a median value 98%. Areas of poor or no recovery normally occurred
in fault zones and small karst cavities.
Drill Hole Location Surveys
During the Sun Metals drill programs, drill hole collars were surveyed using a Real-
Time Kinematic and Differential GPS system. Elevations were derived from the LiDAR
survey data described in Section 9.1.

Northwest Copper Corp.
2021 Stardust Project Technical Report
69
Downhole Surveys
During the Sun Metals drill programs, downhole surveys were generally taken at
intervals between 10 and 30 m, although a number of holes used 3 m intervals. The
average spacing was 20 m.
Downhole survey instruments used were a Reflex EZ-GYRO and an Axis C-Gyro. The C-
Gyro was used for directional drilling by TECH Directional Services.
Sample Length/True Thickness
Due to the steeply dipping orientation of the mineralized zones and the limitations of
surface drilling, none of the drill intercepts approximate the true thickness. True
thickness must be calculated for each intercept based on the angle of the drill hole to
the specified zone.
Comments on Section 10
Drilling methods and drill hole design are suitable for construction of a Mineral Resource
model for the Canyon Creek Skarn Zone.
Fault zones and small karst cavities have been intersected during the drill programs
resulting in loss of recovery, but nothing that could materially impact the accuracy and
reliability of the results.
True thickness must be calculated for each intercept based on the angle of the drill hole
to the specified zone.

Northwest Copper Corp.
2021 Stardust Project Technical Report
70
11.0 Sample Preparation, Analyses, and Security
Sampling Methods
11.1.1 Soil Samples
Soil samples were collected with a tree planting shovel or soil auger and placed in a kraft
paper bag labelled with a sample number and containing the corresponding pre-
numbered analytical tag provided by BV. In instances where field duplicate samples were
taken, the sample was divided by hand and placed in a separate kraft bag with unique
sample number for analysis. Kraft bags were folded shut and placed in a carboard box
for shipping. Sampling targeted B and C Horizon soils. Sample locations were recorded
using a handheld GPS and field marked with flagging tape labelled with the sample
number.
11.1.2 Rock Samples
Rock samples were collected by taking selected pieces of rock from outcrop, subcrop,
and float using a rock hammer. All samples were placed in a poly bag labelled with the
sample number and containing the corresponding pre-numbered analytical tag provided
by Bureau Veritas. Poly bags were sealed using a nylon cable tie and placed in rice bags
for shipping. Sample locations were recorded using a handheld GPS, and field marked
with flagging tape and an aluminum tag labelled with the sample number.
11.1.3 Drill Core
Drill core sample intervals were laid out and recorded by the logging geologist on site
based on lithology and mineralization noted. Sample locations and associated sample
numbers were marked on the core using a red lumber crayon. Pre-numbered three-part
analytical tags provided by BV were stapled into the core boxes at the end of each
sample.
Drill core was cut using an electric powered rock saw. Samples were cut in half
lengthwise. One half was returned to its original location in the core box. The other half
was placed in a poly sample bag pre-labelled with the sample number. Two sections of
the analytical tag were placed in the pre-labelled polyethylene (poly) bag with the
corresponding sample number. One section of the analytical tag remained stapled to the
core box. In instances where field duplicate samples were taken, the sampled half core
was re-sawn lengthwise to produce two quarter core samples. Each quarter core sample
was placed in a separate poly bag with unique sample number for analysis. Poly sample

Northwest Copper Corp.
2021 Stardust Project Technical Report
71
bags were sealed using a stapler and placed in rice bags for shipping. Rice bags were
sealed using numbered locking security ties.
Density Determinations
Specific gravity measurements were taken on 9,159 core samples from the 2018, 2019
and 2020 drill programs using the water immersion method. The measurements were
carried out by Sun Metals geotechnical personnel on-site using a digital scale (Figure
12-5).
Analytical and Test Laboratories
All core and geochemical samples from 2017 were analyzed at Bureau Veritas Minerals
Laboratory in Vancouver (“BV”), an ISO:9001 Certified lab. BV is independent of the
Company and Sun Metals.
Sample Preparation and Analysis
Analytical methods used by BV are presented in Table 11-1.
Table 11-1 Analytical Methods - BV
Procedure Lab Code Description
Soil Preparation SS80 Dry at 60°C
Sieve to -180 μm (80 mesh)
Soil Analysis AQ200 0.5 gram sample
Aqua regia digestion
ICP-MS analysis
Drill Core/Rock Preparation
PRP70-250 Crush to ≥70% passing 2mm
Pulverize 250 g to ≥85% passing 75 μm (200 mesh)
Drill Core/Rock Analysis MA270 0.5 gram sample
4 Acid digestion
ICP-ES/ICP-MS analysis
Gold Fire Assay FA330 30 gram sample
Fire assay fusion
ICP-ES analysis
Overlimit Gold/Silver FA530 Automatic for any samples >10 ppm Au or >100 ppm Ag
30 gram sample
Fire assay fusion
Gravimetric finish
Overlimit Copper GC820 Automatic for any samples >10,000 ppm Cu
Northwest Copper Corp.
2021 Stardust Project Technical Report
72
Procedure Lab Code Description
Copper Assay by Classical Titration
Overlimit Zinc GC816 Automatic for any samples >10,000 ppm Zn
Zinc Assay by Classical Titration
Overlimit Lead GC817 Automatic for any samples >10,000 ppm Pb
Lead Assay by Classical Titration
Soil samples were dried at 60°C and sieved to 180 microns (80 mesh). Each sample was
analyzed for 36 elements using modified aqua regia digestion (1:1:1 HNO3:HCl:H2O) and
ICP-MS finish.
Rock and drill core samples were crushed to ≥70% passing 2 millimeters and pulverized
to ≥85% passing 75 microns (200 mesh). Each sample was analyzed for 41 elements
using multi acid digestion with ICP-ES and ICP-MS finish. Fire assay fusion decomposition
with ICP-ES analysis was also completed on each sample to determine gold-platinum-
palladium content. Samples containing gold, silver, copper, zinc, or lead above the
detection limit of these techniques were automatically reanalyzed. Samples containing
>10 ppm gold or >100 ppm silver were reanalyzed by fire assay fusion with a gravimetric
finish. Samples containing >10,000 ppm copper, zinc, or lead were reanalyzed by
titration.
Quality Assurance and Quality Control
11.5.1 Drill Core QAQC
Diamond drill core samples had standard and blank reference material inserted into the
sampling series at regular intervals. The certified ranges for the blank and standards
used are summarized in Table 11-2.
Field duplicates were also taken at regular intervals. In sections of high-grade
mineralization, the frequency of insertion of reference material and field duplicates was
increased. Additional reference material samples and field duplicates were also added at
the discretion of the logging geologist on site. The results indicated no significant
problems with the laboratory analysis. A review of BV’s QAQC data – duplicate analysis,
standards, blanks, and prep washes also indicate no significant problem with the
laboratory analysis.

Northwest Copper Corp.
2021 Stardust Project Technical Report
73
Table 11-2 Certified Reference Materials
Standard Au Ag Cu Pb Zn
CDN-ME-1312 1.27 22.3 0.446 0.273 1.81
CDN-ME-1410 0.542 69 3.8 0.248 3.682
CDN-ME-1708 6.96 53.9 2 0.171 0.484
CDN-BL-10 <0.01
Correlation between field duplicate core samples is generally strong (Figure 11-1 to
Figure 11-3). Increased variability is noted in returned gold and silver analytic results <1
ppm. Minor variability is noted in copper results throughout the range of returned
results. These inconsistencies are interpreted to be due to the irregular nature of
mineralization in skarn and CRD systems and local relative coarseness of commodity
bearing minerals in these systems.
Figure 11-1 Log Scatterplot of Field Duplicates for Au

Northwest Copper Corp.
2021 Stardust Project Technical Report
74
Figure 11-2 Log Scatterplot of Field Duplicates for Ag
Figure 11-3 Log Scatterplot of Field Duplicates for Cu

Northwest Copper Corp.
2021 Stardust Project Technical Report
75
11.5.2 Soil Sample QAQC
Soil samples had blank reference material inserted into the sample sequence
approximately every 20 samples. Field duplicates were taken approximately every 35
samples. The results indicated no problems with the laboratory analysis. A review of
BV’s QAQC data – duplicate analysis, standards, blanks, and prep washes also indicate
no significant problem with the laboratory analysis.
11.5.3 Rock Sample QAQC
All rock samples passed BV’s internal reference material and duplicate QAQC protocols.
Results from duplicate analysis, standards, blanks, and prep washes indicate no
significant problem with the laboratory analysis.
Sample Security
Drill core was brought from the drill to the core logging facility by either the drillers or
the project geologist. On site the core was kept in and around the core logging tent,
where it was logged by the geologist and sample intervals laid out.
Rock and drill core samples were placed in labelled rice bags and sealed using numbered
locking security ties for shipping. Rice bags were labelled with a unique identification
number and list of samples contained within. Soil samples were placed in cardboard
boxes labelled with a unique identification number and list of samples contained within
and sealed with packing tape for shipping. Each batch of samples shipped to BV was
given a unique shipment identification.
Samples were delivered by Sun Metals personnel to Bandstra Transportation Systems
Ltd. (“Bandstra”) in Prince George, BC. Bandstra personnel complete a certified bill of
landing for each sample shipment and maintain a complete chain of custody of samples
until delivered to BV.
At all times samples were under the control of Sun Metals personnel until delivered to
BV. BV catalogues all received samples and maintains a complete chain of custody of
each sample through the analytical process.
For soil samples, sample depth, soil horizon and soil colour and relevant notes were
recorded for each sample. Samples were placed in Kraft bags labelled with the grid
location, were dried in the Tsayta Lake Lodge core shack and were put in ~12x11” size
cardboard boxes and shipped to BV via courier.

Northwest Copper Corp.
2021 Stardust Project Technical Report
76
Rock samples were placed in poly-bags and taken back to camp, where hand specimens
were separated from the original sample. Sampler, location, field description, source and
source size, sample type, rock type, mineralisation and alteration were recorded for each
sample. Samples were batched in rice bags and sent via courier to BV for assay.
Databases
Data is collected and stored using a Geospark database. The project manager is
responsible for maintenance of the database. Raw datafiles in CSV format provided by
the lab are imported directly into the database using a built-in customizable import
template. The project manager checks for any QA/QC discrepancies through a reporting
function in the database upon import.
Comments on Section 11
GeoSim is of the opinion that the adequacy of sample preparation, security and analytical
procedures are sufficiently reliable to support the mineral resource estimation and that
sample preparation, analysis, and security are generally performed in accordance with
exploration best practices at the time of collection.

Northwest Copper Corp.
2021 Stardust Project Technical Report
77
12.0 Data Verification
Site Visit Verification
The author has visited the Stardust Project site on three occasions with the most recent
visit being conducted on September 23, 2020. Previous visits were carried out on June
14, 2010, and September 17, 2017.
During the sites visits, the author visually identified copper-bearing sulphide
mineralization in drill core and outcrop. A number of drill sites were checked by GPS and
found to be accurate.
12.1.1 Drill Hole Location
Drill holes are surveyed by and RKA DGPS system. The author checked several drill sites
by hand-held GPS and they were found to be accurate. Drill sites have been reclaimed
and the drill hole position marked with stakes (Figure 12-1).

Northwest Copper Corp.
2021 Stardust Project Technical Report
78
Figure 12-1 Drill hole collar and marker - site reclamation in progress (Sept 23, 2020)
12.1.2 Drill Core Logging
A permanent core logging facility is on site. It was found to be clean and well maintained.
Inclined benches were used to display core for mark-up and logging (Figure 12-2 to
Figure 12-3). A dedicated digital camera mount attached to a computer was used for
core photography (Figure 12-4).
Specific gravity measurements were taken on drill core using the water immersion
method (Figure 12-5).

Northwest Copper Corp.
2021 Stardust Project Technical Report
79
Figure 12-2 Core Logging Facility (Sept 23, 2020)
Figure 12-3 Core Markup for splitting (Sept 23, 2020)

Northwest Copper Corp.
2021 Stardust Project Technical Report
80
Figure 12-4 Core Photography Station (Sept 23, 2020)
Figure 12-5 SG Measurement Station - Water Immersion Method (Sept 23, 2020)

Northwest Copper Corp.
2021 Stardust Project Technical Report
81
12.1.3 Validation of Sampling and Core Storage Facilities
The core storage facility is located beside the core shack. Core boxes are marked with
metal tags and stacked on pallets (Figure 12-6).
A separate room attached to the core shack is used for sawing and bagging core samples
and insertion of certified reference standards and blanks (Figure 12-7).
Figure 12-6 Core Storage Area (Sept 23, 2020)

Northwest Copper Corp.
2021 Stardust Project Technical Report
82
Figure 12-7 Core Sawing Room (Sept 23, 2020)
12.1.4 Independent Sampling
During the author’s site visit on June 14, 2010, several core samples were collected and
submitted for analysis. Results of the sample from hole LD200913 were consistent with
the initial values obtained from the assay interval of 2.82 g/t Au 62.1 g/t Ag and 3.13%
Cu (Table 12-1). The limonitic material from near the top of hole LD200513 was not
previously sampled.
Table 12-1 Independent sample results
Hole Depth
(m) Au g/t Ag g/t Cu % Description
LD200913 159 4.488 95 4.733
LD200513 31-32 0.054 3 0.050 Leached limonitic zone
Outcrop 1.302 44 2.311 Roadcut in N CCS Area
The author has also visually identified mineralization in drill core consistent with reported
analytical results on more recent site visits and does not consider further independent
sampling necessary.

Northwest Copper Corp.
2021 Stardust Project Technical Report
83
Database Validation
The author independently audited the sample database for location accuracy, down hole
survey errors, interval errors and missing sample intervals. The author also reviewed the
sample QA/QC results.
Comments on Section 12
Based on the site visit observations, the QP concludes that drilling, logging, and sampling
of drill core during the drilling and exploration programs carried out by Northwest
Copper and previous operators have been conducted in a manner appropriate to the
style of mineralization present on the Property.
The author is of the opinion that the analytical and database quality are adequate for the
purposes of the estimation of Mineral Resources and the Classification of mineral
resources.

Northwest Copper Corp.
2021 Stardust Project Technical Report
84
13.0 Mineral Processing and Metallurgical Testing
In 2021, Base Metallurgical Laboratories of Kamloops, B.C. (“BML”) completed a brief
scoping level metallurgical study using material collected from the Stardust Project (Lang
& Angove, 2021). Samples were received in two shipments; an initial shipment of split
drill core material was received January 27, 2020, with a second shipment received
August 7, 2020. Testing commenced following the second shipment.
The feed assay summary for each composite tested is summarized in the following table:
Table 13-1 Feed assay summary
Composites were prepared by combining the received intervals according to a provided
recipe composting plan that would create composites identified as LG, MG and NHG
Composite. Once combined, each composite was stage crushed to minus 3.35mm before
blending and splitting into 2kg test charges. Duplicate head samples were removed from
replicate head charges for feed assay determination.
Head Assaying
Feed chemical analysis was completed in duplicate for each composite. Analysis included
fire assay for Au. Cu, Fe and Ag were determined by aqua-regia digestion with an AA
finish, S was determined by Leco and a multi-element ICP scan was also conducted. A
summary of analysis by composite and method is provided in Table 13-2. The Au test
average for the NHG Comp was 4.23 g/t gold.

Northwest Copper Corp.
2021 Stardust Project Technical Report
85
Table 13-2 Chemical Analysis Summary
Metallurgical Testing
A scoping level metallurgical study was undertaken to evaluate the flotation response of
three composites prepared to represent a gradient of feed grades. Testing optimized
conditions using the NHG Composite; a series of 3 rougher kinetic flotation tests
evaluated the sensitivity of primary grind before optimizing the cleaner circuit with a
further 5 tests. A single cleaner test was performed for each of the LG and MG composites
applying established conditions used for the NHG Composite.
The final flowsheet used for testing included gravity concentration of gold by Centrifugal
Gold Concentration (CGC) using a laboratory Knelson, followed by cleaning using a
Mozley Table at 150μm. The combined Knelson and Mozley tails were advanced to 10
minutes of rougher flotation, the rougher concentrate was reground to a target K80 of
40 to 50μm and cleaned, requiring 2 to 3 stages of dilution cleaning.
13.2.1 Gravity Performance
Based on early information on gold occurrences within the orebody and core samples,
initial tests did not utilized gravity. However, as testing progressed gravity evaluation
was completed using the industry accepted combined technology of Knelson-Mozley
gravity separation, targeting a low weight gravity concentrate. Gravity feed was prepared
by grinding individual composite samples in a laboratory rod mill generally as 2-kg test
charges to a target size K80 of 150μm. Ground samples were pumped at a rate of 30 to
40 kg/h through a laboratory size Knelson MD-3 concentrator, while applying 3.5 L/min
of fluidizing wash water. The Knelson was stopped, the concentrate removed and cleaned
on the Mozley C-800 Table targeting a final gravity mass recovery of 0.06 to 0.07 wt.%.

Northwest Copper Corp.
2021 Stardust Project Technical Report
86
The final concentrate was assayed by fire assay to extinction; gravity tailings were
combined and advanced to further testing. Gravity gold recovery ranged by composite,
the MG and NHG composites each recovered 24% gold and the LG Comp recovered 42%
gold to a Mozley Concentrate which assayed between 560 to just under 3,000 g/t gold.
13.2.2 Flotation Optimization
Limited optimization testing was included within the study, however suitable results were
achieved using favored conditions. Testing evaluated effect of primary grind, effect of
regrind prior to cleaning and incremental gold recovery by including gravity.
Testing utilized a 2kg sample for each test which was ground in a laboratory mild steel
rod mill with stainless steel rods. Samples were ground at a density of 65% solids before
discharging to a standard laboratory flotation cell. The ground pulp was conditioned in
a Denver D12 cell (~4.5L) and adjusted to approximately 35% solids. Rougher flotation
was completed using the Denver D12 with rougher concentrates collected at kinetic
increments, filtered, and dried prior to assay. Cleaner tests were reground in a laboratory
regrind mild steel rod mill with stainless rods. The discharged pulp was repulped in a
2.5L Denver flotation cell prior to cleaning. Cleaning tests utilized 3 stages of cleaning
and a 1st cleaner scavenger. Each product was assayed for Cu, Au, Ag and S.
The sensitivity to primary grind size evaluated three grind sizes using the NHG Comp,
testing nominal K80 sizes of 75, 100 and 150μm. Copper demonstrated little effect for
the grind sizes tested, however gold was more sensitive trending with improvement at
finer grind sizes with close to 90% recovery at 75μm compared to 60 to 70% at the 150
and 100μm grinds, respectively.
As testing advanced to cleaning tests the 75 μm primary grind size was selected.
A series of five batch cleaner tests were completed using the NHG Composite. Testing
evaluated effect of regrind size with three tests, a final two tests evaluated cleaner
performance at coarser grinds with and without gravity. Key observations were:
• Improved final copper concentrate grade with finer regrind sizes suggesting a
regrind in the 35 μm size is helpful and required. A finer regrind may also assist
in reducing cleaning stage requirements.
• Gold stage recovery greatly improved as regrind size is reduced.
The effect of operating with a gravity circuit on combined gravity and flotation gold
recovery during batch cleaning was evaluated. Two tests were carried out to compare
the impact of operating with a coarser primary grind K80 of 150μm, regrinding to

Northwest Copper Corp.
2021 Stardust Project Technical Report
87
nominal 40 μm and the incremental benefit to combined gold recovery with (C-08) and
without (C-07) upfront gravity.
Results indicated that by including upfront gravity for gold recovery, the net effect allows
the primary grind to be coarsened from a K80 of 75 to 150μm (C6 vs. C8) with minimal
impact on net gold recovery (93 and 92%, respectively for C6 and C8) when holding Cu
concentrate grade at about 26% copper. Comparatively, operating at 150μm without
gravity, gold recovery drops to 64% at 26% Cu grade.
A single test was devoted to benchmarking the LG and MG Composites. These results
are compared to C8 for the NHG Comp, all tests included gravity and were completed at
a primary grind K80 of 150μm with a target 40μm K80 regrind. A summary of results is
provided by Table 13-3.
Table 13-3 Benchmark Grade Composites
A general improvement in performance is gained with increased head grades for copper
and gold; however, this diminishes for the LG and MG composites. Gold recovery is
Northwest Copper Corp.
2021 Stardust Project Technical Report
88
constant across all ranges of feed grades tested, with a common tailings grade of 0.07
g/t gold for the LG and MG composites but elevated to 0.22 g/t gold in the NHG
Composite suggesting the tailing grade may fluctuate by gold feed grade.
Conclusion & Recommendations
The final proposed flowsheet is based on the NHG Comp and includes an initial
centrifugal gravity separation stage, for enhanced gold recovery, followed by
conventional flotation. Adequate copper and gold rougher recovery at a primary grind
size of 150 μm followed by regrinding to 50 μm and three stages of cleaning were used
during testing (two stages of cleaning likely sufficient) producing a marketable copper
concentrate with combined gravity and flotation recoveries of over 98% copper and 90%
gold (average for all composites tested was 90% gold and 94% copper).
Gravity recovery of gold ranged from 24 to 42% and copper flotation recovery of 92 to
98%, for the samples tested under open circuit conditions.
Copper has little sensitivity to the grind sizes tested of 75 to 150μm; however, gold is
impacted with coarser grinds. By including upfront gravity for gold recovery, the primary
grind size can be increased with minimal to no impact on net gold recovery and should
be considered for future studies.
The effect of feed grades for Cu and Au has a small influence on performance.
Future studies should consider inclusion of comminution testing, locked cycle tests on
main rock types, variability testing and detailed concentrate analysis to identify any
potential deleterious elements that might impact marketability of the final concentrates.
It is also recommended that a wider range of feed grades and ore types should also be
considered to better define parameters which may impact processability.
Comments on Section 13
The testwork conducted is suitable for preliminary process flowsheet selection and
samples are representative of the mineralized material and suitable for generating
recovery estimates for the mineral resource estimate.

Northwest Copper Corp.
2021 Stardust Project Technical Report
89
14.0 Mineral Resource Estimates
This mineral resource estimate is an update to that previously prepared for the Property
for Sun Metals in 2017. The mineral resource estimate was prepared by Ronald G.
Simpson P. Geo, a Qualified Person of GeoSim.
Key Assumptions and Basis of Estimate
The database for the Canyon Creek Skarn Zone contains 206 drill holes representing
74,253 m of drilling. Fifty-eight of these holes (38,329 m) have been completed between
2018 and 2020 by Sun Metals. Grade estimation is based on 186 drill holes and 3,124
composites of nominal 2.0 m lengths.
Mineral resources were estimated for gold, silver, and copper. Significant grades of Zinc
have been encountered but the distribution is highly irregular and would not likely justify
the additional cost of extraction.
Geological Models
The mineralized skarn zones were initially modeled in Leapfrog Geo software by
Company geologists. Final clipping of the zones was carried out using Surpac Vision
software to define the extents of the individual zones that displayed reasonable
prospects for economic extraction.
Out of the initial 11 zones and 5 sub-zones (splays), 6 were selected that contained
sufficient sampling information and grades to qualify as potential mineral resources.
These zones were assigned their initial integer codes with a ‘’10’’ prefix, so they are not
consecutive (Figure 14-1). These mineral zones collectively extend approximately 1200
m along strike and have been intersected from surface down to 900 m in depth.
Note: In the press release dated May 17, 2021, Zone 102 is referred to as “Zone 2”. The
codes have been modified to avoid confusion with historic mineral zone names on the
Property.

Northwest Copper Corp.
2021 Stardust Project Technical Report
90
Figure 14-1 Mineral Zone Wireframes – Plan View
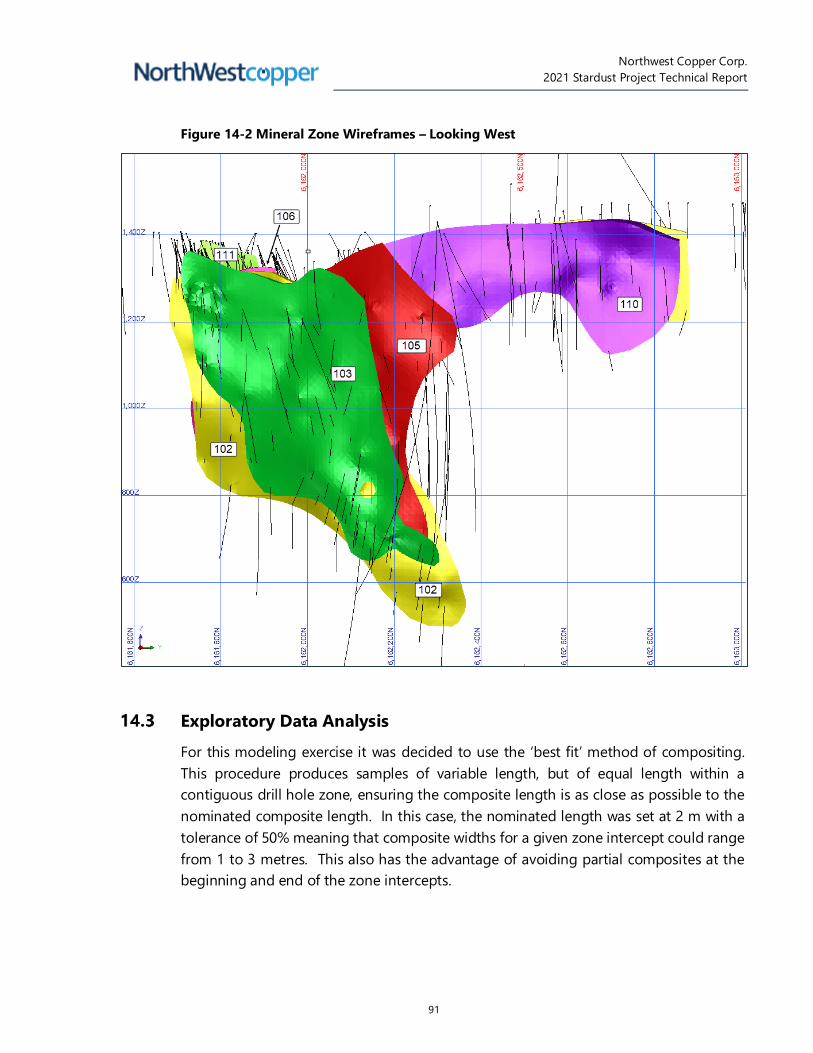
Northwest Copper Corp.
2021 Stardust Project Technical Report
91
Figure 14-2 Mineral Zone Wireframes – Looking West
Exploratory Data Analysis
For this modeling exercise it was decided to use the ‘best fit’ method of compositing.
This procedure produces samples of variable length, but of equal length within a
contiguous drill hole zone, ensuring the composite length is as close as possible to the
nominated composite length. In this case, the nominated length was set at 2 m with a
tolerance of 50% meaning that composite widths for a given zone intercept could range
from 1 to 3 metres. This also has the advantage of avoiding partial composites at the
beginning and end of the zone intercepts.

Northwest Copper Corp.
2021 Stardust Project Technical Report
92
The composite intervals were extracted by determining the drill hole intercepts within
the wireframe models of each zone. If part of the interval was not sampled, then the
values were assumed to be ‘0’ and the composite grade was diluted. Statistics of the
composites within the zone models are presented in Table 14-1.
Table 14-1 Composite Statistics
Au g/t Ag g/t Cu %
n 3124 3124 3124
Min 0.000 0.0 0.000
Max 20.681 542.8 10.733
Mean 0.596 10.9 0.499
Median 0.149 2.6 0.136
Std Dev 1.320 25.0 0.983
COV 2.213 2.3 1.969
Grade Capping and Outlier Restriction
Grade distribution in the composited sample data was examined to determine if grade
capping or special treatment of high outliers was warranted. A decile analyses was
performed on the composites within the zone constraints and log probability plots
examined (Figure 14-3 to Figure 14-5).
Since Zone 102 contained just over half of the total composites and more consistent high
grades, it was analyzed separately. The other 5 zones were analyzed collectively. Cap
grades are summarized in Table 14-2 and statistics of capped composites in Table 14-3.

Northwest Copper Corp.
2021 Stardust Project Technical Report
93
Figure 14-3 CPP Charts and Capping Thresholds - Au
Figure 14-4 CPP Charts and Capping Thresholds - Ag

Northwest Copper Corp.
2021 Stardust Project Technical Report
94
Figure 14-5 CPP Charts and Capping Thresholds - Cu
Table 14-2 Grade Caps
Zone 102
Zones 103-111
Cap Au g/t 10 6
Cap Ag g/t 150 140
Cap Cu % 7.5 5
Table 14-3 Capped Composite Statistics
Au g/t Ag g/t Cu %
n 3124 3124 3124
Min 0.000 0.0 0.000
Max 13.641 150.0 7.500
Mean 0.586 10.7 0.496
Median 0.149 2.6 0.136
Std Dev 1.222 22.3 0.954
COV 2.087 2.1 1.925
Density Assignment
The drilling database includes 9,325 specific gravity measurements from drill core
collected between 1997 and 2020. The vast bulk of this data (98%) was collected
between 2018 and 2020 from the 421 zone which is part of Zone 102. In order to
evaluate a reasonable bulk density for tonnage calculations, a block model estimate was

Northwest Copper Corp.
2021 Stardust Project Technical Report
95
run using 1631 SG data points within Zone 102 with a search range of 50m. The method
used was IDW to the second power (ID2). A minimum of 3 and maximum of 12 samples
were used to estimate a block. The mean and median SG values of blocks within 5m of a
sample and above a potentially economic cut-off grade were then calculated. The
median value of 3.42 was selected.
Variography
Semi-variograms were constructed using composite data from Zone 102 which had the
most drill intercepts. Due to the thin nature of the other mineral zones, there were
insufficient sample pairs available to model reasonable variograms. Directional semi-
variograms for Cu, Au and Ag constructed in the plane of the number 2 zone showed
nested spherical structures with ranges of 31m for Cu, 36 for Au and 41.5 m for Ag Table
14-4. There was no clear anisotropy evident in the plane of the mineralized structure.
Table 14-4 Variogram Models
Element Nugget Sill Range Sill Range
co c1 a1 c2 a2
Au 0.18 0.43 9.9 0.39 36
Ag 0.26 0.42 8.5 0.32 41.5
Cu 0.22 0.34 9.9 0.44 31
Estimation/Interpolation Methods
A block model with block dimensions of 0.5 x 3.0 x 2.5 m was created using Geovia-
Surpac© software. The narrow width in the x direction was chosen in order to investigate
model economics using a column processing function to impose minimum mining
widths. Model extents are shown in Table 14-7.
Table 14-5 Block Model Extents
Direction Min Max Dist (m)
size (m)
x 346650 347460 810 0.5
y 6161550 6162900 1350 3.0
z 250 1500 1250 2.5
Inverse-distance cubed weighting to the third power (ID3) interpolation was carried out
within the zone wireframes in a single pass using a maximum search distance of 100 m
in the plane of the zones. A minimum of 3 and maximum of 12 composites were used
for grade estimation. Anisotropic interpolation was used with each block being assigned
a dip and dip azimuth parallel to a trend surface based on the zone geometry. These

Northwest Copper Corp.
2021 Stardust Project Technical Report
96
values were used as input to define the search ellipse for each block. The major and
semi-major axes were the same dimension and the ratio to the minor axis was 3:1.
A Nearest-Neighbour model was also estimated to assist in model validation.
Block model grade distribution is illustrated in Figure 14-6 to Figure 14-8.
Figure 14-6 Block model Au grades

Northwest Copper Corp.
2021 Stardust Project Technical Report
97
Figure 14-7 Block model Ag grades

Northwest Copper Corp.
2021 Stardust Project Technical Report
98
Figure 14-8 Block model Cu grades
Grade distribution in the 421 Zone area of Zone 102 is presented in Figure 14-9 and
Figure 14-10 as cross sections at 6162125 North.

Northwest Copper Corp.
2021 Stardust Project Technical Report
99
Figure 14-9 Section 6162125N - Au and Ag Grades

Northwest Copper Corp.
2021 Stardust Project Technical Report
100
Figure 14-10 Section 6162125N - Cu Grades
Grade distribution on Section 6162050 through Zones 102, 103, 105, and 106 is
illustrated in Figure 14-11 and Figure 14-12.
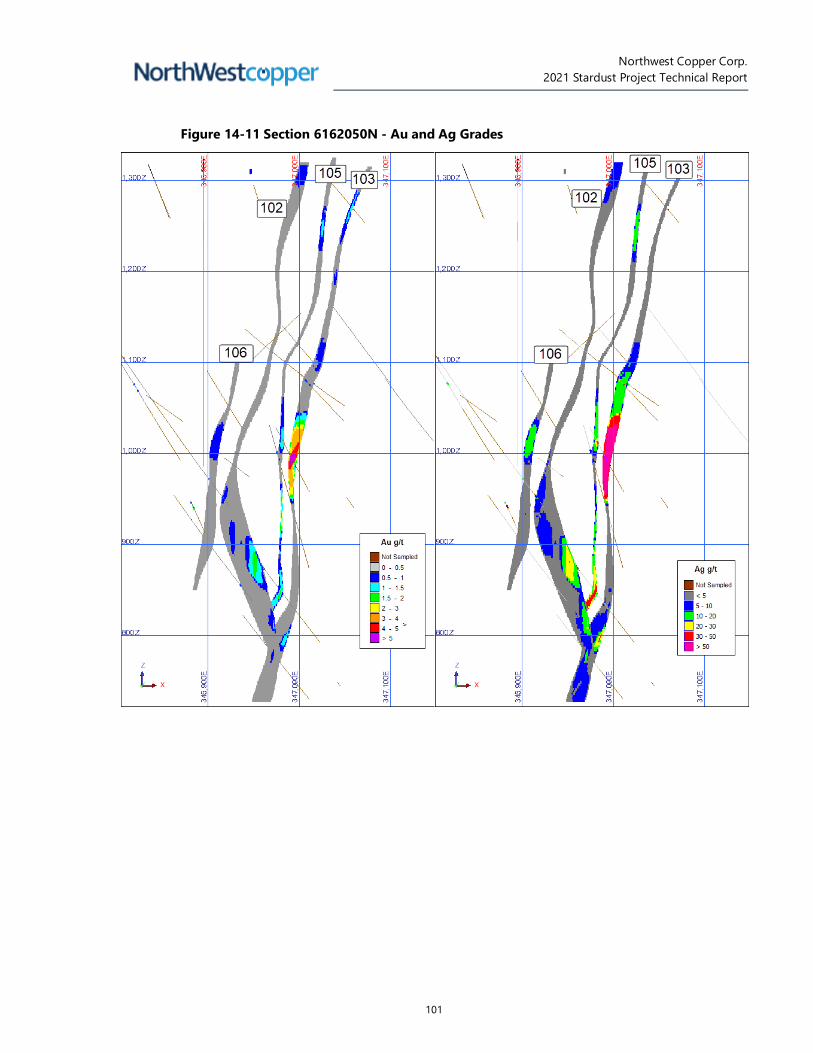
Northwest Copper Corp.
2021 Stardust Project Technical Report
101
Figure 14-11 Section 6162050N - Au and Ag Grades

Northwest Copper Corp.
2021 Stardust Project Technical Report
102
Figure 14-12 Section 6162050N - Cu Grades
Grade distribution on Section 6162705 through Zones 102 and 110 is illustrated in Figure
14-13. This section contained no significant Cu grades (greater than 0.25%).

Northwest Copper Corp.
2021 Stardust Project Technical Report
103
Figure 14-13 Section 6162705N - Au and Ag Grades
Block Model Validation
Model verification was initially carried out by visual comparison of blocks and composite
grades in plan and section views. The estimated block grades showed reasonable
correlation with adjacent composite grades.

Northwest Copper Corp.
2021 Stardust Project Technical Report
104
A comparison of global mean values shows a reasonably close relationship with
composites and block model values estimated using the nearest neighbour and ID3
interpolation methods (Table 14-6).
Table 14-6 Global Mean Grade Comparison
Item Au Ag Cu
Composites 0.65 11.4 0.51
Capped Composites 0.59 10.7 0.50
Declustered Capped Composites 0.54 9.6 0.42
IDW Grade 0.52 9.2 0.41
NN Grade 0.57 9.9 0.45
Classification of Mineral Resources
Resource classifications used in this study conform to the CIM Definition Standards for
Mineral Resources and Mineral Reserves (CIM, 2014).
Classified blocks were restricted to a minimum mining width of 2.5 m using a column
processing procedure to differentiate potential economic material from waste. Blocks
were further classified based on drill spacing. Blocks falling within a drill spacing of 30
m within Zones 2, 3, and 6 were initially assigned to the Indicated category. All other
estimated blocks within a maximum search distance of 100 m were assigned to the
Inferred category. Blocks were reclassified to eliminate isolated blocks and clusters and
to eliminate small portions of Indicated resources within Inferred resources and vice
versa.

Northwest Copper Corp.
2021 Stardust Project Technical Report
105
Figure 14-14 Section 6162125N Block Classification
Figure 14-15 Perspective View of Estimated and Classified Blocks

Northwest Copper Corp.
2021 Stardust Project Technical Report
106
Figure 14-16 Longitudinal Section showing Block Classification
Reasonable Prospects of Economic Extraction
Reasonable prospects for economic extraction were determined by applying a minimum
mining width of 2.5 m and excluding isolated blocks and clusters of blocks that would
likely not be mineable. The base case cut-off of US$65/t was determined based on metal
prices of US $3.25/lb copper, US $1,600/oz gold and US $20/oz silver, underground
mining cost of US $45/t, processing cost of US $15/t and G&A cost of US $5/t. Recoveries
used in calculation of the base case cut-off were based on recent metallurgical test
results and were assumed to be 94% for gold and copper and 86% for silver. Block
tonnes were estimated using a density of 3.4 g/cm for mineralized material.
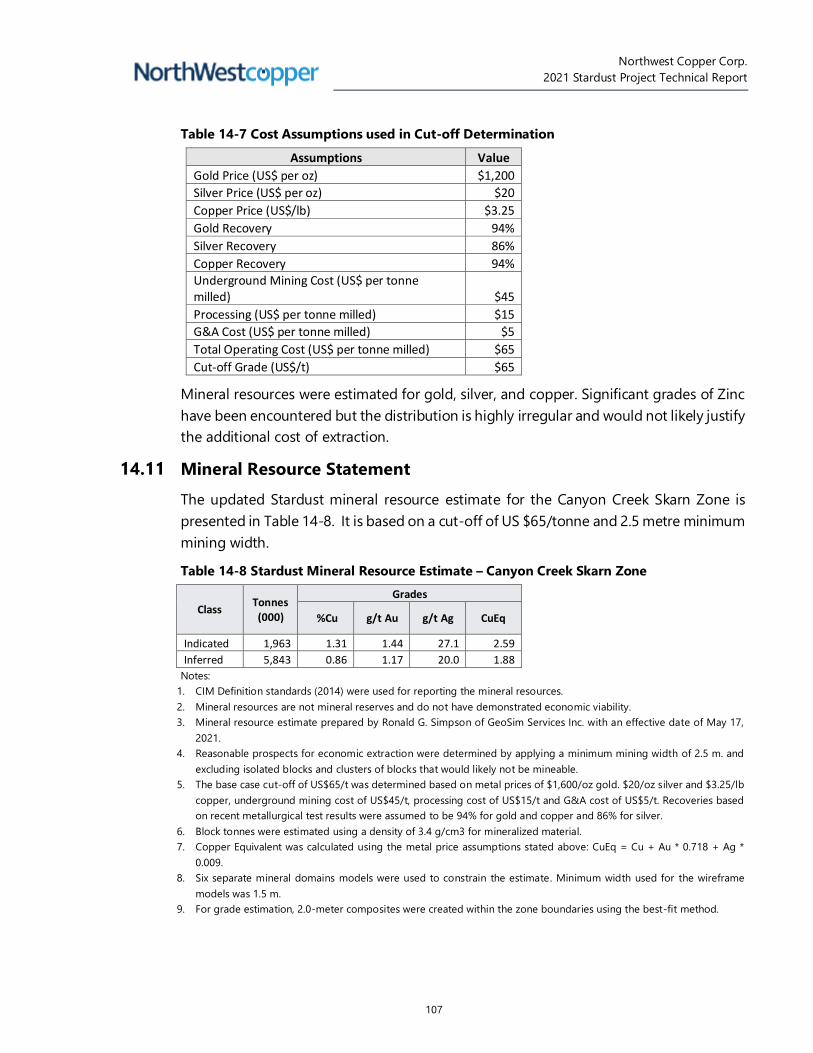
Northwest Copper Corp.
2021 Stardust Project Technical Report
107
Table 14-7 Cost Assumptions used in Cut-off Determination
Assumptions Value
Gold Price (US$ per oz) $1,200
Silver Price (US$ per oz) $20
Copper Price (US$/lb) $3.25
Gold Recovery 94%
Silver Recovery 86%
Copper Recovery 94% Underground Mining Cost (US$ per tonne milled) $45
Processing (US$ per tonne milled) $15
G&A Cost (US$ per tonne milled) $5
Total Operating Cost (US$ per tonne milled) $65
Cut-off Grade (US$/t) $65
Mineral resources were estimated for gold, silver, and copper. Significant grades of Zinc
have been encountered but the distribution is highly irregular and would not likely justify
the additional cost of extraction.
Mineral Resource Statement
The updated Stardust mineral resource estimate for the Canyon Creek Skarn Zone is
presented in Table 14-8. It is based on a cut-off of US $65/tonne and 2.5 metre minimum
mining width.
Table 14-8 Stardust Mineral Resource Estimate – Canyon Creek Skarn Zone
Class Tonnes (000)
Grades
%Cu g/t Au g/t Ag CuEq
Indicated 1,963 1.31 1.44 27.1 2.59
Inferred 5,843 0.86 1.17 20.0 1.88
Notes:
1. CIM Definition standards (2014) were used for reporting the mineral resources.
2. Mineral resources are not mineral reserves and do not have demonstrated economic viability.
3. Mineral resource estimate prepared by Ronald G. Simpson of GeoSim Services Inc. with an effective date of May 17,
2021.
4. Reasonable prospects for economic extraction were determined by applying a minimum mining width of 2.5 m. and
excluding isolated blocks and clusters of blocks that would likely not be mineable.
5. The base case cut-off of US$65/t was determined based on metal prices of $1,600/oz gold. $20/oz silver and $3.25/lb
copper, underground mining cost of US$45/t, processing cost of US$15/t and G&A cost of US$5/t. Recoveries based
on recent metallurgical test results were assumed to be 94% for gold and copper and 86% for silver.
6. Block tonnes were estimated using a density of 3.4 g/cm3 for mineralized material.
7. Copper Equivalent was calculated using the metal price assumptions stated above: CuEq = Cu + Au * 0.718 + Ag *
0.009.
8. Six separate mineral domains models were used to constrain the estimate. Minimum width used for the wireframe
models was 1.5 m.
9. For grade estimation, 2.0-meter composites were created within the zone boundaries using the best-fit method.

Northwest Copper Corp.
2021 Stardust Project Technical Report
108
10. Capping values on composites were used to limit the impact of outliers. For Zone 102, gold was capped at 15 g/t, silver
at 140 g/t and copper at 7.5%. For all other zones, gold was capped at 6 g/t, silver at 140 g/t and copper at 5%.
11. Grades were estimated using the inverse distance cubed method. Dynamic anisotropy was applied using trend surfaces
from the vein models. A minimum of 3 and maximum of 12 composites were required for block grade estimation.
12. Blocks were classified based on drill spacing. Blocks falling within a drill spacing of 30m within Zones 2, 3, and 6 were
initially assigned to the Indicated category. All other estimated blocks within a maximum search distance of 100 m
were assigned to the Inferred category. Blocks were reclassified to eliminate isolated Indicated resources within inferred
resources.
13. Totals may not sum due to rounding.
The mineral resource breakdown by zone is presented in Table 14-9 and Table 14-10.
Table 14-9 Indicated Mineral Resources by Zone
Zone Tonnes (000)
Grades
%Cu g/t Au g/t Ag CuEq
102 1,441 1.42 1.48 26 2.71
103 344 1.02 1.60 38 2.51
106 135 0.95 0.87 11 1.68
110 43 1.27 0.48 31 1.89
Total 1,963 1.31 1.44 27 2.59
Table 14-10 Inferred Mineral Resources by Zone
Zone Tonnes (000)
Grades
%Cu g/t Au g/t Ag CuEq
102 2,623 0.78 1.23 18 1.82
103 1,305 0.92 1.44 34 2.26
105 346 0.71 1.01 20 1.61
106 1,094 1.15 0.77 12 1.81
110 406 0.52 1.09 13 1.42
1x11 70 1.05 1.11 17 2.00
Total 5,843 0.86 1.17 20 1.88
Grade Sensitivity Analysis
The mineral resource sensitivity to increases in cut-off value are presented in Table
14-11and Table 14-12.
The results show that the resource estimate is moderately sensitive to changes in cut-off
grade. The reader is cautioned that these figures should not be misconstrued as a mineral
resource statement apart from the official base case scenario at $ 65/tonne. The results
shown above the base-case cut-off grade meet reasonable prospects of economic
extraction.

Northwest Copper Corp.
2021 Stardust Project Technical Report
109
Table 14-11 Resource Sensitivity - Indicated Class
COG $/t Tonnes >
COG
Grades
%Cu g/t Au g/t Ag CuEq
65 1,962,888 1.314 1.439 27.1 2.59
85 1,603,223 1.481 1.624 30.2 2.92
105 1,309,183 1.649 1.815 33.2 3.25
125 1,061,374 1.825 2.024 36.2 3.60
Table 14-12 Resource Sensitivity - Inferred Class
COG $/t Tonnes >
COG
Grades
%Cu g/t Au g/t Ag CuEq
65 5,843,160 0.860 1.166 20.0 1.88
85 4,317,343 0.973 1.349 22.6 2.15
105 3,091,762 1.103 1.536 24.9 2.43
125 2,158,409 1.242 1.727 27.6 2.73
Factors That May Affect the Mineral Resource Estimate
The mineral resource estimate is based on limited information and sampling gathered
through appropriate techniques diamond drill core holes. The estimate was prepared
using industry standard techniques and has been validated for bias and acceptable
grade-tonnage characteristics.
Areas of uncertainty that may materially impact the Mineral Resource estimate include:
• Commodity price assumptions.
• Assumptions that all required permits will be forthcoming.
• Metallurgical recoveries
• Mining and process cost assumptions
• Ability to meet and maintain permitting and environmental license conditions and
the ability to maintain the social license to operate.
There are no other known factors or issues that materially affect the estimate other than
normal risks faced by mining projects in the province of British Columbia in terms of
environmental, permitting, taxation, socio economic, marketing, and political. GeoSim is
not aware of any legal or title issues that would materially affect the Mineral Resource
estimate.

Northwest Copper Corp.
2021 Stardust Project Technical Report
110
Comment on Section 14
The QP has estimated and classified the mineral resources in a manner consistent with
the 2014 CIM Definition Standards. An inferred mineral resource has a lower level of
confidence than that applying to an indicated mineral resource and must not be
converted to a mineral reserve. It is reasonably expected that most of the Inferred mineral
resources could be upgraded to indicated mineral resources with continued exploration.

Northwest Copper Corp.
2021 Stardust Project Technical Report
111
15.0 Mineral Reserves Statement
This section is not relevant to this Technical Report as no mineral reserves have been
estimated.

Northwest Copper Corp.
2021 Stardust Project Technical Report
112
16.0 Adjacent Properties
This section is not relevant to this Technical Report.

Northwest Copper Corp.
2021 Stardust Project Technical Report
113
17.0 Other Relevant Data and Information
There are no other data or information relevant to the Stardust Project that have
not been presented in this Technical Report.

Northwest Copper Corp.
2021 Stardust Project Technical Report
114
18.0 Interpretation and Conclusions
Geosim has prepared a mineral resource estimate for the Stardust Project. The following
observations and conclusions were drawn:
• The Canyon Creek zone is a skarn-hosted mineral occurrence hosted by Permian
Cache Creek group sediments in proximity to the Glover stock. The presently
defined Canyon Creek Skarn mineralized zones extend approximately 1200 m along
strike and have been intersected from surface down to 900 m in depth.
• The adequacy of sample preparation, security and analytical procedures are
sufficiently reliable to support an Indicated and Inferred mineral resource
estimation and that sample preparation, analysis, and security are generally
performed in accordance with exploration best practices at the time of collection.
• The mineral resource estimate is based on analytical data from 206 drill holes
representing 80,700 m of drilling. Fifty-eight of these holes (38,329 m) were
completed in the most recent drill programs carried out in 2018, 2019 and 2020.
Block grade estimation is based on samples from 186 of these drill holes.
• Statistical analysis of gold grade distribution indicates that cutting or capping of
high grades is warranted.
• There is significant potential for expanding the current resource and for discovering
additional mineral deposits on the Property and extensions to known mineral
showings.
Areas of uncertainty that may materially impact the Project’s potential economic viability
or continued viability include:
• Commodity price assumptions
• Assumptions that all required permits will be forthcoming.
• Metallurgical recoveries
• Mining and process cost assumptions
• Ability to meet and maintain permitting and environmental license conditions and
the ability to maintain the social license to operate.
There are no other known factors or issues that materially affect the project other than
normal risks faced by mining projects the province of British Colombia in terms of
environmental, permitting, taxation, socio economic, marketing, and political factors.

Northwest Copper Corp.
2021 Stardust Project Technical Report
115
Geosim is not aware of any known legal or title issues that would materially affect the
Project’s potential economic viability.
Northwest Copper Corp.
2021 Stardust Project Technical Report
116
19.0 Recommendations
The results of the recent exploration programs clearly demonstrate that additional
exploration is warranted. The program should continue to focus on expanding the
Canyon Creek Skarn zone as well as testing for additional skarn lenses along the
siliciclastic sedimentary – carbonate contact. Infill drilling should be carried out to
upgrade Inferred resources to Measured or Indicated. Advanced metallurgical testing
should also be carried out. Specific recommendations for a first phase program include:
• Resource expansion drilling in order to potentially expand the mineral resources
within the Canyon Creek Skarn Zone.
• Infill drilling to potentially upgrade inferred mineral resources to measured or
indicated.
• Further metallurgical testing including comminution testing, locked cycle tests on
main rock types, variability testing and detailed concentrate analysis to identify
any potential deleterious elements that might impact marketability of the final
concentrates.
A second phase of work would consist of a Preliminary Economic Assessment (PEA) once
the first phase drilling is complete. The second phase work program would be contingent
on the results of the first phase drill program.

Northwest Copper Corp.
2021 Stardust Project Technical Report
117
20.0 References
ASH, C.H. And Macdonald (1993): Geology, Mineralization, and Lithogeochemistry of the
Stuart Lake Area, Central British Columbia (Parts of 93K/7,8,10 and 11). British Columbia
Geological Survey, Geological Fieldwork 1992, paper 1993-1
Albino, G.V. (1987): The Pinchi Mercury Belt, central British Columbia: near-surface
expression of a Mother Lode-type mineralized system. Geological Society of America,
Abstracts with Programs, 19:7, ppA141-142.
Aurora Geosciences Ltd. (2012): Deposit Potential and Data Evaluation of the Stardust
Property, Omineca Mining Division, British Columbia, Canada, Private internal report to
Alpha Gold Corp., 46 pagers.
B.C. Ministry of Agriculture and Lands, 2008: Crown Contaminated Sites Biennial Report
2008, http://www.bceia.com/documents/08_CCSB_report.pdf
Butler, D. B., & Jarvis, K.D.G. (2000): Report on the 2000 Magnetometer survey over the
Stardust Property. Whytecliff Geophysics Ltd. Report to Alpha Gold Corp., July14, 2000,
11 pages
Dunne, K.P.E., and Ray G. E., 2002, Constraints on fluid evolution at the polymetallic
Lustdust porphyry-skarn-manto-vein prospect, north-central British Columbia; in
Geological Fieldwork 2001, British Columbia Ministry of Energy and Mines, Paper 2002-
1, 281-302 pages
EINAUDI, M.T., MEINERT, L.D., AND NEWBERRY, R.J. (1981): In Skarn Deposits. In
Economic Geology 75th Anniversary Volume. (B.J. Skinner, ed.) Econ. Geol. Pub. Co., El
Paso, TX., pages 317-391
EVANS, G. (1996): Exploration of the Lustdust Property, Geology and Geochemical
Report. Teck Corp. 18p.
Evans, G. (1997): Diamond Drilling and Geochemical Report on the 1997 Exploration of
the Lustdust Property. Teck Corp., 16 pages.
Gabrielese, H., and Yorath, C.J., eds. (1992): Geology of the Cordilleran Orogen in Canada.
Geological Society of America, DNAG G-2, 875.
Geotec, Ltd (2011): Report on a Helicopter-Borne Z-Axis Tipper Electromagnetic (ZTEM)
and Aeromagnetic Geophysical Survey, Stardust Property (Clipped to Claims), Takla
Narrows, British Columbia, 51 pages

Northwest Copper Corp.
2021 Stardust Project Technical Report
118
Hanson, D.J. (2005): 2004 Diamond Drilling and Soil Geochemistry Exploration Program,
Stardust Property, Omineca Mining Division, British Columbia, Canada.
Hanson, D.J. (2006): 2005 Diamond Drilling and Soil Geochemistry Exploration Program,
Stardust Property, Omineca Mining Division, British Columbia, Canada.
Hanson, D.J., (2007), 2006 Technical Report Diamond Drilling, Reverse Circulation Drilling
and Bedrock Trenching, Stardust Property, Omineca Mining Division, British Columbia,
Canada
Johnston, R.J. & Titley, G. (2018): 2017 Assessment Report, Drilling, Geochemical
Sampling and Geophysical Surveys on the Stardust Property, Omineca Mining Division,
British Columbia, Canada
Lang, J. & Angove, B. (2021): Metallurgical Scoping Study of the Stardust Project by Base
Metallurgical Laboratories Ltd. in Kamloops, BC.
Ledwon, A. And Beck, R. (2009): 2009 Diamond Exploration Program, Stardust Property,
Omineca Mining Division, British Columbia. UTM Exploration Services Ltd for Alpha Gold,
482 pages
Ledwon, A. and Beck, R.., (2010): A Geological and Drilling Report on the Stardust
Property, Omineca Mining Division, British Columbia, prepared for Alpha Gold
Corporation
Ledwon, A. and Rensby, J., (2011): A Geological and Geophysical Report on the Stardust
Property, British Columbia, prepared for Alpha Gold Corporation
MacIntyre, D.G., and Struik, L.C. (1999): Nechako NATMAP Project, central British
Columbia 1998 Overview. British Columbia Geological Survey, Geological Fieldwork 1998,
paper 1999-1
Megaw, P.K.M. (1998): Carbonate-hosted Pb-Zn-Ag-Cu-Au replacement deposits: An
exploration perspective. In Mineralized intrusion-related skarn systems (Lentz, D.R., ed.).
Mineralogical Association of Canada, Short Course Series 26, pages 337-358.
Megaw, P.K.M., (1999): Report on 1999 Drilling and Geological Study of the Stardust
Property, Omineca Mining Division, British Columbia, Canada: Alpha Gold Corp, October
14, 1999, 41.
Megaw, P.K.M., (2000): Report on 2000 Drilling and Geological Study of the Stardust
Property, Omineca Mining Division, British Columbia, Canada: Alpha Gold Corp, October
14, 2000, 42.

Northwest Copper Corp.
2021 Stardust Project Technical Report
119
Megaw, P.K.M. (2001): Report on 2001 Drilling and Geological Study of the Stardust
Property, Omineca Mining Division, British Columbia Canada, 50 pages.
MEINERT, L.D. (1995): Compositional variation of igneous rocks associated with skarn
deposits - Chemical evidence for a genetic connection between petrogenesis and
mineralization. In Magmas, fluids, and ore deposits (J.F.H. Thompson, ed.). Min. Assoc.
Can. Short Course Series 23, pages 401-418.
Monger, J.W.H. (1977): Upper Paleozoic rocks of the western Canadian Cordillera and
their bearing on Cordillera evolution. Canadian Journal of Earth Science, 14, 1832-1859.
Oliver, J.L. (2002): Report on 2002 Exploration and Diamond Drilling Stardust Property.
Private internal report to Alpha Gold Corp., 62 pages.
Oliver, J.L., (2003): Report on 2003 Exploration and Diamond Drilling Stardust Property.
Independent internal report to Alpha Gold Corp., 103 pages.
Palmer, K.J., Hanson, D.J. (2005): Technical Report, Stardust Property, Omineca Mining
Division, British Columbia, Canada, Private internal report to Alpha Gold Corp., 61 pages
Paterson, O.A. (1977): The geology and evolution of the Pinchi Fault Zone at Pinchi Lake,
central British Columbia, Canadian Journal of Earth Science, 14, 1324-1342.
Ray, G.E., and Webster, I.C.L., (1997): Skarns in British Columbia; British Columbia Ministry
of Employment and Investment, Bulletin 101, 260 pages
Ray, G.E. (2002): Geological work completed at the Stardust Property and in some
surrounding areas, Central British Columbia, (093N/11W). Private internal report to Alpha
Gold Corp., 24 pages.
Ray, G.E., Webster, I.C.L., Megaw, P.K.M., Mcglassen, J.A. And Glover, J.K. (2002): The
Stardust Property in central British Columbia: a polymetallic zoned porphyry – skarn –
manto – vein system; in Geological Fieldwork 2001, British Columbia Ministry of Energy
and Mines, Paper 2002 –1 pages 257 – 280.
RAY, G.E., WEBSTER, I.C.L., MEGAW, P.K.M., MCGLASSEN, J.A. AND GLOVER, J.K. (2002):
The Lustdust Property in central British Columbia: a polymetallic zoned porphyry – skarn
– manto – vein system; in Geological Fieldwork 2001, British Columbia Ministry of Energy
and Mines, Paper 2002 –1 pages 257- 280.
Sano, H., and Struik, L.C., (1977): Field properties of the Pennsylvanian-Lower Permian
limestones of the Cache Creek Group, northwest of Fort St. James, British Columbia.
Geological Survey of Canada, Current Research 1997-A, 85-73.

Northwest Copper Corp.
2021 Stardust Project Technical Report
120
Schein, E., Legault, J. and Latrous, A., (2011): Report on Helictoper-borne Z-Axis Tipper
Electromagnetic (ZTEM) and Areomagnetic geophysical Survey, Stardust Property; for
Alpha Gold Corporation, 51 pages.
Schiarizza, P. And Macintyre, D.G. (1999): Geology of the Babine Lake-Takla Lake area,
central British Columbia (93K/ 11,12,13,14; 93N/3,4,5,6). British Columbia Geological
Survey, Geological Fieldwork 1998, paper 1999-1.
Schiarizza, P. (2000): Bedrock Geology and Mineral occurrences, Old Hogem (Western
Part). British Columbia Geological Survey, Open File 2000-33, scale 1:100 000.
Scott, B., (2017): Logistical Report, Induced Polarization and Magnetometer Surveys,
Stardust Property, Fort St. James Area, BC. Private internal report prepared for Lorraine
Copper Corp.,
Sillitoe, R.H. and Bonham, H.F., Jr. (1990): Sediment–hosted gold deposits: Distal products
of magmatic-hydrothermal systems. Geology18, 157–161
Simpson, R.G., (2010): Technical Report, Canyon Creek Copper-Gold Deposit, Stardust
Property, Omineca Mining Division, British Columbia, Canada
Simpson, R.G., (2018): Stardust Project NI43-101 Technical Report, Omineca Mining
Division, British Columbia, Canada
Soregaroli, A., (1999): Memo on regional geological, geochemical, and geophysical
studies performed in the Lustdust area by research institutions. Report to Alpha Gold
Corp., October 1999.
Titley, S.R., and Megaw, P.K.M. (1985): Carbonate-hosted ores of the Western Cordillera:
an overview. A.I.M.E. Preprint 85-115, 17p.
TITLEY, S.R., AND MEGAW, P.K.M. (1995): The setting and genesis of high-temperature,
massive, carbonate-hosted replacement ores. Society of Economic Geologists
International Field Conference on Carbonate-hosted Lead-Zinc Deposits, St. Louis
Missouri, June 3-6, 1995, Extended Abstracts, pages 314-316.

CERTIFICATE OF QUALIFIED PERSON
Ronald G. Simpson, P.Geo.
This certificate applies to NI 43-101 Technical Report titled “Stardust Project, Updated Mineral Resource
Estimate, NI43-101 Technical Report” (the “Technical Report”) prepared for Northwest Copper Corp. (the
“Company”) with an effective date of May 17, 2021.
I, Ronald G. Simpson, P.Geo., do hereby certify that:
I employed as a Professional Geoscientist with:
GeoSim Services Inc.
807 Geddes Road. Roberts Creek, BC, Canada V0N 2W6
I graduated with a Bachelor of Science in Geology from the University of British Columbia, May 1975.
I am a Professional Geoscientist (19513) in good standing with the Association of Professional
Engineers and Geoscientists of British Columbia
I have practiced my profession continuously for 46 years. I have been directly involved in mineral
exploration, mine geology and resource estimation with practical experience from feasibility studies. I
have past experience with and authored technical reports on Carbonate Replacement Deposits
located in Canada and Mexico.
I have read the definition of “Qualified Person” set out in the National Instrument 43-101 - Standards
of Disclosure for Mineral Projects (“NI 43-101”) and certify that by reason of my education, affiliation
with a professional association (as defined in NI 43-101) and past relevant work experience, I fulfill the
requirements to be a “Qualified Person” for the purposes of NI 43-101.
I am independent of the Company as described in Section 1.5 of NI 43-101.
I am responsible for all sections of the Technical Report.
I visited the Property on June 14, 2010, on October 19, 2017, and on September 23, 2020.
I have authored the following previous technical reports on the Property:
• Technical Report, Canyon Creek Copper-Gold Deposit, Lustdust Property, Omineca Mining Division,
British Columbia, Canada” with effective data of June 23, 2010.
• Stardust Project NI43-101 Technical Report, Omineca Mining Division, British Columbia, Canada”
with effective data of January 8, 2018.
I have read NI 43-101, Form 43-101F1 and the Technical Report has been prepared in compliance
with this NI 43-101.
As of the effective date of the Technical Report, to the best of my knowledge, information and belief,
the Technical Report, and the parts that I am responsible for, contains all scientific and technical
information that is required to be disclosed to make the Technical Report not misleading.
Dated: July 2, 2021
Ronald G. Simpson, P.Geo.