starbucks financial
TRANSCRIPT

8/6/2019 Starbucks Financial
http://slidepdf.com/reader/full/starbucks-financial 1/19
What Went Wrong with Starbucks?
Financial Analysis and Business Evaluation
Case Study
By
Julia S. Kwok*Elizabeth C. Rabe
Northeastern State University
* Corresponding author: Department of Accounting and Finance, College of Business andTechnology, Northeastern State University, Broken Arrow, OK 74014; Email:[email protected]; Phone: 918-449-6516.

8/6/2019 Starbucks Financial
http://slidepdf.com/reader/full/starbucks-financial 2/19
What Went Wrong with Starbucks?
Financial Statement Analysis
Abstract
After decades of grande growth based on the Starbucks experience, Starbucks Coffee Companyexperienced continuous drop of stock price since the beginning of 2007. Upon first glance of their financial statements, there was 20% increase in revenues and 9% increase in net income lastyear. Such growth could be counter intuitive to the drop of market value. This case encourages amore in depth examination of how the financing of the expansion impacted financial ratios.Further assessment should evaluate the impact of expansion on the company‘s free cash flowsand return of the capital investment. Students would need to evaluate the relative contribution of factors leading to the drop of the stock price. The case provided detailed information that would
allow students to investigate the impact of the economic and business conditions, the competitionand Starbuck‘s business strategies on their financial performance. The students were advised toconsider what changes to Starbuck‘s strategies could increase the economic value added of theexpansion and help to reverse their road to failure. This case illustrates the importance of analysis of free cash flows and return on capital when making capital budgeting decisions.
Keywords: financial statement analysis, ratio analysis, common size statement, Du Pont analysis,free cash flows, expansion, economic value added
JEL classifications: L25, G31, M41, F23, L22
8/6/2019 Starbucks Financial
http://slidepdf.com/reader/full/starbucks-financial 3/19
Starbucks Coffee Company
1/17
Why went wrong with Starbucks?
Financial Statement Analysis
Case Study______________________________________________________________________________
It was a chaotic morning in Java Investment. Ronnie, a new analyst, came into the office
carrying a bag from Starbucks and a tall coffee. ―Where have you been? The Nekki has just fell
five percentages last night. Ooo, you‘ve brought Starbucks!‖ Sandy exclaimed. ―I haven‘t had a
blueberry muffin from them in ages. I used to stop there a couple of times a week for latte, but
since they closed the one closest to here, I am latte deficient.‖
―I know,‖ Ronnie replied. ―I had to drive three miles out of my way for this, but I really
like their hazelnut Mocha on a cold November morning. I either have to make a drive or stop at
Caribou to get my full-bodied grande Es presso. But it‘s just not the same.‖
Sandy replied, ―That is true. I used to sit and listen to the music while I sipped my coffee
at Starbuck. As they open a lot more stores, the atmosphere of the new ones is not as enjoyable
as the old ones. It is starting to feel like Dunkin Donuts. Starbucks has really grown since that
first Seattle store in 1971. In the last three years, from 2005 to 2007, they have opened 6,442
stores.‖
―Sandy, you seem to know a lot about Starbucks. Do you know why they closed the
nearby store‖ said Ronnie.
―Well, Tom, our boss, has asked me to evaluate the impact of their expansion. I started
looking at their free cash flows, return on invested capital and financial ratios. May I have a
muffin,‖ Sandy said.
8/6/2019 Starbucks Financial
http://slidepdf.com/reader/full/starbucks-financial 4/19
Starbucks Coffee Company
2/17
―Sure, take one,‖ Ronnie offered.
―Besides expanding locations, Starbucks offers a variety of products. I can buy the music
I like listening to from Starbucks. They also sell coffee beans and those double shot packaged
drinks. You can even buy your own Es presso brewing machine from them,‖ Sandy continued.
―I saw that the last time I went to Starbucks. But I think they make more money selling
coffee,‖ Ronnie commented.
―Yes, in fact, 65% of the revenue comes from coffee. Do you want to work with me on
my new assignment since you are a Starbuck fan,‖ asked Sandy. ―Let‘s start reviewing thei r
business environment and financial statement. Have you seen the latest financial report that
should have come out two months ago? Let‘s start with 2006 to the most recent 2007 report.
Company History
Sandra had already collected some basic company information about Starbucks. The
Starbucks Company, Inc. sold coffees, teas, and other drinks; foods items; accessories and
equipment through retail outlets. It also sold coffee beans, teas, and cold drinks wholesale. The
company began in 1971 in the Pikes Place area of Seattle, WA. It had expanded its number of
retail stores to over 15,000 located in both the US and internationally by 2005. In 2005
Starbucks management announced its intention to double the number of retail stores and increase
the number of customers to all stores.
Starbucks had added 1672 stores during 2005. It continued to open new stores with 2199
openings in 2006 and 2571 openings in 2007. Earnings per share grew from 61 cents per share
87 cents per share over the period of 2005-2007. At the close of the 2007 fiscal year, the
management was forecasting the opening of an additional 2500 stores in 2008.
8/6/2019 Starbucks Financial
http://slidepdf.com/reader/full/starbucks-financial 5/19
Starbucks Coffee Company
3/17
Stock prices during this time span rose from the $30 per share in November 2005 to $35
per share a year later. The stock prices then began a steady downward slide to $23 per share as
of November of 2007 (BUCX- Historical Prices for Starbucks Co – Yahoo! Finance 2009).
Ronnie and Sandy both agreed that shareholders did not seem to agree with Starbucks‘ rapid
expansion.
The Starbucks Experience
The transformation of a small coffee shop to an ―authentic Italian coffee bar‖ was led by
Mr. Howard Schultz (Maney 2009). He felt Starbucks should be a ―great experience, and not
just a retail store (Maney 2009). It should involve the aroma of robust coffee, theater and
romance. Started in Seattle, sprawling around the northwest region of the county, Starbucks
provided a ―Third Place‖ for customers to meet, relax, and enjoy themselves. A Starbucks barista
would grind the coffee beans and hand-pre pared coffee specific to the customer‘s order, making
it a personal experience.
The experience drove significant growth of Starbucks over the years. To standardize the
experience, the barista‘s fine touch of the creation of a perfect cup of coffee was re placed by an
automatic espresso machine and the vacuum-packed ground coffee in the new cookie-cutter
stores that mushroomed during 2005-2007. Ironically, that standardization and rapid growth
started to diminish the branding of the Starbucks experience. Inexperienced new staff was
under-trained offering sub-standard services. New stores could be found at small strip malls and
in grocery stores, representing convenience instead of unique experience.
8/6/2019 Starbucks Financial
http://slidepdf.com/reader/full/starbucks-financial 6/19
Starbucks Coffee Company
4/17
Fierce Competition
Direct competition from smaller companies such as Caribou Coffee, locally owned
independent or small chained cafés provided comparable products and an atmosphere of
community. The largest company that directly competed with Starbucks was Caribou Coffee,
which was the second largest specialty coffee house. Net sale from the Caribou Coffee was 3%
of that of Starbucks. While they lack the size, geographical coverage and market share of
Starbucks, in aggregate they are large in numbers and they are providing the experience that
Starbucks has lost.
McDonalds started the more intense competition when it upgraded its coffee in 2006.
They were planning to install coffee bars in all US locations in 2008. The existing customer base
and demographic coverage gave McDonalds an upper hand on access to breakfast coffee
drinkers who are sensitive to the price differentials and appreciate convenience of McDonald‘s
locations. In 2007, Starbucks had 14,000 locations in 43 countries and McDonalds had 25,600
locations in 118 countries. McDonald had almost twice the number of units than that of
Starbucks (Aboutmcdonalds.com 2009, Malkin 2007, and NationMaster.com 2009).
With 13,000 locations, the privately held Dunkin‘ Brands Inc. offered quick and
convenient to-go-coffee. In 2007, they introduced a new line of Espresso drinks to position itself
between Starbucks and Krispy Kreme (Shepherd 2007). However, health conscious Yuppies
were less likely to have low cost, high cholesterol donuts every day. Dunkin was likely to
compete more directly with McDonald than Starbucks for the average customer.
Starbucks maintained that the quality of their products and services differentiated
themselves from the competition. Therefore, increasing geographical coverage domestically and
internationally had been their corporate focus. They planned to open 20,000 locations in the US
8/6/2019 Starbucks Financial
http://slidepdf.com/reader/full/starbucks-financial 7/19
Starbucks Coffee Company
5/17
and 20,000 internationally in four years. In Washington State, Starbucks already had one store
for every 12,000 people (Palmer 2007). However, the extreme growth, providing convenience,
caused Starbucks to cannibalizing their own stores through over-saturation of an area.
Economic and Business Environment
The increase of oil prices had dramatic effect on consumer spending. Oil prices had been
dramatically increased from 2003 to 2007. The inflation-adjusted price of a barrel of crude oil
on NYMEX price rose from $30 per barrel to over $65 per barrel in 2007. The prediction was
that it would go up to over $90 per barrel (inflationdata.com 2009). More than two thirds of US
consumers were reducing their spending. Around 50% of the consumers were now eating out
less and 35% were buying less expensive brands. Traditionally, Starbucks‘ first-time customers
had an average income of $92,000 per year, and were willing to pay for the experience and not
just the coffee. But as the increase of Starbuck‘s accessibility and convenience attracted less
affluent customers, the average income of first-time customers had dropped to $80,000 a year,
which was roughly a 13% drop. In the past, raising prices per cup of coffee had little effect on
demand. However, the declining customer‘s spending power would change the traditional
inelasticity of customer demand (Helm and Goudreau, 2007). Starbucks‘ susceptibility to
economic downturn was already reflected in their flat-to-negative transaction count trend
(Starbucks 2007 Annual Report 2007). ―Less than 1% of the (4% ) same-store (sales) increase
(last year) came from an increase in the value per customer transaction, according to the
company‘s chief financial officer (Helm and Goudreau, 2007). The increase of the value per
customer transaction could be attributed to the average five-cent and nine-cent increases per cup
of coffee by Starbucks in year 2006 and in 2007 (Allison, 2007).
8/6/2019 Starbucks Financial
http://slidepdf.com/reader/full/starbucks-financial 8/19
Starbucks Coffee Company
6/17
Starbucks‘ profit was affected by the increasing cost of goods sold. The price of coffee
beans had sky-rocketed. There was a 20% increase over the 2005-2007 three-year period. The
price of 100 pounds of coffee beans had increased from $95.75 to $107.68 in the past year
(dev.ico.org 2009). According to a 2007 economic research report published by USDA, a 10%
change in coffee bean‘s commodity prices would translate a 3% increase of retail prices (Leibtag
E., Nakamura A. and Nakamura, E. and Zerom D. 2007). So the retail prices of coffee beans
would increase 3.6%. The cost of goods sold was further affected by the increase of minimum
wage. The minimum wage rose from $5.15 to $5.85 in July 2007 which represented a 14%
increase (Laborlawcenter.com 2009).
Financial Analysis
―Can you believe despite all this, there was only 3% drop of operating profits ,‖ Sandy
exclaimed.
―I know, the revenues had increased 20% over the last year resulting in a 9% increase in
net income in 2007,‖ Ronnie remarked.
―However, Starbucks‘ stock had dropped by 20% over the past 12 month (Helm and
Goudreau, 2007). The price plummeted from around $35 in 2006 to $23 in 2007 (Yahoo-
Finance 2009). So our charge is to investigate the disparity between the accounting and financial
performance. It would be a good idea to start reviewing information from the financial
statements that we gathered (see Exhibit 1-5). We should evaluate the impact of expansion on
the return of the capital investment, economic value added as well as the company‘s free cash
flows and financial ratios. This may help us to understand their liquidity issues mentioned by the
press,‖ Sandy recommended.
8/6/2019 Starbucks Financial
http://slidepdf.com/reader/full/starbucks-financial 9/19
Starbucks Coffee Company
7/17
―Once we find out the root cause of the drop of stock price, we should also consider
what changes to Starbuck‘s strategies could reverse their road to failure. I am sure Tom will be
interested in that,‖ Ronnie echoed Sandy‘s suggestion.
8/6/2019 Starbucks Financial
http://slidepdf.com/reader/full/starbucks-financial 10/19
Starbucks Coffee Company
8/17
References
Allison, M. Starbucks raises prices again. The Seattle Times (2007). Retrieved September 18,
2009 fromhttp://seattletimes.nwsource.com/html/businesstechnology/2003803039_starbucks24.html
BUCX- Historical Prices for Starbucks Co – Yahoo! Finance (2009). Yahoo.com. RetrievedSeptember 15, 2009 fromhttp://finance.yahoo.com/q/hp?s=SBUX&a=08&b=30&c=2005&d=08&e=30&f=2009&g=m
Leibtag E., Nakamura A. and Nakamura, E. and Zerom D. Cost Pass-Through in the US CoffeeIndustry. Economic Research Report No. (EER-38) 28 pp, March 2007. Retrieved September18, 2009 fromhttp://www.ers.usda.gov/Publications/ERR38/
Federal Minimum Wage History (2009). Retrieved September 18, 2009 fromhttp://www.laborlawcenter.com/t-federal-minimum-wag.aspx
Founder Sees Lots of Room for Lots More Starbucks: [Interview] Elisabeth Malkin. New York Times. (Late Edition (east Coast). New York, N.Y.: Sep 22, 2007. P.C.2
―Food Statistics > McDonalds restaurants (most recent) by country‖NationMaster.com (2009).Retrieved September 15, 2009 from http://www.nationmaster.com/graph/foo_mcd_res-food-mcdonalds-restaurants Helm and Goudreau. IS Starbucks Pushing Prices Too High? – BusinessWeek.com (2007).
Retrieved September 18, 2009 fromhttp://www.businessweek.com/bwdaily/dnflash/content/jul2007/db20070801_030871.htm?campaign_id=twxa
Historical Crude Oil Prices (Table) – inflationdata.com (2009). Retrieved September 18, 2009from http://www.inflationdata.com/inflation/Inflation_Rate/Historical_Oil_Prices_Table.asp.
MCD - Getting to Know Us – aboutmcdonalds.com (2009). Retrieved September 18, 2009 fromhttp://www.aboutmcdonalds.com/mcd/our_company.html
Maney, Kevin. How Starbucks Lost its ‗Fidelity‖ from CNNMoney.com (2009). Retrieved
September 15, 2009 fromhttp://money.cnn.com/2009/09/16/news/companies/kevin_maney_starbucks.fortune/index.htm
Starbucks Company 2007 Annual Report (2007). Starbucks Form 10-K. www.edgar-online.com. Retrieved September 12 2008 from file://E:\Starbucks\v33834e10vk Starbucks2007.htm
8/6/2019 Starbucks Financial
http://slidepdf.com/reader/full/starbucks-financial 11/19
Starbucks Coffee Company
9/17
Palmer, Jay. A Latte Room to Grow. Barron‘s. New York, N.Y: Mar 26, 2007. Vol. 87, Iss. 13,P22, 24 (2 pp.)
Shepherd, Lauren. Starbucks competition heats up from THE ASSOCIATED PRESS, NEW
YORK (2007). Retrieved September 18, 2009 fromhttp://www.businessweek.com/ap/financenews/D8O0SPE80.htm
8/6/2019 Starbucks Financial
http://slidepdf.com/reader/full/starbucks-financial 12/19
Starbucks Coffee Company
10/17
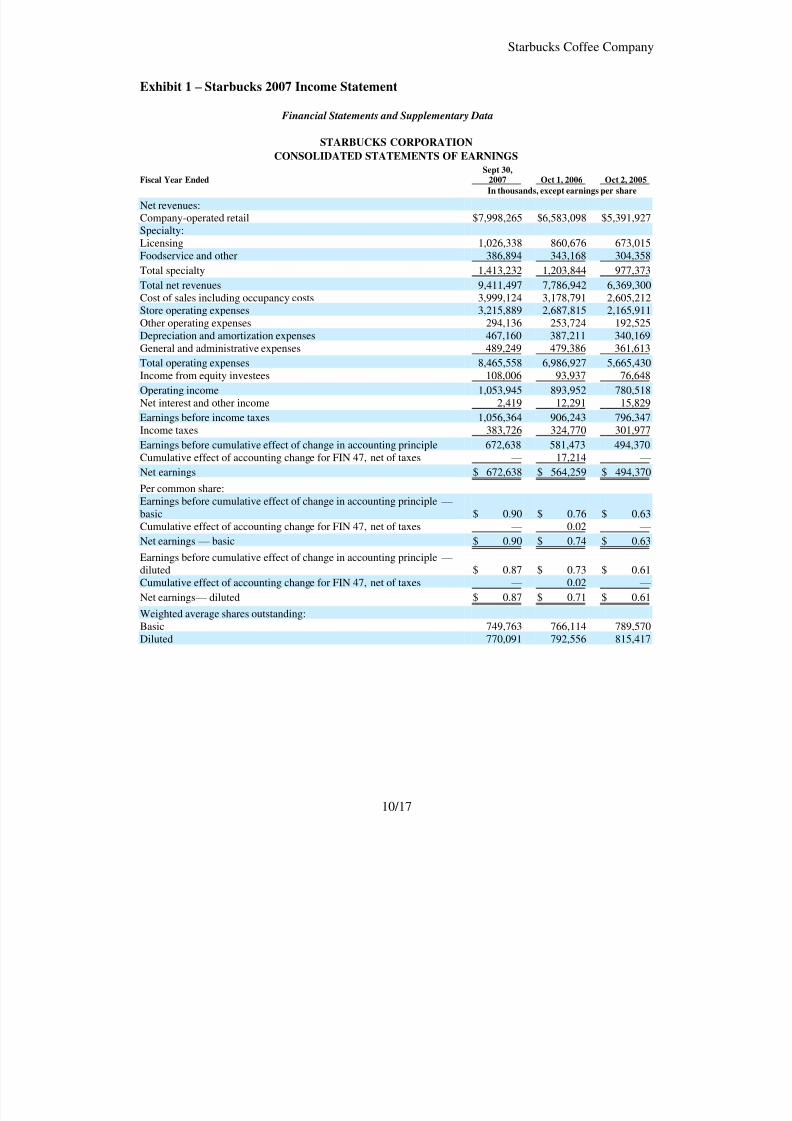
Exhibit 1 – Starbucks 2007 Income Statement
Financial Statements and Supplementary Data STARBUCKS CORPORATION
CONSOLIDATED STATEMENTS OF EARNINGS Fiscal Year Ended
Sept 30,2007 Oct 1, 2006 Oct 2, 2005
In thousands, except earnings per share
Net revenues:Company-operated retail $7,998,265 $6,583,098 $5,391,927Specialty:Licensing 1,026,338 860,676 673,015Foodservice and other 386,894 343,168 304,358
Total specialty 1,413,232 1,203,844 977,373
Total net revenues 9,411,497 7,786,942 6,369,300Cost of sales including occupancy costs 3,999,124 3,178,791 2,605,212Store operating expenses 3,215,889 2,687,815 2,165,911Other operating expenses 294,136 253,724 192,525
Depreciation and amortization expenses 467,160 387,211 340,169General and administrative expenses 489,249 479,386 361,613
Total operating expenses 8,465,558 6,986,927 5,665,430Income from equity investees 108,006 93,937 76,648
Operating income 1,053,945 893,952 780,518Net interest and other income 2,419 12,291 15,829
Earnings before income taxes 1,056,364 906,243 796,347Income taxes 383,726 324,770 301,977
Earnings before cumulative effect of change in accounting principle 672,638 581,473 494,370Cumulative effect of accounting change for FIN 47, net of taxes — 17,214 —
Net earnings $ 672,638 $ 564,259 $ 494,370
Per common share:
Earnings before cumulative effect of change in accounting principle — basic $ 0.90 $ 0.76 $ 0.63Cumulative effect of accounting change for FIN 47, net of taxes — 0.02 —
Net earnings — basic $ 0.90 $ 0.74 $ 0.63
Earnings before cumulative effect of change in accounting principle — diluted $ 0.87 $ 0.73 $ 0.61Cumulative effect of accounting change for FIN 47, net of taxes — 0.02 —
Net earnings — diluted $ 0.87 $ 0.71 $ 0.61
Weighted average shares outstanding:Basic 749,763 766,114 789,570Diluted 770,091 792,556 815,417
8/6/2019 Starbucks Financial
http://slidepdf.com/reader/full/starbucks-financial 13/19
Starbucks Coffee Company
11/17
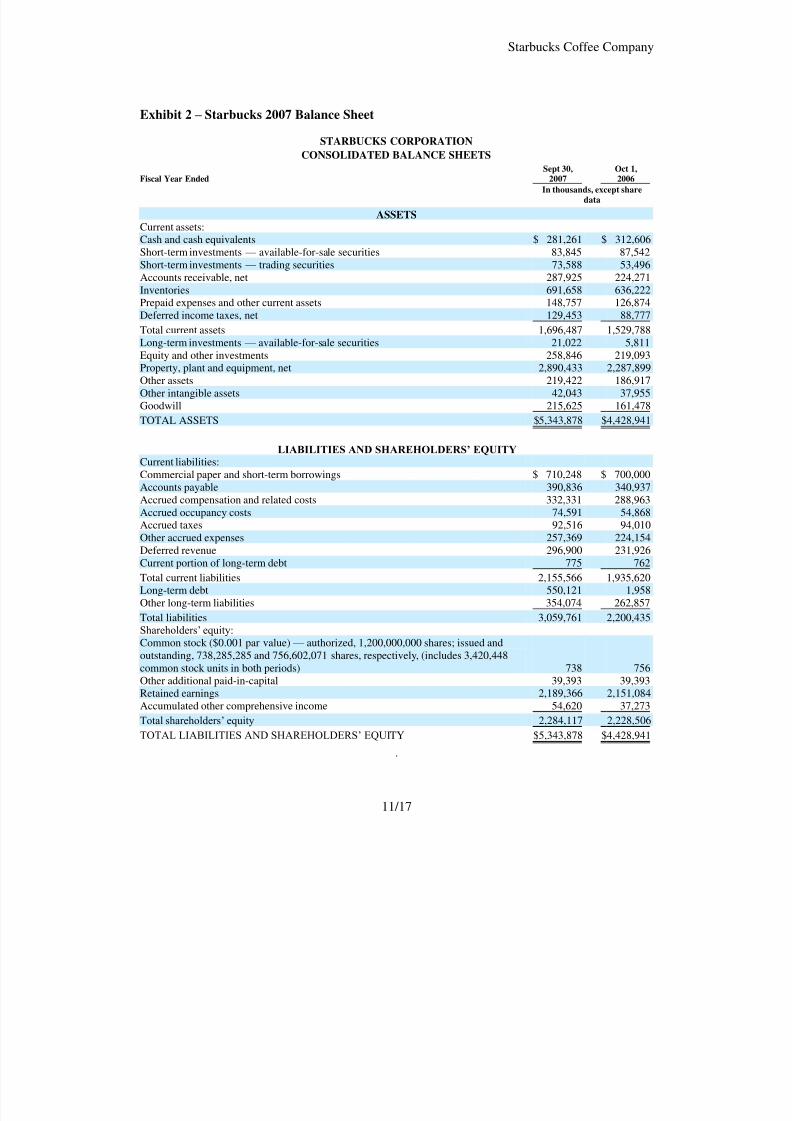
Exhibit 2 – Starbucks 2007 Balance Sheet
STARBUCKS CORPORATION CONSOLIDATED BALANCE SHEETS
Sept 30, Oct 1, Fiscal Year Ended 2007 2006
In thousands, except share
data
ASSETS Current assets:Cash and cash equivalents $ 281,261 $ 312,606Short-term investments — available-for-sale securities 83,845 87,542Short-term investments — trading securities 73,588 53,496Accounts receivable, net 287,925 224,271Inventories 691,658 636,222Prepaid expenses and other current assets 148,757 126,874Deferred income taxes, net 129,453 88,777
Total current assets 1,696,487 1,529,788Long-term investments — available-for-sale securities 21,022 5,811Equity and other investments 258,846 219,093Property, plant and equipment, net 2,890,433 2,287,899Other assets 219,422 186,917Other intangible assets 42,043 37,955Goodwill 215,625 161,478
TOTAL ASSETS $5,343,878 $4,428,941
LIABILITIES AND SHAREHOLDERS’ EQUITY Current liabilities:Commercial paper and short-term borrowings $ 710,248 $ 700,000Accounts payable 390,836 340,937
Accrued compensation and related costs 332,331 288,963Accrued occupancy costs 74,591 54,868Accrued taxes 92,516 94,010Other accrued expenses 257,369 224,154Deferred revenue 296,900 231,926Current portion of long-term debt 775 762
Total current liabilities 2,155,566 1,935,620Long-term debt 550,121 1,958Other long-term liabilities 354,074 262,857
Total liabilities 3,059,761 2,200,435Shareholders‘ equity:Common stock ($0.001 par value) — authorized, 1,200,000,000 shares; issued andoutstanding, 738,285,285 and 756,602,071 shares, respectively, (includes 3,420,448
common stock units in both periods) 738 756Other additional paid-in-capital 39,393 39,393Retained earnings 2,189,366 2,151,084Accumulated other comprehensive income 54,620 37,273
Total shareholders‘ equity 2,284,117 2,228,506
TOTAL LIABILITIES AND SHAREHOLDERS‘ EQUITY $5,343,878 $4,428,941
.

8/6/2019 Starbucks Financial
http://slidepdf.com/reader/full/starbucks-financial 14/19
Starbucks Coffee Company
12/17
Exhibit 3 – Starbucks 2007 Income Statement
STARBUCKS CORPORATION CONSOLIDATED STATEMENTS OF CASH FLOWS
Sept 30, Oct 1, Oct 2, Fiscal Year Ended 2007 2006 2005
In thousands
OPERATING ACTIVITIES:Net earnings $ 672,638 $ 564,259 $ 494,370Adjustments to reconcile net earnings to net cash provided by operating activities:Cumulative effect of accounting change for FIN 47, net of taxes — 17,214 — Depreciation and amortization 491,238 412,625 367,207Provision for impairments and asset disposals 26,032 19,622 19,464Deferred income taxes, net (37,326) (84,324 ) (31,253)Equity in income of investees (65,743) (60,570 ) (49,537)Distributions of income from equity investees 65,927 49,238 30,919Stock-based compensation 103,865 105,664 — Tax benefit from exercise of stock options 7,705 1,318 109,978Excess tax benefit from exercise of stock options (93,055) (117,368 ) — Net amortization of premium on securities 653 2,013 10,097Cash provided/(used) by changes in operating assets and liabilities:
Inventories (48,576) (85,527 ) (121,618)Accounts payable 36,068 104,966 9,717Accrued compensation and related costs 38,628 54,424 22,711Accrued taxes 86,371 132,725 14,435Deferred revenue 63,233 56,547 53,276Other operating assets and liabilities (16,437) (41,193 ) (6,851)
Net cash provided by operating activities 1,331,221 1,131,633 922,915INVESTING ACTIVITIES:Purchase of available-for-sale securities (237,422) (639,192 ) (643,488)Maturity of available-for-sale securities 178,167 269,134 469,554Sale of available-for-sale securities 47,497 431,181 626,113Acquisitions, net of cash acquired (53,293) (91,734 ) (21,583)Net purchases of equity, other investments and other assets (56,552) (39,199 ) (7,915)Net additions to property, plant and equipment (1,080,348) (771,230 ) (643,296)
Net cash used by investing activities (1,201,951) (841,040 ) (220,615)FINANCING ACTIVITIES:Repayments of commercial paper (16,600,841) — — Proceeds from issuance of commercial paper 17,311,089 — — Repayments of short-term borrowings (1,470,000) (993,093 ) — Proceeds from short-term borrowings 770,000 1,416,093 277,000Proceeds from issuance of common stock 176,937 159,249 163,555Excess tax benefit from exercise of stock options 93,055 117,368 — Principal payments on long-term debt (784) (898 ) (735)Proceeds from issuance of long-term debt 548,960 — — Repurchase of common stock (996,798) (854,045 ) (1,113,647)Other (3,505) — —
Net cash used by financing activities (171,887) (155,326 ) (673,827)Effect of exchange rate changes on cash and cash equivalents 11,272 3,530 283
Net increase/(decrease) in cash and cash equivalents (31,345) 138,797 28,756
CASH AND CASH EQUIVALENTS:Beginning of period 312,606 173,809 145,053
End of the period $ 281,261 $ 312,606 $ 173,809
SUPPLEMENTAL DISCLOSURE OF CASH FLOW INFORMATION:Cash paid during the period for:Interest, net of capitalized interest $ 35,294 $ 10,576 $ 1,060Income taxes $ 342,223 $ 274,134 $ 227,812
See Notes to Consolidated Financial Statements.
8/6/2019 Starbucks Financial
http://slidepdf.com/reader/full/starbucks-financial 15/19
Starbucks Coffee Company
13/17
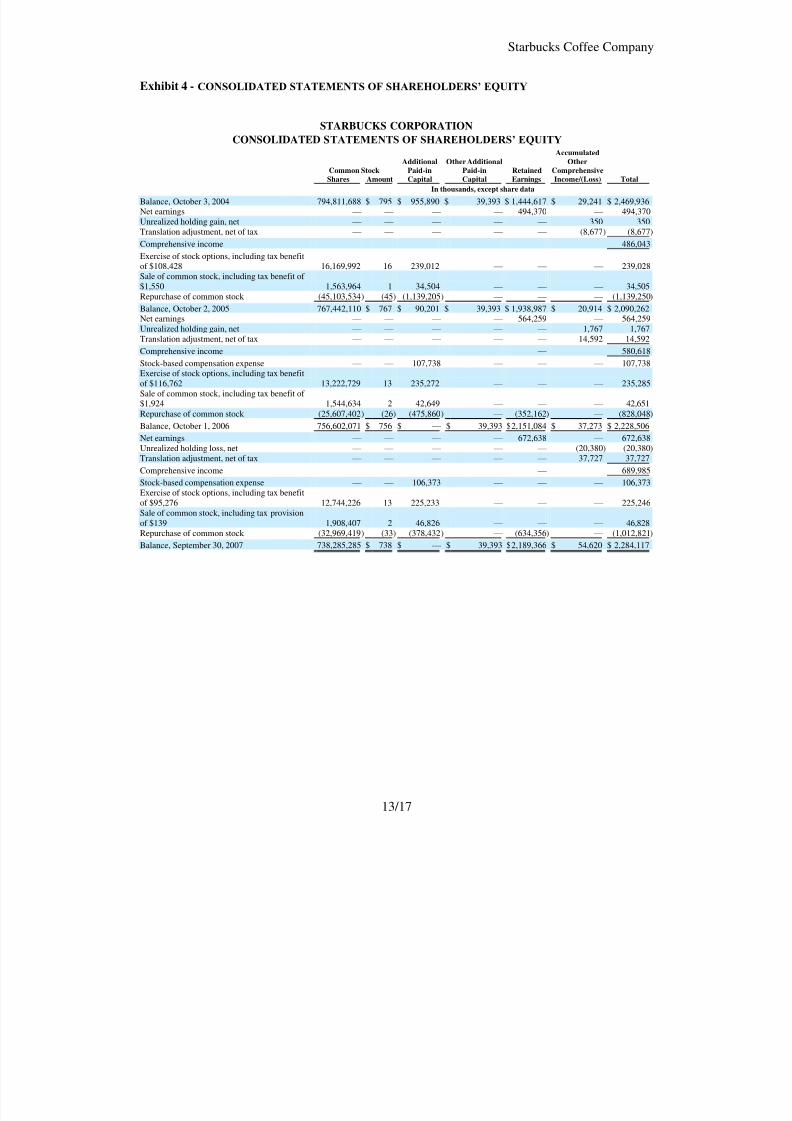
Exhibit 4 - CONSOLIDATED STATEMENTS OF SHAREHOLDERS’ EQUITY
STARBUCKS CORPORATION CONSOLIDATED STATEMENTS OF SHAREHOLDERS’ EQUITY
Accumulated Additional Other Additional Other
Common Stock Paid-in Paid-in Retained Comprehensive Shares Amount Capital Capital Earnings Income/(Loss) Total
In thousands, except share data
Balance, October 3, 2004 794,811,688 $ 795 $ 955,890 $ 39,393 $1,444,617 $ 29,241 $ 2,469,936Net earnings — — — — 494,370 — 494,370Unrealized holding gain, net — — — — — 350 350Translation adjustment, net of tax — — — — — (8,677) (8,677 )
Comprehensive income 486,043
Exercise of stock options, including tax benefitof $108,428 16,169,992 16 239,012 — — — 239,028Sale of common stock, including tax benefit of $1,550 1,563,964 1 34,504 — — — 34,505Repurchase of common stock (45,103,534) (45 ) (1,139,205) — — — (1,139,250 )
Balance, October 2, 2005 767,442,110 $ 767 $ 90,201 $ 39,393 $1,938,987 $ 20,914 $ 2,090,262Net earnings — — — — 564,259 — 564,259Unrealized holding gain, net — — — — — 1,767 1,767Translation adjustment, net of tax — — — — — 14,592 14,592
Comprehensive income — 580,618
Stock-based compensation expense — — 107,738 — — — 107,738Exercise of stock options, including tax benefitof $116,762 13,222,729 13 235,272 — — — 235,285Sale of common stock, including tax benefit of $1,924 1,544,634 2 42,649 — — — 42,651Repurchase of common stock (25,607,402) (26 ) (475,860) — (352,162 ) — (828,048 )
Balance, October 1, 2006 756,602,071 $ 756 $ — $ 39,393 $2,151,084 $ 37,273 $ 2,228,506
Net earnings — — — — 672,638 — 672,638Unrealized holding loss, net — — — — — (20,380) (20,380 )Translation adjustment, net of tax — — — — — 37,727 37,727
Comprehensive income — 689,985
Stock-based compensation expense — — 106,373 — — — 106,373Exercise of stock options, including tax benefit
of $95,276 12,744,226 13 225,233 — — — 225,246Sale of common stock, including tax provisionof $139 1,908,407 2 46,826 — — — 46,828Repurchase of common stock (32,969,419) (33 ) (378,432) — (634,356 ) — (1,012,821 )
Balance, September 30, 2007 738,285,285 $ 738 $ — $ 39,393 $2,189,366 $ 54,620 $ 2,284,117

8/6/2019 Starbucks Financial
http://slidepdf.com/reader/full/starbucks-financial 16/19
Starbucks Coffee Company
14/17
Exhibit 5 – FOOTNOTE TO BALANCE SHEET
DEBT
Footnote Note 9:
Revolving Credit Facility and Commercial Paper Program The Company has a $1 billion unsecured credit facility (the ―facility‖) with various banks, of which $100 millionmay be used for issuances of letters of credit. The facility is available for working capital, capital expenditures andother corporate purposes, which may include acquisitions and share repurchases. The facility is currently set toterminate in August 2011. The interest rate for borrowings under the facility ranges from 0.11% to 0.27% overLIBOR or an alternate base rate, which is the greater of the bank prime rate or the Federal Funds Rate plus 0.50%.The specific spread over LIBOR will depend upon the Company‘s long-term credit ratings assigned by Moody‘s andStandard and Poor‘s rating agencies and the Company‘s coverage ratio. The facility contains provisions requiringthe Company to maintain compliance with certain covenants, including a minimum fixed charge coverage ratiowhich measures the Company‘s ability to cover financing expenses. As of September 30, 2007 and October 1, 2006,the Company was in compliance with each of these covenants.
As of September 30, 2007, the Company had no borrowings under this credit facility. As of October 1, 2006, the
Company had $700 million outstanding under the facility with a weighted average interest rate of 5.5%.In March 2007, the Company established a commercial paper program (the ―program‖). Under the program theCompany may issue unsecured commercial paper notes, up to a maximum aggregate amount outstanding at any timeof $1 billion, with individual maturities that may vary, but not exceed 397 days from the date of issue. The programis backstopped by the Company‘s revolving credit facility, and the combined borrowing limit is $1 billion for theprogram and the facility. The Company may issue commercial paper from time to time, and the proceeds of thecommercial paper financing will be used for working capital, capital expenditures and other corporate purposes,which may include acquisitions and share repurchases.
As of September 30, 2007, the Company had $710 million in borrowings outstanding under the program with aweighted average interest rate of 5.4%.
As of September 30, 2007, the Company also had $12.9 million in letters of credit outstanding under the revolving
credit facility, leaving a total of $275 million in remaining borrowing capacity under the combined revolving creditfacility and commercial paper program. As of October 1, 2006, a letter of credit of $11.9 million was outstanding.
Long-term Debt In August 2007, the Company issued $550 million of 6.25% Senior Notes (the ―notes‖) due in August 2017, in anunderwritten registered public offering. Interest is payable semi-annually on February 15 and August 15 of eachyear, commencing February 15, 2008. The notes require the Company to maintain compliance with certaincovenants, which limit future liens and sale and leaseback transactions on certain material properties. As of September 30, 2007, the Company was in compliance with each of these covenants. The notes were priced at adiscount, resulting in proceeds to the Company of $549 million, before expenses.
In 1999, Starbucks purchased the land and building comprising its York County, Pennsylvania roasting plant anddistribution facility and assumed certain related loans from the York County Industrial Development Corporation.
As of September 30, 2007, $2.0 million remained outstanding on these loans. The remaining maturities of theseloans range from three to four years, with interest rates from 0.0% to 2.0%.
57
8/6/2019 Starbucks Financial
http://slidepdf.com/reader/full/starbucks-financial 17/19
Starbucks Coffee Company
15/17
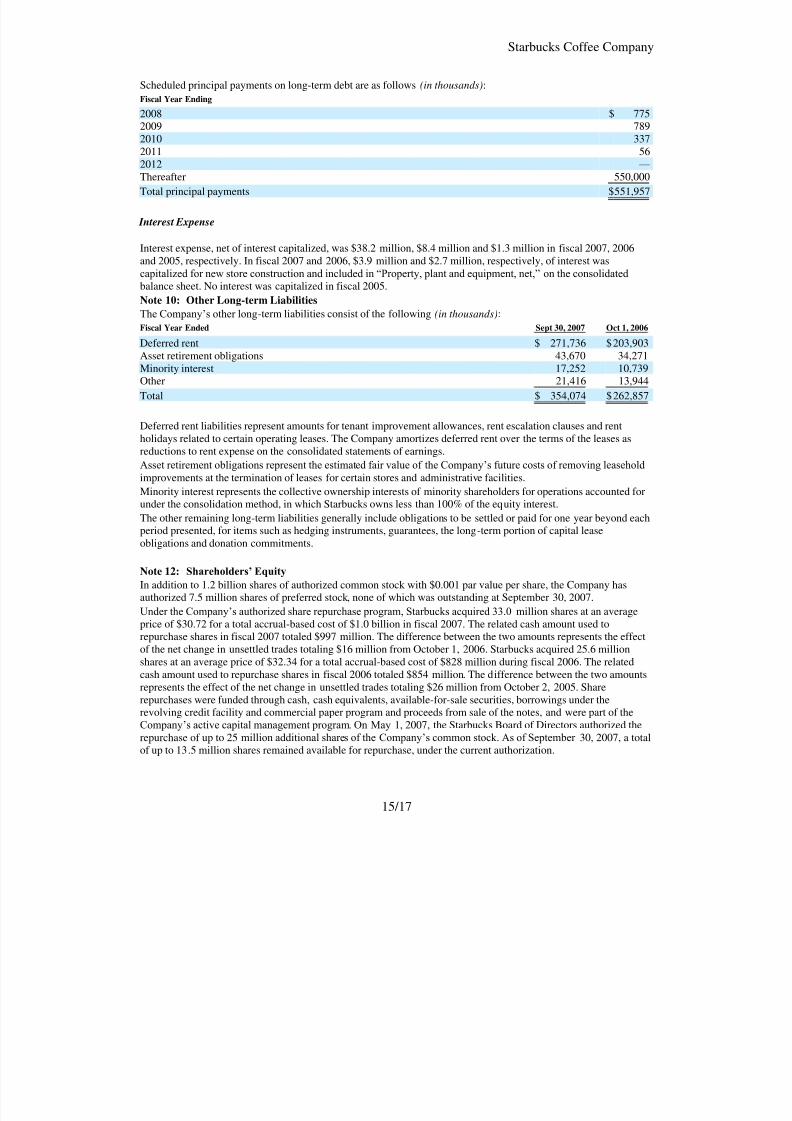
Scheduled principal payments on long-term debt are as follows (in thousands):
Fiscal Year Ending
2008 $ 7752009 7892010 3372011 56
2012 — Thereafter 550,000
Total principal payments $551,957
Interest Expense Interest expense, net of interest capitalized, was $38.2 million, $8.4 million and $1.3 million in fiscal 2007, 2006and 2005, respectively. In fiscal 2007 and 2006, $3.9 million and $2.7 million, respectively, of interest wascapitalized for new store construction and included in ―Property, plant and equipment, net,‖ on the consolidatedbalance sheet. No interest was capitalized in fiscal 2005.
Note 10: Other Long-term Liabilities The Company‘s other long-term liabilities consist of the following (in thousands):
Fiscal Year Ended Sept 30, 2007 Oct 1, 2006
Deferred rent $ 271,736 $ 203,903Asset retirement obligations 43,670 34,271Minority interest 17,252 10,739Other 21,416 13,944
Total $ 354,074 $ 262,857
Deferred rent liabilities represent amounts for tenant improvement allowances, rent escalation clauses and rentholidays related to certain operating leases. The Company amortizes deferred rent over the terms of the leases asreductions to rent expense on the consolidated statements of earnings.
Asset retirement obligations represent the estimated fair value of the Company‘s future costs of removing leaseholdimprovements at the termination of leases for certain stores and administrative facilities.
Minority interest represents the collective ownership interests of minority shareholders for operations accounted for
under the consolidation method, in which Starbucks owns less than 100% of the equity interest.The other remaining long-term liabilities generally include obligations to be settled or paid for one year beyond eachperiod presented, for items such as hedging instruments, guarantees, the long-term portion of capital leaseobligations and donation commitments.
Note 12: Shareholders’ Equity In addition to 1.2 billion shares of authorized common stock with $0.001 par value per share, the Company hasauthorized 7.5 million shares of preferred stock, none of which was outstanding at September 30, 2007.
Under the Company‘s authorized share repurchase program, Starbucks acquired 33.0 million shares at an averageprice of $30.72 for a total accrual-based cost of $1.0 billion in fiscal 2007. The related cash amount used torepurchase shares in fiscal 2007 totaled $997 million. The difference between the two amounts represents the effectof the net change in unsettled trades totaling $16 million from October 1, 2006. Starbucks acquired 25.6 millionshares at an average price of $32.34 for a total accrual-based cost of $828 million during fiscal 2006. The relatedcash amount used to repurchase shares in fiscal 2006 totaled $854 million. The difference between the two amountsrepresents the effect of the net change in unsettled trades totaling $26 million from October 2, 2005. Sharerepurchases were funded through cash, cash equivalents, available-for-sale securities, borrowings under therevolving credit facility and commercial paper program and proceeds from sale of the notes, and were part of theCompany‘s active capital management program. On May 1, 2007, the Starbucks Board of Directors authorized therepurchase of up to 25 million additional shares of the Company‘s common stock. As of September 30, 2007, a totalof up to 13.5 million shares remained available for repurchase, under the current authorization.

8/6/2019 Starbucks Financial
http://slidepdf.com/reader/full/starbucks-financial 18/19
Starbucks Coffee Company
16/17
Exhibit 6 – RATIO ANALYSIS
STARBUCKS CORP ANNUAL
RATIO REPORT
Statement ended in September 30, 2007.
2007 2006 2005 2004
LIQUIDITY
Current Ratio 0.79 0.79 0.99 1.81
Quick Ratio 0.34 0.35 0.41 1.06
Working Capital Per Share -0.62 -0.54 -0.02 0.76
Cash Flow Per Share 1.54 1.28 1.09 0.86
EFFICIENCY
Inventory Turnover 11.31 10.36 10.25 10.85
Receivables Turnover 36.75 37.52 38.49 41.58
Total Asset Turnover 1.93 1.96 1.84 1.73
Average Collection Period (Days) 10 10 9 9
Days to Sell Inventory 32 35 35 33
Operating Cycle (Days) 42 44 44 42
PERFORMANCE
Sales/Net Property, Plant & Equip 3.26 3.4 3.46 3.41
Sales/Stockholder Equity 4.12 3.49 3.05 2.14
PROFITABILITY
Operating Margin Before Depr (%) 15.01 15.25 16.39 15.8
Operating Margin After Depr (%) 10.05 10.27 11.05 10.34
Pretax Profit Margin (%) 11.22 11.64 12.5 11.75
Net Profit Margin (%) 7.15 7.47 7.76 7.38
Return on Assets (%) 12.59 13.13 14.07 11.52
Return on Equity (%) 29.45 26.09 23.65 15.79
Return on Investment (%) 23.57 25.92 23.47 15.76
Return on Average Assets (%) 13.77 14.64 14.32 12.76
Return on Average Equity (%) 29.81 26.93 21.66 17.14
Return on Average Investment (%) 26.39 26.73 21.57 17.11PROFITABILITY BASED ON CORE
EARNINGS
Return on Assets (%) 12.5 13.07 12.43 10.19Return on Equity (%) 29.24 25.98 20.89 13.97
Return on Investment (%) 23.4 25.81 20.73 13.95
Return on Average Assets (%) 13.67 14.58 12.65 11.29
Return on Average Equity (%) 29.6 26.81 19.14 15.17
Return on Average Investment (%) 26.2 26.62 19.05 15.14

8/6/2019 Starbucks Financial
http://slidepdf.com/reader/full/starbucks-financial 19/19
Starbucks Coffee Company
17/17
Exhibit 6 – RATIO ANALYSISContinued.
LEVERAGE
Interest Coverage Before Tax 26.09 82.64 613.65
Interest Coverage After Tax 16.98 53.38 381.36
Long-Term Debt/Common Equity (%) 24.17 0.2 0.22 0.15
Long-Term Debt/Shrhldr Equity (%) 24.17 0.2 0.22 0.15
Total Debt/Invested Capital (%) 44.31 31.5 13.45 0.18
Total Debt/Total Assets (%) 23.66 15.96 8.06 0.13
Total Assets/Common Equity 2.34 1.99 1.68 1.37
DIVIDENDS
Dividend Payout (%) 0 0 0 0
Dividend Yield (%) 0 0 0 0