star conference london - datalogic · star conference london 10 october 2017. disclaimer ... 2012...
TRANSCRIPT

STAR Conference
London
10 October 2017

Disclaimer
This document has been prepared by Datalogic S.p.A. (the "Company") for use during meetings with investors and
financial analysts and is solely for information purposes. The information set out herein has not been verified by
an independent audit company.
Neither the Company nor any of its subsidiaries, affiliates, branches, representative offices (the “Group”), as well
as any of their directors, officers, employees, advisers or agents (the “Group Representatives”) accepts any
responsibility for/or makes any representation or warranty, express or implied, as to the accuracy, timeliness or
completeness of the information set out herein or any other related information regarding the Group, whether
written, oral or in visual or electronic form, transmitted or made available.
This document may contain forward-looking statements about the Company and/or the Group based on current
expectations and opinions developed by the Company, as well as based on current plans, estimates, projections
and projects of the Group. These forward-looking statements are subject to significant risks and uncertainties
(many of which are outside the control of the Company and/or the Group) which could cause a material difference
between forward-looking information and actual future results.
The information set out in this document is provided as of the date indicated herein. Except as required by
applicable laws and regulations, the Company assumes no obligation to provide updates of any of the aforesaid
forward-looking statements.
Under no circumstances shall the Group and/or any of the Group Representatives be held liable (for negligence or
otherwise) for any loss or damage howsoever arising from any use of this document or its contents or otherwise
in connection with the document or the aforesaid forward-looking statements.
This document does not constitute an offer to sell or a solicitation to buy or subscribe to Company shares and
neither this entire document or a portion of it may constitute a recommendation to effect any transaction or to
conclude any legal act of any kind whatsoever.
This document may not be reproduced or distributed, in whole or in part, by any person other than the Company.
By viewing and/or accepting a copy of this document, you agree to be bound by the foregoing limitations.
2

Group Overview
3

Datalogic at a glance
▪ Global leader of barcode readers, mobile
computers, sensors, vision systems and laser
marking systems with cutting-edge solutions in
verticals market: Retail, Transportation &
Logistics, Manufacturing, Healthcare Industries
▪ Founded in 1972 by Romano Volta in Bologna,
Italy and listed on the STAR Segment of the Italian
Stock Exchange since 2001
▪ A large portfolio of more than 1,200 patents
▪ About 2,700 employees, of which 470 in R&D
▪ Direct presence in 30 countries worldwide selling
to 120 countries, with more than 1,000 partners
worldwide
4
2,700 EMPLOYEES
48%
EMEA
25%
AMERICAS
27%
APAC
30
Countries
WORLD PRESENCE
>1,200
Patents
2001
IPO
1972
Foundation

Over 40 years of Technological Innovation
5
2017 EXPANSION
2012
2015
2001
1988
1997
1972
2002
2011
FOUNDATION Established in Bologna
EXPANSION
Escort Memory Systems Inc.
IDWare Mobile Computing&Comm.
LISTINGListed on the STAR segment of
Italian Stock Exchange
INNOVATION
Acquisition of
Multiwave Photonics SA
Partnership with CAEN RFID Srl
Minec AB
Laservall SpA
Informatics Inc.
PSC Inc.
Datasensor SpA
Evolution Robotics Retail Inc.
Accu-Sort Systems Inc.
PPT Vision Inc.
EXPANSION
Set up new One Datalogic
Acquisition of
Soredi Touch Systems GmbH

A continuous improving Strategy
6
19901970
Pioneers New horizon “Il punto di Volta” Innovation to growth
2017
ONE DATALOGIC
First application of
barcode to airports
From entrepreneurial
to managerial company
Two Divisions:
ADC+IA & 7 Product
lines
Customer-Centric
organization
Foundation:
development and
manufacturing of
optic electronic
equipment for
automation
Starting of
international
expansion with first
branch in Germany
Focus on optical
readers and
barcodes
Consolidation of
international
footprint
New organizational
model to support
the continuous
international growth
Unceasing
international
expansion
Listing at the Italian
Stock Exchange
Acquisition of PSC
Consolidation of
Datalogic as a true
multinational company
with presence in 30+
countries around the
world
1980 2000
Photoelectric control
for automation
From a product-
oriented strategy to
a customer-centric
one. To ensure a
distinguished
customer service
and a deeper
knowledge of the
target industries,
the Company is
organized in four
Industry Units:
Retail,
Manufacturing, T&L
and Healthcare.

EMEA 53%
NORTH AMERICA
30%APAC 13%
7
A Wide Geographical Footprint
7
Note: Breakdown by area based on 1H2017 revenues
Direct presence in 30 countries
8 Manufacturing Sites 10 R&D Centers
3 DL LABS
LATIN AMERICA
4%

Stock and Governance
8
Market Segment: STAR MTA
Reuters Code: DAL.MI
Bloomberg Code: DAL IM
Outstanding Shares: 58,446,491
Share Par-Value: 0.52 Euro each
SHAREHOLDERS’ STRUCTURE
Ticker: DAL
Price (October 4, 2017): 30.52 Euro
Market Cap (October 4, 2017): 1.78 B Euro
Specialist: Intermonte SIM
Auditing Company: EY
DATALOGIC PRICE PERFORMANCE
64,65%
35,35%
Hydra SpA Free Float
60
80
100
120
140
160
180
200
04/01/2016 04/05/2016 04/09/2016 04/01/2017 04/05/2017 04/09/2017
DAL.MI FTSEMIB.MI ITSTAR.MI

Strategy
9
Unique Player across IA and ADC Markets
10
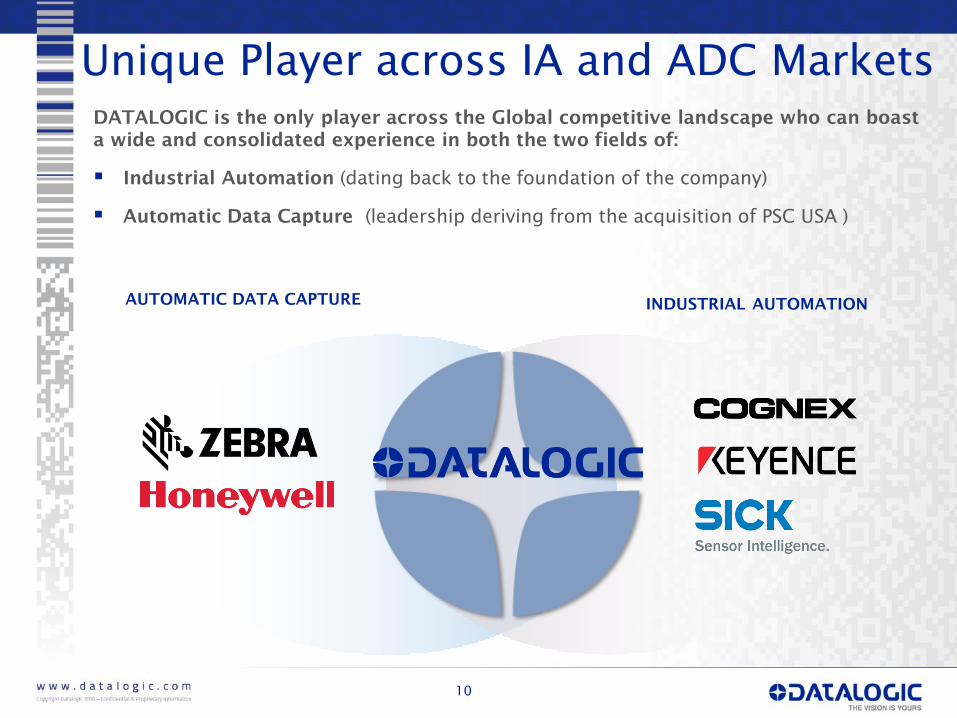
DATALOGIC is the only player across the Global competitive landscape who can boast
a wide and consolidated experience in both the two fields of:
▪ Industrial Automation (dating back to the foundation of the company)
▪ Automatic Data Capture (leadership deriving from the acquisition of PSC USA )
AUTOMATIC DATA CAPTUREINDUSTRIAL AUTOMATION

A New Organisation by Verticals…
11
11

12w w w . d a t a l o g i c . c o mCopyright Datalogic 2017 – Confidential & Proprietary Information
…with a Wide and Complementary Offer

Total Addressable Market
Source: VDC 2017 and Management estimates
Manufacturing
57%
Retail
22%
T&L
18%
Healthcare
3%
2017E
Total Addressable Market @ $9 BN
Healthcare
T&L
Retail
Manufacturing

14
Retail Manufacturing
Transport & Logistics Healthcare
Market Drivers
▪ E-commerce and multichannel-
related trends drive purchase of data
capture products
▪ Technology enhancement for
frictionless shopping
▪ Brick-and-mortar focus on
automation in warehouses and
distribution centers
▪ Industry 4.0 is pushing for multi-
technology adoption, product
interoperability and enhancement
self diagnostic capabilities for added
value solutions
▪ Advance traceability beyond barcode
▪ Trends toward Intralogistic solutions
and Robotic/AGV guidance
▪ E-commerce trends driving CEP &
Logistics
▪ Increasing detection & tracking
needs in the Airports
▪ Push on technology enhancements &
multi-technology integrated
solutions
▪ Compliance regulations
▪ Increasing needs for real-time
tracking of medical equipment, staff
& patients
▪ Move to Electronic Medical Records
(EMR) driving imager adoption

Datalogic’s offer along the value chain
Retail Flows and Applications T&L Flows and Applications
Manufacturing Flows and Applications Healthcare Flows and Applications
15

16
New One DATALOGIC Group Organization
Group CEO Informatics
Solution Net System
Inc.*
Retail & GCO Manufacturing T&L HealthCare
FinanceOperations
Business
Development
Human
Resources
Customer Service
LegalTechnology/Product
Innovation/R&D
Group Marketing
INDUSTRY UNITS
*The newco Solution Net System Inc. is the result from the spin-off of the Systems Business Unit.
IT

A clear new strategy
Moving from a product to
a Customer-centric
Company, leveraging on
our wide range of
products that is able to
fulfill our customers’
needs for both data
collection and process
automation and providing
end-to-end solutions
across the entire flow of
operations
Remain a product
company with new
emphasis on solutions to
satisfy the needs of End
Users in the following
Industries: Retail,
Healthcare, T&L and
Manufacturing
Become a significant
player in North America
and further establish in
APAC with a growing
presence in China
Consolidate our position
in EMEA
Keep on constantly
growing, above
market average, while
significantly
improving
profitability
17
THE SCOPE THE ADVANTAGETHE OBJECTIVE
17

Technologies and Products

Product Innovation and Development
19
* Are considered new products the products announced in the last 24 months
▪ New product development process
that starts from the Customers’
needs – 1st
milestone of the new
product development
▪ A large and growing portfolio of more
than 1,200 patents and pending
patent applications
▪ About 300 pending patent
applications in all jurisdictions
▪ In 2016 24.3% of revenues from
new products*
▪ 10 Research & Development Centers
▪ Around 470 people employed in R&D,
of which more than 400 Engineers
Portal Scanning
Digital Watermarking
RIDA
DL-Axist
Joya Touch

NRF – Retail’s big show 2017
20
VISITORS
▪ 655 registered leads
(more than doubled vs. 2016)
TOP VISITED PRODUCTS
▪ Jade
▪ Joya Touch
NEW CONCEPT AND PRODUCTS
▪ Joya Touch Android 6
▪ Powerscan Retail
▪ Rida – companion scanner
▪ RFID indoor Geo-Location
▪ Digital Tailor – 3D imaging body
scanner
▪ New Single Plane scanners
▪ New LaneHawk – loss prevention
Market split by Technology
21
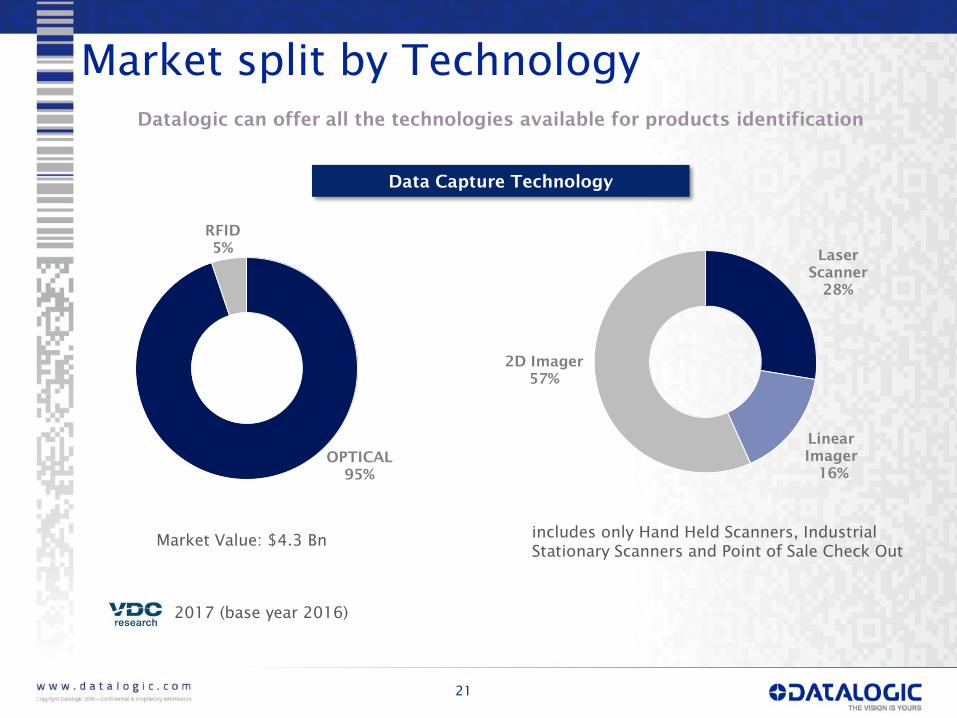
Datalogic can offer all the technologies available for products identification
2017 (base year 2016)
Data Capture Technology
includes only Hand Held Scanners, Industrial
Stationary Scanners and Point of Sale Check OutMarket Value: $4.3 Bn
Laser
Scanner
28%
Linear
Imager
16%
2D Imager
57%
OPTICAL
95%
RFID
5%

22
New Products launched in 2017
HALOGEN™
DE2012-WA-DL
MEMOR™
X3 HC
MATRIX 300N™
POLARIZED
Impact 11.10
release
RFID solution
PowerScan
Retail
MATRIX 120™
Q2
Q1
Joya Touch
A6
QuickScan Lite
QW2400
Magellan 3400 Vsi
Magellan 3500 HSi
PowerScan 9100
(with breakthrough scan
engine inside)
SG4 Fieldbus
Q3

Financials

Improvements across the whole P&L
24
Revenues 299.3 281.8 6.2%
Gross Operating Margin 142.3 130.9 8.6%
%on Revenues 47.5% 46.5%
Operating expenses (98.3) (94.9) 3.6%
%on Revenues (32.8%) (33.7%)
EBITDA 51.8 45.0 15.3%
Ebitda margin 17.3% 16.0%
EBIT 41.2 35.3 16.6%
Ebit margin 13.8% 12.5%
EBT 37.2 32.8 13.5%
Taxes (7.9) (6.6) 20.0%
Net Income 29.3 26.2 11.9%
% on Revenues 9.8% 9.3%
Exchange Rate 1.0830 1.1159
H12017 H12016 Var%€ mln
▪ Revenues up 6.2% to €299.3
mln (+4.8% at constant
exchange rate)
▪ GOM steady improving
trend QoQ, at 47.5%
▪ R&D on revenues from 8.6%
to 8.8%
▪ Timing effects on R&D &
distribution costs
▪ EBITDA margin to 17.3%
notwithstanding negative
EUR USD FX
▪ Forex and higher gross
debt effect on financial costs
▪ Stable tax rate at ~ 21%
15.518.7 17.9 17.4
69.5
15.718.6 18.8
20.7
73.8
18.8
26.1
21.723.7
90.3
20.8
31.1
51.8
14.3%16.1% 15.4%
14.0% 15.0%12.8% 13.8% 14.1% 14.4% 13.8% 13.9%
17.8%15.5% 15.3% 15.7% 14.7%
19.7%17.3%
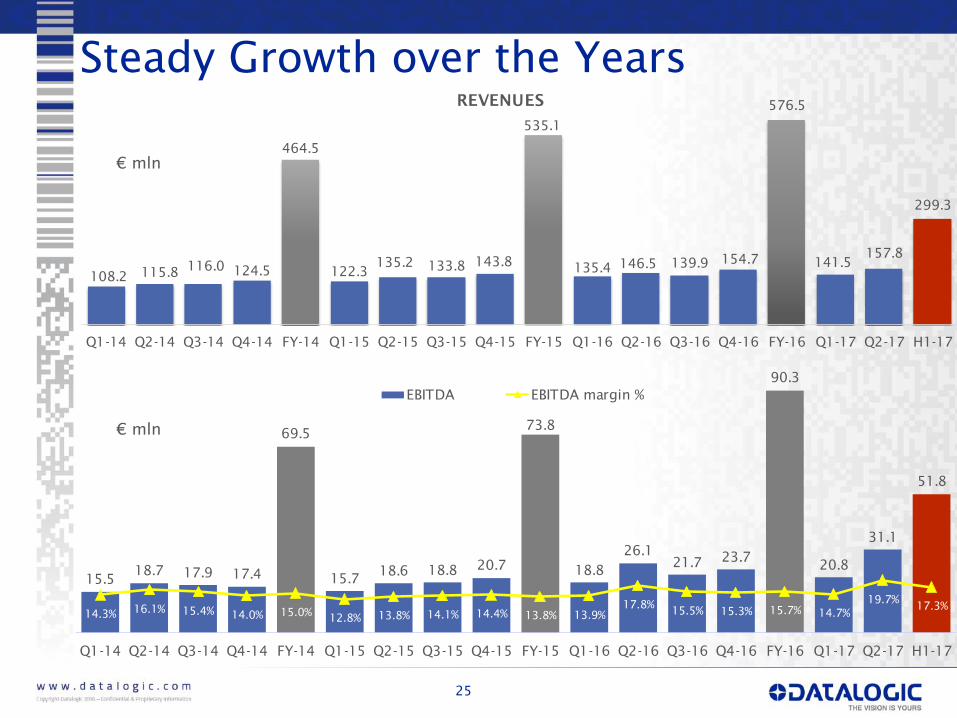
Q1-14 Q2-14 Q3-14 Q4-14 FY-14 Q1-15 Q2-15 Q3-15 Q4-15 FY-15 Q1-16 Q2-16 Q3-16 Q4-16 FY-16 Q1-17 Q2-17 H1-17
EBITDA EBITDA margin %
108.2115.8
116.0124.5
464.5
122.3135.2 133.8
143.8
535.1
135.4146.5 139.9
154.7
576.5
141.5157.8
299.3
Q1-14 Q2-14 Q3-14 Q4-14 FY-14 Q1-15 Q2-15 Q3-15 Q4-15 FY-15 Q1-16 Q2-16 Q3-16 Q4-16 FY-16 Q1-17 Q2-17 H1-17
REVENUES
25
Steady Growth over the Years
€ mln
€ mln
Group Revenues by country
26
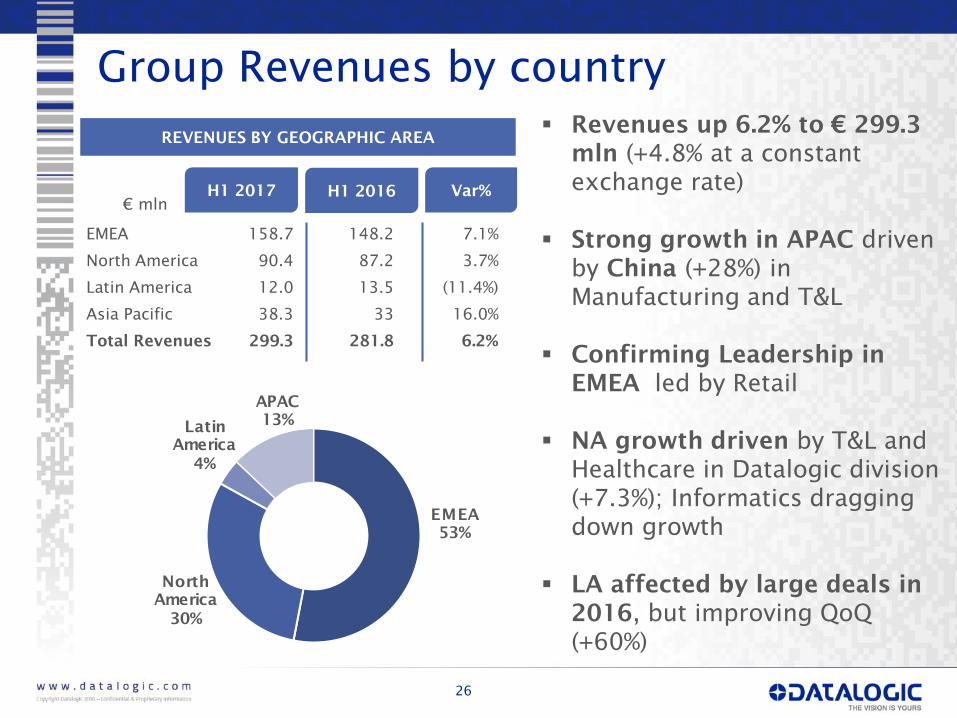
▪ Revenues up 6.2% to € 299.3
mln (+4.8% at a constant
exchange rate)
▪ Strong growth in APAC driven
by China (+28%) in
Manufacturing and T&L
▪ Confirming Leadership in
EMEA led by Retail
▪ NA growth driven by T&L and
Healthcare in Datalogic division
(+7.3%); Informatics dragging
down growth
▪ LA affected by large deals in
2016, but improving QoQ
(+60%)
REVENUES BY GEOGRAPHIC AREA
H1 2017 H1 2016
€ mln
EMEA
53%
North
America
30%
Latin
America
4%
APAC
13%
EMEA 158.7 148.2 7.1%
North America 90.4 87.2 3.7%
Latin America 12.0 13.5 (11.4%)
Asia Pacific 38.3 33 16.0%
Total Revenues 299.3 281.8 6.2%
Var%

Group Revenues & EBITDA by division
27
▪ Datalogic Division over performing
Group growth driven by a double digit
growth of Fixed Retail Scanners, ID and
Machine Vision
▪ Solution Net Systems, keeps on steady
growing (+ 6.3%), and profitability
turnaround
▪ Informatics still in a downward trend,
though improving on a quarterly basis
REVENUES BY DIVISION
H12017 H12016€ mln
EBITDA BY DIVISION
Datalogic 51.3 46.1
Solution Net Systems 0.8 (0.9)
Informatics (0.3) (0.3)
Total Group 51.8 45.0
H12017 H12016
Datalogic
93%
Solution Net
Systems
3%
Informatics
4%Var%
Datalogic 279.2 260.2 7.3%
Solution Net
Systems10.6 10.0 6.3%
Informatics 11.2 12.8 (11.9%)
Adjustments (1.7) (1.0) n.m.
Total Revenues 299.3 281.8 6.2%

28
Focus on Datalogic Division
DL Revenues Breakdown by Industry DL Revenues Breakdown by Geo Area
Retail Manufacturing T&L Healthcare
• €74.0 mln (+10.7%)
• Growth driven by
China, over 60%, and
North America, +8%
• €27.8 mln (+5.3%)
• Double digit growth in
Q2 (+14.1%) in all main
areas. China and North
America the leading
Geos
• €16.1 mln (+74.0%)
• The fastest growing
sector driven by large
projects with a US top
hospital chains
• €137.4 mln (-0.4%)
• +11% YoY in EMEA
•Growth recovery
expected through
new products
(*)The Channel (Unallocated) includes revenues not directly attributable to the 4 identified industries.
RTL
49%
MFG
26%
T&L
10%
HC
6%
CHANNEL
(Unallocated)*
9%
EMEA
57%
North
America
25%
Latin
America
4%
APAC
14%

45.0
(5.1)
5.1
6.81.9
2.5
(0.7)
(5.4)
1.7 51.8
H1 2016 Price Volume Mix Service COGS FX Structure SNS/INF H1 2017
EBITDA: actual vs last year
29
Of which
Material Saving 2.9
Receiving & Packing 1.2
Ind Fix OH -1.0
Positive Items Negative Items
€ mln
-1.8% on
2017 DL
business
revenues
16.0 % on
Group
Revenues
17.3 % on
Group
Revenues

30
Consolidated Balance Sheet
Dec 2016 Jun 2017 Dec 2016 Jun 2017
Total Fixed Assets 371.7 354.0Net Financial
Position(3.5) (5.5)
Trade receivables 75.5 87.1
Net Equity 336.4 330.2
% on 12m rolling sales 13.1% 14.7%
Inventories 82.3 88.5
% on 12m rolling sales 14.3% 14.9%
Trade payables (104.6) (105.4)
% on 12m rolling sales -18.1% -17.7%
Trade Working
Capital 53.2 70.2
% on 12m rolling sales 9.2% 11.8%
Other
assets/liabilities(92.1) (99.4)
Net Invested Capital 332.9 324.8 Total Sources 332.9 324.8

3.5
51.8
(16.9)
(5.1)
(3.5)
(4.0)
(17.4)
(2.9)
5.5
Net Debt
Dec 16
EBITDA Ch TWC Capex Taxes Net Financial
Charges
Dividend
Paymemt
Other Net Debt
Jun 17
Net Debt Analysis: December’16 – June’17
31
Of which:
Electronics machineries / Software (2.1)
Machineries and equipment (2.1)
Offices refurbishment (0.5)
Real estate asset disposal (Germany) 0.9
Acc. Receivable (11.6)
Inventory (6.1)
Acc. Payable 0.8
2.0% on
Revenues
€ mln
Positive Items
Negative Items
▪ Strong pipeline of new products in H2 particularly
in in the Retail and Manufacturing industries
32
2017 Outlook
▪ Keep on growing in revenues at rates substantially in line with H1
▪ Strong focus on gross operating margin to maintain a sound profitability
▪ Increasing R&D & Distribution operating expenses in H2 to boost
further growth & maintain leadership in the market
▪ Cash Generation through NWC improvement
▪ T&L: keep growing in main Geo Areas, capturing
ecommerce & CEP trends
▪ Retail: growth recovery through strong pipeline of
new products
▪ HC: enlarging customer base in North America
▪ Manufacturing: keep on steady growing in China and
other main Geo Areas, backed by strong demand for
automation

33
IR CONTACTS
IR Manager
Vincenza Colucci
CDR Communication Srl
Tel. +39 335 6909547
IR Assistant
Daniela Giglioli
Tel. +39 051 3147109
Fax +39 051 3147205
E-mail [email protected]
Via Candini, 2
40012 Lippo di Calderara di Reno
Bologna – Italy
NEXT EVENTS
Contact
www.datalogic.com
DATALOGIC ON LINE
November 13th
, 2017
9M results