stantec consulting ltd. 400 - 1331 clyde avenue, ottawa on
TRANSCRIPT

Stantec Consulting Ltd. 400 - 1331 Clyde Avenue, Ottawa ON K2C 3G4
January 17, 2018 File: 160401302
Attention: John Bernier Planner – Development Review - South 110 Laurier Avenue West Ottawa, Ontario K1P 1J1
Dear John,
Reference: 3500 Hawthorne Road Transportation Impact Study Response to Transportation Comments / Public Concerns
Further to our meeting of January 3, 2018, the following provides a response to the transportation comments from City staff received on December 4, 2017, including responses to concerns raised by the public related to this planning application.
The transportation-related comments that require resolution are summarized into the following topics:
1) Speeding concerns raised by the public;
2) Collisions related to the southbound right turn maneuver (i.e. from Hawthorne to Hunt Club)
3) Proposed Geometric modifications; and
4) Sight lines at the site accesses.
Speeding Concerns
At earlier public engagements related to this development application, members of the public expressed concerns related to the perception of high travel speeds in the area.
The posted speed limit along Hawthorne is 70 km/h and the posted speed limit along Hunt Club is 80 km/h.
The transportation environment near the site is conducive to higher travel speeds. Hawthorne Road, north of Hunt Club Road, has a five-lane cross-section with two through lanes in each direction plus a centre two-way left turn lane. The travel lanes are wide, the roadway cross-section is wide and straight and this type of roadway environment increases the level of comfort for motorists to travel at higher speeds. In addition, the risk of Police enforcement of traffic speeds is relatively low.

January 17, 2018 John Bernier Page 2 of 5
Reference: 3500 Hawthorne Road Transportation Impact Study, Response to Transportation Comments / Public Concerns
Similarly, Hunt Club Road is a four-lane divided arterial road with very few private accesses or intersections throughout the corridor. The low volume of accesses / intersections creates very little friction along the corridor, again, increasing the comfort for motorists to travel at higher speeds because the expectation is that they will not encounter many vehicles turning to / from sides streets or private accesses. Furthermore, now that Hunt Club road has an interchange with Highway 417, motorists who are exiting the Highway may still be transitioning from their Highway travel speed as they enter the more urbanized environment presented along Hunt Club Road.
What effect will the proposed development have on operating speeds?
The proposed development will contribute to a more urbanized or built-environment. As development fills in the vacant parcels around Hunt Club / Hawthorne, the intersection will act as a “gateway” or a transition area between the Highway / rural environment and the urban area of the City. It stands to reason, therefore, that the proposed development will contribute to lower operating speeds along Hunt Club Road and Hawthorne Road.
Furthermore, the proposed development will add two new accesses: a right-in/out access to Hawthorne Road and an egress to Hunt Club. These site accesses will create addition friction along the corridors which will also contribute to lower operating speeds.
Collisions
Stantec’s November 15, 2017 letter-response to City comments summarized the results of a collision analysis at the Hawthorne Road / Hunt Club intersection. The collision analysis identified a high number of collisions associated with the southbound right turning maneuver (i.e. turning from the southbound right turn on Hawthorne Road to then proceed westbound along Hunt Club). During the three-year period between 2013 and 2015 it was found that 10 collisions occurred from within this maneuver. Upon closer examination, it was found that all 10 of these collisions occurred after the Hunt Club Road interchange with Highway 417 became open and fully operation in August of 2014.
What effect will the proposed development have on the collisions experienced by the southbound right turn maneuver?
As recommended in Stantec’s March 2017 3500 Hawthorne Road Transportation Impact Study, the existing southbound right turn channel is proposed to be modified to reflect a “smart channel” design. Not only will the proposed modification increase the distance between the southbound right turn lane and the proposed egress to Hunt Club Road, a smart channel will decrease the angle of the channelized right turn to approximately 70 degrees. The intended goal of the smart channel is to a) reduce pedestrian crossing distance and therefore, pedestrian exposure to vehicles; and b) to improve vehicle to vehicle interactions since the new approach angle affords drivers with a better view of the traffic they are to merge with.

January 17, 2018 John Bernier Page 3 of 5
Reference: 3500 Hawthorne Road Transportation Impact Study, Response to Transportation Comments / Public Concerns
The Region of Waterloo, for example, found that smart channels have shown an 86% reduction in all rear-end collisions and a 73% reduction in rear-end collisions causing injury. The Region of Waterloo also highlights the advantage to pedestrians as the design helps to reduce vehicle speeds.
Image Source: http://www.regionofwaterloo.ca/en/safehealthycommunity/trafficsafety.asp#rightturnsmartchannel
A journal paper by Shattler and Hanson from Bradley University in Illinois that was published by the Transportation Research Board found through a before-and-after analysis a 44% reduction in total intersection collisions and 60% reduction in right-turn approach collisions after implementing the smart channel design. The journal paper is attached in Attachment A. A journal paper by Sayed, Zaki, and Autey studied three smart channels in British Columbia and observed a 67% reduction in traffic conflicts after implementing the smart channel design. The journal paper is attached in Attachment B. As shown in recent research, the proposed implementation of a smart channel design for the southbound right turn lane at the Hunt Club Road / Hawthorne Road intersection is expected to significantly reduce collisions for the southbound right turn movement and the intersection as a whole.
What effective will the proposed egress to Hunt Club have on collisions?
The proposed site egress to Hunt Club Road will introduce a conflict point on Hunt Club Road where one currently does not exist. As such, vehicles exiting the site have the potential to come into conflict with vehicles on Hunt Club Road, which increases the potential for collisions. However, this

January 17, 2018 John Bernier Page 4 of 5
Reference: 3500 Hawthorne Road Transportation Impact Study, Response to Transportation Comments / Public Concerns
is generally the case with most developments that introduce new site access/egress so this situation is not unique to the subject development.
In summary, while the smart channel design has the potential to significantly reduce collisions experienced by the southbound right turn movement at the Hawthorne Road / Hunt Club Road intersection, the site egress to Hunt Club Road has the potential to increase conflicts / collisions on Hunt Club Road.
Proposed Geometric Modifications
The proposed geometric modifications, which will be submitted through a Roadway Modification Approval package, are summarized as follows:
• Reconstruction of the channelized southbound right turn lane (Hawthorne to Hunt Club) to reflect a smart channel design that accommodates a WB-20 design vehicle;
• Modifications to the existing median on Hawthorne Road to extend 15m north of the proposed site access; and
• Extension of the existing southbound right turn lane across the site frontage to accommodate the full length of a WB-15 design vehicle turning into the site access. Minor modifications may be required to the throat width and/or curb radii of the access to Hawthorne.
Sight Lines at the Site Accesses
Sight lines at the proposed site accesses were examined in the field to determine if adequate sight distance could be achieved.
At the proposed access to Hawthorne Road and facing north, it was found that two trees within the road right of way (i.e. between the private fence and the sidewalk) have the potential to obstruct sight lines (see image to right), particularly during summer months when the trees are in full bloom. It is recommended to cut down or trim back these trees such that they do not protrude beyond the hydro poles.
Sight lines from the proposed egress to Hunt Club Road were found to be adequate.
Remove or trim back two trees.

January 17, 2018 John Bernier Page 5 of 5
Reference: 3500 Hawthorne Road Transportation Impact Study, Response to Transportation Comments / Public Concerns
********
We trust the above addresses the City’s outstanding Transportation Comments related to the development application at 3500 Hawthorne Road, including concerns raised by the public. A Roadway Modification Approval submission is being prepared to reflect the geometric modification summarized in this letter and will be submitted shortly. Should you have any further questions or concerns related to the above, or should you wish to discuss in more detail, please feel free to contact the undersigned at your earliest convenience.
Regards,
Stantec Consulting Ltd. Robert Vastag, RPP Senior Transportation Planner Phone: 613-724-4354 [email protected]
Attachments: Attachment A: “Safety Impacts of a Modified Right Turn Lane Design at Intersections”,
Schattler and Hanson, Department of Civil Engineering and Construction, Bradley University, Illinois, November 2015.
Attachment B: “A Novel Approach for Diagnosing Road Safety Issues Using Automated
Computer Vision Techniques”, Sayed, Zaki and Autey, Department of Civil Engineering, University of British Columbia, Vancouver, BC, May 2013.

Reference: 3500 Hawthorne Road Transportation Impact Study, Response to Transportation Comments / Public Concerns
Attachment A: “Safety Impacts of a Modified Right Turn Lane Design at Intersections”, Schattler and Hanson, Department of Civil Engineering and Construction, Bradley University, Illinois, November 2015.

Safety Impacts of a Modified Right Turn Lane Design at Intersections 1 2 3
4 Kerrie L. Schattler, Ph.D. 5 Professor 6 Department of Civil Engineering and Construction 7 BRADLEY UNIVERSITY 8 1501 West Bradley Avenue 9
Peoria, IL 61625 10 Telephone: (309) 677-2779, Fax (309) 677-2867 11
Email: [email protected] 12 13 14 15
Trevor Hanson 16 Graduate Research Assistant 17
Department of Civil Engineering and Construction 18 BRADLEY UNIVERSITY 19 1501 West Bradley Avenue 20
Peoria, IL 61625 21 Telephone: (309) 677-2942, Fax (309) 677-2867 22
Email: [email protected] 23
24
25 26
27 28 29
30 31
32 This paper is being submitted for presentation and publication at the 95
th Annual Meeting of the 33
Transportation Research Board, January 2016, Washington, D.C. 34
35
36 Word Count = 5,424 + 2000 (8 x 250) = 7,424 37 38 39 Submission Date: November 15, 2015 40
Schattler and Hanson 2
ABSTRACT 1 From 2006 to 2014, ten right turn approaches in the Peoria, Illinois area were selected and 2 reconstructed with a modified right turn lane design. The major purpose of the modified design 3 was to improve the line of sight for passenger vehicles attempting to turn right, while also 4
accommodating semi-tractor trailer trucks. While the actual changes varied among intersections, 5 the final result at each was an improvement to the approach angle for right turning vehicles 6 stopped to view cross traffic. The authors of this paper are involved in funded research to study 7 the impacts of the modifications, utilizing a driver behavior analysis and a crash-based safety 8 evaluation. The driver behavior field investigations, which included both a comparative test and 9
control analysis at ten sites, and a before and after analysis at three sites, indicated that line of 10 site and approach angle was improved due to less drivers requiring exaggerated head turns to 11
complete the right turn, less roll and go stops, and more vehicles stopping at the stop bar when a 12 stop was required. Additionally, the crash-based safety analysis, using the Empirical Bayes 13 method revealed statistically significant reductions in total intersection crashes and right turn 14 related crashes at the subject approaches after the modifications were made. Based upon these 15
results, it is recommended that improving the right turn approach angle by reducing the skew of 16 the right turn approach be considered as a safety measure for sites experiencing right turn related 17
crashes. 18
19
INTRODUCTION 20 According to NHTSA, intersection-related crashes account for approximately 47% of all crashes 21 and 27% of fatal crashes in the United States (1). Within Illinois they accounted for 22
approximately 39% and 26% of total and fatal crashes, respectively (2). Beyond this, FHWA 23
estimates that intersection related crashes add up to $40 billion annually in societal costs (3). 24
Transportation professionals commonly conduct studies to examine intersection designs and 25 determine how they correlate to specific crash types. Of recent concern is the exclusive right turn 26
lane design and right turn crash experience. Historically, exclusive right turn lanes have been 27 associated with improved safety since they separate turning vehicles from through traffic. There 28 are different types of geometric configurations for right turn lanes based on the design elements 29
used and method of control of the right turn movement including: right turn lane with pavement 30 marking, right turn lane with channelized island, and other variations. Some engineers think that 31
right turn lanes with certain configurations may not provide the safety benefit they once 32 believed, especially for right turn lanes with channelized islands. Some hypothesize that when 33
channelized islands and turning roadways are used in the design, rear-end crashes may increase 34
due to "collisions with vehicles stopping at the end of the turning roadway, or to drivers being 35
more focused on looking upstream in preparation of the merging task rather than scanning to the 36 right for potential pedestrians" (4). 37 When designing right turn lanes on state routes, since they are often designated as class I and 38 II truck routes, regardless of truck volume and percentage, they must be designed to 39 accommodate semi-tractor trailer trucks as the design vehicle (WB-67). In many states including 40
Illinois, and as per the AASHTO Policy on Geometric Design of Highways and Streets (5), this 41 results in a right turn lane design with large turning radius (200-50-600 foot three-centered 42 curve) and a channelized corner island, especially if trucks encroaching into other lanes is 43 discouraged in the design. When the intersection angle is 90 degrees, this radius may place 44 passenger vehicles at an excessive approach angle to the intersection. If the intersection is 45

Schattler and Hanson 3
skewed, the approach angle for right turning passenger vehicles may pose further challenges due 1 to reduced sight distance. 2 3
BACKGROUND 4 A study performed in Texas examined the vehicle speeds associated with various right turn lane 5 designs as well as the crash experiences of the various designs. It was found that both the 6 approach speed and speed of vehicles in the middle of the turn increased with larger turn radii. 7 Additionally, the channelization of the turn lane resulted in lower approach speeds but slightly 8 increased speeds within the turn. The crash-based portion of this study, based on three years of 9
data at nine sites in Texas, found that most right turn rear-end crashes occurred at channelized 10 turn lanes, while shared through-right lanes experienced the lowest number of crashes (4). The 11
results of this study supported the observations of a similar study performed by Dixon et al. (6). 12 This study examined two years of crash data for seventy right turn movements. Final results 13 found that shared through-right lanes experienced the lowest number of right turn related crashes 14 per site, while exclusive right turn lanes with raised islands (channelized turn lanes) experienced 15
the most. 16 A study conducted by Harwood sought to investigate the safety effectiveness of installing 17
left and right turn lanes for at-grade intersections. The results of this study revealed that 18 signalized and unsignalized intersections in both rural and urban areas experienced reductions in 19 total crashes with the addition of a right turn lane (7). It should be noted however, that this study 20
did not examine the actual design of the right turn lane added. 21 Tarawneh published findings examining right turn on red (RTOR) maneuvers, and sought 22
to determine the effects of the right turn geometry as well as age and gender on these maneuvers. 23
This study examined driver behavior by whether a RTOR was attempted, use of side mirrors to 24
make ROTR, whether a RTOR was actually performed, complete stop or not before RTOR, right 25 turn free flow speed, and post turn accelerations. Additionally, the impact of turn radii were 26
measured by entrance, center, and exit distances from the curb; judged by the front right wheel at 27 established points along the curve. Results found that drivers 75 years and older are less likely to 28 attempt ROTR, use side mirrors when attempting ROTR, and also turn right at slower speeds. 29
Additionally it was found that at channelized right turn lanes, younger drivers are more likely to 30 use side mirrors for ROTR maneuvers, make a RTOR without stopping, and turn at higher 31
speeds. With regards to geometrics, it was found that larger radii resulted in turn paths being 32 more in line with the pavement edge, and higher turn speeds (8,9). 33
Focusing on intersection skew, a study by Garcia examined line of site conditions to 34
identify undesirable levels of intersection/vehicle skew. It was found that with intersection skews 35
between 40 and 55 degrees, the driver head turn required to view cross traffic is difficult for 36 drivers (specifically older drivers) and outside mirrors do not provide vision of the intersecting 37 streets (10). Additionally, the ITE Traffic Engineering Handbook proposes that while 90 degrees 38 intersections are always preferred, it is undesirable to ever skew intersections below 75 degrees 39 (11). ITE’s recommended practice for context sensitive solutions suggests that the head-turn 40
angle for drivers turning right should be less than 140 degrees to improve pedestrian safety in 41 right turn maneuvers (12). 42
A study by Potts et al. created models examining various types of right turn related 43 crashes (13). Significant findings from the study found that channelized right turn lanes had a 44 lower crash frequency than right turn lanes without channelization, but greater than shared 45

Schattler and Hanson 4
through-right lanes. It was also found that conventional right turn lanes have 70-80% more 1 pedestrian crashes. 2
Sayed et al. conducted a safety evaluation of Smart Channels (modified right-turn 3 channels that reduce the right-turn angle to approximately 70 degrees) at three right turn 4
approaches in British Columbia by observing traffic conflicts at the improved locations. The 5 three test approaches were all cross streets to a major thoroughfare. The authors state that the 6 goal of the Smart Channels is to “reduce the pedestrian crossing distance which can lead to 7 shorter distance exposure, shorter signal cycles, and reduced potential for pedestrians to be in 8 conflict with vehicles” (14) as well as to improve “vehicle to vehicle interactions since the new 9
approach angle affords drivers a better view of the traffic stream they are to merge with” (14). 10 The authors collected before and after traffic conflict data at the three sites and one control site, 11
and concluded that an overall 67% reduction in traffic conflicts was observed, significant at 90% 12 level of confidence (14). 13
Most of these research papers stated that more studies are needed to provide additional 14 insights on the safety effects of different right turn treatments. Research papers that investigate 15
the safety benefits of converting existing right turn lanes with traditional designs to alternative 16 designs on state routes, based on analysis of traffic crashes, were not found in the literature. 17
Thus, this research, containing an analysis of traffic crashes and driver behavior at the improved 18 intersections in the Peoria area, contributes to the state-of-the-art and may also assist 19 transportation agencies in determining the safety implications of right turn lane designs. 20
21
STUDY PURPOSE AND METHODOLOGY 22 The Illinois Department of Transportation (IDOT) commissioned a research study in the fall of 23
2011 to evaluate the safety impacts at ten intersection approaches in the Peoria, Illinois area that 24
were reconfigured to improve the approach angle. The effectiveness evaluation involves both a 25 field observational study of driver behavior and a crash-based evaluation at the study 26
intersections. 27 Overall the changes made to the study approaches included sharpening the flat approach 28
angle typical in the traditional designs, reducing the radius, adjusting the stop bar position, and 29
modifying the corner island to improve safety by increasing the line of sight of approaching 30 through traffic. The actual changes made to each intersection varied depending upon the initial 31
design as well as site specific conditions. At some locations, the corner island was removed, and 32 at other locations, pavement markings were provided to delineate the path for passenger vehicles. 33
Figure 1 shows a generic sketch of the traditional and modified right turn lane designs. 34
The traditional design has a flatter approach angle combined with a larger radius, which 35
may increase the speed of right turning vehicles. The flatter approach angle also requires a large 36 degree of head rotation by the driver to screen for oncoming traffic from the left. The modified 37 design has several expected advantages compared to the traditional. It may result in slower 38 speeds that provide more safety for other vehicles and pedestrians, and it may require a 39 significantly smaller degree of head rotation by drivers. This reduced head rotation would make 40
it easier for drivers to monitor oncoming traffic and make safe merging decisions. 41

Schattler and Hanson 5
FIGURE 1 Generic right turn lane configuration for traditional and modified design. 1 Adapted from an illustration in ITE’s Transportation and Land Development (15) 2
3 The purpose of this paper is to present the results of the field investigations of driver 4
behavior and the crash-based effectiveness evaluation. The field investigation of driver behavior 5
portion of the research sought to quantify differences in head turn extensions, stop/yield behavior 6 of motorists, and stop location at test and control sites. The control sites had the traditional right 7
turn lane design and the test sites were reconstructed to the modified design. Comparisons in 8 driver behavior were then made between the ten paired test and control sites. Additionally, at 9 three sites, field observations were conducted before and after the approaches were 10
reconstructed. This allowed the authors to make comparisons between the results of the test and 11 control observations with before and after driver behavior observations. The crash-based 12
evaluation included an extensive analysis of three years of before data and three years of after 13 data at seven test sites. Two experimental plans were used to assess the effectiveness of the 14
modified right turn lane design including the Naïve Before and After and the Empirical Bayes 15 method. Three of the ten sites were excluded from the crash-based evaluation presented here 16 because of limited after data being available. Three of the sites were reconstructed in 2013 and 17
2014 and only 20 months of after data was available, which is not sufficient for inclusion in a 18 safety effectiveness evaluation (16). 19
20 SITE DESCRIPTION 21 Test and control sites were used in the driver behavior field investigation. The control sites were 22 selected based on their similarity to the respective test site’s pre-construction (before) 23 characteristics. Test and control sites were paired based on their similarities in intersection 24 control, subject road laneage, intersection angle, right turn angle, head turn angle, right turn 25 radius (measured as a single curve as opposed to a three centered curve), annual average daily 26
traffic (AADT), presence of exclusive right turn lanes, downstream characteristics of the right 27 turn movement, and other characteristics. The research team utilized aerial images to extract the 28 intersection angle, right turn angle, head turn angle and radius. All traffic volume data was 29 gathered from IDOT’s traffic count website. Table 1 presents the characteristics at the ten paired 30 test and control sites. The angles described in Table 1 are illustrated in Figure 2. 31
32
33
34
Traditional Design Modified Design

Schattler and Hanson 6
TABLE 1 Characteristics of Test and Control Sites 1
Intersection
Subject
Right
Turn
Approach
Traffic
Control
at Subject
Right
Turn
Subject
Road
Laneage
Inter-
section
Anglea
(a)
Right
Turn
Anglea
(b)
Head
Turn
Anglea
(c)
Radiusa
Inter-
section
AADTb
Test Prospect & Knoxville WB Signalized 2 Lanes 54 22 141 155 29217
Control Allentown & Court WB Signalized 2 Lanes 76 40 126 136 24525
Test Northmoor &
Knoxville
EB Signalized 3 Lanes 86 42 133 100 28483
Control N Frye & Knoxville EB Signalized 3 Lanes 75 32 143 199 25242
Test Airport & IL 116 NB Signalized 3 Lanes 64 30 142 299 15650
Control War Memorial &
Willow Knolls
WB Signalized 3 Lanes 68 23 154 240 29825
Test Wesley & IL 29 SB Signalized 2 Lanes 57 30 142 302 29992
Control Veterans Parkway
& Morrissey
WB Signalized 8 Lanes 63 33 137 207 37363
Test Douglas & IL 116 NB Stop 2 Lanes 58 34 148 206 15558
Control Park Ave & Court EB Stop 2 Lanes 65 45 132 45 23550
Test Adams & War
Memorial
NB Stop 1 Lane 84 25 153 74 19254
Control I-74 & Washington NB Stop 2 Lanes 87 39 131 83 13200
Test Adams & War
Memorial
SB Stop 1 Lane 81 33 143 62 19004
Control I-74 & Washington NB Stop 2 Lanes 87 39 131 83 13200
Test I 155 & Broadway SB Stop 1 Lane 67 37 137 140 5675
Control I 155 & Broadway WB Stop 2 Lanes 69 38 139 143 3300
Test McClugage & IL 8 SB Signalized 4 Lanes 80 37 136 75 22250
Control War Memorial &
Adams
EB Signalized 3 Lanes 89 39 139 124 23717
Test Sterling &
Farmington
SB Signalized 4 Lanes 72 38 139 92 41300
Control War Memorial &
Adams
EB Signalized 3 Lanes 89 39 139 124 23717
a Represents the before condition value at the test approaches. Angles are defined in Figure 2. 2
b Average of 2008 to 2012 AADT data 3
4 5 6 7 8 9 10 11 12 13 14 15 16 17
FIGURE 2 Illustration of various geometric features and angles. 18
Schattler and Hanson 7
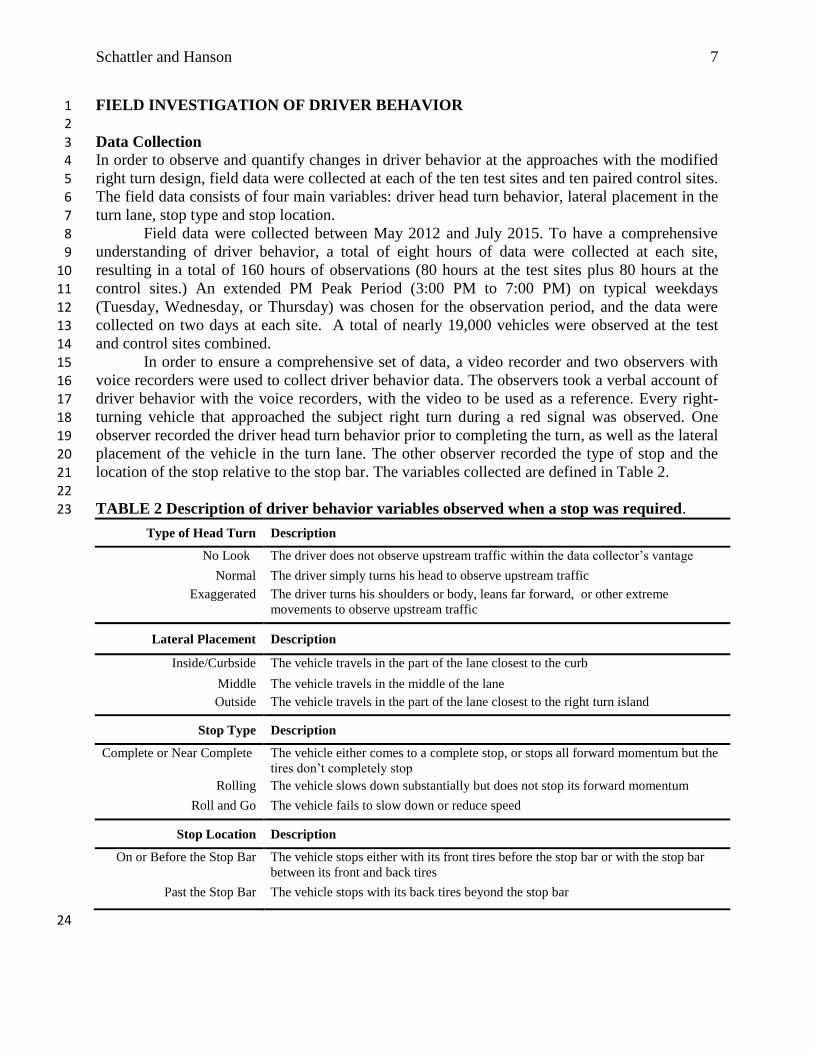
FIELD INVESTIGATION OF DRIVER BEHAVIOR 1 2
Data Collection 3 In order to observe and quantify changes in driver behavior at the approaches with the modified 4
right turn design, field data were collected at each of the ten test sites and ten paired control sites. 5 The field data consists of four main variables: driver head turn behavior, lateral placement in the 6 turn lane, stop type and stop location. 7
Field data were collected between May 2012 and July 2015. To have a comprehensive 8 understanding of driver behavior, a total of eight hours of data were collected at each site, 9
resulting in a total of 160 hours of observations (80 hours at the test sites plus 80 hours at the 10 control sites.) An extended PM Peak Period (3:00 PM to 7:00 PM) on typical weekdays 11
(Tuesday, Wednesday, or Thursday) was chosen for the observation period, and the data were 12 collected on two days at each site. A total of nearly 19,000 vehicles were observed at the test 13 and control sites combined. 14
In order to ensure a comprehensive set of data, a video recorder and two observers with 15
voice recorders were used to collect driver behavior data. The observers took a verbal account of 16 driver behavior with the voice recorders, with the video to be used as a reference. Every right-17
turning vehicle that approached the subject right turn during a red signal was observed. One 18 observer recorded the driver head turn behavior prior to completing the turn, as well as the lateral 19 placement of the vehicle in the turn lane. The other observer recorded the type of stop and the 20
location of the stop relative to the stop bar. The variables collected are defined in Table 2. 21 22
TABLE 2 Description of driver behavior variables observed when a stop was required. 23
Type of Head Turn Description
No Look The driver does not observe upstream traffic within the data collector’s vantage
Normal The driver simply turns his head to observe upstream traffic
Exaggerated The driver turns his shoulders or body, leans far forward, or other extreme
movements to observe upstream traffic
Lateral Placement Description
Inside/Curbside The vehicle travels in the part of the lane closest to the curb
Middle The vehicle travels in the middle of the lane
Outside The vehicle travels in the part of the lane closest to the right turn island
Stop Type Description
Complete or Near Complete The vehicle either comes to a complete stop, or stops all forward momentum but the
tires don’t completely stop
Rolling The vehicle slows down substantially but does not stop its forward momentum
Roll and Go The vehicle fails to slow down or reduce speed
Stop Location Description
On or Before the Stop Bar The vehicle stops either with its front tires before the stop bar or with the stop bar
between its front and back tires
Past the Stop Bar The vehicle stops with its back tires beyond the stop bar
24

Schattler and Hanson 8
Before conducting the analysis, the authors of this paper developed four main hypotheses 1 on how driver behavior would differ in response to the modified right turn design, as compared 2 to the traditional design, when stopped in the right turn lane. Each of the hypotheses state that 3 less occurrences of the critical/undesirable variables would be observed at the test sites as 4
compared to the control sites. The four critical variables are: exaggerated head turns, 5 inside/curbside lateral placement (hugging the curb), roll and go stop type, and stop location 6 being past the stop bar. The four main hypotheses are listed below: 7
8 1. The proportion of exaggerated head turns at the test sites would be less than the proportion at 9
the control sites. This was expected because of the improvement in the driver’s line of sight. 10 2. The proportion of vehicles with inside/curbside lateral placement at the test sites would be 11
less than the proportion at the control sites. This was expected because of the shortened radii 12 and the modification of the channelized island. 13
3. The proportion of vehicles “rolling and going” at the test sites (when a stop was required) 14 would be less than the proportion at the control sites. This was expected because the flatness 15
of the approach angle was improved, minimizing the tendency for drivers to continue on an 16 angled path. 17
4. The proportion of vehicles who stopped past the stop bar at the test sites would be less than 18 the proportion at the control sites. This was expected because of the improved approach 19 angle and improved sight lines, drivers would not have to travel past the stop bar to see 20
oncoming traffic. 21 22
The field observations of driver behavior for the critical variables were analyzed for the 23
ten test sites and ten control sites, and the results were then compared on an aggregated basis. In 24
addition, before and after comparisons were made for three sites where it was possible to collect 25 before and after data, at the intersections of: McClugage and IL-8, Farmington and Sterling, and 26
Broadway and I-155 SB Ramp. 27 28
Analysis and Results 29 Statistical analyses were conducted to determine whether significant differences existed in the 30 critical variables due to the modified right turn lane design. The z-test for proportions (Equation 31
1) was used to determine the significance of the observed differences at a 95% level of 32
confidence (LOC), significance level () of 0.05, and a one-tailed test, since a direction in the 33 critical variables was hypothesized. 34
35
tc
tcstatistic
NNpp
PPz
11)1(
(1) 36
37 Where: 38 Pc = Proportion of driver behavior variable observed at control site 39 Pt = Proportion of driver behavior variable observed at test site 40 Nc = Number of observations at control site 41 Nt = Number of observations at test site 42
p = Estimate of overall proportion = (NcPc + NtPt) / (Nc + Nt) 43

Schattler and Hanson 9
The z-statistic values were calculated and the corresponding p-values were obtained. The 1 results of the statistical analysis for the test and control comparisons for the critical variables are 2 shown in Table 3. For the before & after analysis, the aggregated before and after observations 3 were used in place of the control and test variables in Equation 1, the comparisons are shown in 4
Table 4. 5
6 TABLE 3 Comparison of Critical Driver Behavior Variables at Test and Control Sites 7
No. Observations Proportion
Control
Sites Test Sites
Control
Sites
Test
Sites Z- statistic p-Value
Significant at
95% LOC?
Head Turn Behavior
Exaggerated Head Turns 2,342 3,688 0.400 0.311 11.82 < 0.00001 Yes
Total Observed 5,852 11,869
Lateral Placement
Inside/ Curbside 783 4,864 0.134 0.410 -37.08 < 0.00001 Yes
Total Observed 5,852 11,869
Stop Type
Roll & Go 299 413 0.050 0.033 5.52 < 0.00001 Yes
Total Observed 5,948 12,358
Stop Placement
Past Stop Bar 1,937 1,310 0.547 0.196 36.2 < 0.00001 Yes
Total Observed 3,544 6,676
9
TABLE 4 Before and After Comparison of Critical Driver Behavior Variables at Test Sites 10
No. Observations Proportion
Description
Before After Before After Z- statistic p-Value
Significant
at 95%
LOC?
Head Turn Behavior
Exaggerated Head Turns 741 642 0.395 0.240 11.18 < 0.00001 Yes
Total Observed 1,876 2,674
Lateral Placement
Inside/ Curbside 505 758 0.247 0.283 -2.82 0.00241 Yes
Total Observed 2,046 2,674
Stop Type
Roll & Go 75 96 0.051 0.032 3.13 0.00088 Yes
Total Observed 1,477 3,020
Stop Location
Past Stop Bar 333 660 0.440 0.510 -3.07 0.00108 Yes
Total Observed 757 1,294
11
The comparison between test and control right turn approach locations (Table 3) revealed 12
that significantly less drivers utilized exaggerated head turns at the test sites (31.1%) than at the 13 control sites (40.0%). This supports the assumption that the modified right turn design provides a 14

Schattler and Hanson 10
better line of site for drivers turning right, reducing the need to utilize an excessive head turns in 1 order to check for upstream traffic. The comparison also showed that more drivers traveled 2 through the inside part of the lane at the test sites (41.0%) than at the control sites (13.4%). This 3 result does not support the authors’ hypothesis that the modified right turn design would 4
encourage drivers to position their vehicles in the middle of the lane. It was found that 5 significantly less drivers utilized roll and go stops at the test sites (3.3%) than the control sites 6 (5.0%). At the test locations, significantly less vehicles stopped past the stop bar (19.6%) as 7 compared to the control sites (54.7%), which indicates that the modified right turn design allows 8 vehicles to stop at the proper location, with adequate sight distance. Since drivers at the 9
modified right turn design use fewer exaggerated head turns, roll and go stops, and stops past the 10 stop bar, they will travel at slower speeds, have improved sight lines, and approach the right turn 11
with less skew. 12 As shown in Table 4, the before and after results were similar to the results of the test and 13
control site comparisons. Although the before and after comparisons were drawn from a smaller 14 sample of test sites, they do provide further support for the above-noted results. 15
16
TRAFFIC CRASH-BASED SAFETY EVALUATION 17 18
Data Collection 19 Three years of before crash data were obtained and analyzed for each of the seven test 20
approaches. Three years of after data is typically desired for crash-based evaluations, and 21 currently seven of the sites have three years of after data available. Three of the test sites were 22
excluded from this analysis, as only 20 months of after crash data is currently available. The test 23
sites included in the crash-based evaluation are: 24
Prospect and Knoxville 25 Northmoor and Knoxville 26
Airport and IL 116 27 Wesley and IL 29 28 Douglas and IL 116 29
Adams and Northbound War Memorial Ramp 30 Adams and Southbound War Memorial Ramp 31
32 Crash report forms were obtained from IDOT and the crash narratives were analyzed to 33
help minimize possible coding errors. Crash data were collected within an assumed intersection 34
influence radius of 250 feet. Details of each crash were then extracted such as location 35
information, vehicle direction, injury severity, crash type, driver age, driver gender, roadway 36 conditions, and the primary contributory cause of the crash. Additionally, crashes that involved a 37 vehicle making a right turn maneuver from the subject approach were specifically noted. This set 38 of right turn-related crashes was of primary interest in this research because the treatment has the 39 largest expected impact on this targeted crash type. 40
41 Analysis and Results 42 Two methods were used to evaluate the crash experience at seven test right turn approaches: the 43 Naïve Before and After, and the Empirical Bayes method. These two methods seek to determine 44 the effectiveness, or percent reduction in crashes, that can be attributed to the countermeasure or 45
improvement. In this research, the improvement is the modified right turn lane design described 46

Schattler and Hanson 11
earlier. In both methods, the actual after crash frequency is compared to an expected value. The 1 expected value represents the crashes that would have occurred in the after period had the safety 2 improvements not been made at the test site. This expected value will never be known with 3 100% certainty because the conditions at the test site changed due to the improvements. The 4
difference in the two evaluation methods lies in the determination of the expected value of the 5 crashes without treatment. 6 7 Naïve Before and After (B&A) 8 In this method, the expected crash frequency in the after period, had the improvements not been 9
made, is assumed to be the before crash frequency. Since the only major change made to the 10 intersection was the modification of the right turn lane, it can be assumed that any significant 11
change observed in crash frequencies would be a result of the modified design. Although this 12 method fails to account for fluctuations common in crash frequencies over time, it still provides 13 useful insight into the impact of the treatment. 14 15
Empirical Bayes (EB) 16 The random nature of crashes makes it impossible to truly predict the expected number of 17
crashes in an after period, had the improvements not been made. The EB method is commonly 18 accepted as a more precise estimation of the expected crashes than any other method due to its 19 ability to account for regression-to-the-mean bias. The EB method takes into account both the 20
crash experience of the test sites, and a crash prediction model, called a safety performance 21 function (SPF) derived from the crash experience of numerous comparison sites. Once 22
developed, this model is then weighted against the observed crash experience of the test site to 23
more accurately predict the expected crashes. In this research, the procedure for the EB method 24
as documented in the Highway Safety Manual (16) was used to conduct the analysis. 25 As a part of this research, four SPF models were developed to predict total intersection 26
crashes, total intersection injury crashes, total crashes at the subject approach, and right-turn 27 related crashes at the subject approach. The geometric characteristics, crash history and traffic 28 volumes of a group of 116 comparison sites were compiled and analyzed using the IBM SPSS 29
statistical analysis software. Assuming an underlying Poisson/ negative binomial distribution, 30 which is a common assumption in modeling traffic crashes (16); SPF models were then 31
developed to predict crashes using variables that were found to have a statistically significant 32 influence on crashes observed at the comparison sites. Equations 2, 3, 4, and 5 show the form of 33
the SPFs developed in this research, and Table 5 shows the coefficients and over-dispersion 34
factors. 35
36
µ𝑇𝑜𝑡𝑎𝑙 = 𝑒𝛼 × 𝑒𝛽1∗𝑅𝑇𝑎𝑝𝑝𝐴𝐷𝑇 × 𝑒𝛽2∗𝐼𝑁𝑇𝑅𝑆𝑎𝑝𝑝𝐴𝐷𝑇 (2) 37
𝜇𝐼𝑛𝑗𝑢𝑟𝑦 = 𝑒𝛼 × 𝑒𝛽1∗𝑅𝑇𝑎𝑝𝑝𝐴𝐷𝑇 × 𝑒𝛽2∗𝐼𝑁𝑇𝑅𝑆𝑎𝑝𝑝𝐴𝐷𝑇 (3) 38
𝜇𝑆𝑢𝑏𝑗𝑒𝑐𝑡𝐴𝑝𝑝 = 𝑒𝛼 × 𝑒𝛽1∗𝑅𝑇𝑎𝑝𝑝𝐴𝐷𝑇 × 𝑒𝛽2∗𝑅𝑇𝑎𝑝𝑝𝑆𝑝𝑒𝑒𝑑𝐿𝑖𝑚𝑖𝑡 (4) 39
𝜇𝑅𝑇 = 𝑒𝛽1∗𝐻𝑒𝑎𝑑𝑇𝑢𝑟𝑛𝐴𝑛𝑔𝑙𝑒 × 𝑒𝛽2∗𝑅𝑇 𝑅𝑎𝑑𝑖𝑢𝑠 (5) 40
41
42
Schattler and Hanson 12
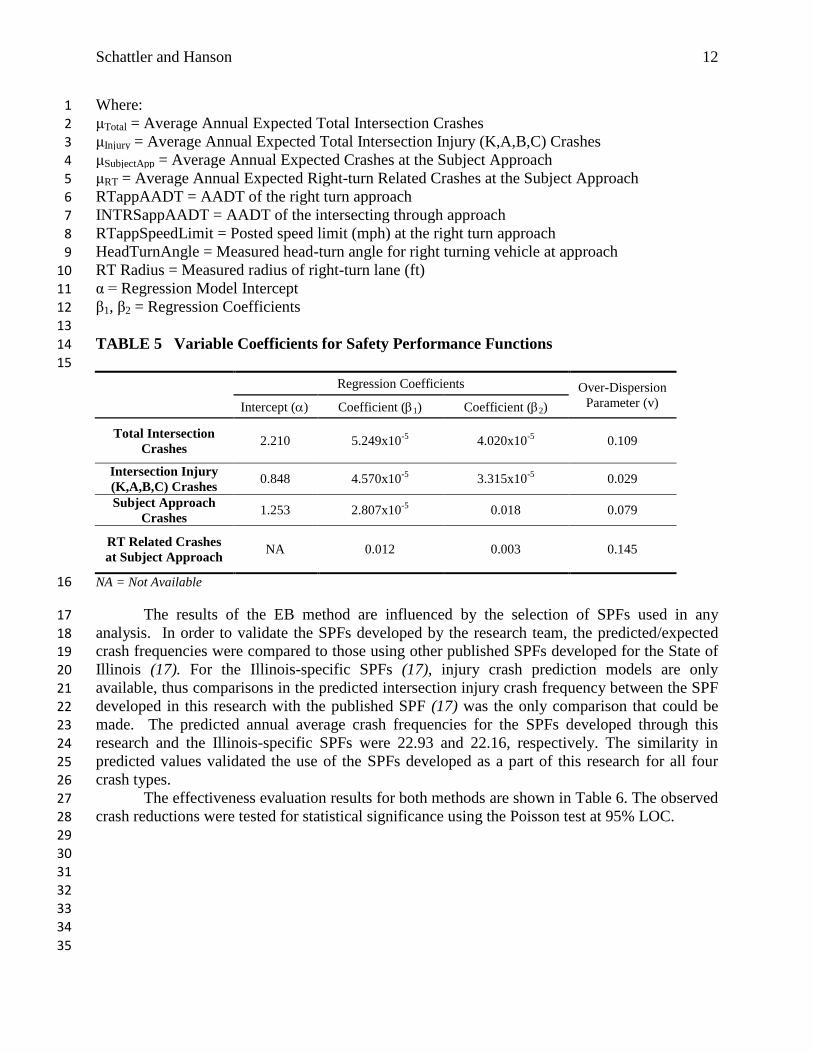
Where: 1 μTotal = Average Annual Expected Total Intersection Crashes 2 μInjury = Average Annual Expected Total Intersection Injury (K,A,B,C) Crashes 3 μSubjectApp = Average Annual Expected Crashes at the Subject Approach 4
μRT = Average Annual Expected Right-turn Related Crashes at the Subject Approach 5 RTappAADT = AADT of the right turn approach 6 INTRSappAADT = AADT of the intersecting through approach 7 RTappSpeedLimit = Posted speed limit (mph) at the right turn approach 8 HeadTurnAngle = Measured head-turn angle for right turning vehicle at approach 9
RT Radius = Measured radius of right-turn lane (ft) 10 α = Regression Model Intercept 11
β1, β2 = Regression Coefficients 12 13
TABLE 5 Variable Coefficients for Safety Performance Functions 14 15
Regression Coefficients Over-Dispersion
Parameter (v) Intercept () Coefficient (1) Coefficient (2)
Total Intersection
Crashes 2.210 5.249x10
-5 4.020x10
-5 0.109
Intersection Injury
(K,A,B,C) Crashes 0.848 4.570x10
-5 3.315x10
-5 0.029
Subject Approach
Crashes 1.253 2.807x10
-5 0.018 0.079
RT Related Crashes
at Subject Approach NA 0.012 0.003 0.145
NA = Not Available 16
The results of the EB method are influenced by the selection of SPFs used in any 17 analysis. In order to validate the SPFs developed by the research team, the predicted/expected 18 crash frequencies were compared to those using other published SPFs developed for the State of 19 Illinois (17). For the Illinois-specific SPFs (17), injury crash prediction models are only 20 available, thus comparisons in the predicted intersection injury crash frequency between the SPF 21
developed in this research with the published SPF (17) was the only comparison that could be 22
made. The predicted annual average crash frequencies for the SPFs developed through this 23 research and the Illinois-specific SPFs were 22.93 and 22.16, respectively. The similarity in 24 predicted values validated the use of the SPFs developed as a part of this research for all four 25
crash types. 26 The effectiveness evaluation results for both methods are shown in Table 6. The observed 27
crash reductions were tested for statistical significance using the Poisson test at 95% LOC. 28 29 30
31 32 33 34
35

Schattler and Hanson 13
TABLE 6 Results of Crash-Based Effectiveness Evaluation 1
Annual Average Crash Frequency
Observed/
After
Naïve B&A Empirical Bayes
Expected Reduction Expected Reduction
Total Intersection Crashes 53.67 91.33 41.2%* 95.47 44.2%*
Intersection Injury (K,A,B,C)
Crashes 13.00 21.33 39.1%* 22.93 43.6%*
Subject Approach Crashes 21.67 57.33 62.2%* 52.43 58.9%*
RT Related Crashes at
Subject Approach 15.00 53.67 72.0%* 37.50 60.3%*
* Denoted statistical significance at 95% LOC 2 3
As shown in Table 6, each method indicates that a significant reduction in right turn 4
related crashes at the test approaches was observed in the after period. This provides evidence 5 that the modified right turn design implemented in the Peoria, Illinois area provides a significant 6
improvement to safety. The percent reductions for total intersection crashes ranged from 41.2 to 7 44.2% between the two methods. Total intersection injury crashes experienced percent 8 reductions ranging from 39.1 to 43.6%. The percent reductions in subject approach crashes were 9
observed as 58.9 to 62.2%. For right turn related crashes at the subject approach, the highest 10
crash reductions were observed, ranging from 60.3 to 72.0%. 11
It appears that a majority of the reduction in total intersection crashes is accounted for in 12 the reduction in right turn related crashes. This provides evidence that the modifications had a 13
positive impact on reducing crashes at the study approaches, specifically those associated with 14 the right turn lane. 15
16
SUMMARY AND CONCLUSIONS 17 From 2006 to 2014, IDOT implemented modifications to ten right turn approaches. The changes 18 were intended to improve the line of sight of right turning passenger vehicles by reducing the 19 skew of the approach angle, while at the same time continuing to accommodate large semi-20 tractor trailer trucks to make right turns without encroachment. This research provided the 21
opportunity to study the impact of these changes, and provide information that may be used in 22 future decision making. 23 The authors of this paper conducted an analysis of field observations of driver behavior at 24 right turn lanes at ten test sites and ten control sites. The test and control comparisons revealed 25
that a lower percentage of drivers made exaggerated head turns at the test sites (modified right 26 turn lane design) than at the control sites (traditional design), supporting the hypothesis that the 27 modified right turn design provides a better line of site for drivers turning right, reducing the 28 need to utilize an excessive head turn in order to check for upstream traffic. The comparison also 29 showed that more drivers traveled through the inside part of the lane at the test sites than at the 30
control sites, which does not support the authors’ hypothesis. It was found that significantly 31 fewer drivers utilized roll and go stops at the test sites than the control sites, which minimizes the 32 opportunity for traffic conflicts. At the test locations, significantly fewer vehicles stopped past 33
the stop bar as compared to the control sites, which indicates that the modified right turn design 34

Schattler and Hanson 14
allows vehicles to stop at the proper location, with adequate sight distance. Since drivers at the 1 modified right turn design use fewer exaggerated head turns, roll and go stops, and stops past the 2 stop bar, they will travel at slower speeds, have an improved line of sight and approach the right 3 turn with less skew. Before and after comparisons were only available at three test sites, due to 4
the dates of construction. However, the results were similar to the test and control comparisons 5 for three of the four critical variables and provide support for comparative test and control 6 analysis. 7 The traffic crash-based evaluation of seven test approaches with three years of before and 8 after data provides insight into the safety impact of the modified right turn lane design. The 9
results of the Empirical Bayes method indicated statistically significant reductions in total 10 intersection crashes (44.2%), intersection injury crashes (43.6%), subject approach crashes 11
(58.9%), and right turn related crashes at the subject approaches (60.3%) at 95% LOC. Overall 12 the safety evaluation provides evidence that modifying right turn lanes to improve the approach 13 angle of right turn vehicles improves safety by reducing the frequency of right turn related 14 crashes at the approaches, as studied in the Peoria, Illinois area. 15
Based upon the overall finding of the study, both the driver behavior and safety 16 evaluations, the modification of right turn lanes to improve the approach angle of right turning 17
vehicles has significant benefits. It is recommended that similar modifications to improve the 18 right turn approach angle/position be considered as potential improvements for intersection 19 approaches that experience a pattern of right turn-related crashes. 20
21
AKNOWLEDGEMENTS 22 The authors acknowledge the Technical Review Panel (TRP) of the Illinois Center for 23
Transportation (ICT) Project R27-111 for their guidance and support of the efforts that formed 24
the basis of this paper, and specifically Mr. Sean Coyle, the TRP Chair. This research was 25 funded by the Illinois Department of Transportation and the ICT. 26
27 The contents of this publication reflect the view of the authors, who are responsible for the facts 28 and the accuracy of the data presented herein. The contents do not necessarily reflect the official 29
views or policies of the Illinois Center for Transportation, the Illinois Department of 30 Transportation, or the Federal Highway Administration. This publication does not constitute a 31
standard, specification, or regulation. 32
33
REFERENCES 34 1. Traffic Safety Facts 2011. Publication DOT HS 811 754. NHTSA, U.S. Department of 35
Transportation, 2013. 36
2. 2011 Illinois Crash Facts & Statistics. Illinois Department of Transportation, Division of 37 Traffic Safety, 2013. 38
3. National Agenda for Intersection Safety. Publication FHWA-SA-02-007. FHWA, U.S. 39 Department of Transportation, 2011. 40 http://safety.fhwa.dot.gov/intersection/resources/intersafagenda/. Accessed May 15, 2015. 41
4. Fitzpatrick, K., E.S. Park, and W. H. Schneider IV. Operation and Safety of Right turn Lane 42 Designs. In Transportation Research Record: Journal of the Transportation Research Board, 43 No. 1961, Transportation Research Board of the National Academies, Washington, D.C., 44 2006, pp. 55-64. 45

Schattler and Hanson 15
5. A Policy on Geometric Design of Highways and Streets, 6th
ed. American Association of 1 State Highway and Transportation Officials (AASHTO), Washington, D.C., 2011. 2
6. Dixon, K. K., J. L. Hibbard, and H. Nyman. Right Turn Treatment for Signalized 3 Intersections. Transportation Research Board Circular E-C019: Urban Street Symposium. 4
1999, pp. 1-11. 5 7. Harwood, D. W., K. M. Bauer, L. Elefteriadou, M. S. Griffith, E. Hauer, B. P. Ingrid, E. R. 6
Kohlman, K. R. Richard, and D. J. Torbic. Safety Effectiveness of Intersection Left- and 7 Right-Turn Lanes. Transportation Research Board 82
nd Annual Meeting, 2003, pp. 131-139. 8
8. Tarawneh, M. S., McCoy, P. T., and T. Rifaey. Effects of Intersection Geometrics on Driver 9
Performance. International Symposium on Highway Geometric Design Practices. 1995, pp. 10 1-10. 11
9. Tarawneh, M. S. and P. T. McCoy. Effect of Intersection Channelization and Skew on Driver 12 Performance. Transportation Research Record: Journal of the Transportation Research 13 Board, No. 1523, Transportation Research Board of the National Academies, Washington, D. 14 C., 1996, pp. 73-82. 15
10. García, A. and E. Belda-Esplugues. Lateral Vision Angles in Roadway Geometric Design. 16 Journal of Transportation Engineering, Vol. 133, 2007, pp. 654-662. 17
11. Pline, J.L. Traffic Engineering Handbook, 5th
ed. Institute of Transportation Engineers, 18 Washington, D.C., 1999. 19
12. Designing Walkable Urban Thoroughfares: A Context Sensitive Approach: An ITE 20
Recommended Practice. Publication No. RP-036A. Institute of Transportation Engineers, 21 2010, pp. 175-189. 22
13. Potts, I. B., K. M. Bauer, J. F. Ringert, and D. J. Torbic. Safety of Channelized Right turn 23
Lanes for Motor Vehicles and Pedestrians. In Transportation Research Record: 24
Transportation Research Board for Presentation and Publication, Transportation Research 25 Board of the National Academies, Washington, D.C., 2012 (Nov.), pp. 1-18. 26
14. Sayed, T., M.H. Zaki, and J. Autey. A Novel Approach for Diagnosing Road Safety Issues 27 Using Automated Computer Vision Techniques. 16
th Road Safety on Four Continents 28
Conference, Beijing, China, May 2013. 29
15. Stover, V.G. and Koepke, F.J. Transportation and Land Development, 2nd
ed. Institute of 30 Transportation Engineers, Washington, D.C., 2002. 31
16. Highway Safety Manual, 1st ed. American Association of State Highway and Transportation 32
Officials, Washington, D.C., 2010. 33
17. Tegge, R.A., Jo, J., Ouyang, Y., Development and Application of Safety Performance 34
Functions for Illinois. Publication FHWA-ICT-10-066. Illinois Center for Transportation, 35
2010. 36
37
Reference: 3500 Hawthorne Road Transportation Impact Study, Response to Transportation Comments / Public Concerns
Attachment B: “A Novel Approach for Diagnosing Road Safety Issues Using Automated Computer Vision Techniques”, Sayed, Zaki and Autey, Department of Civil Engineering, University of British Columbia, Vancouver, BC, May 2013.

16th Road Safety on Four Continents Conference Beijing, China 15-17 May 2013
1
A NOVEL APPROACH FOR DIAGNOSING ROAD SAFETY ISSUES USING AUTOMATED COMPUTER VISION TECHNIQUES
Tarek Sayed, Ph.D., P.Eng. Professor, Department of Civil Engineering, University of British Columbia
6250 Applied Science Lane, Vancouver, BC, Canada V6T 1Z4 E-mail: [email protected]
Mohamed H. Zaki, Ph.D.
Post-Doctoral Fellow, Department of Civil Engineering, University of British Columbia 6250 Applied Science Lane, Vancouver, BC, Canada V6T 1Z4
E-mail: [email protected]
Jarvis Autey, MSc. Research Assistant, Department of Civil Engineering, University of British Columbia, 6250
Applied Science Lane, Vancouver, BC, Canada V6T 1Z4 E-mail: [email protected]
ABSTRACT The use of traffic conflicts for safety diagnosis has been gaining acceptance as a surrogate for collision data analysis. The traffic conflicts approach provided better understanding of collision contributing factors and the failure mechanism that leads to road collisions. This paper demonstrates an automated proactive safety diagnosis approach for vehicles, pedestrian and cyclists using video-based computer vision techniques. Traffic conflicts are automatically detected and several conflict indicators such as Time to collision (TTC) are calculated based on the analysis of the road-user positions in space and time. Additionally, spatial violations are detected based on the non-conformance of road users to travel regulations. Several case studies are described. The first case study deals of the safety analysis of a newly installed bike lane at the southern approach of a heavy volume Bridge in Vancouver, British Columbia. The results showed a high exposure of cyclists to traffic conflicts. Practical solutions to address the safety issues at the location were presented. The second case study deals with a major signalized intersection where concerns were raised regarding the high conflict rate between vehicles and pedestrians as well as an elevated number of traffic violations (i.e., jaywalking) at the intersection. Conflicts and violations were identified and pedestrian safety countermeasures were presented. The third case study deals with a before-after (BA) safety evaluation of a newly proposed design for channelized right-turn lanes at intersections. The new design, termed “Smart Channels”, decreases the angle of the channelized right turn to approximately 70 degrees. The results of the evaluation show that the implementation of the right-turn treatment has resulted in a considerable reduction in the severity and frequency of merging, rear-end, and total conflicts. Overall, the three case studies demonstrate the considerable potential of using video-based computer vision techniques for automated road safety analysis based on traffic conflicts.

16th Road Safety on Four Continents Conference Beijing, China 15-17 May 2013
2
1 INTRODUCTION The focus of this paper is driven by the potential of computer vision techniques for solving well-recognized problems in road safety and road user behavior analyses. The purpose of safety diagnosis studies is to identify factors that may be causing safety deficiencies at a particular location or a road segment. The use of traffic conflicts for safety diagnosis has been gaining acceptance as a surrogate for collision data analysis [1] [2] [3] as they provide insight into the failure mechanism that leads to road collisions. Traffic conflicts address several shortcomings associated with collision data such as the scarcity of collisions, the need for long observation times and the questionable quality of collision data. Yet, current on-site methods for collecting surrogate measures data are labour-intensive, suffer from reliability issues, time consuming and costly. Video sensors are now advocated as alternative data collection procedure, solving many issues in the manual data collection and providing a more reliable and efficient way to capture, store and analyze traffic information. The accurate estimation of exposure as well as other quantities fundamental to road safety analysis, e.g. severity of a traffic interaction, can greatly benefit by analyzing road users' positions in space and time, i.e. trajectories [4].Video data is supported with practical computer vision applications (CV) to aid in the analysis of traffic scenes.
This paper demonstrates an automated proactive safety diagnosis approach for vehicles, pedestrian and cyclists using video-based computer vision techniques. Traffic conflicts are automatically detected and several conflict indicators such as Time to collision (TTC) are calculated based on the analysis of the road-user positions in space and time. Additionally, spatial and temporal violations are detected based on the non-conformance of road users to travel regulations. Three case studies are described. The first case study deals of the safety analysis of a newly installed bike lane at the southern approach of a heavy volume Bridge in Vancouver, British Columbia and practical solutions to address the safety issues at the location were presented. The second case study deals with a major signalized intersection in Vancouver where concerns were raised regarding the high conflict rate between vehicles and pedestrians as well as an elevated number of traffic violations (i.e., jaywalking) at the intersection. Conflicts and violations were identified and pedestrian safety countermeasures were presented. The third case study deals with a before-after (BA) safety evaluation of a newly proposed design for channelized right-turn lanes at intersections. The new design, termed “Smart Channels”, decreases the angle of the channelized right turn to approximately 70 degrees.
2 THE VIDEO ANALYSIS APPROACH
The safety analysis is performed using a video analysis procedure using computer vision, developed at the University of British Columbia. The video analysis system automatically detects, classifies, and tracks road users and interprets their movement. For road safety applications, the proposed approach relies on the building of two databases: a trajectory database, where the results of the video processing module are stored, and an interaction database, where all interactions between road users within a given distance are considered, and for which various conflict indicators can be automatically computed. Identifying road-users

16th Road Safety on Four Continents Conference Beijing, China 15-17 May 2013
3
behavior, traffic violations, traffic conflicts and measuring other traffic parameters can be achieved through mining these databases [4] .
Road-Users Detection: The automated video analysis relies on computer algorithms to differentiate between features of road users and features that are part of the environment [5]. Features are identified and tracked using an implementation of the Kanade-Lucas-Tomasi Feature Tracker algorithm [5]. Feature-based tracking identify distinguishable features (e.g. window corners, bumper edges) on the moving object. (See Figure 1.a). Since a moving object can have multiple features, the next step is to group the features, using spatial and temporal cues. (See Figure 1.b). The subsequent step in the road-users detection is the road-users classification. The objects trajectories hold features that reveal the structure of the traffic movements and provide important clues to the characteristics of the road-users (e.g. pedestrian ambulation, cyclist pedaling, maximum speed). Such information provides a basis for a classification decision procedure (See Figure 1.c). The road-users tracking and classification accuracy were presented in [6] and [7] where tracking error was reported to be satisfactory low. Camera Calibration: The positional analysis of road users requires accurate estimation of the camera parameters. Camera calibration is the process of determining the homography matrix of a camera angle, and is necessary for tracking vehicles in the camera image and relating these tracks to positions in the real-world. Each calibration process begins with the user annotating features in the camera image and in an aerial, orthographic image of the intersection. Details of the adopted mixed-feature camera calibration approach are presented in [8].
Safety Analysis: The adapted safety analysis provides an operational interpretation to automatically capture the traffic conflicts between road-users. The implementation relies on matching the trajectories to prototypical trajectories from the full set of previously learned motion patterns [4]. (See Figure 1.d). The prototypes provide a set of predicted future positions with associated probabilities of occurrence. Conflicts between road-users can then be determined by evaluating if any of these future positions coincide spatially and temporally with other road-users (See Figure 1.e). Details of the procedure are explained in [4].. In this paper, the measure of proximity is Time to Collision (TTC). TTC is continually calculated between conflicting road-users. The minimum TTC, is then extracted from this set to indicate the maximum severity of this interaction. In this paper, only traffic events with associated minimum TTC of less than 3 seconds are considered for the safety evaluation. This value was selected based on the work in [3]. Other conflict indicators are also used to capture different proximity aspects. Post-Encroachment Time (PET) [9] is defined as the time difference between the moment an offending road user leaves an area of potential collision and the moment of arrival of a conflicted road user possessing the right of way. PET is considered as a suitable safety measure between turning vehicles and pedestrians [7].

16th Road Safety on Four Continents Conference Beijing, China 15-17 May 2013
4
(a) Features Tracking
(b) Features Grouping
(c) Road-users Classification
(d) Trajectories Prototypes
(e) Event Detection
Figure 1: Demonstration of the Video Analysis Process

16th Road Safety on Four Continents Conference Beijing, China 15-17 May 2013
5
3 CASE STUDY 1: DIAGNOSING SAFETY ISSUES OF VEHICLES-BICYCLES INTERACTIONS USING AUTOMATED COMPUTER VISION ANALYSIS
The intersection analyzed in this study was selected because of perceived high rate of conflicts between vehicles and cyclists. Figure 2 illustrates the conflicts regions for typical trajectories of the road-users. Right-turning vehicles in the ramp should yield for bicycles travelling southbound to the Burrard Street Bridge. However, the current configuration limits the available sight distance leading to severe conflicts. For the northbound approach of the intersection, a large portion of northbound cyclists will go off ramp onto another bike lane. Yet, some cyclists will have to cut through the vehicles right-turn lane in order to take the through lane towards Burrard Street.
Figure 2. Possible Conflicts Regions for Vehicles-Bicycles Interactions
4 SUMMARY OF FINDINGS Traffic conflicts between vehicles and bicycles at both approaches of the intersection are automatically identified. Conflict analysis includes identifying conflict frequency, severity and location (conflict points). Distribution of the vehicle-bicycle conflicts (with a minimum TTC smaller than 3 seconds) by heat mapping is shown in Figure 3. Those conflicts considered of high severity were carefully analyzed leading to recommended safety countermeasures as will describe later.

16th Road Safety on Four Continents Conference Beijing, China 15-17 May 2013
6
Figure 3: Conflicts Frequency Heatmaps (Conflicts/m2) for the Burrard & Pacific Intersection
Tables 1 shows a breakdown of the number of cyclist-vehicle conflicts by type and severity. For southbound traffic, the majority of the conflicts are between vehicles non-conforming to the yielding signage and the cyclists arriving from the Burrard Street bike lane and crossing towards the Burrard Bridge bike lane. This is attributed likely to the limited sight angle for the drivers who in most cases are not aware to the arrival of cyclists. Out of the 229 cyclists, 72 were in conflicts with vehicles as shown in Table 1, that is 31.44 percent of the cyclists. On the northbound approach, according to Table 1, 35 cyclists were in conflicts that 23 percent of cyclists traveling northbound. It is worth mentioning that only out of 149 cyclists; only 39 chose to travel on the bike lane crossing the vehicles heading to Burrard Street, while the remaining majority (110) chose an alternative safer path by going straight on the sidewalk.
The analysis of important events such as conflicts led to the proposal of some recommendations that can act as safety countermeasures. One recommendation is better signage and road markings. Cyclists crossing area should be clearly strip marked to indicate that vehicles should not stop in this area.
Table 1: Cyclist-Vehicle Conflicts for Burrard & Pacific Intersection
Conflicts Southbound Bikes and Right-turn
Vehicles (Camera angle 2) Northbound Cyclists and
Right-turn (Camera angle 3) TTC range # Events # Events
0-1 seconds 34 19
1-2 seconds 23 16
2-3 seconds 15 0 TOTAL 72 35

16th Road Safety on Four Continents Conference Beijing, China 15-17 May 2013
7
Case Study 2: Application of Computer Vision to the Diagnosis of Pedestrian Safety Issues The intersection analyzed in this study was selected because of a perceived high rate of conflicts between vehicles and pedestrians [10]. The site in the study is a busy eastside downtown intersection located at East Hastings and Main Streets as shown in Figure 4. There are several factors that affect safety at this location, including a high pedestrian volume with considerable crossing violations and jay walking. Four camera angles were selected for this location. Camera position 1 focused on area to the immediate east of the intersection, with the camera pointed southwards. The main movements observed in the scene are the eastbound through and northbound right turning vehicles (Figure 4). Two conflict types were considered in this view: northbound right turn vehicles with east-west crossing pedestrians and eastbound through vehicles with north-south crossing pedestrians. Camera position 2 pointed southwards to cover the south west segment of the intersection, capturing pedestrian crossings with southbound traffic at the southward crossing along Hastings Street. This camera position also captured conflicts between north-south pedestrians on the western crossing along Main St. with eastbound traffic. Camera position 3 complements the previous position by capturing the remaining part of the pedestrian western crossing along Main St. It also covers the western segment of the northern pedestrians crossing along Hastings St. Camera position 4 captures the mid-block pedestrian’s violations (jaywalking).
5 SUMMARY OF FINDINGS Traffic conflicts between vehicles and pedestrians at the intersection were automatically identified. The heat map in Figure 5 shows the intensity of the vehicle-pedestrian conflicts at the intersection (conflicts/m2). Safety diagnosis is supported with an automated pedestrian violations (jaywalking) detection mechanism.

16th Road Safety on Four Continents Conference Beijing, China 15-17 May 2013
8
Figure 4: East Hastings St. and Main St. Intersection
It is observed that the majority of conflicts occur between right-turning or left turning vehicles and crossing pedestrians. Each of these turning movements can legally be undertaken during the pedestrian’s walk phase, provided pedestrians are given the right of way. All of the pedestrian conflicts occur due to either vehicles ignoring the pedestrian’s right of way, or pedestrians entering the crosswalk after the walk phase. Pedestrians crossing in the east approach are involved in frequent conflicts. Eastbound right turning vehicles and north bound pedestrians also frequently interact at the curb, when pedestrians first step into the crosswalk. Note that the left turn movement from the Northern approach is prohibited. From Camera location 2, it is observed that southbound right turning vehicles coming from the western approach on Hastings Street have a high occurrence of conflicts. More frequent than right turning pedestrian conflicts, left turning pedestrian interactions produce a number of severe conflicts as shown in Figure 5. As left turning vehicles have few available gaps, they often make their turn without first checking for clearance. A number of instances also occur when pedestrians enter the crosswalk near the end of the phase and conflict with late left turning vehicles. Similar conflicts patterns were observed from Camera Location 3, where turning vehicles were in conflicts with late crossing pedestrians. Figure 6.a shows the hourly variations in conflicts frequency throughout the day. To further understand the severity of conflicts between pedestrians and turning vehicles, PET is calculated for the detected events (See Figure 6.b). PET calculations show the high risk for pedestrians when they are in a conflicting situation with vehicles [7].
The subsequent step in the safety analysis is to identify violating pedestrians. This is
performed by comparing the pedestrian tracks against a given set of prototypes tracks representing standard pedestrian movements’ patterns. Any significant disagreement between both sequences of positions is interpreted as evidence that the given track represents the

16th Road Safety on Four Continents Conference Beijing, China 15-17 May 2013
9
movement of a road user performing a traffic violation. The matching relies on an LCSS similarity measure between the movement prototypes and the trajectories to make decision about the violation detection [11]. Results showed a high level of jaywalking by pedestrians was detected in the mid-block region (33 percent of pedestrians are crossing illegally). As expected, the westbound approach has an increasing number of violations. In fact, according to an earlier study [10] this segment was identified as the highest pedestrian collision-prone area in Greater Vancouver.
Figure 5: Pedestrian-Vehicle Conflicts Frequency Heatmap
(a) Conflicts (with calculable TTC) Frequency Hourly Variation for the
Intersection

16th Road Safety on Four Continents Conference Beijing, China 15-17 May 2013
10
(b) Distributions of the PET for the combined set of events at the intersection
Figure 6: Conflicts Distributions
Case Study 3: Before-After safety evaluation of right-turn “Smart Channels” In 2009, the British Columbia Ministry of Transportation and Highways started a pilot project to evaluate the safety performance of Smart Channels. The Smart Channels (Figure 7) design has recently been proposed as an alternative right- turn design with a higher level of pedestrian crossing safety. The goal is to reduce the pedestrian crossing distance which can lead to shorter distance exposure, shorter signal cycles, and reduced potential for pedestrians to be in conflict with vehicles. The benefits also extend to vehicle-vehicle interactions since the new approach angle affords drivers a better view of the traffic stream they are to merge with. Three channelized right-turn lanes in Penticton, BC, were converted to Smart Channels in the summer of 2010. The treatment locations, Duncan, Warren and Green Avenues, are all cross streets to the major thoroughfare, Channel Parkway. At all three locations no dedicated merging lane was provided on the highway; vehicles were required to merge at the end of the channelized right, immediately downstream of the intersection. Turning vehicles were instructed to yield to highway traffic by installed “yield” signage. The realignment treatment, shown in Figure 7, decreased the angle of the channelized right between the termination of the right-turn lane and Channel Parkway. The yield signage remained for the right-turn lane.
Data was gathered two days before and two days after at the three locations, as well as at a control site. A control (comparison) site at the intersection of West Bench Hill Road and Eckhardt Avenue was studied in addition to the treatment sites to account for changes in accident causal factors beyond the treatments. The effects observed at the treatment sites were then compared to those at the control site. At the treatment intersections, one camera was used to gather video data of the merging section, while a second camera was focused on the queue of vehicles waiting to turn right.

16th Road Safety on Four Continents Conference Beijing, China 15-17 May 2013
11
Figure 7: The treatment locations, Duncan, Warren and Green Avenues
Summary of Findings TTC conflict indicator was used in the study for conflict identification. Comparison is then made with the control site to account for non-treatment conflict causal factors. The intersections of Duncan Avenue and Warren Avenue show consistent improvements between the two intersections: reductions of approximately 75 percent in rear-end conflicts, 45 percent in merging, and 50 percent in total conflicts. Reductions in conflicts at the Green Avenue intersection were less dramatic, ranging from 22 percent to 28 percent (Figure 8).
Figure 8: The frequency and cumulative distributions of conflicts at the treated intersection before and after the treatment
In BA traffic safety applications, the conditions pre- and post-treatment at the site are compared to the conditions at a set of control or reference sites over a similar time period. The Treatment Effects for Duncan and Warren Avenues show an AHC reduction of approximately 55 percent for total conflicts. Green Avenue had a Treatment Effect of a reduction in AHC of approximately 35 percent for total conflict types. Over all three treatment sites a reduction of 67 percent, significant at the 90th percentile was observed. Merging and total conflicts were reduced by 48 percent and 51 percent respectively, both significant at the 99th percentile.

16th Road Safety on Four Continents Conference Beijing, China 15-17 May 2013
12
The severity of each event can be represented through mapping the minimum time-to-collision (TTC) to a severity index, which ranges from 0 to 1. Total severity is found by summing the severity index of each event and incorporating a measure of exposure [4]. Also, results of conflict severity analysis showed that the intersections of Duncan Avenue and Warren Avenue has decreases in severity in rear-end, merging and total conflict types of approximately 75 percent, 45 percent and 50 percent respectively. The severity decrease at Green Avenue was lower, with a total reduction of 24 percent. The total severity of conflicts, normalized to traffic volumes, was observed to decrease by approximately 41 percent following the treatments. [12]
6 DISCUSSION This paper presented application of a proactive safety diagnosis procedure where video analysis is employed to automatically identify and analyses serious events such as traffic conflicts and violations. The procedure was applied to the safety analysis of a newly installed bike lane at the entrance of the southern approach of a major Bridge in Vancouver, British Columbia. The results showed a high exposure of bicycles to traffic conflicts. The study also presented potential countermeasures to address the safety issues at the location. The paper also demonstrated the safety evaluation of a location considered to be high risk for pedestrian crossing in Vancouver downtown. The diagnosis identified the safety concerns at this site by locating the most dangerous segments in the intersection. The diagnosis also revealed an estimation of the jaywalking rate at the facility. Generally, two recommendations can be offered at this intersection for improving pedestrian safety. The first includes measures to provide higher level of safety for the crossing pedestrians such as signal changes, construction of pedestrian refuge islands, and potentially prohibiting left turns. The second is increasing the level of enforcement and to reduce pedestrian non-conforming crossing behaviour including jay walking. The experimental results presented in this paper also demonstrated the usefulness of using computer vision techniques for traffic conflicts analyses in BA safety evaluation. The third case study deals with a BA safety evaluation of a newly proposed design for channelized right-turn lanes at intersections. The results of the evaluation show that the implementation of the right-turn treatment has resulted in a considerable reduction in the severity and frequency of merging, rear-end, and total conflicts.
Further development is desired along the analysis procedure. That includes further enhancement and adoption of more accurate road-users tracking and classification. Other developments include the calculation of other severity indicators (e.g., gap-time) to provide more cues for the underlying level of safety of the facility and to set a connection to other safety standard indicators like collision frequency [13]. Future work will also include evaluation of the practicality of the proposed approach can only be achieved through the thorough applications to additional case studies sites.

16th Road Safety on Four Continents Conference Beijing, China 15-17 May 2013
13
BIBLIOGRAPHY [1] A. Tarko, G. Davis, N. Saunier, T. Sayed and S. Washington, "Surrogate measures of
safety," TRB White Paper , 2009. [2] F. Amundsen and C. Hydén, "Proceedings of the First Workshop on Traffic Conflicts," in
Lund Institute of Technology, 1977. [3] T. Sayed and S. Zein, "Traffic conflict standards for intersections," Transportation Planning
and Technology, vol. 22, p. 309–323, 1999. [4] N. Saunier, T. Sayed and K. Ismail, "Large Scale Automated Analysis of Vehicle
Interactions and Collisions," Transportation Research Record: Journal of the Transportation Research Board, vol. 2147, pp. 42-50, 2010.
[5] N. Saunier and T. Sayed, "A Feature-Based Tracking Algorithm for Vehicles in Intersections," in Third Canadian Conference on Computer and Robot Vision, 2006.
[6] M. H. Zaki and T. Sayed, "Automated Classification of Road-User Movement Trajectories," in CSCE International Transportation Specialty Conference, Edmonton, AB, 2012.
[7] K. Ismail, T. Sayed and N. Saunier, "Automated Analysis Of Pedestrian-vehicle Conflicts: A Context For Before-and-after Studies.," Transportation Research Record: Journal of Transportation Research Board, vol. 2198, pp. 52-64, 2010.
[8] K. Ismail, T. Sayed and N. Saunier, "A Methodology for Precise Camera Calibration for Data Collection Applications in Urban Traffic Scenes," Canadian Journal of Civil Engineering, vol. 40, no. 1, pp. 57-67, 2013.
[9] J. Archer, "Methods for the Assessment and Prediction of Traffic Safety at Urban Intersections and their Application in Micro-simulation Modelling," Ph.D Thesis, Royal Institute of Technology, Sweden, 2004.
[10] J. Cinnamon, N. Schuurman and S. Hameed, "Pedestrian Injury and Human Behaviour: Observing Road-Rule Violations at High-Incident Intersections," PLoS ONE, vol. 6, no. 7, 2011.
[11] M. Zaki, T. Sayed, K. Ismail and F.Alrukaibi, "Use of Computer Vision to Identify Pedestrians' Nonconforming Behavior at Urban Intersections,," Transportation Research Record: Journal of the Transportation Research Board, vol. 2279, pp. 54-64, 2012.
[12] J. Autey, T. Sayed and M. Zaki, "Safety Evaluation Of Right-turn Smart Channels Using Automated Traffic Conflict Analysis," Accident Analysis and Prevention, vol. 45, pp. 120-130, 2012.
[13] K. El-Basyouny and T. Sayed, "Safety performance functions using traffic conflicts," Safety Science, vol. 51, no. 1, pp. 160-164, 2013.