stanford geothermal program interdisciplinary research in
TRANSCRIPT

Stanford Geothermal Program Interdisciplinary Research in Engineering and Earth Sciences
STANFORD UNIVERSITY Stanford, California
SGP-TR-54
EXPLORATORY STUDY ON THE INFLUENCE OF THERMAL STRESSING ON THE STRENGTH AND POROSITY OF GRANITE
BY
Rajiv Rana
November 1984
Financial support was provided through the Stanford Geothermal Program under Department of Energy Contract No. DE-AT03-80SF11459 and by the Departnent of Civil
Engineering, Stanford University.

ABSTRACT
I t has been postulated t h a t the cooling of rock by water c i r -
culated in a " h o t d ry rock" geothermal reservoir will induce t ens i l e
thermal s t resses i n the rock of suf f ic ien t magnitude t o cause large
cracks t o form and grow. These cracks may create additional , useful
heat t ransfer a n d flow areas, thereby prolonging the productive l i f e
of a reservoir. T h i s thesis explores, experimentally, the influence
o f thermal s t ress ing on the strength a n d porosity o f granite samples
representative o f geothermal rock. I t i s f o u n d t h a t strength i s
reduced dramatically and porosity increased substant ial ly by t ens i l e
thermal s t ress ing . Strength reductions and porosity increases may
favor formation and growth o f thermal cracks in actual reservoirs by
reducing local rock fracture toughness and allowing hydrostatic pore
pressure t o counteract tectonic compressive s t r e s s .

T A B L E O F CONTENTS
Paqe
ABSTRACT . . . . . . . . . . . . . . . . . . . . . . . . . . . . . . ii
TABLE OF CONTENTS . . . . . . . . . . . . . . . . . . . . . . . . . iii
List of Figures . . . . . . . . . . . . . . . . . . . . . . . . . i v List o f Tables . . . . . . . . . . . . . . . . . . . . . . . . . . v i Nomenclature . . . . . . . . . . . . . . . . . . . . . . . . . . . v i i
CHAPTER 1 . INTRODUCTION . . . . . . . . . . . . . . . . . . . . . . 1
C H A P T E R 2 . LITERATURE REVIEW . . . . . . . . . . . . . . . . . . . 5
C H A P T E R 3 . EXPERIMENTAL P R O C E D U R E . . . . . . . . . . . . . . . . . 12
3 . 1 Apparatus t o Produce Thermal Stress . . . . . . . . . . . . . 12 3 . 2 Temperature Distribution in Specimens . . . . . . . . . . . . 15 3 . 3 Thermal Stress Distribution . . . . . . . . . . . . . . . . . 23 3 . 4 Determination o f Surface Heat Transfer Coefficient ( h ) . . . . 34
34 3 . 4 . 2 Determination o f h Comparing Cooling Curves . . . . . . 40
3 . 5 Procedure t o Determine Strength and Porosity Changes Due t o Thermal Stressing . . . . . . . . . . . . . . . . . . . 44
3.4.1 Determination o f h Using the Transient Technique . . . .
CHAPTER 4 . TEST RESULTS . . . . . . . . . . . . . . . . . . . . . . 52
4 . 1 Bending Strength Tests . . . . . . . . . . . . . . . . . . . . 53 4.2 Porosity Evaluation . . . . . . . . . . . . . . . . . . . . . 58 4 . 3 Dye Penetrant Method . . . . . . . . . . . . . . . . . . . . . 58
CHAPTER 5 . DISCUSSION. . . . . . . . . . . . . . . . . . . . . . . 60 .
CHAPTER 6 . CONCLUSIONS . . . . . . . . . . . . . . . . . . . . . . 63
CHAPTER 7 . REFERENCES . . . . . . . . . . . . . . . . . . . . . . . 64
APPEND1 X : Computer Program t o Eva1 uate Transient Thermal Stresses . . . . . . . . . . . . . . 67

LIST OF FIGURES
Page Figure
1.1 Schematic of the Los Alamos Scient i f ic Lab H o t Dry Rock Geothermal Energy Extraction Scheme .............................................. 2
3.1 Experimental Setup for Producing Thermal Stress ..............................................
3.2 Granite Block with Dimensions 5" x 5" x 5" and the Thermocouple Arrangement .................... 14
16
17
20
Smaller Granite Specimen and Insulation System ...... 3.3
3.4
3.5
3.6
Semi-Infinite Solid ................................. Finite Solid Insulated Except a t Face X = 0 ......... Estimated Temperature Distribution in Granite Block for h = 5 B t u / h r f t F .......................... 2 21
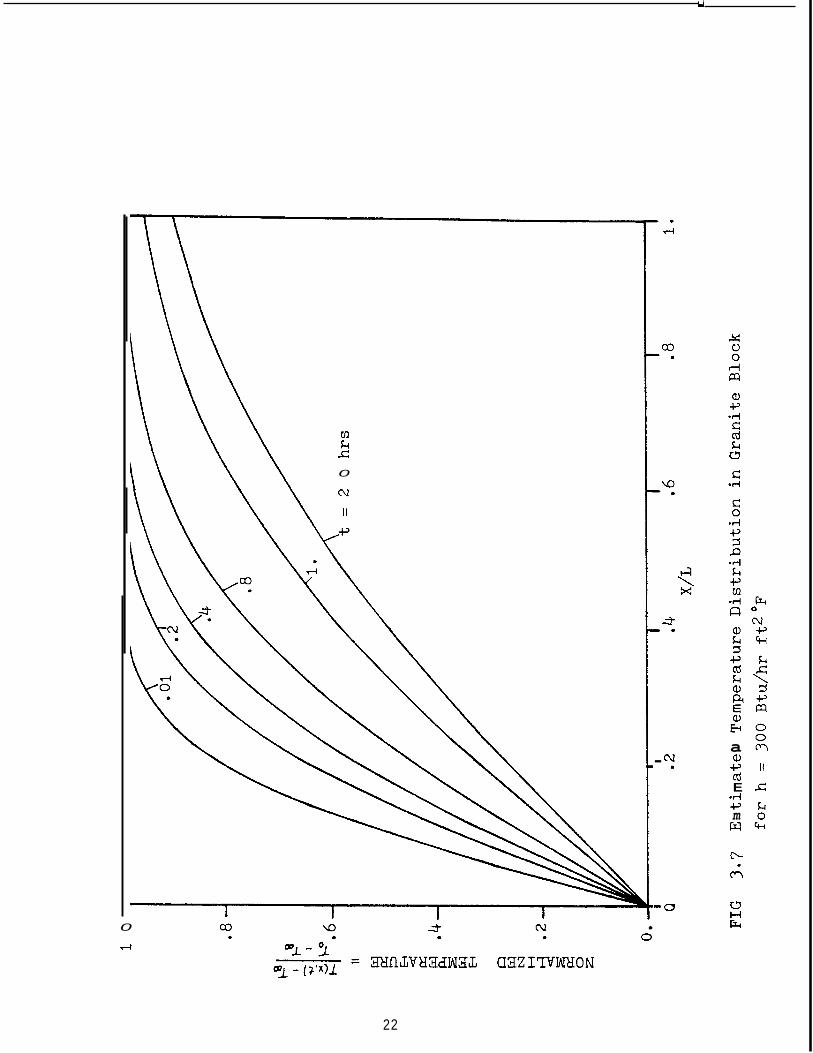
Estimated Temperature Distribution in Granite Block for h=300 B t u / h r f t F ........................ 2
3.7
3.8
3.9
3.10
3.11
3.12
3.13
22
Estimated Thermal Stress Distribution in Granite Block for h=300 B t u / h r f t F ........................ 2 27
Estimated Thermal Stress Distribution i n Granite 2 Block for h = 5 B t u / h r f t F .......................... 28
Estimated Thermal Stress History i n Granite Block for h = 5 B t u / h r f t F .......................... 2 29
Estimated Thermal Stress History in Granite Block for h=300 B t u / h r f t F ........................ 2 30
Estimated Surface Thermal Stress Variation in Granite Block ....................................... 31
Maximum Thermal Stress vs. Time for Various Heat Transfer Coefficients in Granite Block ......... 32
3.14 Schematic of Copper Plate and Thermal Circuit Representation for Transient Technique .............. 35
- iv-

Page Figure
3.15
3.16
3.17
3.18
3.19
3.20
3 .21
3.22
4 . l a
4 . l b
5 .1
Transient Temperature vs . Time Plot fo r Copper Plate ............................................... 39
Comparison of Cooling Curves a t X = 0.05 ............ 4 1
Comparison of Cooling Curves a t X = 0 . 1 ............. 42
Time . Temperature History a t X = 0 . 1 ............... 43
Bending Test Specimen ............................... 45
Bulk Volume Meter ................................... 46
Apparatus for Saturating Consolidated Cores under Vacuum ........................................ 47
Apparatus for Boy1 e ' s Law Porosity Measurements ..... 50
Bending Strength of Specimens Taken from Block ...... 57
Estimated Thermal Stress Distribution in Granite Block ....................................... 57
Schematic o f Experimental Setup to Better Simulate Stresses Under Geothermal Reservoir Conditions ...... 6 1
-V-

L I S T O F T A B L E S
T a b l e
3.1
4 .1
4 .2
4.3
4.4
4.5
4.6
Page
T E M P E R A T U R E H I S T O R Y IN C O P P E R P L A T E ................. 38
B E N D I N G S T R E N G T H OF V I R G I N G R A N I T E S P E C I M E N S . . . . . . . . 54
B E N D I N G S T R E N G T H O F S P E C I M E N S A F T E R ONE QUENCH . . . . . . 54
B E N D I N G S T R E N G T H O F S P E C I M E N S A F T E R ONE QUENCH ...... 55
B E N D I N G S T R E N G T H OF S P E C I M E N S A F T E R F I V E Q U E N C H E S ... 55
B E N D I N G S T R E N G T H O F S P E C I M E N S A F T E R F I V E Q U E N C H E S ... 56
P O R O S I T Y MEASUREMENT BY S A T U R A T I O N METHOD ........... 59
-vi-

NOMENCLATURE
English Letter Symbols
A = heat t ransfer surface area
B = Biot number
C = heat capacity r a t e
Cp = spec i f ic heat
E = Young's modulus
h = heat t ransfer coeff ic ient
Ks = thermal conductivity
L
p = dimensionless s t r e s s
P = t ens i l e strength
q = surface t ens i l e s t r e s s
t = time
T = temperature
V = volume of specimen
W = weight of specimen
x = distance below surface
X = dimensionless length, x/L
= length o f the specimen
Greek Letter Symbols
~1 = coeff icient of thermal expansion
P = density
v = Poisson's r a t i o
B = thermal d i f fus iv i ty
5 = Fourier number
0 = dimensionless temperature
-vii-
0 = s t r e s s
@ = p o r o s i t y
u = shear modulus
S u b s c r i p t s
o = i n i t i a l c o n d i t i o n s
m = f l u i d c o n d i t i o n s
S u p e r s c r i p t
- = average v a l u e o f t h e v a r i a b l e
-v i i i -

1. INTRODUCTION
The increasing energy problem during recent years has resulted in a
greater awareness of a l te rna te energy sources, prominent among which are
the substantial subterranean reservoirs of geothermal energy. For several
decades, s igni f icant quantit ies o f energy have been extracted from natural
hydrothermal reservoirs containing e i the r steam or h o t water (such as in
Ladero, I t a l y ; Wairakei, New Zealand a n d a t The Geysers in northern
Cali fornia) . ex i s t a t accessible depths in heated rock formations which e i the r contain
l i t t l e water or have permeabilities so low t h a t any exis t ing water cannRt
be extracted a t useful ra tes . Such "hot , d r y rock" ( H D R ) geothermal 4 reservoirs contain roughly 5 x 10 Quads of accessible energy by U.S.
Geological Survey estimate ( l ) , which i s a b o u t 700 times the to ta l U.S.
energy consumption in 1970. Even i f efficiences o f conversion t o elec-
However , m u c h 1 arger amounts of untapped geothermal energy
t r i c a l energy prove t o be only a few percent, development of commercially
feas ib le means for "mining" t h a t energy would s t i l l provide a s ign i f i can t ,
environmentally a t t r ac t ive contribution t o U.S. energy resources.
The Los Alamos Scient i f ic Laboratory ( L A S L ) has been tes t ing a
concept for extraction of H D R energy t h a t has already demonstrated
technical f eas ib i l i t y . Brief ly, the concept consists o f d r i l l i n g a n d
casing a well t o a depth where rock temperature i s suf f ic ien t ly high
(ZOO-400°C), then pressurizing the well , causing a hydraulic f racture
t o form a t the bottom of the wellbore, as depicted in Figure 1.1. The
f rac ture resembles a t h in , penny-shaped crack with a width o f several
millimeters and "radius" of roughly 100 meters. A second well i s direc-
t iona l ly d r i l l ed t o in te rsec t the fracture. By pumping water down one
1

z 0 H E
c 0
2
0 H Frc

well, c i rculat ing i t t h r o u g h the f rac ture , a n d returning i t t h r o u g h the
other well , useful energy can be extracted from th i s underground boi ler .
The energy which can be produced from an H D R reservoir i s degraded
as the rock surrounding the hydraulic f racture i s cooled. When the rock
temperature i s drawn down low enough ( =150°C) , economic production o f
e l ec t r i ca l energy may become marginal.
molten magma kilometers below the fracture takes thousands o f years.
Recharge from adjoining rock i s also a very slow process. T h u s the
economic v iab i l i t y o f H D R energy i s yet t o be demonstrated i n terms of
length o f production time needed t o j u s t i fy the capi tal investment i n
d r i l l i n g wells , b u i l d i n g a generating p l a n t , e tc .
Thermal energy recharge from the
Recently i t has been suggested ( 2 ) t h a t the cooling o f the rock
surrounding the hydraulic fracture will induce thermal s t resses o f
su f f i c i en t magnitude t o cause cracks t o form a n d grow perpendicular t o
the fracture.
heat t ransfer and flow areas , then additional energy can be extracted a t
l i t t l e additional cost. Furthermore, as a reservoir i s drawn down, the
decline in rock temperature may be o f f se t by the additional heat t ransfer
area, perhaps leading t o re la t ive ly s tab le production temperatures. Thk
extent t o which thermal fracturing can increase reservoir o u t p u t o r
lengthen useful production time may well have a s igni f icant bearing on
the commercial f e a s i b i l i t y of H D R goethermal energy.
I f these cracks are e f fec t ive in creating fresh, useable
Murphy ( 2 ) has proposed t h a t cracks will form and grow with time in
those regions where the t ens i l e thermal s t r e s s exceeds the sum o f the
compressive tectonic s t r e s s acting perpendicular t o the direction o f
crack growth plus
i mpermeabl e rock.
the rock t ens i l e strength. This c r i t e r ion assumes
He noted, however, t h a t i f the rock has su f f i c i en t .
3

permeability t o allow water i n f i l t r a t i o n such t h a t the rock pore pressure
i s raised t o hydrostatic leve ls , then the effect ive compressive s t r e s s t o
be overcome will be greatly reduced, increasing the propensity for a n d
r a t e of thermal fracturing. Murphy a lso estimated t h a t i f thermal cracks
grow t o the point where the i r aperture i s o n the order of 0 .5 mm, s ign i f i -
cant flowrates and heat t ransfer can be expected. An analytical study by
Nemat-Nasser e t a l . ( 3 , 4 ) indicates t h a t thermal cracks forming perpen-
dicular t o the hydraulic fracture will i n i t i a l l y have a spacing roughly
equal t o t h e i r depth. With time, some o f the cracks will continue t o
propagate t o maintain the approximate equality between t h e i r depth a n d
spacing, while the others will be arrested. Later, secondary thermal
cracks may form perpendicular t o the original thermal cracks , leading t o
a three-dimensional f racture network.
The thermal s t resses induced by cooling water may also change the
physical properties of the rock, b u t l i t t l e i s k n o w n about t h i s . These
changes may, in turn, influence H D R thermal cracking behavior. I n a
preliminary e f f o r t t o see i f such changes occur and a re l ike ly t o be
s igni f icant , t h i s thes is explores experimentally the e f fec t of thermal
s t ress ing on the strength a n d porosity of granite block typical of t h a t
found in H D R reservoirs.
4

2. LI T E R A T U R E R E V I E W
The behavior of b r i t t l e materials subjected t o thermal s t ress ing
has been studied by a number o f researchers. The l i t e r a t u r e survey i n
t h i s section reviews work undertaken t o investigate material properties
which influence the thermal s t r e s s resistance o f a b r i t t l e substance.
Winkelman a n d Schott ( 5 ) considered a semi- infinite body, or iginal ly
a t zero degree temperature t h r o u g h o u t , suddenly cooled t o a given temper-
ature along the f ree surface. The mater ial ' s thermal shock resis tance,
defined by the r a t i o o f the mater ial ' s t ens i l e s t rength, P, t o the
applied surface (maximum) t ens i l e s t r e s s , q, was given b y :
P / q = P / { J k S / [ E a ( p c ) ' / 2 ( A T ) l ( I / B )
where
kS = thermal conductivity
E = Young's Modulus
(I = coeff ic ien t of thermal expansion
P = density
C = heat capacity ra te h L B = Biot number = - kS
h = heat t ransfer coeff ic ient a t surface
L = t e s t specimen thickness
AT = I n i t i a l temperature difference between the specimen
and quenching medium.
The authors postulated t h a t thermal f a i lu re will n o t occur so long as
( P / q ) >1, and f o u n d t h a t Equation 2 . 1 predicted qui te reasonably the
5
maximum s u r f a c e tempera ture drop t h e m a t e r i a l c o u l d w i t h s t a n d w i t h o u t
f a i l i n g i n t e n s i o n . Exper iments were done w i t h 1 cm and 2 cm cubes
made o f twen ty d i f f e r e n t types o f g lass .
w i t h s t o o d g r e a t e r tempera ture d i f f e r e n c e s t h a n l a r g e r ones.
Smal le r cubes c o n s i s t e n t l y
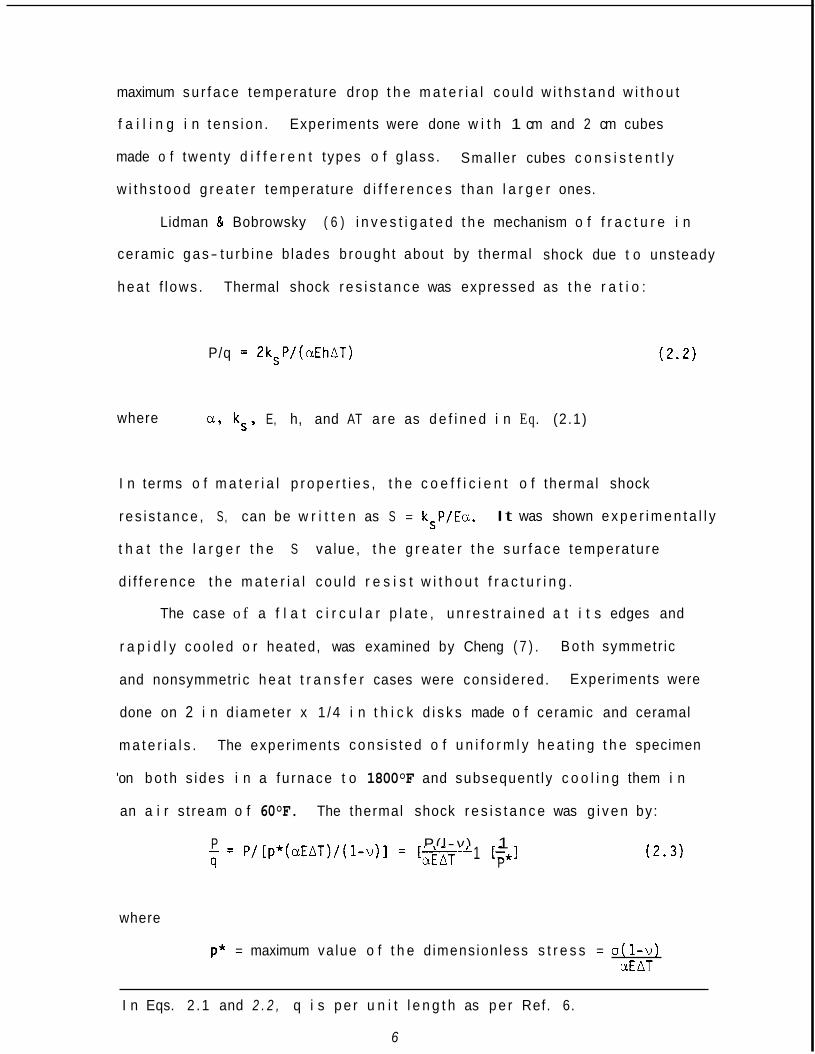
Lidman & Bobrowsky ( 6 ) i n v e s t i g a t e d t h e mechanism o f f r a c t u r e i n
ceramic g a s- t u r b i n e b lades b rough t about by thermal shock due t o unsteady
h e a t f l ows . Thermal shock r e s i s t a n c e was expressed as t h e r a t i o :
P/q = 2kSP/(aEhAT)
where a , ks , E, h, and AT a re as d e f i n e d i n Eq. (2.1)
I n terms o f m a t e r i a l p r o p e r t i e s , t h e c o e f f i c i e n t o f thermal shock
r e s i s t a n c e , S, can be w r i t t e n as S = kSP/Ea.
t h a t t h e l a r g e r t h e S va lue , t h e g r e a t e r t h e s u r f a c e tempera tu re
d i f f e r e n c e t h e m a t e r i a l c o u l d r e s i s t w i t h o u t f r a c t u r i n g .
It was shown e x p e r i m e n t a l l y
The case o f a f l a t c i r c u l a r p l a t e , u n r e s t r a i n e d a t i t s edges and
r a p i d l y coo led o r heated, was examined by Cheng ( 7 ) .
and nonsymmetri c h e a t t r a n s f e r cases were cons idered.
done on 2 i n d iamete r x 1 /4 i n t h i c k d i s k s made o f ceramic and ceramal
m a t e r i a l s .
'on b o t h s ides i n a fu rnace t o 1800°F and subsequent ly c o o l i n g them i n
an a i r s t ream o f 60°F. The thermal shock r e s i s t a n c e was g i v e n by :
B o t h symmetr ic
Exper iments were
The exper iments c o n s i s t e d o f u n i f o r m l y h e a t i n g t h e specimen
P( l - v ) 1 1 [-*I P - = P/ [ p * (aEAT) / ( l - v ) ] = [m-- 9 P (2.3)
where
p* = maximum va lue o f t h e d imens ion less s t r e s s = a ( 1 - v ) ^ . _ atn I
I n Eqs. 2 .1 and 2 . 2 , q i s p e r u n i t l e n g t h as p e r Ref. 6.
6
CT = thermal s t r e s s a t any point in the disc
v = Poisson's r a t io .
Experiments showed t h a t no specimen with a ( P / q ) value o f less t h a n unity
survived a s ingle complete shock, whereas each with a ( P / q ) in excess of
unity withstood a t l ea s t 25 cycles. Cheng also noted t h a t thermal stock
resistance i s n o t a n i n t r i n s i c property of a material b u t greatly depends
on the manner i n which the heat i s supplied ( i . e . , on h ) a n d on the form
a n d dimension o f the specimen tested.
More work was done on 2 in diameter x 1 / 4 in disks by Mason & Smith
They used s t e a l i t e and glass specimens and ra ther t h a n cooling the ( 8 ) .
f l a t la te ra l faces in the manner of Cheng, they insulated these and
subjected the discs t o quenching along the f ree periphery. The au thor s
noted t h a t the thermal shock resistance of most b r i t t l e materials i s a
function of two or more parameters. The re la t ive importance of each
parameter depends on the severi ty of the quench for a given s i ze specimen
o f a given material. They found t h a t f o r materials obeying the maximum
s t r e s s theory o f f a i l u r e , the parameter governing thermal shock resistance
i s P/(Ea) only for very severe quenches ( la rge h ) or very large character-
i s t i c dimensions.
under these conditions, even t h o u g h i t becomes important for r e l a t ive ly
small values of Biot number where heat t ransfer r a t e i s largely governed
by the value of thermal conductivity. T h u s thermal shock resistance
cannot, in general, be expressed by a s ingle parameter, such as ksP/Ea,
as often has been attempted. Instead, two or more parameters must be
evaluated depending upon the conditions o f t e s t geometry a n d quench
severi ty . The authors also examined the i r experimental resu l t s in terms
The thermal conductivity, ks, has l i t t l e influence
7

o f Weibull's s t a t i s t i c a l theory of strength.
the assumed presence o f flaws and s t a t e s t h a t the p r o b a b i l i t y o f f a i lu re
o f a given specimen depends on the volume under s t r e s s a n d on the s t r e s s
d is t r ibut ion .
f o r onset o f thermal s t r e s s cracking, for the c i rcu lar discs. Then they
evaluated the s t r e s s dis t r ibut ion for instants when the r isks o f rupture
were a maximum. Comparison with s t r e s s dis t r ibut ions a t the time o f
maximum s t r e s s showed t h a t the s t r e s s dis t r ibut ion based o n Weibull's
theory gave a be t te r estimation o f f a i lu re in the c i rcu lar discs
considered.
This theory i s based on
They calculated the maximum risk of rupture, a c r i te r ion
Another t h o r o u g h analytical study of the thermal shock resistance
phenomenon was undertaken by Mervoelli, e t . a1 . ( 9 ) . They also
experimented with thin c i rcu lar disks (measuring 2 1/8 in d i a . x 1 / 4 i n
t h i c k ) , the l a t e ra l surfaces o f which were assumed t o be perfectly
insulated so t h a t heat conduction was constrained t o the radial direction
alone.
taconi te .
maximum s t r e s s theory a n d one similar t o Weibull's theory, referred t o as
the "average s t r e s s theory". Cooling experiments showed t h a t there was
l i t t l e difference between the predictions of f a i lu re by b o t h theories when
the Biot number was small (under mild quenching). Signif icant differences
were found when the B i o t number was large (under severe quenching), in
w h i c h case fa i lures correlated be t te r with the average s t r e s s theory.
They chose rock specimens, especially basal t , quartzi te a n d
Two cases of f a i lu re were considered, one predicted by the
Hasselman ( 1 0 , 11) discussed the principal material properties which
a f fec t the propagation of cracks under conditions of thermal shock. From
these material properties, "thermal shock damage resis tance parameters"
were derived, which a re indicative of the re la t ive resis tance o f materials
8
t o damage a f t e r cracking by thermal shock has been nucleated. The author
applied G r i f f i t h ' s c r i te r ion for crack propagation, and concluded t h a t
for a low degree o f damage there must be small values of strength and
high values of Young's modulus o f e l a s t i c i t y a n d Poisson's ra t io .
over the extent of crack propagation was found t o be a function of
spec men volume, numbers of cracks nucleated, e t c . The a u t h o r also
noted t h a t microstructural inhomogeneities in the material act as micro-
mechanical thermal s t r e s s concentrators , he1 ping t o nucleate cracks b u t
reducing subsequent crack propagation.
More-
Crack propagation was fur ther analyzed by Hasselman ( 1 2 ) . Thermal
shock experiments on c i rcu lar aluminum oxide rods showed t h a t a n i n i t i a l l y
short crack , unstable a t a c r i t i c a l temperature difference , propagates t o
a new length such t h a t a f i n i t e increase in temperature difference i s
required before the crack will continue t o propagate.
analogy between crack propagation under thermal shock a n d under constant
deformation ( s t r a i n ) .
The a u t h o r drew an
Further study of the severity of thermal shock required t o i n i t i a t e
cracking a n d the amount of cracking produced by a shock of fixed severi ty
was done by Davidge a n d Tappin ( 1 3 ) . Experiments u t i l ized ceramic A1203
specimens of b o t h square a n d round cross-sections which were quenched in
20°C water. The fracture strength was determined by three point bend
t e s t s on quenched a n d unquenched specimens a n d showed a dras t ic reduction
for specimen temperatures of 220°C.
U/yF. where
e f fec t ive surface energy.
define the l imit of new crack area produced.
The amount o f cracking was related t o
U i s the e l a s t i c energy produced by the shock a n d y F i s the
The a u t h o r found t h a t quantity U/y, seemed t o
The e f fec t o f porosity on thermal s t ress f racture has been studied by
various authors (14-18). This e f fec t can be investigated from the points
9

o f view of b o t h nucleation o f cracking a n d degree o f damage.
Kingerly ( 1 4 ) demonstrated for sintered alumina t h a t the overall e f f ec t i s
t o lower thermal shock crack nucleation resistance.
o f crack propagation, however, the e f f e c t o f porosity on strength and on
Young's modulus o f e l a s t i c i t y i s t o reduce substant ial ly the e l a s t i c
energy stored a t f racture. Porosity, therefore, tends t o reduce the
degree o f damage i n agreement with the observations o f Parmelee a n d Westman
( 1 5 ) , Bartsch ( 1 6 ) , Kat0 a n d Okuda ( 1 7 ) , and Richardson (18) . Pores are
often ci ted as acting as crack a r re s to r s , a n d in th i s manner are t h o u g h t
t o increase thermal shock damage resistance.
Gupta (19 ) demonstrated the e f fec t of microstructure, especially of
Coble a n d
From the p o i n t o f view
grain s i z e , o n the strength degradation charac ter i s t ics of alumina sub-
jected t o thermal shock. High density aluminas with grain s izes of 10 ,
28, 34, 40, a n d 80 pm were subjected t o thermal shock a n d then tested for
strength in four point bending t e s t s . These experiments showed t h a t the
strength degradation was catastrophic for a l l specimens except those w i t h
a g r a i n s i ze o f 80 pm. The a u t h o r points o u t t h a t above a c r i t i c a l grailn
s i z e the fa i lure charac ter i s t ic becomes completely "noncatastrophic".
Formation o f microcracks in the highly stressed zone ahead of the major
propagating crack resu l t s i n slow crack growth and hence the "noncata-
strophic" fa i lure . A recent study ( 2 0 ) on mica glass-ceramic under thermal
shock also indicated t h a t when g r a i n s i ze i s increased from 70 t o 200 unl,
the f a i lu re mode changes from catastrophic tol'noncatastrophic'!
From the above br ief review, i t i s c lear t h a t the cracking of b r i t t l e
material due t o thermal s t ressing can, i n general , be a function of
several variables, including mechanical properties, thermal propert ies ,
specimen s i ze and shape, severity of the thermal shock and microstructura
10

charac ter i s t ics (e .g . , grain s i z e ) . The two most popular fa i lure theories
f o r crack nucleation are the maximum s t r e s s theory ( i n which cracking i s
postulated when the t ens i l e strength i s exceeded a t the p o i n t o f maximum
s t r e s s ) a n d the average s t r e s s theory ( i n which cracking i s expected when
s t r e s s averaged over a c r i t i c a l volume o f material exceeds the t ens i l e
s t rength) .
11

3. E X P E R I M E N T A L P R O C E D U R E
3 .1 Apparatus t o Produce Thermal Stress
I n order t o investigate the influence of thermal s t ress ing on granite
strength a n d porosity, the experimental setup shown schematically in Figure
3.1 was devised. I t consists of a heating oven ( A ) , temperature control ler
(B), temperature recorder ( C ) , and water quenching system ( D ) . The heating
system i s a Kress Kiln ( C - 1 1 - H ) w i t h inner dimensions of 11" x 11" x 11"
and a power rat ing of 15 amps a t 110 volts. Heating elements are ins ta l led
a round the f o u r sides t o promote uniform heating. A metal sheet i s p u t
j u s t in f r o n t of the heaters t o fur ther increase the uniformity. Temper-
ature inside the kiln i s governed by the time proportioning temperature
control ler ( B ) .
nation o f power regu ators a n d the temperature control ler .
Des red heating rates can be achieved by a proper combi-
I n i t i a l l y , a 5" x 5" x 5" granite block, shown in Figure 3 .2 , was
used for the f i r s t few thermal shock experiments. The block was heated
in the oven a t a r a t e of 2OF/min t o avoid thermal cracking during heating.
The uniformity o f temperature dis t r ibut ion inside the rock was checked by
measuring temperatures a t ten d i f fe rent locations shown in Figure 3.2.
One inch deep holes were dr i l led a t these locations and thermocouples
ins ta l led using Saueriesen Low Expansion cement t o provide good contact
w i t h the rock.
temperature response.
encountered in attempting t o d r i l l them with available equipment. The
thermocouples used were J-type and were calibrated with boiling water
before a n d a f t e r the experiments.
a t locations 4 , 9 , 10 were within 2 1 ° F of each other, showing
uniform heating of the block.
This cement i s a very good conductor thus ensuring a gopd
Deeper holes were n o t possible due t o t h e ' d i f f i c u l t i e s
During heating, temperatures recorded
Also the temperatures a t 6 , 7 , 8 were
1 2

.. . l a
n
w I4 & 3 0
13

A
FIG. 3 . 2 Granite Block with Dimensions 5 'x5"%5" and The Thermocouple Arrangement
14

sudden drop a f t e r e i g h t e e n minutes .
m a l f u n c t i o n i n g when checked a f t e r t h e
showed a sudden change i n tempera ture
w i t h i n f 2 O F . The s p a t i a l v a r i a t i o n o f tempera ture was about 5°F .
Temperatures were recorded c o n t i n u o u s l y w h i l e quenching t h e b l o c k f o r
app rox ima te l y an hour. Dur ing quenching, t h e tempera ture a t 3 showed a
he thermocouple a t 3 showed no
exper iment . Another quenching r u n
a t l o c a t i o n 5 though t h e thermocouple
showed no ma l func t i on ing . An e x p l a n a t i o n f o r t h e m a l f u n c t i o n s was n o t
apparent . To simp1 i fy c a l c u l a t i o n s o f t r a n s i e n t tempera ture and thermal s t r e s s
b e h a v i o r , a l l subsequent exper iments u t i l i z e d t h i n s l a b s t o b e t t e r app rox i-
mate one-dimensional hea t f l ow . The d e t a i l s o f t h e specimen and method o f
i n s u l a t i o n a re shown i n F igu re 3.3. The g r a n i t e s l a b s (2 -1 /4 " x 10" x 1 / 4 " )
were c u t f rom a l a r g e r b l o c k w i t h a 1 /16 i n t h i c k diamond saw. Asbestos
was used f o r b u i l d i n g t h e i n s u l a t i o n box and was made a i r t i g h t w i t h
Sauer iesen cement. The a i r gap i n t h e box p r o v i d e d even b e t t e r i n s u l a t i o n .
3.2 Temperature D i s t r i b u t i o n i n Specimens
The f i r s t t a s k i n c a l c u l a t i n g t h e thermal s t r e s s d i s t r i b u t i o n w i t h i n
t h e r o c k i s t h e d e t e r m i n a t i o n o f tempera ture d i s t r i b u t i o n i n i t .
t r a n s f e r i n t h e g r a n i t e b l o c k specimens can be ana lyzed approx ima te l y b y
c o n s i d e r i n g a s o l i d o f i n f i n i t e th i ckness as shown i n F igu re 3.4. The
s o l i d i s i n i t i a l l y a t t h e tempera ture To th roughou t , and t h e s u r f a c e i s
c o o l e d c o n v e c t i v e l y b y t h e f l o w i n g f l u i d a t tempera ture Too.
assumed t o be o n l y i n t h e d i r e c t i o n normal t o t h e s l a b , denoted by
coo rd ina te . I t i s a l s o assumed t h a t t h e tempera ture v a r i a t i o n
he s l a b depends o n l y on t h e c o n d i t i o n s imposed a t t h e x = 0 s u r f a c e .
Heat
A l l t h e hea t
The assumptions made t o s i m p l i f y t h e hea t t r a n s f e r a n a l y s i s a re : [ i )
thermal c o n d u c t i v i t y , ks , s p e c i f i c heat , Cp, and d e n s i t y , p , o f t h e r o c k a r e
f l o w i s
t h e x
w i t h i n
1 5

I ,
\
E a,
c 0
a, -P .I4 C cd k 0 k Q) d d cd E LR
16

QUENCXED FACE
00
t
FIG. 3.4 Semi-Infinite S o l i d
17

assumed constant with respect t o temperature and ( i i ) the surface heat
t ransfer coef f ic ien t , h , i s also assumed t o be constant.
The one-dimensional , nonsteady heat t ransfer for a semi- infinite
sol id i s governed by the conduction equation
kS
pcP where: B = - a 2 T - 3T
ax B2-x (3.1)
The i n i t i a l and boundary conditions for the rock f luid system are a t
t = O : T = T , f o r x 2 O ( 3 . 2 a )
where: t = time
x = distance below the surface
T = temperature of the sol id a t time t
To = i n i t i a l temperature of the sol id a t t > o : h A I T m - T ( o , t ) ] = k s A ( z ) x = o aT (3.2b)
where Tm = f lu id temperature
b = average surface heat t ransfer coeff ic ient
A = heat t ransfer surface area
The solution, obtained by the method of Laplace transforms [ 2 2 1 , i s
gi ven by :
The term "er f" in Eq. (3 .3 ) i s the e r ror function and i s given by:
18
( 3 . 4 )

Values of the e r ro r function are usually tabulated in standard
mathematical handbooks. The computer program developed here for
determining the temperature profi le uses IBM's s t a n d a r d mathematical
e r ro r function (Appendix ) . The heat t ransfer conditions described
by Equation 3.3 are also realized in a f i n i t e s lab of thickness L
which i s insulated a r o u n d i t s periphery (Fig. 3 .5 ) . The i n i t i a l a n d
boundary conditions given by Equat ion 3.2 are also valid for th i s s lab.
As long as the temperature e f f ec t has n o t s igni f icant ly reached the
face x = L , the semi- infinite solution i s s t i l l applicable.
The solution f o r the f i n i t e s lab of length L , which more closely
approximates the s i tua t ion in the granite block specimen, can be expressed
in dimensionless form by defining the following parameters:
X x = - L
B = Biot Number = h L / k S
2 2 5 = Fourier Number = h B t / k s
0 = dimensionless temperature = (T-Tm) + (To-T,)
Using t h e above parameters, Equation 3.3 becomes
where D =dL2/4f3t.
Using representative values of p , Cp and ks fo r granite, the temper- 2 ature-time dis t r ibut ions for h = 5.0 and h = 300.0 B t u / h r F. f t are
plotted in Figures 3.6 and 3.7. As expected, the e f f ec t of temperature
disturbance i s f e l t more rapidly a t the face X = 1.0 for h = 300.0 t h a n

Y
0 #
/ 0
/ 0
/
t x = o . o
I n s u l a t e d F a c e s : 1 , 2 , 3 , 4 , 5
FIG. 3 .5 F i n i t e S o l i d I n s u l a t e d E x c e p t a t Face X=O
20

0
d
\o cu' . 0
2 1
m k c 0
c\l
ti
0
rl
22
s
N - .
-0
0
c 9l-i
a 0 -P cd E .ti -P m w
0 H Erc

f o r h = 5.0.
by the condition:
appl icabi l i ty i s achieved for t 5 1 hrs for the case of h = 300.00 a n d
I f appl icabi l i ty of the in f in i t e s lab solution i s defined
TX = l.o / T 2 0 . 9 5 , then from Figures 3.6 a n d 3 .7 ,
t 2 hrs for h = 5.0. This provides an estimate of the time duration
during which a f i n i t e s lab of length L can be cooled and s t i l l be con-
sidered an i n f i n i t e so l id .
3.3 Thermal Stress Distribution:
After the temperature-time dis t r ibut ion i s found, one can proceed t o
calculate the s t r e s s dis t r ibut ions inside the sol id .
the analysis , the following idealizations are made:
( i ) The h a r d , c rys ta l l ine rock i s treated as a l inear ly e l a s t i c ,
I n order t o simplify
i so t ropic , homogeneous, b r i t t l e continuous medium.
( i i ) The rock i s assumed t o have temperature independent thermal and
mechanical properties.
( i i i ) Coupling between thermal a n d e l a s t i c behavior, as well as ine r t i a l
e f f ec t s , are negligible.
( i v ) Body forces are considered t o be negligible as compared t o thermal
s t resses .
The governing thermoelastic equations t o be s a t i s f i e d are equations
of equilibrium, equations of compatibility and the boundary conditions.
The equations o f equi,lifjrium expressed in terms of s t r e s s components for
zero body forces are writ ten in Cartesian coordinates as follows:
23

The c o m p a t i b i l i t y e q u a t i o n s i n terms of s t r e s s components a r e :
n n
where
H = u + u x x yy + O Z Z
a2 a2 a2 v2 = - + - + - ax2 ay2 az 2 and
The s e m i - i n f i n i t e s o l i d under c o n s i d e r a t i o n has a l l t h e s u r f a c e s f r e e o f
t r a c t i o n s . I n t h i s case t h e boundary c o n d i t i o n s a r e
= o uxxnx + Oxyny + axznz
o n + u n + u n = O XY x YY Y Y Z
= o uxznx + Oyz"y + OzZnz ( 3 . 8 3
24
where: n x , n
r espec t i v e l y . nz a re u n i t normals i n t h e x, y, and z d i r e c t i o n s ,
Y '
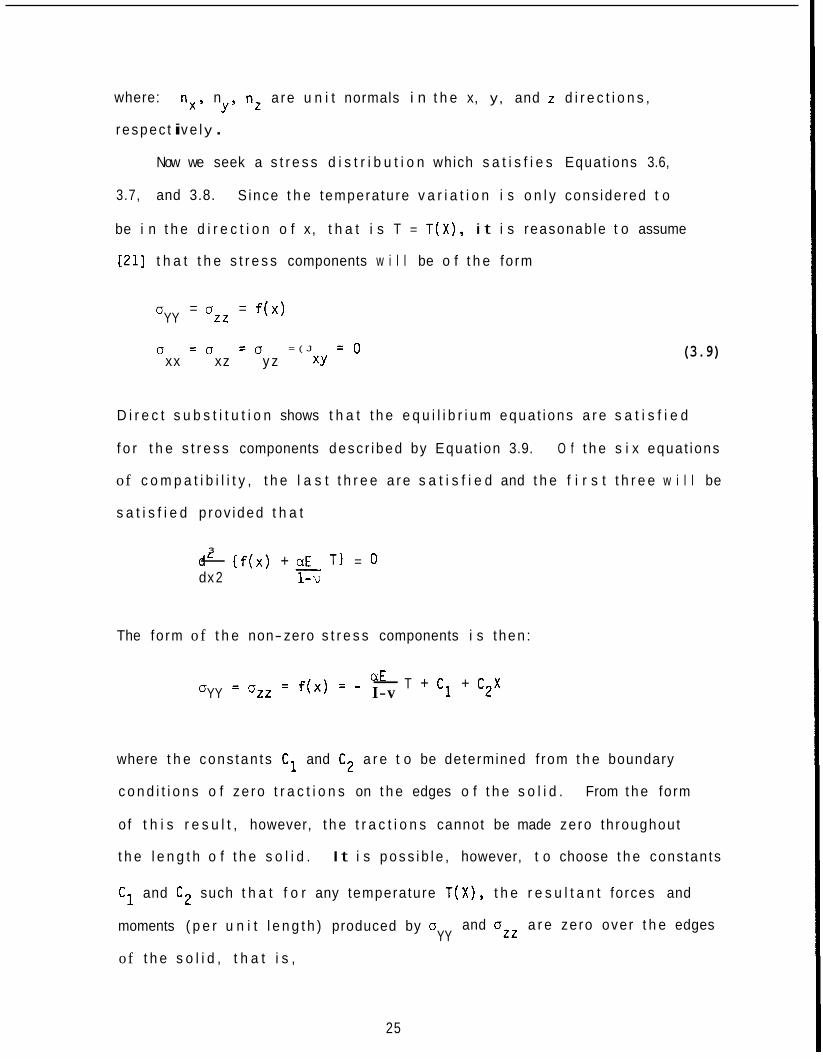
Now we seek a s t r e s s d i s t r i b u t i o n which s a t i s f i e s Equat ions 3.6,
3.7, and 3.8.
be i n t h e d i r e c t i o n o f x, t h a t i s T = T ( X ) , i t i s reasonab le t o assume
E211 t h a t t h e s t r e s s components w i l l be o f t h e fo rm
S ince t h e tempera tu re v a r i a t i o n i s o n l y cons idered t o
(J = 0 = f ( x ) YY ZZ
0 = o = o = ( J = o xx xz y z XY
(3.9)
D i r e c t s u b s t i t u t i o n shows t h a t t h e e q u i l i b r i u m equa t i ons a r e s a t i s f i e d
f o r t h e s t r e s s components desc r i bed by Equat ion 3.9. O f t h e s i x equa t ions
of c o m p a t i b i l i t y , t h e l a s t t h r e e a r e s a t i s f i e d and t h e f i r s t t h r e e w i l l be
s a t i s f i e d p rov ided t h a t
3 CtE - dL { f ( x ) + T I = 0
dx 2
The fo rm o f t h e non-zero s t r e s s components i s t hen :
0 = 0 = f ( x ) = - - ciE T + C1 + C2X YY ZZ I-v
where t h e cons tan t s C1 and C2 a r e t o be determined f rom t h e boundary
c o n d i t i o n s o f ze ro t r a c t i o n s on t h e edges o f t h e s o l i d . From t h e form
o f t h i s r e s u l t , however, t h e t r a c t i o n s cannot be made zero th roughout
t h e l e n g t h o f t h e s o l i d . I t i s p o s s i b l e , however, t o choose t h e cons tan ts
C1 and C 2 such t h a t f o r any temperature T ( X ) , t h e r e s u l t a n t forces and
moments ( p e r u n i t l e n g t h ) produced by 0 and uzz a r e zero over t h e edges YY
of t h e s o l i d , t h a t i s ,
25

uyy x d x = 0 (3.11) L Io ayydx =
and s imilar ly for u Constants C1 a n d C 2 evaluated using the above z z ’ condi t i ons are
CtE Txdx] - 1-v
CXE Tdx] . - 1 - V
(3.12)
Thus the solution for thermal s t r e s s becomes
0 = 0 = (“E) [-T + c 2 (2L - 3x) ,fo L Tdx + 3 6 (2L - X ) Io L Txdxl (3.13) L YY z z 1- v
Substituting the temperature profi le given by Equation 3.5 into 3.13,
the s t r e s s due t o quenching for the s l ab under consideration becomes
(3.14) 1 1 o* = = [-0 + ( 4 - 6X) Io OdX + 6(2X - 1) Io OXdX] clE
1
The integrals in Equation 3.14 were evaluated using Simpson’s rule
(Appendix ) . The thermal s t resses ( i n dimensionless form) are graphic-
a l l y presented in Figures 3.8 t h r o u g h 3.13. Positive s t resses are t e n s i l e
and negative ones compressive. The s t r e s s i s plotted for various times.
Two cases o f surface heat t ransfer ra te are considered, namely h = 5.0 a n d
h = 300.0 B t u / h r F.
and near the surface being quenched and become compressive on the in t e r io r .
Also, the s t resses are t ens i l e a t and near the end face, i . e . , a t X = 1.0.
Maximum s t resses develop a t the face X = 0. Comparison of the two cases
f tL. As can be seen, thermal s t r e s ses are t ens i l e a t
26

F
P (H
k
N
0 0 r?
3- N 0
0
N I
27

cv * k
k
5
I I 1 I 0 co v) A- N 4 0
r( 3 - 4
l i 0
II -*
I
28

0
0
cv I
29

I co.
4 .
0 I
u\ -. 4
n
k c W
!3 H E
u\ - .
-6
x 0 0 r i !a a, P .?I c cd k 0
4 4
c?
0 I% H
30

I&
P c, k
N
f -P a
0 0 0 4 - 0 0 u\
II
c
/ / / u\ O ///
0 n -
0
4 co
X 0 0 rl
0, -P .I+
c cd k c!J
c .d
r: 0 .Fi -P cd .d k cd k- rn rn
a
E
z
-P m rl cd
a, G I3 0, 0 cd k k 5 m a a, -P cd E .rl P rn w N 4
r?
0 H Frc
0
31

I ,
0
' 0 0 0 4
0 - 0 4
- 4

shows t h a t the maximum t ens i l e s t resses developed i s much larger for
higher heat t ransfer rates because of the correspondingly higher thermal
gradients. Maximum compressive s t resses are n o t appreciably di f fe rent
i n the two cases. One interest ing observation i s t h a t the t rans i t ion
from t ens i l e t o compressive s t r e s s occurs a t almost equal values of X
i n b o t h cases, which implies t h a t the area under t ens i l e s t r e s s remains
roughly the same regardless of the heat t ransfer ra te considered.
Figures 3.10 and 3.11 i l l u s t r a t e the time dependence of s t resses a t
various distances from the surface fo r h = 5 .0 and h = 300.0 B t u / h r .
f t F. As may be seen, a l l the s t resses r i s e t o a peak and then decrease
slowly t o zero.
s t resses a t a l l cross-sections are higher in the case o f h = 300.0.
Moreover, the s t resses a t the quenching face reach a peak value instant-
aneously for h = 300.0, whereas i t takes a f i n i t e time t o reach a maximum
value for h = 5 .0 .
2
Comparing the two cases, one can conclude t h a t peak
Since the maximum tens i l e s t resses always occur a t the surface, the
time dependence o f these s t resses i s of special i n t e re s t . Figure 3.12
shows t h i s variation for a range of heat t ransfer coeff ic ient values. As
can be seen from these curves, surface s t resses f i r s t peak and then fade.
Moreover, curves w i t h high h values peak f a r sooner t h a n those w i t h low
h values. The curves for values of h greater t h a n 300.0 give identical
surface s t resses because the temperature -'time dis t r ibut ion remains the
same for those heat t ransfer coeff ic ients . These fac ts are b r o u g h t o u t
more c lear ly in Figure 3.13, which shows the peak s t r e s s values a t the
surface together with the times a t which these maximum stresses occur.
An evaluation o f the resu l t s presented in Figures 3.8 - 3.13 shows
t h a t in the case of thermally stressed semi- infinite s lab. the c r i t i c a l
33

stresses a r i se e i ther on the quenched face o r in a region j u s t below the
surface. Since the compressive strength o f a b r i t t l e material i s generally
larger t h a n i t s t ens i l e s t rength, fa i lure i s most l ike ly t o occur due t o
t ens i l e s t resses . The experimental work discussed in the next chapter
describes the e f fec ts of thermal s t r e s s on the granite specimen strength.
3.4 Determination of Surface Heat Transfer Coefficient ( h )
The discussion of various parameters affecting the thermal shock
behavior of a b r i t t l e material showed t h a t the knowledge of heat t ransfer
coeff ic ient i s impor tan t f o r evaluation o f quenching t e s t s . The average
surface heat t ransfer coeff ic ient for the water j e t a n d the rock s u r f a d
system used here was determined using t ransient heat flow analysis of a
plate with negligible internal resistance and a lso by comparing the
cooling curves a t two locations in a granite specimen with the theoretical
cooling curves for a semi- infinite so l id .
3 .4 .1 Determination o f h Using the Transient Technique
The t ransient temperature response of a heated p la te , cooled by the
impinging water j e t s , i s used as a basis for the evaluation of the averdge
heat t ransfer coeff ic ient .
recorded. The resul t ing "time constant" i s d i rec t ly related t o the
thermal resistance which varies inversely with h .
The time history of the temperature i s
The analysis i s based
on the "one-lump capacitance" parameter method since the internal therm41
resistance o f the p la te can be demonstrated to be negligible compared t O
the external thermal resistance between the surface of the plate and the
water j e t s . Figure 3.14 describes the thermal c i r c u i t f o r a f l a t plate
model. The ra te of decrease of internal energy o f the p la te , E, i s given
by the following equation:
34
(3.15)
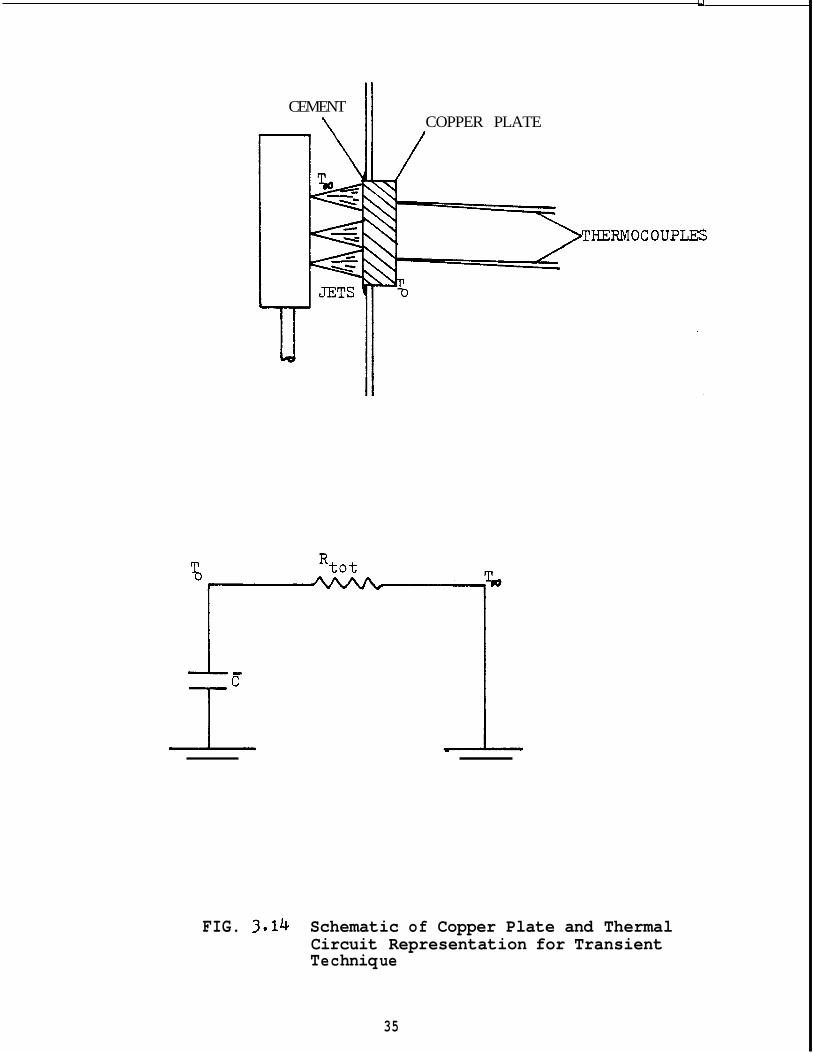
CEMENT COPPER PLATE /
Rtot
FIG. 3.14 Schematic of Copper Plate and Thermal Circuit Representation for Transient T e c hniq ue
35
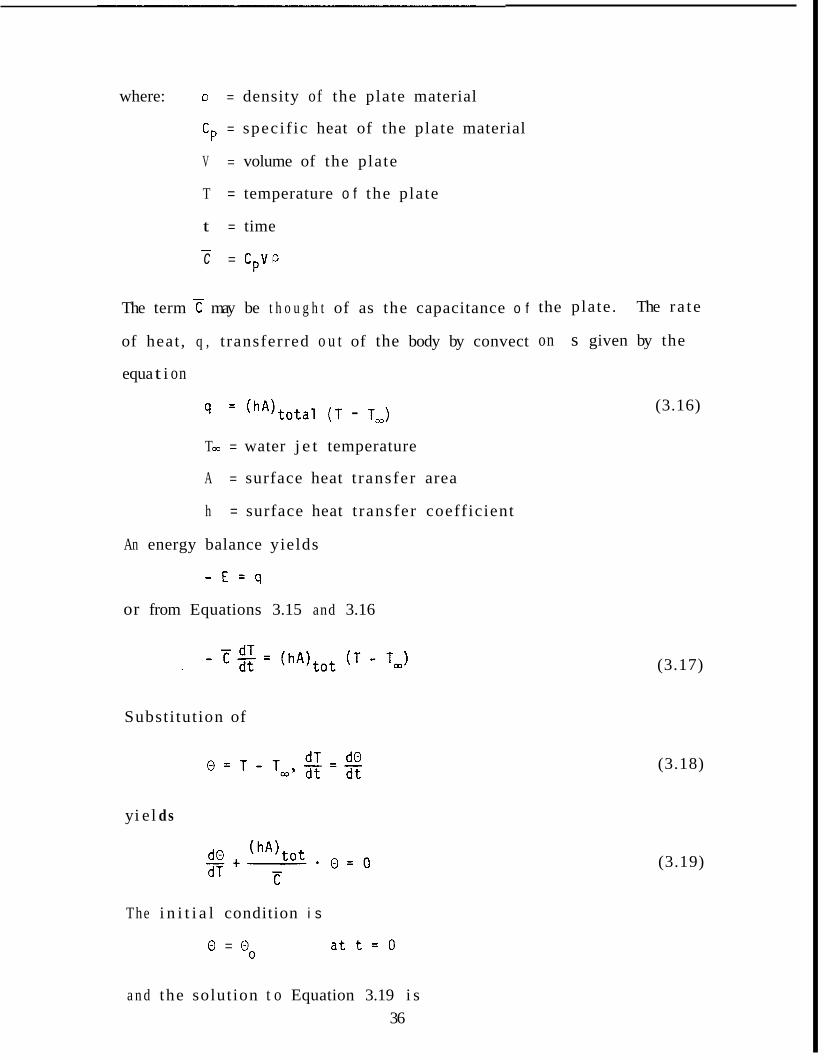
where: p = density of the plate material
Cp = speci f ic heat of the plate material
V = volume of the plate
T = temperature o f the plate
t = time - c = C P V P
The term may be t h o u g h t of as the capacitance o f
of heat , q , t ransferred o u t of the body by convect
equa t i on
= ( h A ) t o t a l ( T - T,)
T 00 = water j e t temperature
A = surface heat t ransfer area
h = surface heat t ransfer coefficient
An energy balance yields
- E = q
or from Equations 3.15 and 3.16
Substi tut ion of
yi e l ds
The i n i t i a l condition i s
0 = Oo a t t = O
a n d the solution t o Equation 3.19 i s 36
the
on
plate. The ra te
s given by the
(3.16)
(3.17)
(3.18)
(3.19)

(3 .20)
A p l o t o f En (O/Oo) versus t ob ta ined f rom t h e t e s t da ta shou ld y i e l d a
s t r a i g h t l i n e w i t h t h e s l ope g iven by
(3 .21) ( h A ) t o t - m = C
A copper p l a t e was used f o r t h e t r a n s i e n t exper iments .
impor tance of t h e therma l r e s i s t a n c e w i t h i n t h e p l a t e can be w r i t t e n i n
d imens ion less form as 5 L/kS, t h e B i o t number, where
u n i t su r face conductance, L i s t h e s i g n i f i c a n t l e n g t h d imension o b t a i n e d
by d i v i d i n g t h e volume o f t h e body by i t s s u r f a c e area, and ks i s t h e
therma l c o n d u c t i v i t y o f t h e copper p l a t e .
i n t r o d u c e d by t h e assumption t h a t t h e temperature a t any i n s t a n t i s un i-
fo rm w i l l be l e s s t h a n 5 pe rcen t when t h e i n t e r n a l r e s i s t a n c e i s l e s s
t han 10 percen t , i .e., when 5 L/ks < 0 . 1 [22]. Using t h i s c o n d i t i o n and
The r e l a t i v e
i s t h e average
I
I n t h e copper p l a t e , t h e e r r o r
kS = 216 B t u / h r f t F and E = 500 B t u / h r f t 2 F , t h e c h a r a c t e r i s t i c l e n g t h i s
l e s s t han 0.5 i n .
The copper p l a t e used had a t h i ckness o f 0.5 i nch .
runs were done f o r i n i t i a l temperatures o f 255°F and 370°F.
t u r e h i s t o r y recorded showed q u i t e a v a r i a t i o n s i n c e b o i l i n g occu r red a t
t h e sur face . The most r e p r o d u c i b l e temperature h i s t o r i e s a r e l i s t e d i n
Tab le 3.1.
h = 357.0.
va lues i n t h e l a t t e r case were due t o more severe b o i l i n g a t t h e sur face.
The va lues o f h eva lua ted by t h e t r a n s i e n t t echn ique would be h i g h e r t h a n
t h e a c t u a l values s i n c e t h e a n a l y s i s does n o t account f o r r a d i a t i o n and
n a t u r a l c o n v e c t i v e l osses .
Severa l quenching
The tempera-
The p l o t i n F igu re 3.15 g ives a s l o p e wh ich y i e l d s a va lue o f
A s i m i l a r p l o t f o r To = 370°F g i ves h = 582 B t u / h r f t F. 2 H ighe r
37

Tab le 3.1
TEMPERATURE HISTORY I N COPPER PLATE
Time (min . ) Temp. ( F )
0.0
0.4
0.8
1.2
1.4
2.0
2.4
255.0
187.5
110.0
83.0
75.0
72.5
70.0
Time (min . ) Temp. (F)
0.0 370.0
0.4 260.0
0.8 135.0
1.2 95.0
1.4 85.0
2.0 82.0
- kn ( T- T,/ T,- T,)
185.0
117.5
40.0
13.0
5.0
2.5
0.0
0.0
0.45
1.53
2.65
3.61
4.3
m
T-T, ( F ) - Rn ( T- T,/T,- T,)
368.0 0.0
178.0 0.72
53.0 1.94
13.0 3.34
3.0 4.80
0.0 m
38

0 \D X u\ N 4
n
0 Err
u\ u\ N
I I
Bo W
cr\ N .
4 0
A-
cv - .
0
"
N r n
-4 - c .d E + v
co -0
A- ' 0
-0
a, -P cd ri pr
k Q1 Fk
4 c3 k 0 k
k
+D c ap
m
c? 4 . .
39
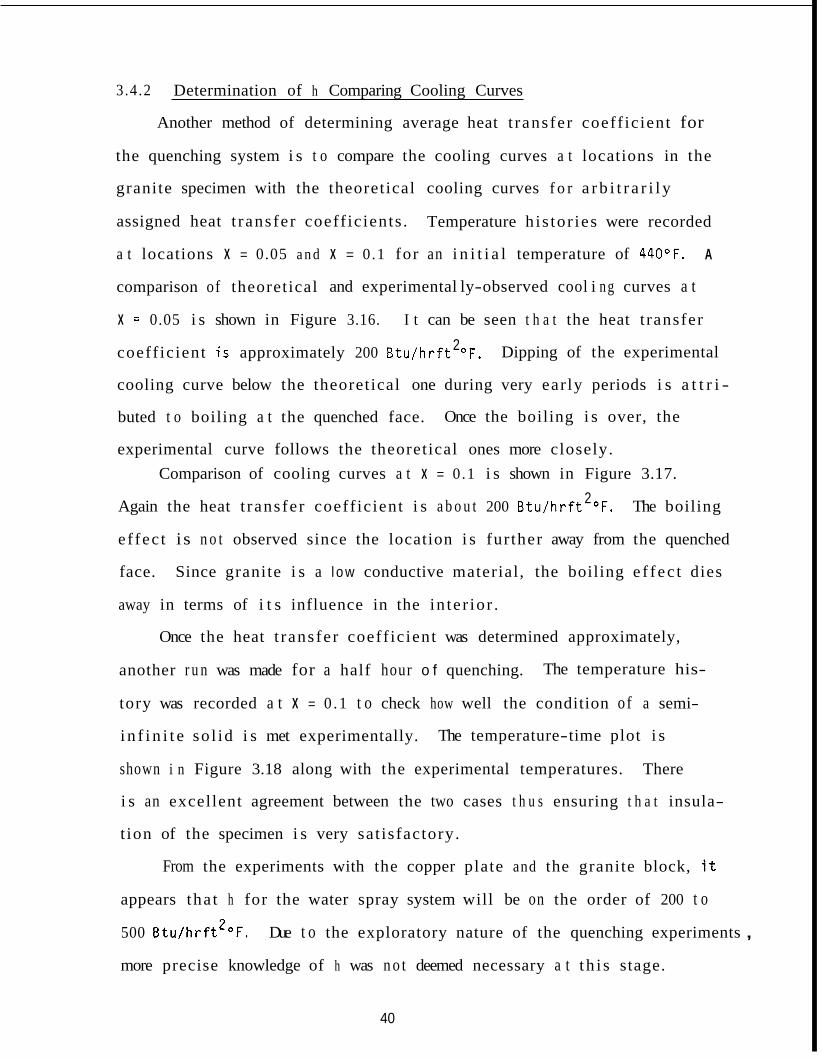
3.4 .2 Determination of h Comparing Cooling Curves
Another method of determining average heat t ransfer coeff ic ient for
the quenching system i s t o compare the cooling curves a t locations in the
granite specimen with the theoretical cooling curves f o r a r b i t r a r i l y
assigned heat t ransfer coeff ic ients .
a t locations X = 0.05 a n d X = 0.1 for an i n i t i a l temperature of 440OF.
Temperature h is tor ies were recorded
A
comparison of theoretical and experimental ly-observed cool i n g curves a t
X = 0.05 i s shown in Figure 3.16. I t can be seen t h a t the heat t ransfer
coeff ic ient i s approximately 200 Btu/hrft O F .
cooling curve below the theoretical one during very ear ly periods i s a t t r i -
buted t o boiling a t the quenched face.
experimental curve follows the theoretical ones more closely.
2 Dipping of the experimental
Once the boiling i s over, the
Comparison of cooling curves a t X = 0.1 i s shown in Figure 3.17. 2 Again the heat t ransfer coeff ic ient i s a b o u t 200 Btu/hrft O F . The boiling
ef fec t is n o t observed since the location i s fur ther away from the quenched
face. Since granite i s a l o w conductive material , the boiling e f fec t dies
away in terms of i t s influence in the in te r ior .
Once the heat t ransfer coeff ic ient was determined approximately,
another r u n was made for a half hour o f quenching.
tory was recorded a t X = 0 .1 t o check how well the condition of a semi-
i n f i n i t e so l id i s met experimentally.
shown i n Figure 3.18 along with the experimental temperatures. There
i s an excellent agreement between the two cases t h u s ensuring t h a t insula-
t ion of the specimen i s very sat isfactory.
The temperature his-
The temperature-time plot i s
From the experiments with the copper plate and the granite block, i t
appears tha t h for the water spray system will be on the order of 200 t o
500 Btu/hrft*"F.
more precise knowledge of h was n o t deemed necessary a t t h i s stage.
Due t o the exploratory nature of the quenching experiments ,
40

1.0
Btu/'hr f t 2 F
I I 1 1. 2,
TIME ( min. ) 3-
FIG. 3.16 Comparison o f C o o l i n g Curves a t X = 0.05
41

a3 .
n
c -4 -2
W
'tr
42

P
0
a
I I I
Q
as
4 3

3.5
Stressing
Procedure t o Determine Strength and Porosity Changes Due t o Thermal
The experimental procedure used t o investigate the post-thermal s t r e s s
behavior o f granite blocks is discussed in th i s section. Mechanical
strength of thermally stressed specimens was evaluated u s i n g three point
bending t e s t s . The t e s t s were carried o u t o n a Universal Testing machine.
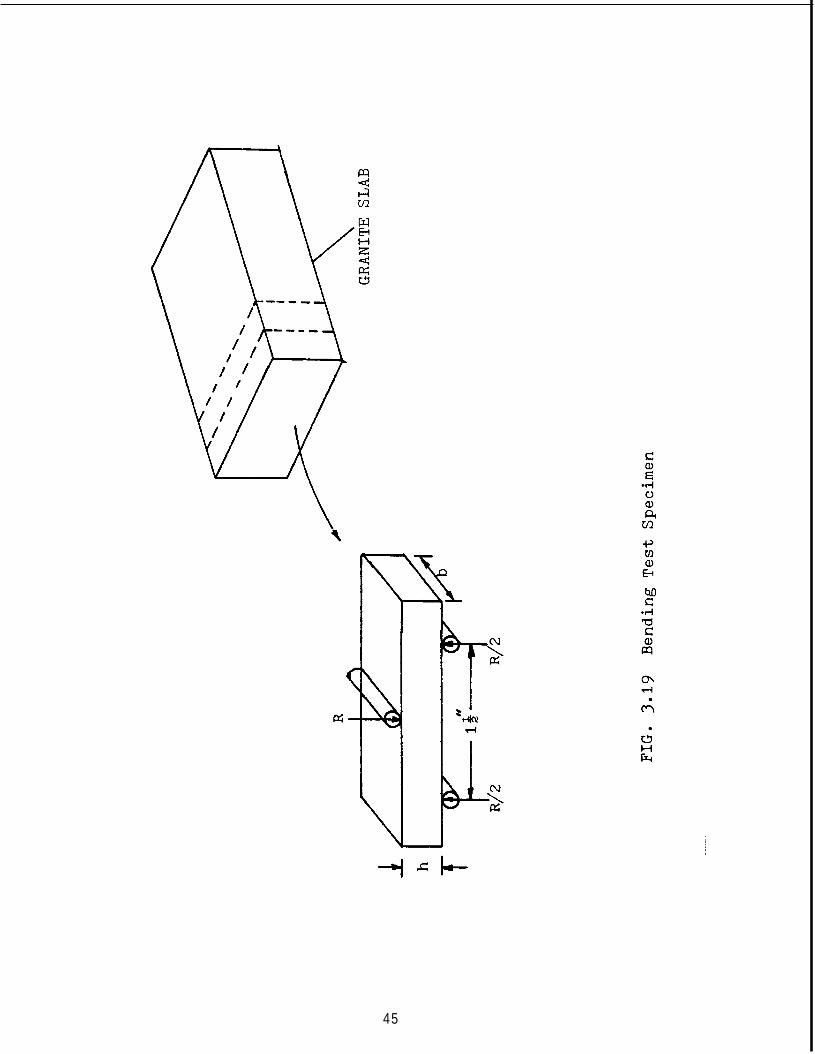
Specimens f o r these t e s t s were cut width-wise along the length o f quenched
a n d non-quenched blocks using a 1/32 in. diamond saw. The de ta i l s o f a
typical bending t e s t specimen are shown in Figure 3.19.
Porosity of the specimens was measured using two d i f fe rent methods,
namely, the saturat ion method and Boyle's Law Porisimeter. An accurate
determination of bulk volume of the specimen i s impor t an t for porosity
measurements. A Bulk Volume Meter, as described below, was used f o r
these measurements.
The Bulk Volume Meter i s based on displacement o f a l iquid by the
specimen where the amount of displacement i s measured in an inclined,
cal ibrated tube w i t h a sui table scale (Figure 3.20). The core sample i s
submerged under mercury in a n adjacent connected chamber. The liquid
displaced by the core i s mercury b u t the l iquid measured in the inclined
tube i s a hydrocarbon with low vapor pressure. The instrument i s Cali-
brated by using cylinders of s ta in less s teel instead of the core. The
dimensions of the sol ids are measured with vernier cal ipers and a plot
of volume versus scale reading i s prepared. Only dry samples are used
a n d submerged i n the mercury with care being taken t o prevent trapping
a i r around the sample.
The apparatus used for porosity determination by saturat ion i s
diagrammed in Figure 3.21. The specimen i s f i r s t cleaned a n d dried in
an oven. After weighing, the clean, dry sample i s placed in a vacuum
44
45

C O R E
FIG. 3.20 Bulk Volume Meter
46

Lac uum
/-z-- ~e 1 e as e I Valve S a t u r a t i n g F l u i d >{/
S t o p c o c k - ( o p e n p o s i t i o n )
[a,j~ Core Samples
FIG. 3.21 A p p a r a t u s f o r saturating c o n s o l i d a t e d c o r e s under vacuum
47
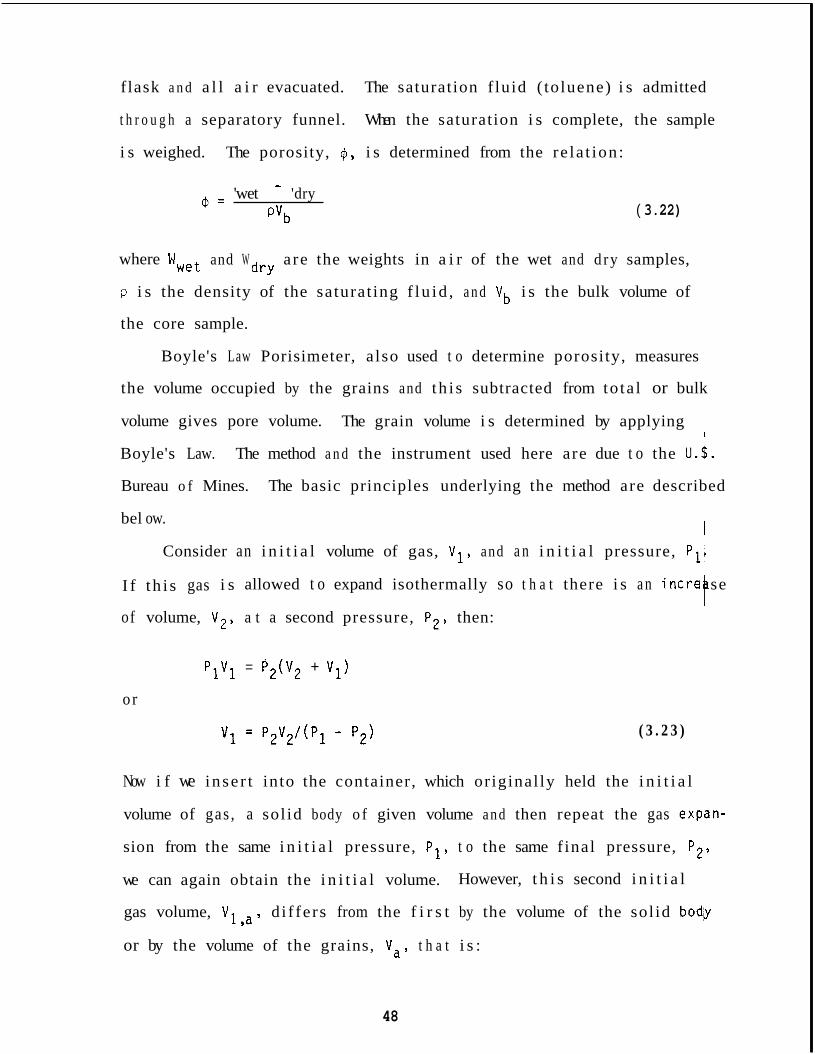
flask a n d a l l a i r evacuated. The saturation f luid ( toluene) i s admitted
t h r o u g h a separatory funnel. When the saturation i s complete, the sample
i s weighed. The porosity, +, i s determined from the re la t ion:
'wet - 'dry "b
c b = ( 3.22)
and W a re the weights in a i r of the wet and d ry samples, where Wwet
P i s the density of the saturat ing f lu id , a n d V b i s the bulk volume of
the core sample.
dry
Boyle's Law Porisimeter, a lso used t o determine porosity, measures
the volume occupied by the grains and t h i s subtracted from to ta l or bulk
volume gives pore volume. The grain volume i s determined by applying
Boyle's Law.
Bureau o f Mines.
bel ow.
I
The method a n d the instrument used here are due t o the U.$ .
The basic principles underlying the method are described
I Consider an i n i t i a l volume of gas, V1, and a n i n i t i a l pressure, P1.
I f t h i s gas i s allowed t o expand isothermally so t h a t there i s a n incre se
of volume, V 2 , a t a second pressure, P 2 , then: P
P I V l = P 2 ( v 2 + v l ) o r
( 3 . 2 3 )
Now i f we inse r t into the container, which or iginal ly held the i n i t i a l
volume of gas , a sol id body o f given volume and then repeat the gas expbn-
sion from the same i n i t i a l pressure, P1, t o the same f inal pressure, P2 ,
we can again obtain the i n i t i a l volume.
gas volume, V1 , a , d i f fe rs from the f i r s t by the volume of the sol id bodly
or by the volume of the grains, V a , t h a t i s :
I
However, t h i s second i n i t i a l
48

or
(3 .24 )
where V
when the core i s i n the container.
i s the second final volume, t h a t ' i s , the volume a f t e r expansion 2 ,a Porosity i s calculated by the equation:
'b - 'a "b
( b = (3 .25)
where vb i s the bulk volume o f the sample.
merely a change of volume rather t h a n a n absolute volume i s necessary i f
the same i n i t i a l and f i n a l pressures a re used f o r b o t h measurements.
As seen from Equa t ion 3 . 2 4 ,
The instrument used for the determination o f these volumes i s shown
schematically i n Figure 3.22.
arrangement and sealed w i t h an O- r i n g .
burette have jackets ( n o t shown) t h r o u g h which constant temperature water
i s c i rculated. The mercury leveling bulb is used i n conjunction w i t h tbe
gas buret te t o measure the f i n a l gas volume.
as a sens i t ive detector for the adjustment o f the leveling bulb. The
three-way stopcock connects the l e f t or volume regulating p a r t o f the
system.
connected t o an adequate vacuum l ine . The vacuum gage i s merely a mer-
cury column supported by the difference i n pressure between t h a t i n the
system and the barometric pressure. I
The core holder i s closed by a screw I
Both the core holder and gas
I The water manometer serve?
I
1 I
The vacuum regulator maintains a constant absolute pressure w h e n
The system i s made isothermal by using a water thermostat and flowjng
water around the core holder and the gas burette for an hour . W i t h core
holder i n place, the toggle valve i s opened momentarily t o ensure the core
49

TOGGLE VALVES \
WATER MANOMETER
TO VACUUM P HOLDER -t-J
GAS BURETTE 1
- \ \
\ \
\ \ \ \
\
VACUUM GAGE
F ig . 3 .22 Apparatus f o r Boyle's Law P o r o s i t y Measurements
50

holder i s a t atmospheric pressure. Then b o t h toggle valves are closed
t o i so l a t e the core holder. Vacuum i s applied t o the gas burette through
the stopcock. When the desired vacuum is achieved, pressure and volume
readings are taken, which are the two i n i t i a l values for pressure and
volume. The toggle valve connecting the core holder and gas burette i s
now opened slowly.
balancing the two levels o f the water manometer.
Volume, V 2 , and pressure, P2, are measured a f t e r
The above procedure ,
i s repeated with the sample in the core holder t o f i n d volume, V 2 , a ,
and pressure, P2. The grain volume of the sample can be calculated by
u s i n g Equa t ion (3 .24) and porosity can be determined by k n o w i n g the
bulk volume, V b , of the sample.
51

4. TEST RESULTS
I n order t o explore the influence of thermal s t ress ing , the strength
a n d porosity of virgin samples were compared t o values i n samples removed
from slabs which had been subjected t o s ingle and multiple quenches. The
i n i t i a l s lab temperature was 45OoF, which i s typical or H D R rock tempera-
tures . The temperature of t a p water used for quenching was approximately
70°F.
heat t ransfer coef f ic ien t , h , were determined as described previously in
section 3.4. I n predicting temperature-time and thermal s t r e s s behavior
a value of h = 300 Btu/hrft O F was assumed, which i s representative of
The quenching severity was t h a t for which the values o f surface
2
the range o f values determined experimentally and typical of values fourid
in H D R reservoirs. I
Specimen slabs were taken from larger blocks of S ier ra White graniOe
which i s f ine grained, grayish white, muscovite-biotite obtained from Rqy-
mond Quarry (Raymond, Cal i fornia) . The pertinent
a re l i s t ed below.
Density , 1 b / f t3
Poisson's Ra t io
Tensile s t rength, ps
Shear modulus, 10 psi
Specific hea t , Btu/lb"F
Coefficient of thermal expansion, 10-6/oF
Thermal conductivity, Btu/hrft°F
6
An approximate chemical analysis
'2 percent iron oxides, 3 percent
percent combined water.
properties of the rocld
P 164
V 0.30
1100
lJ 2.44
0 .22 c P I ,
4.12
1.57
s 74 percent s i l i c a , 15 percent alumida,
ime, 5 percent soda a n d p o t a s h , a n d 0.3
52

4.1 Bending S t reng th Tests
T e n s i l e s t r e n g t h o f t h e quenched and non-quenched specimens were
measured by l o a d i n g t o f r a c t u r e i n t h r e e p o i n t bending.
t h e bending s t r e n g t h o f e i g h t specimen c u t from a v i r g i n rock .
bending s t r e n g t h was 1,835 p s i w i t h a 1 5 pe rcen t c o e f f i c i e n t o f v a r i a t i o n .
The u n i a x i a l t e n s i l e s t r e n g t h was quoted as 1,100 p s i . H ighe r va lues o f
t e n s i l e s t r e n g t h measured i n bending t e s t s a re p robab l y due t o t h e s m a l l e r
volume o f r o c k be ing s u b j e c t e d t o maximum t e n s i o n and thus a reduced
chance o f f l a w s b e i n g sub jec ted t o t h e h i g h e r s t resses .
Table 4.1 shows
The mean
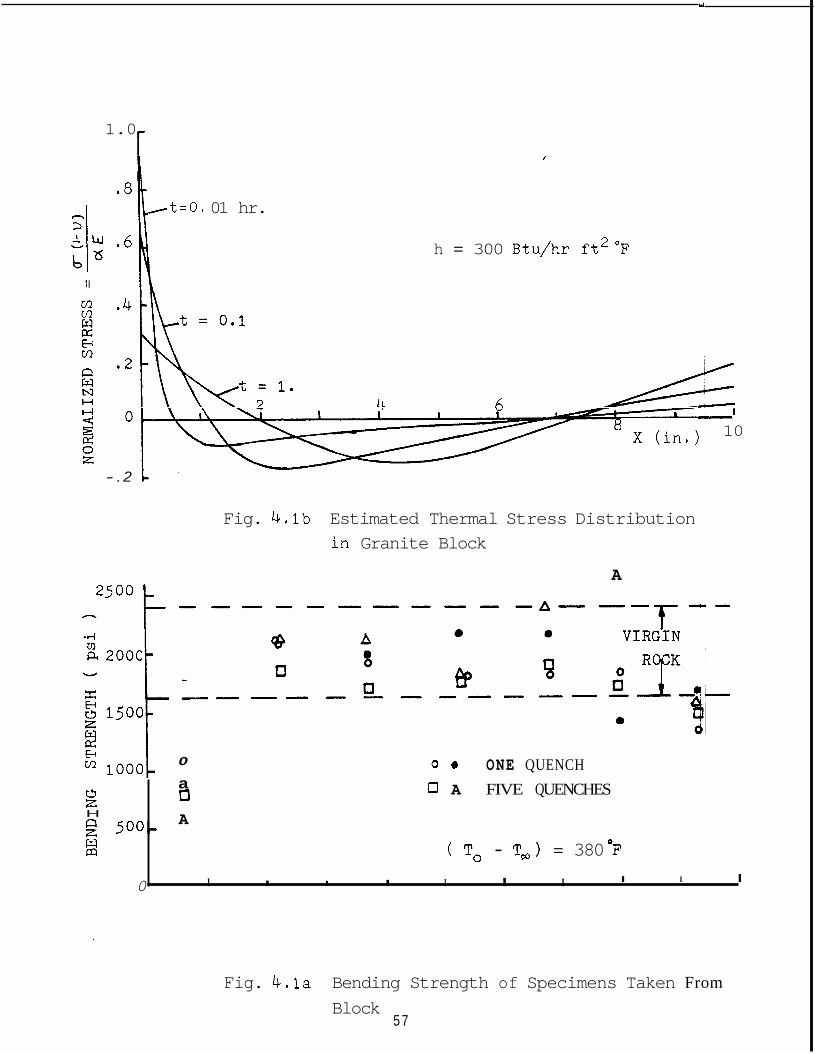
The bending s t r e n g t h o f specimens taken f rom v a r i o u s p o s i t i o n s a lor lg
t h e l e n g t h o f t h e quenched rock a re l i s t e d i n Table 4.2 th rough Table 4.5.
Tables 4.2 and 4.3 a r e f o r one c y c l e o f quenching, w h i l e t h e o t h e r two
a r e f o r f i v e c y c l e s o f quenching. These r e s u l t s a r e p l o t t e d i n F i g u r e
4. l a a l ong w i t h t h e t h e o r e t i c a l s t r e s s d i s t r i b u t i o n ( F i g u r e 4 . l b ) . As
can be seen, t h e r e i s a s i g n i f i c a n t deg rada t i on i n s t r e n g t h i n t h e spec%
mens taken f rom near t h e quenched face, where t e n s i l e thermal s t r e s s wag
h i g h e r than t h e f r a c t u r e t e n s i l e s t r e n g t h .
no l o s s of s t r e n g t h i n specimens taken from r e g i o n s o f compressive s t r e s s
(see F igu re 4 . l b ) .
c y c l e o f quenching and t w o - t h i r d s f o r f i v e c y c l e s o f quenching.
exposure of t h e specimens t o e l e v a t e d temperature a lone does n o t appear
t o cause l o s s o f post-quench s t r e n g t h .
On t h e o t h e r hand, t h e r e i s
The r e d u c t i o n o f s t r e n g t h i s about one- hal f f o r one
Also,
53

T a b l e 4 . 1
Specimen No.
BENDING STRENGTH OF VIRGIN GRANITE SPECIMENS
1
2
3
4
5
6
7
8
Loca t i on (x/L) b ( i n ) h ( i n )
F r a c t u r e Load (R) l b s
0.18
0.31
0.43
0.51
0.59
0.77
0.90
1.0
2.05
1.45
1.475
0.85
1.00
1.97
1.48
1.20
0.3
0.25
0.275
0.30
0.30
0.25
0.25
0.25
154
7 1
80
80
60
90
90
48
1878
1762
1613
2353
1600
1640
2189
1640
T a b l e 4.2
BENDING STRENGTH OF SPECIMENS AFTER O N E Q U E N C H
Loca t i on Spec imen No. ( x / L ) b ( i n )
1 0.15 1.5
2 0.31 1.5
3 0.46 1.5
4 0.62 1.5
5 0.77 1.5
6 0.85 0.7
7 1.0 1.5
h ( i n ) F r a c t u r e
Load (R) lbs
0.27
0.27
0.26
0.26
0.25
0.25
0.25
45
100
90
95
90
40
70
926
2057
1997
2108
2160
1396
1680
54

T a b l e 4.3
BENDING STRENGTH OF SPECIMENS AFTER O N E Q U E N C H
Locat i o n Spec imen No. ( x / L )
1 0.18
2 0.37
3 0.55
4 0.73
5 0.92
6 1.00
F r a c t u r e b ( i n ) h ( i n ) Load ( R ) l b s
1.5 0.27 45
1.5 0.27 100
1.5 0.26 90
1.5 0.26 95
1 .5 0.25 90
0.69 0.25 70
926
2057
1997
2108
2160
1680
T a b l e 4.4
B E N D I N G STRENGTH OF SPECIMENS AFTER FIVE QUENCHES
~ L o c a t i o n F r a c t u r e F r a c t u r e , S p e c i m e n No. ( x / L ) b ( i n ) h ( i n ) Load ( R ) lbs 0 ( p s i ) ~
1 0.14 1.47 0.27 30 6 30
2 0.29 1.46 0.27 100 2113
3 0.43 1.46 0.28 110 2162 I
4 0.57 1.48 0.29 100 1808
5 0.72 1.47 0.25 100 2449
6 0.86 1.44 0.27 130 27 29
7 1.00 1.46 0.33 110 1556
55

T a b l e 4.5
BENDING STRENGTH OF SPECIMENS AFTER FIVE QUENCHES
S p e c i m e n No. L o c a t i o n
( X / L )
0.16
0.31
0.46
0.61
0.76
0.84
1.0
b ( i n ) h ( i n ) F r a c t u r e
Load ( R ) l b s
1.5
1.44
1.44
1.44
1.44
0.94
1.375
0.30
0.30
0.30
0.30
0.30
0.28
0.60
50
110
95
1001
95
55
60
8 30
1833
1652
1760
1896
1683
1570
56
1.0
.8
0 z H
500- H
0
- . 2
I I 1 I I I I I I I
,t=O. 01 hr.
h = 300 Btu/hr ft2"F
IrccIc. b t
10 x (in.)
h
2 5 0 0 F 4
200c
h
Fig. 4.lb Estimated Thermal Stress Distribution in Granite Block
A
0
a D A
0 0 ONE QUENCH n A FIVE QUENCHES
( To - Tw) = 380 OF
Fig. 4.la Bending Strength of Specimens Taken From Block
57

4 . 2 Porosity Evaluation
Porosity was measured using b o t h the saturation method and Boyle's
Law Porisimeter ( B L P ) .
s ince the resu l t s were n o t reproducible and there was a large variation
even f o r virgin rock.
a t o r y was n o t enough t o give correct estimates for low porosity rock.
Porosity measurements done by the saturation method are given in Table
4.6.
1.4 t o 2 0. Porosity increases t o 3.5 - 4.0 a f t e r one cycle o f quenching
and t o 4 .5 - 5.0 a f t e r five cycles of quenching.
4 .3 Dye Penetrant Method
The measurements by BLP are n o t mentioned here
The accuracy of the se t u p available in the labor-
As can be seen, the porosity of a n unquenched rock l i e s between
Direct observation of cracks was attempted by applying dye penetrant
t o one face of quenched a n d non-quenched specimens and a developer used
t o look a t the micro cracks. I t was seen t h a t the quantity of dye fixed
t o the quenched specimens was much more t h a n t h a t for virgin rock. No
macro cracks were observed. I t showed t h a t there might be micro cracks
although i t did n o t provide any quant i ta t ive evaluation o f them.
dye was applied t o one face o f quenched specimens, i t seeped t h r o u g h t o
the other s ide much fa s t e r t h a n i n ones which were heated a n d cooled
slowly in the a i r .
l o n g time t o seep in a virgin rock.
t ive ly t h a t quenching increased the porosity of the rock, perhap due t o
micro crack formation.
When
Also, dye e i the r did n o t seep t h r o u g h or t o o k a very
These observations showed qualita-
58

Tab le 4.6
P O R O S I T Y MEASUREMENT BY SATURATION METHOD
V i r q i n Rock
Sample No.
1 23.8930 0.1372
2 25.0170 0.1592
3 23.2983 0.1121
4 28.4071 0.1313
5 26.3138 0.1626
6 30.5044 0.1446
7 22.6118 0.1022
Quenched Rock
1 21.0310 0.2962
one 2 26.3065 0.3285 c y c l e
3 15.5385 0.2287
V , W
9.42
9.83
9.13
11.07
10.39
11.86
8.96
8.92
11.1
6.6
4 25.3804
f i v e 5 25.8080 c y c l es
6 18.6540
CpW
- 1.8
2.0
1.5
1.5
1.9
1.5
1.4
4.1
3.7
4.3
0.8943 10.69 4.4
0.4065 10.9 4.7
0.3619 7.9 5.7
59
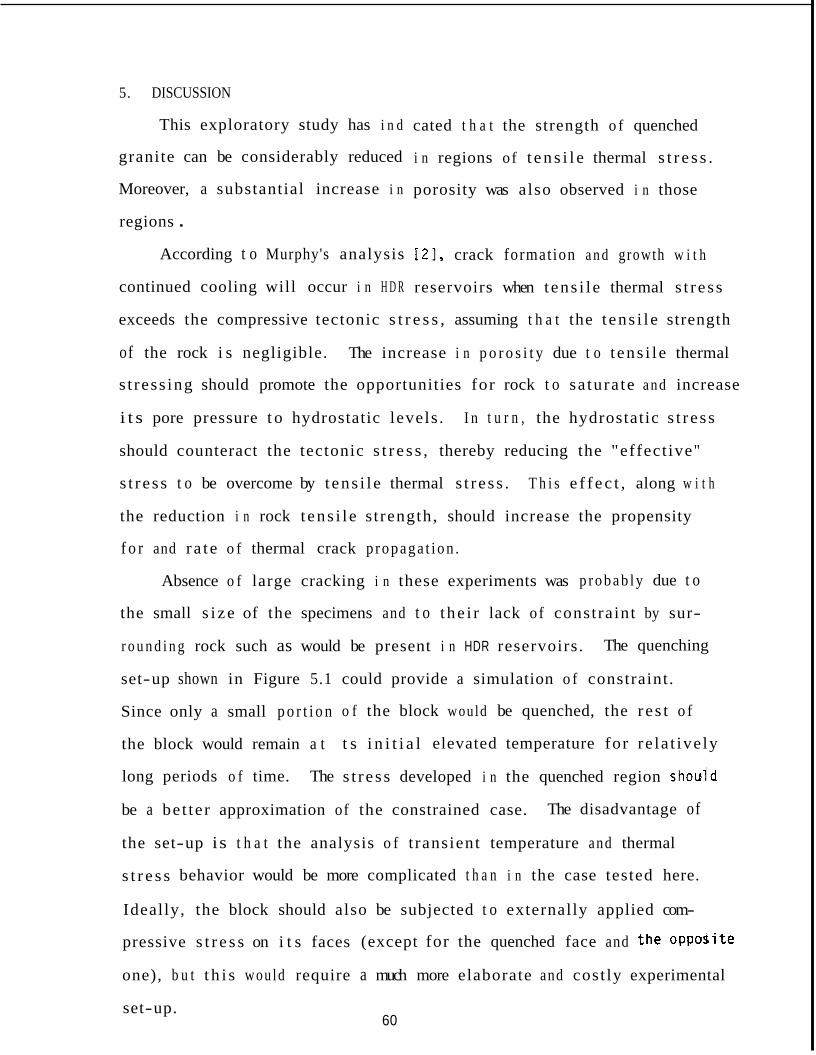
5. DISCUSSION
This exploratory study has i n d
granite can be considerably reduced
Moreover, a substantial increase i n
regions . According t o Murphy's analysis
continued cooling will occur i n H D R
set-up shown in Figure 5.1
Since only a small p o r t i o n
the block would remain a t
long periods o f time. The
cated t h a t the strength o f quenched
i n regions of t e n s i l e thermal s t r e s s .
porosity was also observed i n those
[ZI, crack formation a n d growth w i t h
reservoirs when t ens i l e thermal s t r e s s
exceeds the compressive tectonic s t r e s s , assuming t h a t the t ens i l e strength
of the rock i s negligible. The increase i n p o r o s i t y due t o t ens i l e thermal
s t ress ing should promote the opportunities for rock t o sa tura te and increase
i t s pore pressure t o hydrostatic levels .
should counteract the tectonic s t r e s s , thereby reducing the "effect ive"
s t r e s s t o be overcome by t ens i l e thermal s t r e s s . T h i s e f f e c t , along w i t h
the reduction i n rock t ens i l e s t rength, should increase the propensity
f o r and r a t e o f thermal crack p r o p a g a t i o n .
I n t u r n , the hydrostatic s t r e s s
Absence o f large cracking i n these experiments was p r o b a b l y due t o
the small s i z e of the specimens and t o t he i r lack of constraint by sur-
r o u n d i n g rock such as would be present i n HDR reservoirs. The quenching
could provide a simulation o f constraint.
o f the block would be quenched, the r e s t o f
t s i n i t i a l elevated temperature for re la t ive ly
s t r e s s developed i n the quenched region should I
be a be t te r approximation of the constrained case.
the set-up is t h a t the analysis o f t ransient temperature and thermal
s t r e s s behavior would be more complicated t h a n i n the case tested here.
Ideally, the block should also be subjected t o externally applied com-
pressive s t r e s s on i t s faces (except for the quenched face and the opposite
one), b u t t h i s wou ld require a much more elaborate and cost ly experimental
The disadvantage of
set-up. 60

rn IJ w z
2 5 ~
61

The absence o f macro cracking i n the specimens used i n these pre-
l iminary t e s t s may also have been due t o t he i r re la t ive ly h i g h i n i t i a l
porosity ( = 2 percent).
specimens may ac t t o a r r e s t p r o p a g a t i o n of micro cracks which h a d been
nucleated by t e n s i l e thermal s t r e s s . On the other h a n d , as noted
previously, porosity may enhance growth o f larger thermal cracks t h r o u g h
introduction o f hydrostatic pore pressure i n actual reservoirs.
As discussed i n Chapter 2 , porosity i n small
Future experiments on the influence o f thermal s t ress ing on rock
behavior could also u t i l i z e the exis t ing Stanford Geothermal Program
reservoir model. By stacking large blocks of regular geometry i n the
pressure vessel, s igni f icant thermal s t resses should be generated i n
blocks near the bot tom o f the vessel d u r i n g "cold sweep" heat t ransfer
experiments.
Other experiments could u t i l i z e blocks w i t h flaws which have been
cut into the surface t o determine i f the flaws would grow under thermal
s t ressing. Such "pre-existing" flaws would provide a simulation o f
natural flaws which are l ike ly t o e x i s t i n H D R rock.
Future experiments should also check the influence o f thermal
s t ress ing on the thermal conductivity o f rock.
regions which experience s igni f icant t ens i l e thermal s t r e s s may also
experience a s igni f icant change i n conductivity, thereby affect ing the
heat t ransfer t o the cooling water.
conductivity i s l i ke ly t o increase or decrease or how s igni f icant the
e f f ec t m i g h t be. T h i s cer tainly seems worth investigating. I f s i g n i -
f icant , changes i n conductivity w i t h thermal s t ressing could be incor-
porated i n t o a n analyt ic model for reservoir heat t ransfer .
I t i s conceivable t h a t
I t i s n o t apparent whether the
62

6. CONCLUS I O N S
(1) Tensile thermal s t r e s s produced by cooling conditions repre-
sentat ive o f H D R reservoirs caused a s ignif icant reduction i n granite
strength and a substantial increase in porosity.
( 2 ) Strength reductions and porosity increases may f a v o r fo rmat ion
a n d growth o f larger thermal cracks i n actual reservoirs by reducing
local rock fracture toughness and allowing hydrostatic pore pressure t o
counteract tectonic compressive s t r e s s .
63

7 . R E F E R E N C E S
1. White, D. F. and Williams, D . L. , e d i t o r s , "Assessment o f Geothermal
Resources o f the United States- -1975," U.S. Geological Survey C i r c u l a r
726, 1975.
2. Murphy, H . D . , "Thermal S t r e s s Cracking and the Enhancement o f Heat
Ex t r ac t ion from Fractured Geothermal Reservoirs , I ' Los Alamos S c i e n t i f i c
Lab Report LA-7235-M, April 1978.
3. Nemat-Nasser, S . , Kerr, L. M . and P a r i h a r , K. S . , "Uns tab le Growth of
Thermally Induced I n t e r a c t i n g Cracks i n B r i t t l e S o l i d s , " I n t . J . o f
S o l i d s and S t r u c t u r e s , - 14 , p . 409, 1978.
4. Nernat-Nasser, S. , " S t a b i l i t y of a System o f I n t e r a c t i n g Cracks," Leqters
A p p l . Engrg . S c i . , - 16, p . 277, 1978.
5. Winkelman, A. and S c h o t t , O . , "Ueber Thermische Widerstaas-scoefficienten
verschiedener Glaser i n i h r e r Abhangigkei von der Chemischen
Zusammensetzung," A n n ' n . Phys. Chem., - 51, 1893-94, p . 730.
6 . Lidman, W . G . and Bobrowsky, A. R . , " Cor re l a t ion o f Physical ProperJies
o f Ceramic Mate r i a l s w i t h Res is tance t o Frac ture by Thermal Shock,"
Tech. Note 1918, Natn. Advis. Corn. Aeronaut. , Wash., 1949.
7. Cheng, C. M., " Res i s t ance t o Thermal Shock," J. Am. Rocket S O C . , 21, Nov. 1951, p . 147.
8. Mason, S. S. and Smith, R . W . , " Q u a n t i t a t i v e Evalua t ion o f Thermal-
Shock Res is tance ," Trans. Am. SOC. Mech. Engrs. , 78, 1956, p . 533.
9. Marovel l i , P . L., Chen, T. S . , and Veith, K . F . , "Thermal Fragmenta-
t i o n o f Rock, "Proc. 7 th Symp. Rock Mechanics, Un ive r s i t y Park, PA,
1965 (New York, AIME, 1965) , Vol . 2 , p . 252.
10. Hasselman, D. P. H . , "Unif ied Theory o f Thermal Shock F rac tu re
I n i t i a t i o n and Crack Propagat ion i n B r i t t l e Ceramic," J . American
Ceramic S o c i e t y , - 52, No. 11, p . 600.
64
11.
12.
13.
14.
15.
16.
1 7 .
18.
19.
Hasselman, D. P . H . , " G r i f f i t h C r i t e r i o n and Thermal Shock Res i s tance
o f Single- phase Versus Mu1 t i phase Br i t t l e Ceramics , I ' J . American
Ceramic S o c i e t y , 52, No. 5 , p . 288.
Hasselman, D. P . H . , "Crack Propagation Under Constant Deformation
and Thermal Stress F r a c t u r e , " I n t . J . of Frac tu re Mechanics, 7 ,
No. 2 , June 1971, p. 157.
-
-
Davidge, R . W . and Tappin, G . , "Thermal Shock and Frac tu re i n Ceramics,"
Trans. Brit. Ceramic SOC. , - 66 ( 8 ) , p . 405, 1967.
Coble, R . L . and Kingesy, W . D . , " E f f e c t o f P o r o s i t y on Thermal Stress
F r a c t u r e , " J . Am. Ceram. S O C . , - 38 [ l l , p . 33, 1955.
Parmelee, C. W . and Westman, A. E . R . , "Effect of Thermal Shock on
Transverse S t r e n g t h of F i r e c l a y Brick," J . Am. Ceram. S O C . , - 11 [12] ,
p. 884, 1928.
B a r t s c h ,
and I t s R e l a t i o n s h i p t o the Resis tance t o Thermal Shock of F i r e c l a y
Bodies," Ber. Dent. Keram. Gest., - 18 [ l l ] , p . 465, 1937, Ceram. Abstj. ,
- 17 Ell], p. 254, 1938.
Kato, S. and Okuda, H . "Re la t ions Among P o r o s i t y , Thermal Shock
R e s i s t i v i t y , and Some Physical Constants o f P o r c e l a i n , " Nagoya Kogyq
Gijutsu Shikensho Hokoku, - 8 [ 5 ] , p . 37, 1959, Ceram. Abstr., 1959,
p . 287a.
O t t o , "Impact Bend ing S t reng th of Ceramic Bodies and Glasses
I
Richardson, H . M . , "Choice o f Ref rac t ions o f Linings o f B l a s t Furnades,"
pp . 135-40 i n Transac t ions of the VIIth I n t e r n a t i o n a l Ceramic Conference,
London, 1960; Ceram. A b s t . , 1962, p . 2048.
Gupta, T . K. "M i c r o s t r u c t u r a l Dependence o f Frac tu re i n A1 umi na
Subjected t o Thermal Shock," Science o f Ceramics, 1973, Vol. 7 , p. 7 3 .
65

20. Chyung, C. K., e t a l . , " E l e c t r o n Miscroscopy and S t r u c t u r a l M a t e r i a l s ,
e d i t e d by G. Thomas, R . M. F u l r e t h and R . M. F i s h e r , Univ. o f
C a l i f o r n i a Press, B e r k e l e y and Los Angeles, CA, p. 1167, 1972.
21. Bo ley , B. A. and Weiner, J . H., Theory o f Thermal S t resses, John Wilqy
& Sons, Inc . , 1962, p . 277.
22. K r e i t h , " P r i n c i p l e s o f Heat Transfer ," I n t e r n a t i o n a l Textbook Co. ,
Scranton, PA, 1962.
23. W e i b u l l , W., Proc. Rov. Swedish I n s t . Fna. RPS . , No. 151, 1939.
66

APPENDIX: Computer Program to Evaluate Transient Thermal Stresses
CCCCCC C THE PROGRAM CALCULATES TENPERATURE PROFILE FOR A C SEMI-INFINITE SOLID USING SIMPSON'S RULE OF C INTEGRATION. THERMAL STRESSES ARE ALSO EVALUATED C USING SINPSON'S RULE OF IKTEGRATION. CCCCCC C TENPERATURE OF A SEHI-INFINITE SOLID SUBJECTED TO C THERMAL SHOCK CCCCCC
IMPLICIT REAL*8 (A-H,O-Z) DINENSION THETA(201 IxT(201 lrSTRESS(201 )rTHETA1(1011
x=o.o DELX=O. 0 1 M1=201 N1=101
S,Xl(lOl ),SUn1(201 ),SuN2(201)
N2=Nl-2 1 00 FORMAT( F10.5 1
CCCCCCC C AL = THERMAL DIFFUSIVITY C KS = THERMAL CONDUCTIVIYT OF THE GRANITE C PL = LENGTH OF THE GRANITE BLOCK ccccccc
AL=O .042 KS=1 .57 PL= 1 0. /I 2. DO 18 1=1 ,Nl X1( I 1 =O - 0 1 *DF LOAT( I- 1 1
K=O
K=Kt1 BIOTN=H*P WKS TAUl =AL*H*H/( KS*KS 1
18 CONTINUE
9 READ(5,lOO) H
DO 15 J=2,Ml T( J ) =O . 0 1 *DF LOAT( J- 1 DD=PL*PL/( 4.O*AL*T( J 1 ) TAU=DSQRTI TAUl *T( J 1 ) D=DSQRT( DD 1 TAUZ=TAU*TAU
DX=D*Xl(I) Y =OX t TAU IF(Y.GT.12.1GO TO 24 THETA1 ( I )=DERF(DX It(DEXP(X1 (I )*BIOTN+TAUZ 1 )*( 1 .-DE GO TO 25
24 THETA1 ( I )=DERF(DX) 25 CONTINUE
DO 25 I=l,Nl
SUnl ( J )=O . 0 SUN2( J )=O .O
SUnl~J~=SUHl~J~tTHETA1(I1+4.*THETAl~I+1 )tTHETA1(1+2) SUn2( J)=SUN2(J)tX1(I)*THETAl~I~t4.*Xl(Itl )*THETAl(Itl
DO 26 I=lrNZ,2
B+Xl(It2)*THETAl(It2) 26 CONTINUE
DX=D*X YzDXtTAU IF(Y.GT.12.) GO TO 4 THETA( J)=DERF(DX)t(DEXP(X*BIORJ+TAU2) I*( 1 .-DERF(Y)I GO TO 35
67

4 THETA1 J )=DERF(DXl CCCCCC C EVALUATION OF THERflAL STRESSES CCCCCCC
35
1 5 CONTINUE
STRESS1 J 1 =-I THETA( J I - 14.0-6.0*X )*SUM1 ( J )*DEU(/3.0- $6.0*( Z . * X - 1 . 0 )*SUM21 J l*DEW3.O 1
DO IO I = Z , f l I hL?ITEIlOslOl 1 T[I)sSTRESSlI)
10 CONTINUE
200 FORflAT( 'JOIN' 1 h'RITE( 10 ,200 1
1 0 1 FORMATl2X~F10~8~2X,FlZ.8) IF (K.NE.6) GO TO 9 STOP END
$DATA
68