standardized measurement approach for operational risk...
TRANSCRIPT

Standardized Measurement Approach for Operational RiskConsultative proposals
Caio Ferreira
Monetary and Capital Markets DepartmentInternational Monetary Fund
October 20, 2016
2016 Seminar for Senior Bank Supervisors from Emerging Economies

2
Outline
Current approaches
Operational Risk Proxy
Use of Internal loss data
Capital Charge
3
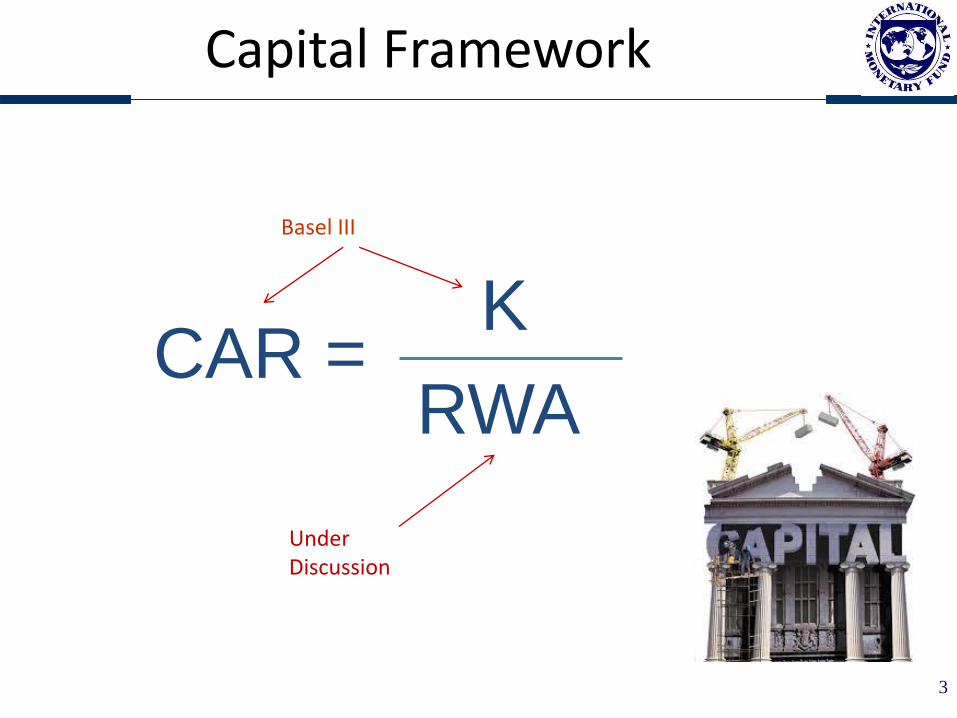
Capital Framework
K
RWACAR =
Basel III
Under Discussion

4
Changing Landscape
Pillar 1
Charges
Credit risk
Market risk
Operational risk
FIRB
AIRB
Internal Models
Standardized
Cred. Standardized
IMM Market Standardized
BIA
TSA / ASAAMA

5
Op. Risk Current Approaches
BIA
K= GI x 0,15
TSA
AMA
6
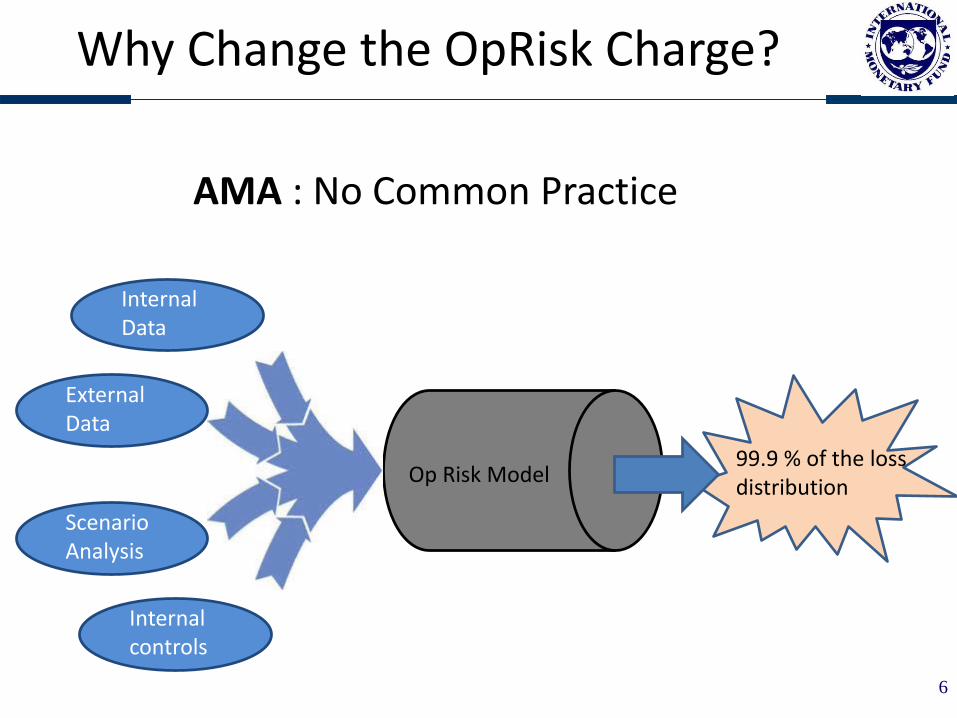
Why Change the OpRisk Charge?
Op Risk Model
Internal Data
99.9 % of the loss distribution
External Data
Scenario Analysis
Internal controls
AMA : No Common Practice
7
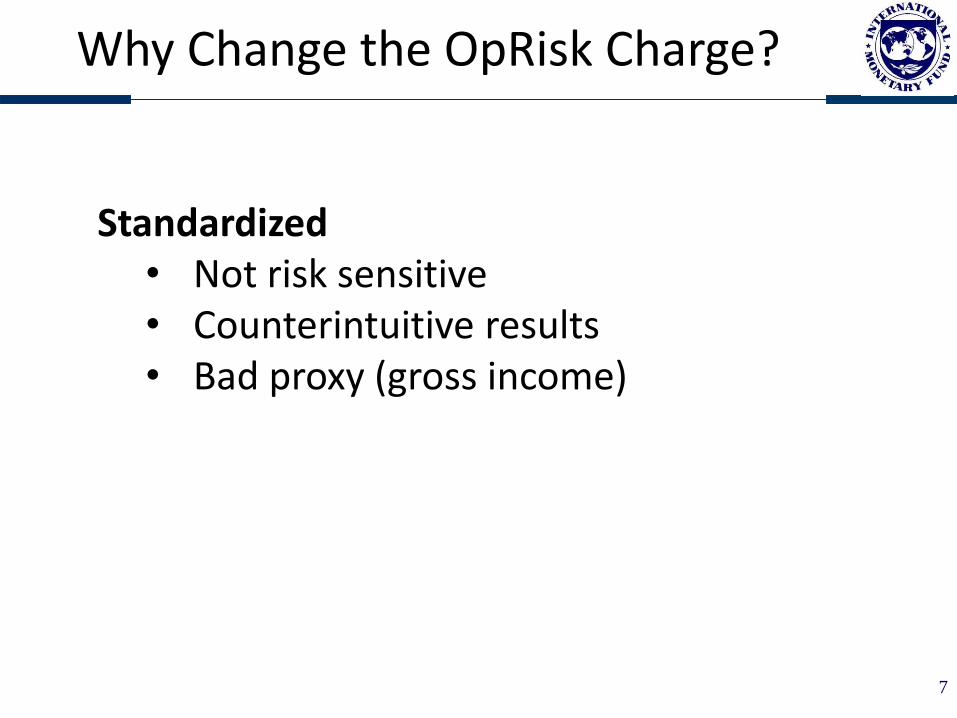
Why Change the OpRisk Charge?
Standardized• Not risk sensitive• Counterintuitive results• Bad proxy (gross income)
8
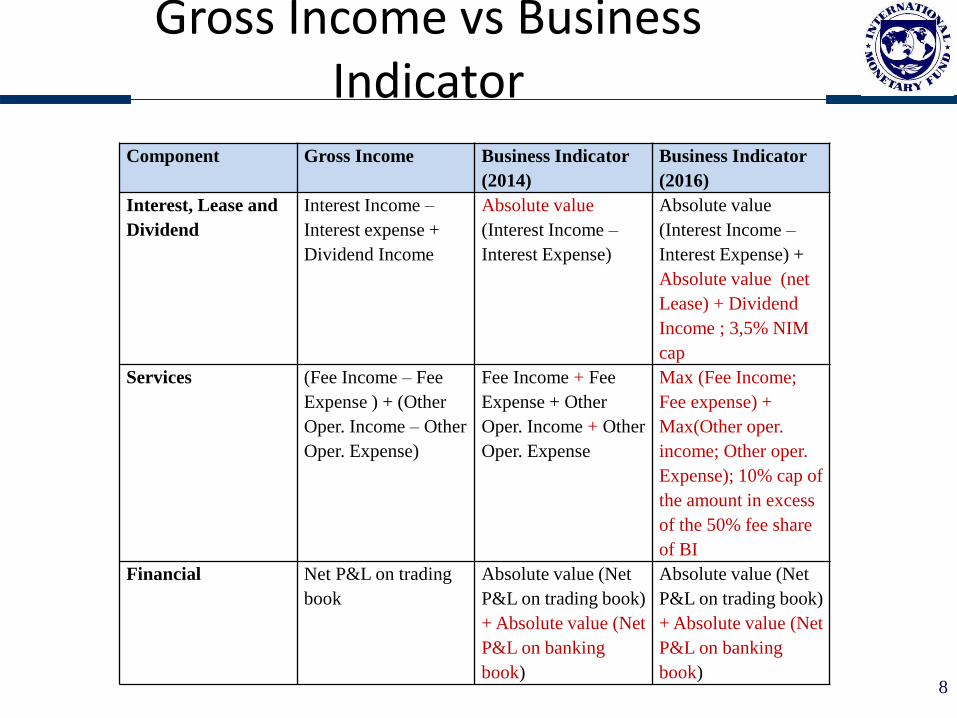
Gross Income vs Business Indicator
Component Gross Income Business Indicator
(2014)
Business Indicator
(2016)
Interest, Lease and
Dividend
Interest Income –
Interest expense +
Dividend Income
Absolute value
(Interest Income –
Interest Expense)
Absolute value
(Interest Income –
Interest Expense) +
Absolute value (net
Lease) + Dividend
Income ; 3,5% NIM
cap
Services (Fee Income – Fee
Expense ) + (Other
Oper. Income – Other
Oper. Expense)
Fee Income + Fee
Expense + Other
Oper. Income + Other
Oper. Expense
Max (Fee Income;
Fee expense) +
Max(Other oper.
income; Other oper.
Expense); 10% cap of
the amount in excess
of the 50% fee share
of BI
Financial Net P&L on trading
book
Absolute value (Net
P&L on trading book)
+ Absolute value (Net
P&L on banking
book)
Absolute value (Net
P&L on trading book)
+ Absolute value (Net
P&L on banking
book)

9
Gross Income vs Business Indicator
Problems:• Impact on certain business models (e.g.
originate to distribute);- Solution: Max (Fee income; Fee Expenses)
• Overcapitalization of banks with high NIM;- Solution: NIM cap set to 3.5%
• Inconsistency in the “dividend income”;- Solution: include dividend income
10
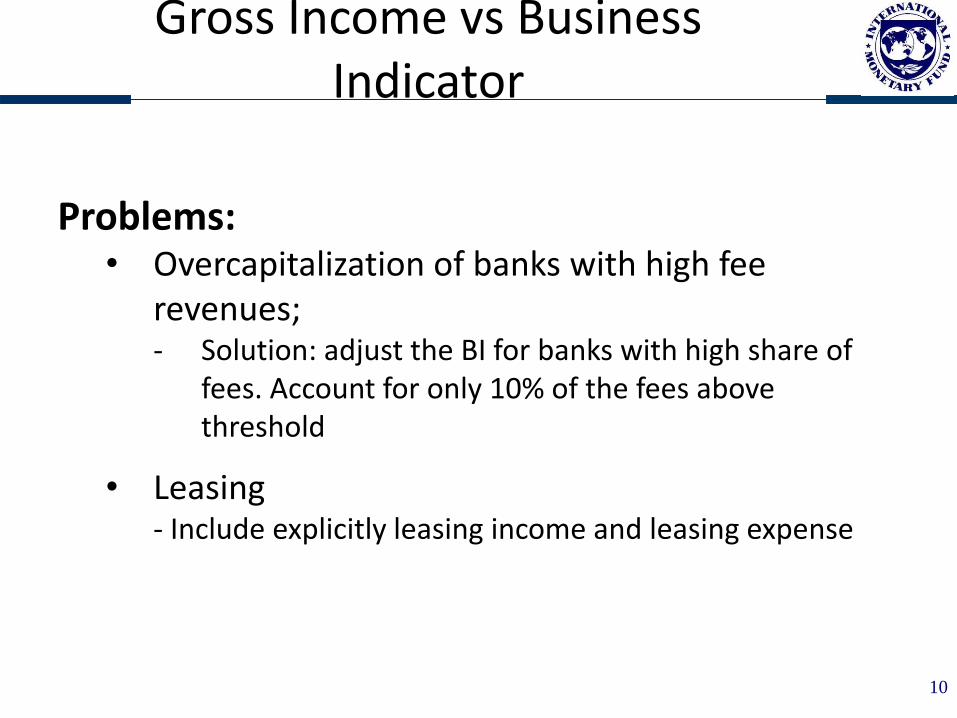
Gross Income vs Business Indicator
Problems:• Overcapitalization of banks with high fee
revenues;- Solution: adjust the BI for banks with high share of
fees. Account for only 10% of the fees above threshold
• Leasing- Include explicitly leasing income and leasing expense
11
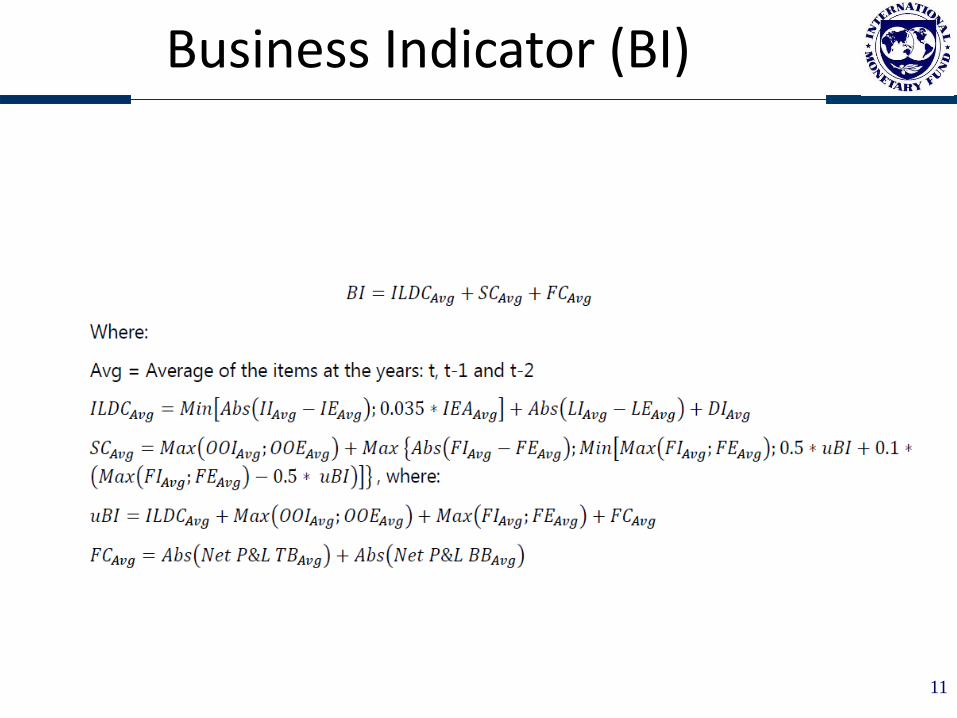
Business Indicator (BI)

12
BI Component
Operational Risk is non linear on BI

13
Loss Multiplier
Attempt to increase risk sensitivity
Loss Component= 7* Average Total Annual Loss+
7* Average Total Annual loss events above € 10 million+5* Average Total Annual Loss events above € 100 million
Average bank: Loss Component = BI

14
Loss Multiplier
0
0.5
1
1.5
2
2.5
3
0 2 4 6 8 10 12
Loss Multiplier
Loss / BI

15
SMA Capital Charge
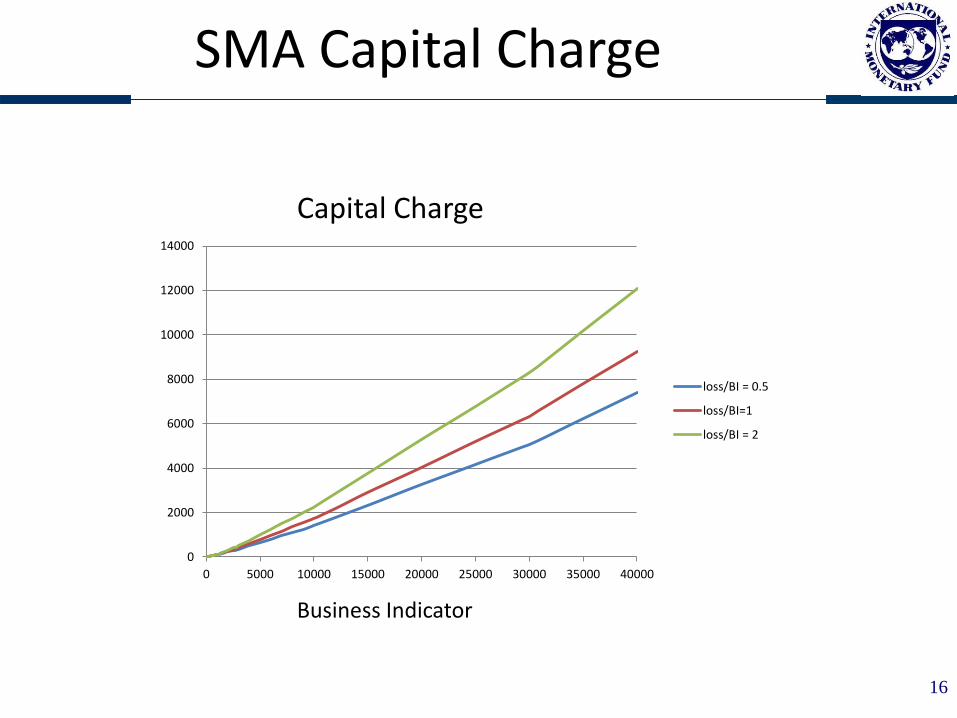
BI Component ; if bucket 1
SMA Capital =
110 Mln +(BI component – 110 Mln) * lossmultip ;
if bucket 2 – 5.
16
SMA Capital Charge
0
2000
4000
6000
8000
10000
12000
14000
0 5000 10000 15000 20000 25000 30000 35000 40000
loss/BI = 0.5
loss/BI=1
loss/BI = 2
Capital Charge
Business Indicator
17
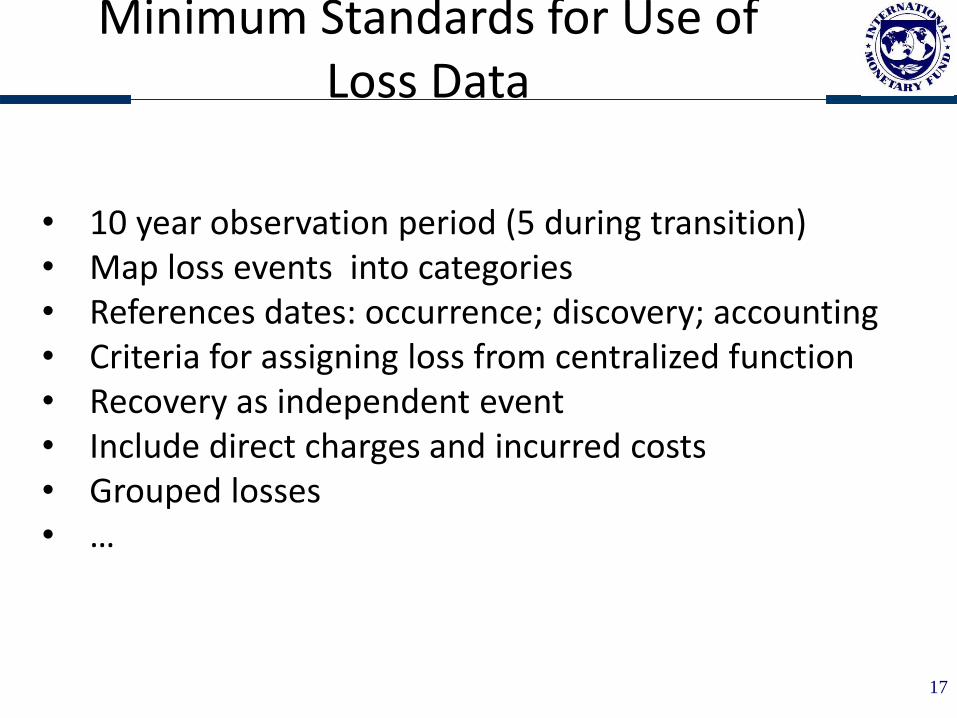
Minimum Standards for Use of Loss Data
• 10 year observation period (5 during transition)• Map loss events into categories• References dates: occurrence; discovery; accounting• Criteria for assigning loss from centralized function• Recovery as independent event• Include direct charges and incurred costs• Grouped losses• …
18
Impact
On going calibration• Goal: no overall material increase• Banks on lower buckets likely to have reduction

19
Question for Discussion
• Should the new OpRisk Capital Charge be a priority for EM?

Thank you
2016 Seminar for Senior Bank Supervisors from Emerging Economies