standardization of an orthotopic mouse brain tumor … · atmosphere containing 95% air and 5% co 2...
TRANSCRIPT

Summary. Animal models of glial-derived neoplasmsare needed to study the biological mechanisms of gliomatumorigenesis and those that sustain the disease state.With the aim to develop and characterize a suitable invivo experimental mouse model for infiltratingastrocytoma, with predictable and reproducible growthpatterns that recapitulate human astrocytoma, this studywas undertaken to analyze the long-term course of asyngeneic orthotopically implanted CT-2A mouseastrocytoma in C57BL/6J mice. Intracranial injection ofCT-2A cells into caudate-putamen resulted indevelopment of an aggressive tumor showing typicalfeatures of human glioblastoma multiforme, sharingclose histological, immunohistochemical, proliferative,and metabolic profiles. To simulate metastatic disease tothe brain, CT-2A cells were injected through the internalcarotid artery. Tumors identical to those obtained byintracranial injection were obtained. Finally, CT-2A cellswere re-isolated from experimental brain tumors andtranscranially re-injected into the caudate-putamen ofhealthy mice. These cells generated new tumors thatwere indistinguishable from the initial ones, suggestingin vivo self-renewal of tumor cells. Small-animal modelsare essential for testing novel biological therapiesdirected against relevant molecular targets. In apreliminary study, experimental CT-2A tumors werechronically treated with the small molecule 77427, agastrin-releasing peptide (GRP) blocker compound thatinhibits angiogenesis. Treated animals developedsignificantly smaller tumors than controls, suggesting anantitumor action for 77427 in glioblastomas. Weconclude that the orthotopic CT-2A tumor model, asdescribed herein, is appropriate to explore themechanisms of glioma development and for preclinicaltrials of promising drugs.
Key words: Astrocytoma, Animal model,Antiangiogenic treatment, Metastasis, Magneticresonance imaging (MRI)
Introduction
Infiltrating gliomas (astrocytomas, glioblastomas,mixed gliomas, and oligodendrogliomas) represent themost common type of primary brain tumor (DeAngelis,2001; Deorah et al., 2006), with an incidence rate of 5.9per 100,000 persons-years in the United States accordingto the Central Brain Tumor Registry of the United States(www.cbtrus.org). Approximately 18,000 people in theUnited States are diagnosed annually with primarymalignant brain tumors and approximately 13,000people die from this disease annually (CBTRUS, 2005).Even though primary brain tumors are rare, accountingfor merely 2-5% of all malignancies, they are, afterstroke, a frequent cause of death from neurologicaldisorders due to their remarkable resistance to availabletreatments. Neoplasms of the central nervous system(CNS) are, after leukaemia, the second cause of deathdue to cancer in children (Kaiser, 1999; McKinley et al.,2000). The highly infiltrative growth of malignant braintumors and difficulties for drug penetration through theblood-brain barrier and the neural parenchyma determinea limited number of therapeutic options. Hence, there isa crucial need for new and better therapeutic strategiesfor brain tumors. The development of specific anti-cancer treatments requires a good understanding of theinitiation and progression process of gliomas. Recently,specific brain tumor stem cells, named glioma stemcells, have been identified (Vescovi et al., 2006),although there is still discussion on whether these cellscause glioma initiation and progression or are the resultof such processes (Fan et al., 2006).
Among the primary tumors found in the CNS,astrocytic neoplasms are by far the most common type.
Standardization of an orthotopic mouse brain tumor model following transplantation of CT-2A astrocytoma cellsR. Martínez-Murillo and A. MartínezDepartment of Cellular, Molecular, and Developmental Neurobiology, Instituto Cajal, Madrid, Spain
Histol Histopathol (2007) 22: 1309-1326
Offprint requests to: Alfredo Martinez, Department of Cellular,Molecular, and Developmental Neurobiology, Instituto Cajal, Avda.Doctor Arce 37, 28002 Madrid, Spain. e-mail: [email protected]
DOI: 10.14670/HH-22.1309
http://www.hh.um.es
Histology andHistopathology
Cellular and Molecular Biology

Despite tremendous technical improvements inneuroimaging and neurosurgery, the morbidity andmortality caused by this malignancy is highly significantand the incidence of brain cancer is increasing in bothchildren and the elderly (McKinley et al., 2000). Humanastrocytomas are well-differentiated tumors that growslowly and display an intrinsic tendency for diffuseinfiltration of the neighboring brain structures. Theyhabitually recur and naturally progress, according to theclassification of the World Health Organization (WHO),from a lower-grade (WHO grade I), passing through amedium grade (WHO grade II) to a high-grademalignancy known as anaplastic astrocytoma (WHOgrade III). The highest grade, glioblastoma multiforme(GBM) is the most malignant infiltrative astrocytomaand one of the most lethal of all cancers (WHO gradeIV) (Kleihues and Ohgaki, 1997; Kleihues et al., 2002).Progression through this scale is responsible for themajority of patient mortality, providing also the rationalefor early detection.
Understanding the tumor–host interactionsrepresents an attractive objective for cancer therapy. Inthe CNS, tumors elicit a response from their host whichincludes, among others, angiogenesis. Angiogenesis is acomplex physiological process involving a number oftightly controlled sequential events that occurs undernormal and pathological conditions (Kaur et al., 2004).Tumor angiogenesis is a major independent prognosticfactor since it is a key process in tumor growth andmetastasis (Folkman, 1971; Jung et al., 2006; Kalluriand Zeisberg, 2006). Since all solid tumors areneovascularized by the time they are detected and in theabsence of an adequate vasculature, tumor cells becomenecrotic and/or apoptotic (Holmgren et al., 1995),understanding the regulation of tumor angiogenesis hasbecome one of the most exciting new developments inanticancer therapy (Gasparini et al., 2005).Microvascular proliferation is a key feature in gliomagrading, separating low-grade primary tumors frommalignant gliomas depending on the number of vesselsper microscopic field (Wesseling et al., 1998). A numberof angiogenesis inhibition strategies have been proposedas anticancer therapies (Brown and Wilson, 2004;Gasparini et al., 2005). In physiological states,angiogenesis depends on a strictly regulated equilibriumbetween stimulatory and inhibitory angiogenic factors(Folkman, 1992). In neoplasia, the angiogenic balance istipped in favor of new vessel growth (Hanahan andFolkman, 1996). The onset of angiogenesis in cancer isunder investigation and appears to involve down-regulation of endogenous angiogenesis inhibitors and theimplication of intracellular pathways required forembryonic vascular development (Patel et al., 2005).Gliomas are particularly well vascularized and,therefore, serve as a model to study the process of tumorangiogenesis and to investigate anti-angiogenictherapies. Tumor angiogenesis results in vessels withsevere malformations. The morphology of the newtumor vessels is dilated, tortuous, elongated, and
chaotically organized. Tumor vessels can be void ofsmooth muscle cells and lack normal innervation (Jain,2003). Unlike the vessels in normal brain tissue, tumorvessels are highly permeable (Dvorak et al., 1999),allowing the selective uptake of anticancer drugs (Konnoet al., 1986).
Identification of reliable models that recapitulate thecellular and molecular features of specific humancancers is needed to accelerate both the understanding ofthe molecular pathogenesis of cancer and the discoveryof therapeutic targets (Peterson et al., 1994). Asknowledge of the molecular biology of neoplasia hasadvanced, transgenic technology has been utilized inelucidating the complex molecular mechanismsunderlying oncogenesis and progression of brain tumors.Experimental models for brain tumors that includegenetically modified mice, with overexpressed and/ordeleted genes, have been created (Ding et al., 2001;Reilly and Jacks, 2001; Hu and Holland, 2005).However, since there are no adequate mechanisms tocorrelate genetic alterations in mouse tumors with theirproposed human counterpart, to what extent the existingmouse models mimic the biology of brain cancer inhumans remains uncertain. The gene expression profiles,controlling elements, pathways, and cells of origin forbrain tumors remain largely unknown and the molecularelements, such as tissue-specific promoters andenhancers, to create genetically accurate models of braintumors are still poorly understood. On the other hand,established human glioma cell lines experience overtime numerous morphologic and genetic changes and donot reproduce the biology of the tumor in vivo. Thisstudy aims to better standardise an orthotopic model ofmouse infiltrating astrocytoma that mimics the humanclinical situation in terms of histopathologicalcharacteristics and angiogenic features.
We have developed a transplant-based model ofmouse astrocytoma derived from cultured CT-2A cells(Zimmerman and Arnold, 1941; Abate et al., 2006)which closely replicates the biology of humanastrocytoma more efficiently than do the currentlyavailable immortalized glioma cell lines and other invivo models. Characterization of the experimental tumorwas performed using histopathology, immuno-histochemistry, and non-invasive imaging procedures(MRI). In conclusion, this tumor model recapitulateswell the human astrocytoma disease and can be used forpreclinical testing.Material and methods
Cell culture
CT-2A mouse astrocytoma cells (Abate et al., 2006)were obtained as a generous gift from Prof. T.N.Seyfried (Boston, MA, USA). Tumor cells were grownin RPMI 1640 medium (Gibco, Invitrogen Co.,Carlsbad, CA, USA) supplemented with 10% heat-inactivated fetal bovine serum (R10) in a humidified
1310Brain tumor model

atmosphere containing 95% air and 5% CO2 at 37°C.Upon reaching confluency, the cells were trypsinizedand collected. The pellet was resuspended in RPMI 1640medium and the cell suspension was adjusted to obtainan appropriate concentration of cells for injection (8x10⁴cells in 4 µl). Mouse model
A total of forty one adult 12-week-old C57BL/6J,four BALB/c, and four SJL female mice (Harlan Iberica,Barcelona, Spain) weighing 20-25 g were used in thisstudy. All procedures were carried out in accordancewith the European Communities Council Directive(86/609/EEE) on animal experiments and with theEthical Committee of the Spanish Council for ScientificResearch (CSIC).
CT-2A cells were injected into the right caudate-putamen (CP) of twenty six experimental animals byintracranial injection using stereotaxic guidance. Micewere deeply anesthetized with pentobarbital (10 mg/kg)and atropine (90 mg/kg) intraperitoneally and placed in amouse stereotaxic frame (David Kopf Instruments,Tujunga, CA, USA). While under deep anesthesia, asagittal incision was made through the skin to expose theskull, and a burr hole was drilled at 0.1 mm anterior and2.25 mm lateral to bregma. A 10 µl Hamilton syringe(Hamilton, Reno, NV, USA) with a 27-gauge needle wasinserted at the depth of 2.7 mm from brain surface forinfusion of tumor cells. The tumor cells were injectedover 15 min. at a speed of 1 µl/3 min. The burr hole wasthen filled with spongostan (Ferrosan A/S, Soeborg,Denmark) and the scalp sutured. Tumor growth andprogression were examined by in vivo MRI andhistopathology at 7, 14, 21, and 28 days following cellinjection. A total of four animals received an intracranialinjection of 4 µl of RPMI 1640 medium in the CP. Theseanimals, used as controls, were processed in parallelwith those receiving CT-2A cells.
Alternatively, CT-2A tumor cells re-isolated from anin vivo experimental CT-2A brain tumor, were injectedagain in the CP of two healthy anesthetized mice. Forthis, the experimental CT-2A tumor was excised fromthe brain, washed with minimal essential mediumcontaining 1% penicillin and streptomycin (Gibco),minced and triturated with a Pasteur pipette while in R10medium, and plated into plastic culture flasks. Atconfluency, the cultures were trypsinized, and the pelletresuspended in RPMI 1640 medium. The cell suspensionwas adjusted to obtain an appropriate concentration ofcells for injection (8x10⁴ cells in 4 µl).
CT-2A cells were also injected in the carotid artery,to simulate metastatic invasion. For this, followingalcohol disinfection, the skin of the neck of fourC57BL/6J mice was cut by a medial incision, and thecommon right side carotid artery was exposed. Threeligatures of 7-0 silk suture were placed, i) around theorigin of the common carotid artery, ii) proximal to thecarotidal bifurcation, which was not closed immediately,
and iii) around the origin of the external carotid. Apolyethylene tube (PE 10, BD, Franklin Lakes, NJ,USA) containing the tumor cell suspension (8x10⁴ cellsin 10 µl) and connected to a 50 µl Hamilton syringe wasinserted into the common carotid artery and placed in theorigin of the internal carotid artery. At this point, thesecond ligature was tightened around the polyethylenetube to avoid leakage. After tube insertion, a volume of10 µl containing the cell suspension was slowly injected.
The external carotid artery was kept permanentlyclosed to prevent tumor cell reflux into the externalcarotid and subsequent local tumor cell spread. Then, thetube was removed and the second ligature was closedpermanently.
To investigate the influence of the immune system intumor progression, CT-2A cells were injected in fourBALBc and four SJL mice. No tumors developed inthese mice.Magnetic resonance imaging
Mouse tumor growth was imaged weekly by MRI,starting 7 days after tumor cell injection, at 4.7 Teslasusing a BIOSPEC BMT 47/40 (Bruker, Ettlingen,Germany), equipped with a 12 cm actively shieldedgradient system. Mice were anaesthetized as above andinjected intraperitoneally with 0.4 mmol/kgGadopentetate dimeglumine (Gadolinium, Magnevist,Schering, Germany). Mice were put in prone positioninside a cradle to avoid unexpected movements. Arespiration sensor was used to survey the animals vitalfunctions. First we acquired T2 weighted images using afast spin echo sequence. The acquisition parameterswere: TR = 4000 ms, effective TE = 60 ms, FOV = 3cm, Slice Thickness = 1 mm and matrix = 256x192. Thismatrix size was increased during reconstruction by azero-filling process in order to obtain images of 256x256pixels. After that, we acquired T1 (TR/TE=700/15 ms)weighted spin echo images using the same geometricalparameters as above. These images were used tocalculate tumor volume using ParaVision software(Bruker, Ettlingen, Germany). HR-MAS 1H NMR data acquisition
The spectroscopy procedures followed in this studyhave been previously described (Cheng et al., 1998).Briefly, tissue specimens taken from CT-2A tumor andthe contralateral healthy region were snap-frozen inliquid nitrogen and maintained at -80°C untilspectroscopic analysis. Cerebral tissue was examinedusing high resolution magic angle spinning (HR-MAS)operating at 4°C to minimize tissue degradation, 1H-NMR spectroscopy was performed at 500.13 MHz usinga Bruker AMX500 spectrometer 11.7 T. Samples wereobtained from histologically defined coronal slides ofbrains four weeks after CT-2A implants and were placedwithin a 12 ml zirconium oxide rotor with sphericalinsert and spun at 4000 Hz spinning rate, to remove the
1311Brain tumor model

effects of spinning side bands from the spectra acquired.Shimming and NMR preparation time was kept to aminimum and the NMR analysis was performed at 4°Cto minimize metabolic changes. Under such conditionsno noticeable biochemical degradation of the sampleswas observed during spectral acquisition. Standardsolvent suppressed spectra were acquired in 16 k datapoints, averaged over 128 acquisitions, total acquisition~5 min using a sequence based on the first increment ofthe NOESY pulse sequence to effect suppression of thewater resonance and limit the effect of Bo and B1 inhomogeneities in the spectra (relaxation delay-90°-t1-90°-tm-90°- acquire free induction decay (FID)) in whicha secondary radio frequency irradiation field is applied atthe water resonance frequency during the relaxationdelay of 1s and during the mixing period (tm = 150ms),with t1 fixed at 3 s. A spectral width of 8333.33 Hz wasused. All spectra were processed using TOPSPINsoftware, version 1.3 (Bruker Rheinstetten, Germany).Prior to Fourier transformation, the FIDs were multipliedby an exponential weight function corresponding to aline broadening of 0.3 Hz. Spectra were phased,baseline-corrected and referenced to the sodium TSP [(3-trimethylsilyl)-2,2,3,3-tetradeuteriopropionate] singlet atδ 0ppm. 1H NMR spectra were data reduced using thesoftware program AMIX (Analysis of MIXtures version3.6.8, Bruker Rheinstetten, Germany) by subdivisioninto integral regions of 0.02 ppm between δ 0.4 and 4.6ppm. Individual integral regions were normalized to thetotal integral region following exclusion of the waterresonance. Principal component analysis (PCA) wasapplied to the data and used no scaling by weightingeach integral region or variable by 1/√Sk where Skrepresents the standard deviation of the variable. Theanalysis increased the representation of lowerconcentration metabolites in the resultant data modelswhile minimizing noise. Loading plots from the PCAwere used to identify metabolites.Histopathology
All mice were clinically evaluated and sacrificed atdifferent time intervals, 7, 14, 21, and 28 days followingcell implants. Experimental animals were sacrificed ifthey showed signs of motor disfunction or exhibitedsymptoms consistent with failure to thrive as per animalcare protocols. Histopathology was performed oncoronal tissue sections obtained through the same rostro-caudal levels that were previously identified by MRI asexhibiting tumor growth. Mice were deeply anesthetizedas for MRI and then perfused transcardially through ablunt cannula with 20 ml phosphate-buffered saline(PBS) followed by 40 ml of 4% paraformaldehyde in 0.1M phosphate buffer (PB), pH 7.4. Brains were thenremoved and post-fixed for 4 hours by immersion in thesame fixative, at room temperature. For H&E stain tissueblocks were paraffin embedded and then cut coronally in5-µm sections. For light microscopy immuno-histochemistry, brain tissue was sectioned at 40-µm in
the coronal plane with the aid of a vibratome (LeicaMicrosystems GmbH, Wetzlar, Germany). Immunohistochemistry
The expression of the p53 tumor suppressor protein(p53) in the experimental tumor was evaluated using amouse monoclonal antibody (EXBIO, Praha, CzechRepublic). The glial origin of the CT-2A cells wasindicated by the presence of GFAP by using a mousemonoclonal antibody (GFAP, Sigma CO, St. Louis, MO,USA). The presence of Sox family of transcriptionfactors 9 and 10 in tumor cells was screened by usingpolyclonal antibodies which have been previouslycharacterized (Maka et al., 2005; Stolt et al., 2003) andwere a generous gift from Dr. Michael Wegner (Institutfur Biochimie, Universitat Erlangen-Nuremberg,Germany). Polyclonal antibodies against NOS isoforms(neuronal: nNOS, endothelial: eNOS, and inducible:iNOS) and nitrotyrosine, a marker of final proteinnitration (Encinas et al., 2003), were used to follow theexpression of the nitrergic system as the experimentalCT-2A tumor grew. Antisera against nNOS, iNOS andnitrotyrosine were produced in house as previouslydescribed (Rodrigo et al., 1994). eNOS immuno-cytochemistry was performed with a polyclonal antibody(Transduction Laboratories, Lexington, KY, USA).Adrenomedullin (AM) expression in CT-2Aexperimental tumor was carried out by using polyclonalantibodies that were also produced in house (Martinez etal., 1995).
Immunohistochemistry was performed according tostandard avidin-biotin-peroxidase complex (ABC)methods (Hsu et al., 1981). Immunohistochemistry withp53 was performed on paraffin-embedded tissue sections(5 µm-thick). For this, tissue sections were pretreated forantigen retrieval at high temperature (microwave) in 10mM citrate buffer pH 6.0 for 5 min. Immuno-histochemistry for GFAP, Sox transcription factors 9 and10, NOS isoforms, nitrotyrosine, and AM was carriedout in free-floating sections that were preincubated in1% H2O2 in PBS for one hour to block endogenousperoxidase. Sections were then treated with 3% normalserum obtained from the species providing the secondaryantibodies diluted in PBS containing 0.2% Triton X-100,for 1 h at room temperature (RT). Then, sections wereincubated overnight at 4°C in the primary antibodiesdiluted in PBS containing 0.2% Triton X-100.Antibodies dilutions were: i) p53, 1:100, ii) GFAP,1:500; iii) Sox9, 1:2000, iv) Sox10,1:500, v) nNOS,1:3000), vi) iNOS, 1:5000, vii) eNOS, 1:1000, viii)nitrotyrosine, 1:1000, and ix) AM, 1:1000. Afterwashing thoroughly in PBS, histological sections wereincubated with biotinylated secondary antibodies, goatanti-mouse or goat anti-rabbit immunoglobulins 1:200 inPBS (Vector Laboratories, Burlingame, CA, USA), for 1h at RT. After additional washes, sections wereincubated with peroxidase-linked ABC (VectorLaboratories) for 90 min. Peroxidase activity was
1312Brain tumor model

developed by nickel enhanced 3,3’-diaminobenzidinetetrahydrochloride (DAB) as described (Rodrigo et al.,1994). Finally, sections were washed, mounted anddehydrated for light microscopy visualization.Histological sections were examined with a ZeissAxiophot II microscope (Zeiss Iberica, Madrid, Spain)and images captured with a digital camera (DMC le,Polaroid, Cambridge, MA, USA). Immunofluorescencestaining for confocal microscopy was carried out byincubating tissue sections in the specific antibodies forGFAP and Sox9 diluted as for ABC procedure. Sectionswere then thoroughly washed and incubated with Cy3-donkey anti-mouse IgG and Rhodamine Red donkeyanti-rabbit IgG (Jackson ImmunoResearch, West GrovePA, USA) diluted 1:200 in PBS, for 1 hour at RT.Confocal images were acquired using a Leica TCS SP5(Leica Microsystems GmbH, Wetzlar, Germany)scanner.
Ultrastructural studies of experimental CT-2A tumorwere carried out in 40-µm-thick tissue sections. Beforecutting, tissue blocks were rapidly frozen in liquidnitrogen and thawed in cold 0.1M PB to improveantibody penetration. For the subcellular location ofAM, tissue sections were processed as for lightmicroscopy, except that Triton X-100 was avoided in theincubation steps. The immunocytochemical reaction wasdeveloped by incubating the tissue sections in PBScontaining 0.006% DAB, for 10 min followed by0.003% of H2O2 in the same solution. Subsequently, thesections were washed for 5 min in PBS and PB,postfixed in 1% osmium tetroxide in 0.1M PB for 1hour, dehydrated in ethanol of increasing concentrationsand block-stained in uranyl acetate (1% in 70% ethanol)in the dark for 40 min at room temperature. The sectionswere then flat embedded and mounted on DurcupanACM resin slides (Sigma-Aldrich Inc.) under plasticcoverslips and cured for 3 days at 56°C. Selected areasof the immunostained tumor were dissected out and re-embedded in Durcupan. Ultrathin sections were obtainedwith the aid of a Reichert OM U3 ultramicrotome(Reichert, Germany), mounted on formwar-coated grids,stained with lead citrate, and examined under a Jeol1200 electron microscope (Jeol, Tokyo, Japan) at 80 Kv.No immunolabeling was detected when the primaryantibodies were omitted or replaced with an equivalentconcentration of normal mouse or rabbit serum. Inaddition, preabsorption with an excess of the antigenprevented staining in all cases. Results
Tumor growth
CT-2A cells grew in vitro as a monolayer of fusiformshaped cells. Three to four weeks following cell implant,a highly angiogenic and haemorrhagic soft tumor (Fig.1A) was detected in treated mice, obtaining a 100%tumorigenesis rate. The tumor margins were typicallywell defined (Fig. 1B-E), merging discernibly with the
adjacent white and gray matter (Figs 1E). Five to tendays following intracranial injection with CT-2A cells, asoft, non cohesive hypercellular mass was observed nearthe injection site (Fig. 1F). Histological analysis showedcharacteristic features of a high-grade astrocytoma, suchas high mitotic index, microvascular proliferation,cellular density and a central area of necrosis(pseudopalisading necrosis) (Figs 1G,H, 2, 3A). Thetumors showed extensive heterogeneity (Fig. 1H). Asubset of tumor cells infiltrated into the surroundingbrain tissue following tracks marked by blood vessels(Fig. 2).
Tumor CT-2A cells harvested from transplantedanimals and grown in tissue culture formed a monolayerof fusiform cells. Almost all the cells retrieved from thetumor had morphological characteristics of tumor cellswith very little contamination from stromal components,possibly due to the well defined margins of the tumor.These re-cultured tumor cells maintained highproliferating capacity when re-implanted transcraniallyinto healthy mice. In addition, injection of CT-2A cellsinto the carotid artery caused a metastatic tumor growthin the homolateral hemisphere 7-10 days following cellinoculation in all animals treated. The resulting tumorshad the same growing characteristics and histologicalfeatures as those generated following intracranial CT-2Acell injection (data not shown).
Under the electron microscope, tumor cells werepleomorphic, either large fusiform or small, withcharacteristic nuclei which exhibited areas ofheterochromatin and frequent prominent nucleoli (Fig.3). The cytoplasm contained abundant mitochondria andpolyribosomes, indicating a high metabolic and syntheticrate. RMI analysis
Conventional T2- and T1- weighted (pre- andGadolinium post-contrast) MRI images providedexceptional sensitivity in detecting and delineating thelocation of intracranial tumors (Figs 1B-D, 4). Therecognition of intracranial tumors was markedlyenhanced with prior administration of Gadolinium (Figs1B-D; 4A,C,E), with a resolution limit of 0.013 mm2.T1-weighted imaging with Gadolinium enhancement ofvascularity was routinely used to detect tumor location,margins, size, and growth. The MRI images regardingtumor size and location correlated accurately with theresults of the histopathological analysis in this study(compare Fig. 1D with Fig. 1E). T1-weighed imagesrevealed a well-defined heterogeneously enhancing massthat arose in the CP (Fig. 1B), extending over timerostro-caudally and eventually involving the cerebralcortex and hippocampus (Figs. 1C,D, 4A,C,E).Occasionally, the tumor grew outside of the skullthrough the needle tract (Fig. 1C). Tumor progressionwas verified by serial MRI over time and weekly imagesof experimental CT-2A tumors were successfullyobtained (Fig. 4). The experimental tumor was
1313Brain tumor model
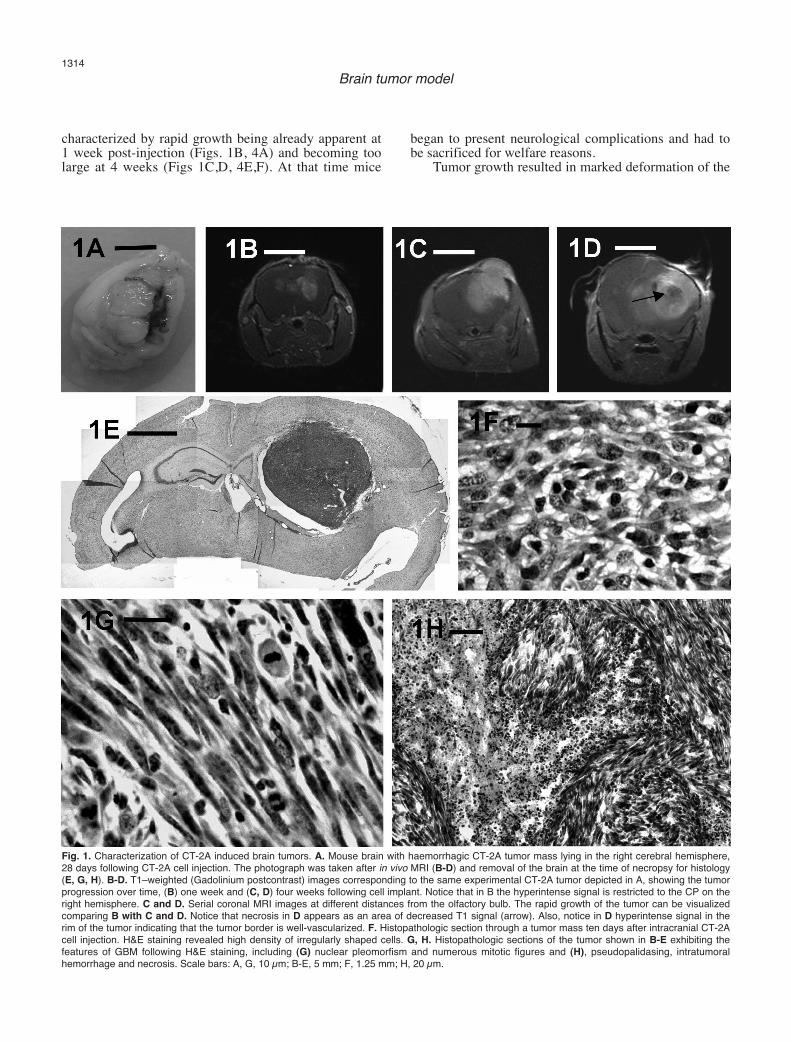
characterized by rapid growth being already apparent at1 week post-injection (Figs. 1B, 4A) and becoming toolarge at 4 weeks (Figs 1C,D, 4E,F). At that time mice
began to present neurological complications and had tobe sacrificed for welfare reasons.
Tumor growth resulted in marked deformation of the
1314Brain tumor model
Fig. 1. Characterization of CT-2A induced brain tumors. A. Mouse brain with haemorrhagic CT-2A tumor mass lying in the right cerebral hemisphere,28 days following CT-2A cell injection. The photograph was taken after in vivo MRI (B-D) and removal of the brain at the time of necropsy for histology(E, G, H). B-D. T1–weighted (Gadolinium postcontrast) images corresponding to the same experimental CT-2A tumor depicted in A, showing the tumorprogression over time, (B) one week and (C, D) four weeks following cell implant. Notice that in B the hyperintense signal is restricted to the CP on theright hemisphere. C and D. Serial coronal MRI images at different distances from the olfactory bulb. The rapid growth of the tumor can be visualizedcomparing B with C and D. Notice that necrosis in D appears as an area of decreased T1 signal (arrow). Also, notice in D hyperintense signal in therim of the tumor indicating that the tumor border is well-vascularized. F. Histopathologic section through a tumor mass ten days after intracranial CT-2Acell injection. H&E staining revealed high density of irregularly shaped cells. G, H. Histopathologic sections of the tumor shown in B-E exhibiting thefeatures of GBM following H&E staining, including (G) nuclear pleomorfism and numerous mitotic figures and (H), pseudopalidasing, intratumoralhemorrhage and necrosis. Scale bars: A, G, 10 µm; B-E, 5 mm; F, 1.25 mm; H, 20 µm.

1315Brain tumor model
Fig. 2. A. Light micrograph of a H&E stained section illustrating CT-2A cells located close to the rim of the tumor and infiltrating the surroundingneuropil following host vasculature (asterisk) caming from the neighbouring cerebral cortex. B. High-power magnification of the boxed area in A. Mitoticfigures near a pre-existing blood vessel are detected. Scale bars: A, 100 µm; B 10 µm.
Fig. 3. A. Lightmicoscopic image ofosmium-stainednormal brain tissue(dark) and adjacentCT-2A tumor (lightcolor). Numerousintratumoral bloodvessels (asterisks)are seen in thetumor. B. Electronmicrograph showingthe fine morphologyof the neuropil innormal brain tissuefar from tumorgrowth. C and D.Electron micrographsillustrating theultrastructuralappearance of tumorcells in the transitionzone (C) and deep inthe tumor (D). Tumorcells show cytologicalpleomorphism withprominent nucleoli,slender processesand characteristicheterochromatin.Scale bars: A, 100µm; B-D, 2.5 µm.

lateral and dorsal third ventricles (Fig. 4D,F). A centralhypo-attenuation of the tumor was frequently seen in T1-weighted images suggesting central necrosis (Fig. 1D)which was confirmed in the histological analysis ofthose cases (Fig. 1G,H). In addition, cystic changeswithin the tumor were occasionally detected in T2-weighted images (Fig. 4F).Tumor growth provokedsigns of destruction of brain parenchyma and ofincreasing pressure within the brain as it invaded theneighboring brain structures (Figs 1A-E,G,H; 4). After15-20 days post implantation, mice began to show signsof raised intracranial pressure. Symptoms such aslethargy or motor disfunctions with hunched posture,
poor grooming, failure to thrive and weight loss, werecommon. The periphery of the tumor had in all instancesa well-established blood supply as revealed by theenhanced pattern in T1-weighted images withGadolinium (Fig. 4E).Immunohistochemistry
Immunostaining for p53 was exclusively nuclear andwas exhibited by numerous cells in the tumor mass (Fig.5A). GFAP immunoreactivity was detected in normalastrocytes of the brain parenchyma outside the tumorand also in tumor cells (Fig. 5B-E). The reaction product
1316Brain tumor model
Fig. 4. MRI coronal imagesperformed at different timeintervals showing progressivetumor growth in anexperimental animal afterintracranial injection of CT-2Aastrocytoma cells.Assessment of tumor volumechanges is shown by usingGadolinium enhanced T1- (A,C, E) and T2- (B, D, F)weighted images. A,B,Sections at the same levelone week post injection. Asmall tumor mass in A (arrow)is located deep in the CP. Atthis time point, T2-weightedimage (B) is unable to detectthe tumor mass shown in A. C, D. Aspect of the tumor twoweeks post-injection. At thistime point, the tumor mass(arrow in D) displaces thelateral ventricle allowing tumoridentification by T2-weightedimage. E, F. Enlarged tumorfour weeks post-injection.Thin rim of contrastenhancement is seen aroundthe tumor as well as a nodularenhancement inside the tumor(E). With T2 a mass effectdistorting the right lateral anddorsal ventricles and a smallenhancing hyperintense area(arrow) likely representing acyst are clearly seen (F).Scale bar: 5 µm.
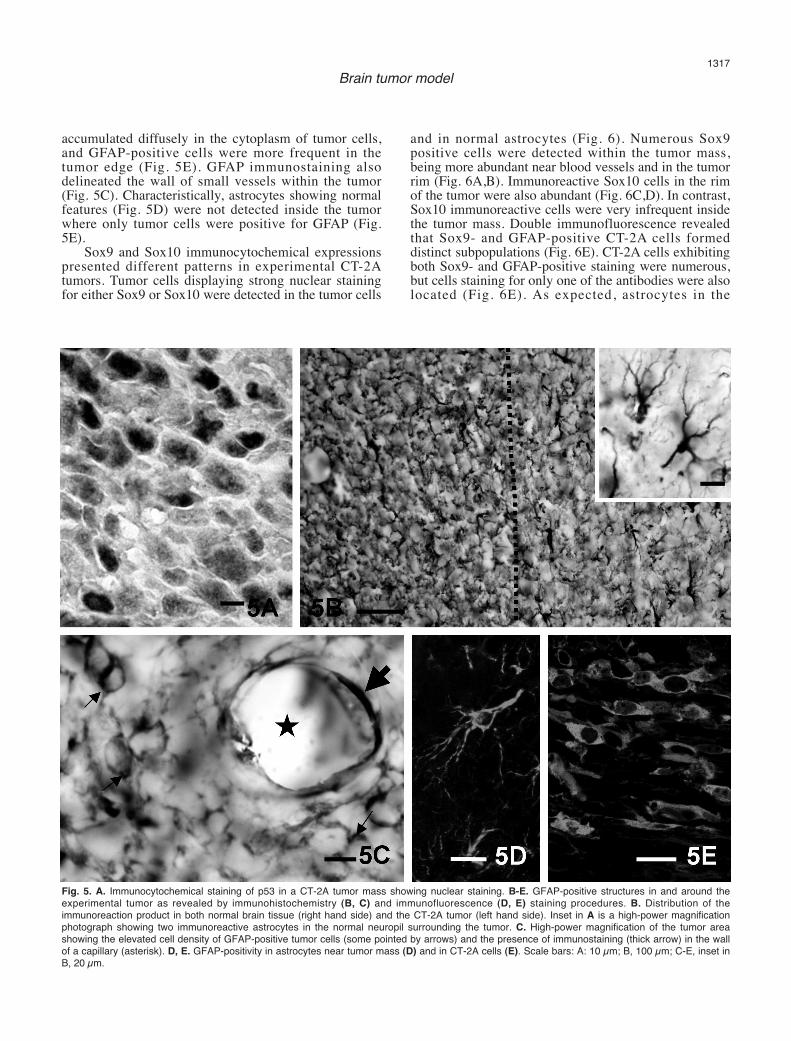
accumulated diffusely in the cytoplasm of tumor cells,and GFAP-positive cells were more frequent in thetumor edge (Fig. 5E). GFAP immunostaining alsodelineated the wall of small vessels within the tumor(Fig. 5C). Characteristically, astrocytes showing normalfeatures (Fig. 5D) were not detected inside the tumorwhere only tumor cells were positive for GFAP (Fig.5E).
Sox9 and Sox10 immunocytochemical expressionspresented different patterns in experimental CT-2Atumors. Tumor cells displaying strong nuclear stainingfor either Sox9 or Sox10 were detected in the tumor cells
and in normal astrocytes (Fig. 6). Numerous Sox9positive cells were detected within the tumor mass,being more abundant near blood vessels and in the tumorrim (Fig. 6A,B). Immunoreactive Sox10 cells in the rimof the tumor were also abundant (Fig. 6C,D). In contrast,Sox10 immunoreactive cells were very infrequent insidethe tumor mass. Double immunofluorescence revealedthat Sox9- and GFAP-positive CT-2A cells formeddistinct subpopulations (Fig. 6E). CT-2A cells exhibitingboth Sox9- and GFAP-positive staining were numerous,but cells staining for only one of the antibodies were alsolocated (Fig. 6E). As expected, astrocytes in the
1317Brain tumor model
Fig. 5. A. Immunocytochemical staining of p53 in a CT-2A tumor mass showing nuclear staining. B-E. GFAP-positive structures in and around theexperimental tumor as revealed by immunohistochemistry (B, C) and immunofluorescence (D, E) staining procedures. B. Distribution of theimmunoreaction product in both normal brain tissue (right hand side) and the CT-2A tumor (left hand side). Inset in A is a high-power magnificationphotograph showing two immunoreactive astrocytes in the normal neuropil surrounding the tumor. C. High-power magnification of the tumor areashowing the elevated cell density of GFAP-positive tumor cells (some pointed by arrows) and the presence of immunostaining (thick arrow) in the wallof a capillary (asterisk). D, E. GFAP-positivity in astrocytes near tumor mass (D) and in CT-2A cells (E). Scale bars: A: 10 µm; B, 100 µm; C-E, inset inB, 20 µm.

neocortex exhibited double labelling for GFAP and Sox9(Fig. 6F). Remarkably, we also observed Sox9 positivestaining in Golgi-like structures of GFAP-negative cells,
probably belonging to cortical neurons (arrows in Fig.6F).
With regard to the immunocytochemical location of
1318Brain tumor model
Fig. 6. Distribution of Sox9 (A, B, E, F) and Sox10 (C, D) in and around the experimental tumor. A. High cellular density of Sox9 stained cells was seennear blood vessels (asterisk) and in the rim of the tumor. B. is a higher-power magnification micrograph of stained structures shown in A. C. Sox10-positive cells accumulated in the rim of the tumor. D. Details of immunoreactive cells displayed in C. Both immunoreactivities were located in the cellnuclei (E, D). Note in A and C the rich vasculature (asterisks) in the rim of the tumor. E, F. Double immunofluorescence staining of a section throughthe tumor mass (E) and the cerebral cortex (F) double labelled for GFAP (green) and Sox9 (red). Most tumor cells stained for both GFAP and Sox9,although a few cells expressed GFAP and not Sox9 (arrowheads) or viceversa (arrow). In normal brain (F), astrocytes express both. Surprisingly, Sox9staining was also found in structures suggesting Golgi apparatus cisternae of neighboring GFAP-negative cells (some pointed by arrows). Scale bars:A, C, E, 100 µm; B, 20 µm; D, F, G, 10 µm; H, 30 µm.

the nitrergic system, we found that nNOS stainingrevealed a complete destruction of the nNOS neuronalnetwork within the tumor (Fig. 7A). Positive nNOSneurons exhibiting varicose processes suggestingadvanced neurodegeneration were often detected in the
margins of the tumor (Fig. 7A,B), whereas no nNOSimmunoreactive cell was seen further inside the tumor.In the neuropil outside the tumor, nNOSimmunoreaction product marked neurons showingnormal morphologies (Fig. 7A,C). The complete
1319Brain tumor model
Fig. 7.Immunocytochemicallocalization of nNOS(A-C), iNOS (D),eNOS (E),nitrotyrosine (F) andAM (G, H) in theexperimental CT-2Atumor. Left-hand sidein A and B, nNOS-positive neurons inthe tumor massexhibiting abnormalfeatures. Notice in Aand B thatimmunoreactiveneurons in the tumormass displayvaricose processessuggestingdegeneration. Incontrast, an nNOSimmunoreactiveneuron showingtypical morphologycan be appreciated inthe CP (arrow) nearthe tumor mass (A).C. nNOS-positiveneurons in the sidecontralateral to thetumor displayingtypical morphology. Anumber of tumor cells(some pointed byarrows) are seenexhibitingimmunostaining foriNOS particularly inthe rim of the tumor(D), eNOS (E),nitrotyrosine (F) andAM (G). E. Depictsimmunoreactionproduct associated tothe wall of smallcapillaries (asterisks).H. Illustrates intenseimmunostaining intumor cellscharacteristicallyshowing cytologicalpleomorphism byelectron microscopy.Scale bars: A-C, 20µm; D-G, 10 µm; H, 2µm.

degeneration of the neuronal network was also seen byelectron microscopy (Fig. 3). In contrast, iNOS, eNOS,and nitrotyrosine immunoreactivities were stronger intumor structures than in the surrounding brain tissue(Fig.7D-F). iNOS, eNOS, and nitrotyrosineimmunoreactivities typically labeled the cytoplasm of asubset of tumor cells (Fig. 7D,E,F). In addition, eNOSstaining was very intense in the wall of blood vessels(Fig. 7E). Outside the tumor, eNOS was detected inendothelia of blood vessels and occasional astrocyte-likecells, but never in neurons (data not shown). Noimmunoreactivity for either iNOS or nitrotyrosine wasseen in the non-affected neuropil.
Concerning AM immunoreactivity, light andelectron microscopic studies revealed deposition of thereaction product in the cell nucleus and/or cytoplasm ofa subpopulation of tumor cells (Fig. 7G,H). Through theelectron microscope, these cells show theimmunoreaction product associated with the externalsurface of cytoplasmatic organelles and the cell nucleusand the inner surface of the cytoplasmatic membrane(Fig. 7H). AM immunoreactive cells lie in the proximityof non-immunoreactive tumor cells showing similarmorphological traits. Positive and negative tumor cellswere pleomorphic, with either large fusiform or smallrounded morphology. HR-MAS 1H NMR
A direct comparison between the ex vivo HR-MAS1H NMR spectra of the CT-2A tumor and normal brainin the contralateral side of the tumor, was carried out
using both comparison of metabolite ratios and/orpattern recognition methods (Fig. 8). Spectra werecomposed of resonances deriving, among others, fromlactate (Lac), alanine (Ala), γ-aminobutyric acid(GABA), acetate (Ace), glutamate (Glu), aspartate(Asp), creatine (Cr), choline (Cho), phosphorylcholine(PCh), taurine (Tau), N-acetylaspartate (NAA) myo-inositol (Myo), and glycine (Gly). Following the samecriteria used by Tsang et al. (2005) we found nosignificant biochemical degradation of the samplesduring spectral acquisition. The spectrum of the CT-2Atumor, compared with the normal contralateral brain,revealed an increased signal for Cho (at 3.20 ppm), andPCh (at 3.22 ppm). There were also higher signals in thetumor related with Lac (at 1.3 ppm), Ala (at 1.48 ppm),Tau (at 3.26 ppm and 3.42 ppm), Gly (at 3.56 ppm),Myo (at 3.53) and Glu (at 3.79 ppm). On the other hand,the tumor showed lower signals for NAA (at 2.02 ppm),GABA (at 1.83 ppm and 2.22 ppm), Asp (at 2.68-2.82ppm), and Cr (at 3.04 ppm). Discussion
We have standardized an orthotopic mouse model ofmalignant mouse astrocytoma, CT-2A, in terms ofhistopathological characteristics and angiogenic features.The animal model has been produced after anintracerebral injection of CT-2A cells (Seyfried et al.,1992) into the CP. The resulting CT-2A tumor modelexhibited common features with the human astrocytomadisease, as shown by histopathology, immunohisto-chemistry, and non-invasive imaging procedures (MRI).
1320Brain tumor model
Fig. 8. High-resolution 1H-NMR spectra ofaqueous extracts of CT-2A tumor (A) and ofthe normal contralateral area (B). Selectedmetabolite resonances are labelled onspectrum. Abbreviations in the f igurecorrespond to: Ala: alanine; Asp: aspartate;Cho: choline; Cr: creatine; GABA: γ -aminobutyric acid; Glu: glutamate; Gly: glycine;Lac: lactate; Myo: myoinositol; NAA: N-acetylaspartate; PCh: phosphorylcholine; PCr:phosphocreatine; Tau: taurine

Given that tumor-host interactions are organ specific,mouse models should be orthotopic to better reproducetheir biology. It is also important to take into account thecontribution of the immune system. For this reason ourmodel was developed using immunocompetentsyngeneic mice.
CT-2A tumor cells were produced in the Seyfriedlaboratory by implantation of a chemical carcinogen, 20-methylcholanthrene, into the cerebral cortex ofC57BL/6J mice, following previous descriptions(Zimmerman and Arnold, 1941). By implanting CT-2Atumor pieces (about 1 mm3) from donor mice into thecerebral cortex of C57BL/6J mice, a syngeneic mousebrain tumor model was produced (Seyfried et al., 1992;Abate et al., 2006). Our procedure initiating tumors fromcultured CT-2A cells instead of from solid tumorsimproved the method by using a determined number ofcells to initiate the tumor, providing a more quantitativeapproach when studying the effect of various treatmentson tumor growth. Additionally, we kept brain damage toa minimum due to tumor implantation by injecting aliquid cell suspension rather than tissue fragments.Intracranial xenograft mouse models using tumor celllines or primary cultures have been reported previouslyin immunodeficient mice (Bock et al., 2003; Singh et al.,2004).
The injection of the CT-2A cells into the CPproduced an aggressive astrocytic neoplasmhistopathologically characterized by pleomorphic,hyperproliferative, and infiltrative cells. Our observationthat the CT-2A experimental tumor exhibits thecharacteristics of a poorly differentiated malignantastrocytoma is consistent with previous reports (Seyfriedet al., 1992; Mukherjee et al., 2002, 2004). Over time,tumors became highly cellular with frequent mitosis andother pathologic characteristics, including vascularproliferation and areas of necrosis with pseudopalisadingtumor cells, characterizing them as GBM (Yates, 1992;Fischer et al., 2005; Rong et al., 2006).
In addition to malignant mouse CT-2A model, otherastrocytoma models have been available both in vitroand in vivo (Ding et al., 2001; Reilly and Jacks, 2001;Hu and Holland, 2005; King et al., 2005; Kang et al.,2006; Khain and Sander, 2006; Lee et al., 2006; Terzis etal., 2006). However, many of the available models usedto study gliomas in mice and rats do not correctlyreproduce all of the important characteristics ofmalignant gliomas in humans, including variability ofphenotypes within individual tumors, the migratorycharacteristics in vivo that are such an important featureof human CNS tumors and the appearance ofradioresistance and chemoresistance. In addition,established human glioma cell lines develop multiplegenetic changes over time, so that they may no longerreflect the biology of the tumor in the patient.Consequently, implantation of these cells inexperimental animals will not reproduce the interactionbetween tumor and host that occurs in humans. Tumorheterogeneity introduces a further difficulty in the
identification of the best-fit mouse models for humancancers.
Metastases of tumor cells of various origins to thebrain are frequent (Reilly and Jacks, 2001; Kirsch andLoeffler, 2004; Becher et al., 2006). To find out whetherCT-2A cells may provide a valid model for brainmetastasis, these cells were injected in the internalcarotid artery and metastatic tumor growths were foundin the brain parenchyma, ipsilateral to the injection site.This demonstrates also that the progression of the tumoroccurs independently of the lesion caused by the needleduring the injection protocol. Additionally, CT-2A cellsre-isolated from experimental CT-2A tumors, and laterinjected into the CP, generated new tumors identical tothe original tumor. Together, these data provide directevidence that experimental CT-2A tumors containcancerous initiating cells. These cells have potent in vivoself-renewal and proliferative capacities, generatingtumors that are a phenocopy of the primary experimentaltumor. These facts suggest the existence of tumor stemcells among the CT-2A cells but a formal identificationof these stem cells should be carried out. In humanGBM, CD133+ cells have been identified and proposedas potential tumor stem cells (Singh et al., 2004).
Injection of CT-2A cells in mouse strains other thanC57BL/6J did not produce any tumor growth, even 3months after implantation. CT-2A cells were generatedin C57BL/6J mice (Zimmerman and Arnold, 1941) and,obviously, are able to escape the immune surveillance inthis strain but not in others.
To further characterize the phenotype of the CT-2Ainduced tumors, detailed immunohistochemical analyseswere performed. Immunohistochemical examinationshowed strong positivity for GFAP, the different NOSisoforms, nitrotyrosine, AM, Sox9, and Sox10.
The observation of endogenous GFAP in tumor cellscorrelates well with previous descriptions that tumorcells in human astrocytomas express GFAP (Schiffer etal., 1986; Sembritzki et al., 2002). The morphology ofthe GFAP-positive cells inside the tumor is clearlyneoplastic and rather different from normal astrocytes inthe undisturbed parenchyma, indicating that they werederived from the CT-2A cells and were not trappednormal astrocytes, which seem to be utterly destroyed bythe tumor as happens with the neurons.
Both in normal and pathological situations, NOplays various functions in the CNS includingvasodilatation, neurotransmission, neural plasticity,neurotoxicity, and oxidative stress (Rodrigo et al., 2005).Malignant brain neoplasms express high levels of NOSsuggesting that NO production may be associated withpathophysiological processes essential to these tumors(Broholm et al., 2003). Although the biological role ofNO in malignancies is still poorly understood, recentinvestigations suggest that it may have a dual pro- andanti-tumor action. While NO can inhibit cell growth andinitiate a free radical injury to normal and tumor cellsleading to apoptosis and necrosis (Tews, 1999), it canstimulate cell growth, dilate the vessels surrounding the
1321Brain tumor model

tumor thereby ensuring supply, and induce tumorangiogenesis (Lam-Himlin et al., 2006). It has also beenproposed that NO might stimulate tumor growth andmetastasis by promoting migration, invasion, andangiogenesis (Pan et al., 2005). NO production in theendothelium of the intratumoral blood vessels has beenassociated with blood flow regulation of the tumor andas a possible cause of brain edema (Broholm et al.,2003). Overexpression of eNOS in astrocytoma plays acrucial role in tumor angiogenesis (Pan et al., 2005).Taken together, these findings suggest that modulation ofNO production may provide a new therapeutic approachfor brain cancers (Morbidelli et al., 2004; Pan et al.,2005; Lam-Himlin et al., 2006).
We found that cancer cells characteristically did notexpress nNOS and, in fact, the lack of nNOSimmunoreactivity perfectly demarcated the tumorboundaries. A small number of nNOS immunoreactiveneurons were detected in the periphery of tumorsurrounded by tumor cells. These cells were swollen andexhibited processes with abnormal dilatations in theircourse, suggesting advanced neurodegeneration. It iswell known that excessive NO generation during stroke,ischemia, and neurodegenerative diseases contributes toneuronal cell death (Coyle and Puttfarcken, 1993;Dawson and Dawson, 1996). In clear contrast,expression of iNOS was only found in the tumor and notin the surrounding parenchyma. Our results correlatewith previous findings in humans showing expression ofiNOS immunoreactivity only in proliferative tumor cells(Kao et al., 2003). We also found a strong staining foreNOS in both tumor cells and blood vessels, whereasonly a faint immunoreaction was seen in normal vesselsin unaffected areas. This has also been found in humanGBM (Pan et al., 2005). Since progressive tumor growthis dependent on angiogenesis, the strong expression ofeNOS immunoreactivity within the tumor suggests thatthe angiogenic switch has been pushed towards activeangiogenesis promotion. The intense staining for iNOSand eNOS inside the tumor suggests that excessive NOmay be produced at the tumor site. This is also supportedby the presence of nitrated proteins as shown bynitrotyrosine immunoreactivity. This excessiveproduction of NO may be responsible for the destructionof the brain parenchyma.
AM is a multifunctional regulatory peptide (Lopezand Martinez, 2002) that operates as a growth factor fortumor cells, reduces apoptosis, augments tumor cellmotility, and increases angiogenesis (Martinez et al.,2002). In the CNS, AM is produced by a variety of cells,including neurons and astrocytes (Serrano et al., 2000).The expression of AM peptide and its receptor in humangliomas has been previously reported (Benes et al.,2004; Mennel et al., 2006). Our identification of asubpopulation of CT-2A tumor cells exhibiting AMimmunoreactivity correlates well with these previousfindings and supports previous studies that AM mayfunction as an autocrine growth factor for glioblastomacells (Ouafik et al., 2002; Boudouresque et al., 2005).
AM is highly induced in vitro by hypoxia in humanT98G glioblastoma cells (Kitamuro et al., 2000) througha HIF-1 mediated mechanism (Garayoa et al., 2000). Ithas been demonstrated that the use of specific antibodiesagainst AM consistently reduces the growth ofestablished glioblastoma xenografts throughangiogenesis supression (Ouafik et al., 2002). Followingthis line of research, we have proceeded to evaluate invivo the action of the antiangiogenic small molecule77427 (Martinez et al., 2005; Martinez, 2006) in CT-2Atumor growth. The results of this experiment are stillvery preliminary but they show a reduction of the tumorvolume over time. Since 77427 was appliedsystemically, our preliminary results indicate either that77427 can cross the blood-brain barrier or that the tumorvasculature allows the extravasation of this smallmolecule. In either case, 77427 may constitute apromising new drug for the treatment of brain cancers.
Sox (Sry-type HMG box) genes constitute a largefamily of transcription factors that play critical roles ingene regulation during embryogenesis (Wegner, 2001).These proteins belong to the High Mobility Group(HMG) superfamily, which is well conserved acrossspecies. Neural crest development is regulated by thetranscription factor Sox9 (Cheung and Briscoe, 2003)which is strongly expressed first in neural stem cells andthen in glial cells of the CNS, which suggests Sox9 as acomponent of the mechanism that causes neural stemcells to switch from neurogenesis to gliogenesis (Stolt etal., 2003). Levels of HMG protein expression have beencorrelated with tumor progression, with malignant cellsexpressing high levels and benign tumor cells or normalcells in adult tissues exhibiting little or no expression ofSox9 (Wunderlich and Bottger, 1997). It has beensuggested that Sox9 suppresses apoptosis (Akiyama etal., 2002), and this protein has been proposed as a novelcandidate marker of stem cells (Sottile et al., 2006) and apotential genetic marker for cancer (Dong et al., 2004).In the CNS, Sox10 transcripts were originally thought tobe confined to glial precursors but later were detected inoligodendrocytes of the adult brain, being consideredone of the main determinants of oligodendroglialdifferentiation (Stolt et al., 2002). Although a highnumber of astrocytomas express Sox10 (Bannykh et al.,2006), such expression occurs at lower levels. Inconnection with these reports, our findings demonstratedSox9 immunostaining in a large number of tumor cells,but only a few cells expressed Sox10 immunoreactivity.This observation suggests that experimental CT-2Atumors might contain at least two chemically, andperhaps functionally, distinct cell subpopulations.However, the fact that tumor cells may modify antigenicexpressions during cell cycle should be taken intoaccount. Interestingly, we observed that not every GFAPpositive tumor cell expressed Sox9. This findingcorrelates with the fact that in adult rodent brain Sox9immunoreactivity colocalizes only partially (40%) withastrocytes (Pompolo and Harley, 2001). The observationof intense nuclear staining for Sox9 in our experimental
1322Brain tumor model

tumor cells coincides with the same observation in highgrade tumors in humans (Dong et al., 2004; Bannykh etal., 2006; Kordes and Hagel, 2006). The results of thisstudy reinforce the connection between Sox geneexpression and astrocytic tumors.
Tumor angiogenesis was evaluated in the CT-2Aexperimental model both histologically and by contrastenhanced MRI with gadolinium. Imaging plays a majorrole in current cancer detection and treatment.Monitoring techniques such as in vivo MRI allow forevaluation studies of the validity of the model employed,providing quantitative aspects of tumor biology, such asgrowth kinetics, vascularity, and cellularity. StandardT1- and T2-weighted MRI identify brain tumors withhigh sensitivity. As in humans, the use of contrast-enhanced MRI in mice with brain tumors provided invivo anatomical information on the cerebral tumor as toits precise localization and extent. Besides primaryinformation on the size and localization of the tumor,MRI also provides information on secondary phenomenasuch as mass effect, edema, hemorrhage, necrosis, andsigns of increased intracranial pressure at high spatialresolution and with high tissue contrast (Koutcher et al.,2002).
Although MRI can be very helpful for identifyingpathologic abnormalities, it has limitations whenevaluating gliomas (Floeth and Stummer, 2005; Dyke etal., 2007) and histologic confirmation is necessary toestablish an accurate diagnosis. Normally, higher-gradetumors frequently show enhancement on MRI, butenhancement does not always equate with histologictumor grade. The HR-MAS 1H NMR application isactually extensively applied to human tissues because itcorrelates more closely with histologic findings andprovides a powerful tool for assessing tumor presenceand extent (Balmaceda et al., 2006; Hollingworth et al.,2006; Omuro et al., 2006). Metabolite levels measuredwith HR-MAS 1H NMR can be consistently correlatedwith tumor types and grades and the monitoring ofprogression of pathology in human brain (Li et al., 2004;Dyke et al., 2007). In our study, HR-MAS 1H NMRspectroscopy revealed distinct differences in themetabolic tissue profile in CT-2A tumors compared withnormal contralateral parenchyma. These changes, whichshowed a close relationship with previous findings inhuman GBM (Li et al., 2004; Oh et al., 2004; Balmacedaet al., 2006; Dyke et al., 2007), included a predominantsignal at 3.2 ppm and 3.22 ppm, attributed to Cho-containing compounds, associated with low intensitypeaks at 3.04 ppm, attributable to Cr derivatives. Humanrapidly growing neoplasms show the common feature ofan increased Cho/Cr ratio, a decreased NAA/Cr ratio,and an increased Lac/ Cr level (Li et al., 2004; Dyke etal., 2007). The high Cho-containing compounds/Cr ratiofound has been linked with synthesis of new cellmembranes and increased membrane turnover andhigher cellular density (Floeth and Stummer, 2005;Tugnoli et al., 2005). Interestingly, it has also beenproved that human pathological samples with increased
Lac/Cr ratio exhibited characteristic features of necrosis(Son et al., 2001). The presence of elevated Cho anddecreased Ace has been found to correlate with tumorhistologic findings and may be used in distinguishingregions of possible cancer from normal and othernoncancerous tissue, including necrosis and astrogliosis(Dowling et al., 2001). Higher levels of Lac have beenattributed to hypoxia and the grade of malignancy of thetumor and are usually detected in GBM (Castillo et al.,1996; Dyke et al., 2007). Elevated Lac levels in CT-2Atumor probably imply greater glucose and glycogenlevels in this region. Low signal at 2.02 attributable toNAA was observed in CT-2A tumors, suggesting that adecrease in brain NAA concentrations correlates directlywith histopathological evidence of neuronal loss in CT-2A tumor as previously reported (Cheng et al., 1997).High signals at 3.63 ppm (Myo), 3.56 ppm (Gly) and3.26-3.42 ppm (Tau) were observed in CT-2A tumors.The elevation of Myo and Tau is related to thehypothesis that Myo is a glial marker and that Tau issynthesized from cysteine by astrocytes but not byprimary neurons (Brand et al., 1993). Both in vivo and invitro NMR spectroscopy studies demonstrated that Myo,Gly, and Tau concentrations were correlated with celldensity in tumors. The quantification of tumor metabolicchanges with HR-MAS, in conjunction with subsequenthistopathology of the same tumor specimen, has thepotential to further our knowledge on the biochemistryof CT-2A tumor heterogeneity during progression, andultimately to improve our accuracy in diagnosing,characterizing, and evaluating tumor progression forpreclinical trials.
In summary, orthotopic tumors produced by theinjection of CT-2A cells in the CP of C57BL/6J miceclosely resemble human GBM tumors and may be agood model for preclinical trials of novel anticancerdrugs for CNS malignancies.Acknowledgements: This study was supported by grants from theSpanish Ministry for Science and Education, BFU2004/02838, andSAF2005/02608, and the CSIC/Community of Madrid, 200620M001. Wegratefully acknowledge Prof. T.N. Seyfried (Biology Department, BostonCollege, MA) for the gift of the CT-2A cells and Prof. Michael Wegner(Institut fur Biochimie, Universitat Erlangen-Nuremberg, Germany) forthe Sox9 and Sox10 antibodies. We are very grateful for the excellenttechnical assistance of Ms. Africa Sandonis.
References
Abate L.E., Mukherjee P. and Seyfried T.N. (2006). Gene-linked shift inganglioside distribution influences growth and vascularity in a mouseastrocytoma. J. Neurochem. 98, 1973-1984.
Akiyama H., Chaboissier M.C., Martin J.F., Schedl A. and deCrombrugghe B. (2002). The transcription factor Sox9 has essentialroles in successive steps of the chondrocyte differentiation pathwayand is required for expression of Sox5 and Sox6. Genes Dev. 16,2813-2828.
Balmaceda C., Critchell D., Mao X., Cheung K., Pannullo S., DeLaPaz
1323Brain tumor model

R.L. and Shungu D.C. (2006). Multisection 1H magnetic resonancespectroscopic imaging assessment of gl ioma response tochemotherapy. J. Neurooncol. 76, 185-191.
Bannykh S.I., Stolt C.C., Kim J., Perry A. and Wegner M. (2006).Oligodendroglial-specific transcriptional factor SOX10 is ubiquitouslyexpressed in human gliomas. J. Neurooncol. 76, 115-127.
Becher M.W., Abel T.W., Thompson R.C., Weaver K.D., and Davis L.E.(2006). Immunohistochemical analysis of metastatic neoplasms ofthe central nervous system. J. Neuropathol. Exp. Neurol. 65, 935-944.
Benes L., Kappus C., McGregor G.P., Bertalanffy H., Mennel H.D. andHagner S. (2004). The immunohistochemical expression ofcalcitonin receptor-like receptor (CRLR) in human gliomas. J. Clin.Pathol. 57, 172-176.
Bock N.A., Zadeh G., Davidson L.M., Qian B., Sled J.G., Guha A. andHenkelman R.M. (2003). High-resolution longitudinal screening withmagnetic resonance imaging in a murine brain cancer model.Neoplasia 5, 546-554.
Boudouresque F., Berthois Y., Martin P.M., Figarella-Branger D., ChinotO. and Ouafik L. (2005). [Role of adrenomedullin in glioblastomasgrowth]. Bull. Cancer 92, 317-326.
Brand A., Richter-Landsberg C., and Leibfritz D. (1993). MultinuclearNMR studies on the energy metabolism of glial and neuronal cells.Dev. Neurosci. 15, 289-298.
Broholm H., Rubin I., Kruse A., Braendstrup O., Schmidt K., Skriver E.B.and Lauritzen M. (2003). Nitric oxide synthase expression andenzymatic activity in human brain tumors. Clin. Neuropathol. 22,273-281.
Brown J.M. and Wilson W.R. (2004). Exploiting tumour hypoxia incancer treatment. Nat. Rev. Cancer 4, 437-447.
Castillo M., Kwock L. and Mukherji S.K. (1996). Clinical applications ofproton MR spectroscopy. AJNR Am. J. Neuroradiol. 17, 1-15.
CBTRUS (2005). Statistical report: Primary brain tumors in the UnitedStates, 1998-2002. Published by the Central Brain Tumor Registryof the United States.
Cheng L.L., Chang I.W., Louis D.N. and Gonzalez R.G. (1998).Correlation of high-resolution magic angle spinning proton magneticresonance spectroscopy with histopathology of intact human braintumor specimens. Cancer Res. 58, 1825-1832.
Cheng L.L., Ma M.J., Becerra L., Ptak T., Tracey I., Lackner A. andGonzalez R.G. (1997). Quantitative neuropathology by highresolution magic angle spinning proton magnetic resonancespectroscopy. Proc. Natl. Acad. Sci. USA 94, 6408-6413.
Cheung M. and Briscoe J. (2003). Neural crest development isregulated by the transcription factor Sox9. Development 130, 5681-5693.
Coyle J.T. and Puttfarcken P. (1993). Oxidative stress, glutamate, andneurodegenerative disorders. Science 262, 689-695.
Dawson V.L. and Dawson T.M. (1996). Nitric oxide neurotoxicity. J.Chem. Neuroanat. 10, 179-190.
DeAngelis L.M. (2001). Brain tumors. N. Engl. J. Med. 344, 114-123.Deorah S., Lynch C.F., Sibenaller Z.A. and Ryken T.C. (2006). Trends
in brain cancer incidence and survival in the United States:Surveillance, Epidemiology, and End Results Program, 1973 to2001. Neurosurg. Focus. 20, E1.
Ding H., Roncari L., Shannon P., Wu X., Lau N., Karaskova J., GutmannD.H., Squire J.A., Nagy A. and Guha A. (2001). Astrocyte-specificexpression of activated p21-ras results in malignant astrocytomaformation in a transgenic mouse model of human gliomas. Cancer
Res. 61, 3826-3836.Dong C., Wilhelm D. and Koopman P. (2004). Sox genes and cancer.
Cytogenet. Genome Res. 105, 442-447.Dowling C., Bollen A.W., Noworolski S.M., McDermott M.W., Barbaro
N.M., Day M.R., Henry R.G., Chang S.M., Dillon W.P., Nelson S.J.and Vigneron D.B. (2001). Preoperative proton MR spectroscopicimaging of brain tumors: correlation with histopathologic analysis ofresection specimens. AJNR Am. J. Neuroradiol. 22, 604-612.
Dvorak H.F., Nagy J.A., Feng D., Brown L.F. and Dvorak A.M. (1999).Vascular permeability factor/vascular endothelial growth factor andthe significance of microvascular hyperpermeability in angiogenesis.Curr. Top. Microbiol. Immunol. 237, 97-132.
Dyke J.P., Sanelli P.C., Voss H.U., Serventi J.V., Stieg P.E., SchwartzT.H., Ballon D., Shungu D.C. and Pannullo S.C. (2007). Monitoringthe effects of BCNU chemotherapy Wafers (Gliadel((R))) inglioblastoma multiforme with proton magnetic resonancespectroscopic imaging at 3.0 Tesla. J. Neurooncol. 82, 103-110.
Encinas J.M., Serrano J., Bentura M.L., Castro-Blanco S., FernandezA.P. and Rodrigo J. (2003). Nitric oxide system and protein nitrationare modified by an acute hypobaric hypoxia in the adult rathippocampus. J. Neuropathol. Exp. Neurol. 62, 863-877.
Fan X., Salford L.G., and Widegren B. (2006). Glioma stem cells:Evidence and limitation. Semin. Cancer Biol. 17, 214-218.
Fischer I., Gagner J.P., Law M., Newcomb E.W. and Zagzag D. (2005).Angiogenesis in gliomas: biology and molecular pathophysiology.Brain Pathol. 15, 297-310.
Floeth F.W. and Stummer W. (2005). The value of metabolic imaging indiagnosis and resection of cerebral gliomas. Nat. Clin. Pract. Neurol.1, 62-63.
Folkman J. (1971). Tumor angiogenesis: therapeutic implications. N.Engl. J. Med. 285, 1182-1186.
Folkman J. (1992). The role of angiogenesis in tumor growth. Semin.Cancer Biol. 3, 65-71.
Garayoa M., Martinez A., Lee S., Pio R., An W.G., Neckers L., Trepel J.,Montuenga L.M., Ryan H., Johnson R., Gassmann M. and Cuttitta F.(2000). Hypoxia-inducible factor-1 (HIF-1) up-regulatesadrenomedullin expression in human tumor cell lines during oxygendeprivation: a possible promotion mechanism of carcinogenesis.Mol. Endocrinol. 14, 848-862.
Gasparini G., Longo R., Toi M. and Ferrara N. (2005). Angiogenicinhibitors: a new therapeutic strategy in oncology. Nat. Clin. Pract.Oncol. 2, 562-577.
Hanahan D. and Folkman J. (1996). Patterns and emergingmechanisms of the angiogenic switch during tumorigenesis. Cell 86,353-364.
Hollingworth W., Medina L.S., Lenkinski R.E., Shibata D.K., Bernal B.,Zurakowski D., Comstock B. and Jarvik J.G. (2006). A systematicliterature review of magnetic resonance spectroscopy for thecharacterization of brain tumors. AJNR Am. J. Neuroradiol. 27,1404-1411.
Holmgren L., O'Reilly M.S., and Folkman J. (1995). Dormancy ofmicrometastases: balanced proliferation and apoptosis in thepresence of angiogenesis suppression. Nat. Med. 1, 149-153.
Hsu S.M., Raine L. and Fanger H. (1981). Use of avidin-biotin-peroxidase complex (ABC) in immunoperoxidase techniques: acomparison between ABC and unlabeled antibody (PAP)procedures. J. Histochem. Cytochem. 29, 577-580.
Hu X. and Holland E.C. (2005). Applications of mouse glioma models inpreclinical trials. Mutat. Res. 576, 54-65.
1324Brain tumor model

Jain R.K. (2003). Molecular regulation of vessel maturation. Nat. Med. 9,685-693.
Jung C.R., Hwang K.S., Yoo J., Cho W.K., Kim J.M., Kim W.H., and ImD.S. (2006). E2-EPF UCP targets pVHL for degradation andassociates with tumor growth and metastasis. Nat. Med. 12, 809-816.
Kaiser J. (1999). No meeting of minds on childhood cancer. Science286, 1832-1834.
Kalluri R. and Zeisberg M. (2006). Fibroblasts in cancer. Nat. Rev.Cancer 6, 392-401.
Kang S.H., Cho H.T., Devi S., Zhang Z., Escuin D., Liang Z., Mao H.,Brat D.J., Olson J.J., Simons J.W., Lavallee T.M., Giannakakou P.,Van Meir E.G. and Shim H. (2006). Antitumor effect of 2-methoxyestradiol in a rat orthotopic brain tumor model. Cancer Res.66, 11991-11997.
Kao C.L., Chiou S.H., Chen H.S., Ho D.M., Chen C.F., Ho L.L., Lee M.J.and Wong T.T. (2003). Elevated nitric oxide levels in childhood braintumors. Childs Nerv. Syst. 19, 744-749.
Kaur B., Tan C., Brat D.J., Post D.E. and Van Meir E.G. (2004). Geneticand hypoxic regulation of angiogenesis in gliomas. J. Neurooncol.70, 229-243.
Khain E. and Sander L.M. (2006). Dynamics and pattern formation ininvasive tumor growth. Phys. Rev. Lett. 96, 188103.
King G.D., Curtin J.F., Candolfi M., Kroeger K., Lowenstein P.R. andCastro M.G. (2005). Gene therapy and targeted toxins for glioma.Curr. Gene Ther. 5, 535-557.
Kirsch D.G. and Loeffler J.S. (2004). Treating brain metastases: currentapproaches and future directions. Expert. Rev. Neurother. 4, 1015-1022.
Kitamuro T., Takahashi K., Nakayama M., Murakami O., Hida W.,Shirato K. and Shibahara S. (2000). Induction of adrenomedullinduring hypoxia in cultured human glioblastoma cells. J. Neurochem.75, 1826-1833.
Kleihues P., Louis D.N., Scheithauer B.W., Rorke L.B., Reifenberger G.,Burger P.C. and Cavenee W.K. (2002). The WHO classification oftumors of the nervous system. J. Neuropathol. Exp. Neurol. 61, 215-225.
Kleihues P. and Ohgaki H. (1997). Genetics of glioma progression andthe definition of primary and secondary glioblastoma. Brain Pathol.7, 1131-1136.
Konno T., Ohtsuka N., Yamasaki K., Mizutani J., Miyauchi Y., Maeda H.and Matsumura Y. (1986). [Targeting of anticancer chemotherapyutilizing the characteristic nature of the neovasculature of solidtumors]. Gan To Kagaku Ryoho. 13, 1448-1455.
Kordes U. and Hagel C. (2006). Expression of SOX9 and SOX10 incentral neuroepithelial tumor: Hamburg, 07.04.2006. J. Neurooncol.80, 151-155.
Koutcher J.A., Hu X., Xu S., Gade T.P., Leeds N., Zhou X.J., Zagzag D.and Holland E.C. (2002). MRI of mouse models for gliomas showssimilarities to humans and can be used to identify mice for preclinicaltrials. Neoplasia 4, 480-485.
Lam-Himlin D., Espey M.G., Perry G., Smith M.A. and Castellani R.J.(2006). Malignant glioma progression and nitric oxide. Neurochem.Int. 49, 764-768.
Lee J., Kotliarova S., Kotliarov Y., Li A., Su Q., Donin N.M., PastorinoS., Purow B.W., Christopher N., Zhang W., Park J.K. and Fine H.A.(2006). Tumor stem cells derived from glioblastomas cultured inbFGF and EGF more closely mirror the phenotype and genotype ofprimary tumors than do serum-cultured cell lines. Cancer Cell 9,
391-403.Li X., Jin H., Lu Y., Oh J., Chang S. and Nelson S.J. (2004).
Identification of MRI and 1H MRSI parameters that may predictsurvival for patients with malignant gliomas. NMR Biomed. 17, 10-20.
Lopez J. and Martinez A. (2002). Cell and molecular biology of themultifunctional peptide, adrenomedullin. Int. Rev. Cytol. 221, 1-92.
Maka M., Stolt C.C. and Wegner M. (2005). Identification of Sox8 as amodifier gene in a mouse model of Hirschsprung disease revealsunderlying molecular defect. Dev. Biol. 277, 155-169.
Martinez A. (2006). A new family of angiogenic factors. Cancer Lett.236, 157-163.
Martinez A., Miller M.J., Unsworth E.J., Siegfried J.M. and Cuttitta F.(1995). Expression of adrenomedullin in normal human lung and inpulmonary tumors. Endocrinology 136, 4099-4105.
Martinez A., Vos M., Guedez L., Kaur G., Chen Z., Garayoa M., Pio R.,Moody T., Stetler-Stevenson W.G., Kleinman H.K. and Cuttitta F.(2002). The effects of adrenomedullin overexpression in breasttumor cells. J. Natl. Cancer Inst. 94, 1226-1237.
Martinez A., Zudaire E., Julian M., Moody T.W. and Cuttitta F. (2005).Gastrin-releasing peptide (GRP) induces angiogenesis and thespecific GRP blocker 77427 inhibits tumor growth in vitro and in vivo.Oncogene 24, 4106-4113.
McKinley B.P., Michalek A.M., Fenstermaker R.A. and Plunkett R.J.(2000). The impact of age and sex on the incidence of glial tumors inNew York state from 1976 to 1995. J. Neurosurg. 93, 932-939.
Mennel H.D., Hallier-Neelsen M., Hagner S. and Benes L. (2006). Twonovel cell specific receptor proteins, CRLR and CD 117 in humanglial tumors. Clin. Neuropathol. 25, 107-114.
Morbidelli L., Donnini S. and Ziche M. (2004). Role of nitric oxide intumor angiogenesis. Cancer Treat. Res. 117, 155-167.
Mukherjee P., Abate L.E. and Seyfried T.N. (2004). Antiangiogenic andproapoptotic effects of dietary restriction on experimental mouse andhuman brain tumors. Clin. Cancer Res. 10, 5622-5629.
Mukherjee P., El-Abbadi M.M., Kasperzyk J.L., Ranes M.K. andSeyfried T.N. (2002). Dietary restriction reduces angiogenesis andgrowth in an orthotopic mouse brain tumour model. Br. J. Cancer 86,1615-1621.
Oh J., Henry R.G., Pirzkall A., Lu Y., Li X., Catalaa I., Chang S., DillonW.P. and Nelson S.J. (2004). Survival analysis in patients withglioblastoma multiforme: predictive value of choline-to-N-acetylaspartate index, apparent diffusion coefficient, and relativecerebral blood volume. J. Magn Reson. Imaging 19, 546-554.
Omuro A.M., Leite C.C., Mokhtari K. and Delattre J.Y. (2006). Pitfalls inthe diagnosis of brain tumours. Lancet Neurol. 5, 937-948.
Ouafik L., Sauze S., Boudouresque F., Chinot O., Delfino C., Fina F.,Vuaroqueaux V., Dussert C., Palmari J., Dufour H., Grisoli F.,Casellas P., Brunner N. and Martin P.M. (2002). Neutralization ofadrenomedullin inhibits the growth of human glioblastoma cell linesin vitro and suppresses tumor xenograft growth in vivo. Am. J.Pathol. 160, 1279-1292.
Pan J.W., Zhan R.Y., Tong Y., Zhou Y.Q. and Zhang M. (2005).Expression of endothelial nitric oxide synthase and vascularendothelial growth factor in association with neovascularization inhuman primary astrocytoma. J. Zhejiang. Univ. Sci. B. 6, 693-698.
Patel N.S., Li J.L., Generali D., Poulsom R., Cranston D.W. and HarrisA.L. (2005). Up-regulation of delta-like 4 ligand in human tumorvasculature and the role of basal expression in endothelial cellfunction. Cancer Res. 65, 8690-8697.
1325Brain tumor model
Peterson D.L., Sheridan P.J. and Brown W.E. Jr (1994). Animal modelsfor brain tumors: historical perspectives and future directions. J.Neurosurg. 80, 865-876.
Pompolo S. and Harley V.R. (2001). Localisation of the SRY-relatedHMG box protein, SOX9, in rodent brain. Brain Res. 906, 143-148.
Reilly K.M. and Jacks T. (2001). Genetically engineered mouse modelsof astrocytoma: GEMs in the rough? Semin. Cancer Biol. 11, 177-191.
Rodrigo J., Springall D.R., Uttenthal O., Bentura M.L., Abadia-Molina F.,Riveros-Moreno V., Martinez-Murillo R., Polak J.M. and Moncada S.(1994). Localization of nitric oxide synthase in the adult rat brain.Philos. Trans. R. Soc. Lond B Biol. Sci. 345, 175-221.
Rodrigo J., Fernandez A.P., Serrano J., Peinado M.A., and Martinez A.(2005). The role of free radicals in cerebral hypoxia and ischemia.Free Radic. Biol. Med. 39, 26-50.
Rong Y., Durden D.L., Van Meir E.G. and Brat D.J. (2006).'Pseudopalisading' necrosis in glioblastoma: a familiar morphologicfeature that links vascular pathology, hypoxia, and angiogenesis. J.Neuropathol. Exp. Neurol. 65, 529-539.
Schiffer D., Giordana M.T., Germano I. and Mauro A. (1986). Anaplasiaand heterogeneity of GFAP expression in gliomas. Tumori 72, 163-170.
Sembritzki O., Hagel C., Lamszus K., Deppert W. and Bohn W. (2002).Cytoplasmic localization of wild-type p53 in glioblastomas correlateswith expression of vimentin and glial fibrillary acidic protein.Neurooncol. 4, 171-178.
Serrano J., Uttenthal L.O., Martinez A., Fernandez A.P., Martinez D.V.,Alonso D., Bentura M.L., Santacana M., Gallardo J.R., Martinez-Murillo R., Cuttitta F. and Rodrigo J. (2000). Distribution ofadrenomedullin-like immunoreactivity in the rat central nervoussystem by light and electron microscopy. Brain Res. 853, 245-268.
Seyfried T.N., el-Abbadi M. and Roy M.L. (1992). Gangliosidedistribution in murine neural tumors. Mol. Chem. Neuropathol. 17,147-167.
Singh S.K., Hawkins C., Clarke I.D., Squire J.A., Bayani J., Hide T.,Henkelman R.M., Cusimano M.D. and Dirks P.B. (2004).Identification of human brain tumour initiating cells. Nature 432, 396-401.
Son B.C., Kim M.C., Choi B.G., Kim E.N., Baik H.M., Choe B.Y., NaruseS. and Kang J.K. (2001). Proton magnetic resonance chemical shiftimaging (1H CSI)-directed stereotactic biopsy. Acta Neurochir.
(Wien.). 143, 45-49.Sottile V., Li M. and Scotting P.J. (2006). Stem cell marker expression in
the Bergmann glia population of the adult mouse brain. Brain Res.1099, 8-17.
Stolt C.C., Rehberg S., Ader M., Lommes P., Riethmacher D.,Schachner M., Bartsch U. and Wegner M. (2002). Terminaldifferentiation of myelin-forming oligodendrocytes depends on thetranscription factor Sox10. Genes Dev. 16, 165-170.
Stolt C.C., Lommes P., Sock E., Chaboissier M.C., Schedl A. andWegner M. (2003). The Sox9 transcription factor determines glialfate choice in the developing spinal cord. Genes Dev. 17, 1677-1689.
Terzis A.J., Niclou S.P., Rajcevic U., Danzeisen C. and Bjerkvig R.(2006). Cell therapies for glioblastoma. Expert. Opin. Biol. Ther. 6,739-749.
Tews D.S. (1999). Cell death and oxidative stress in gliomas.Neuropathol. Appl. Neurobiol. 25, 272-284.
Tsang T.M., Griffin J.L., Haselden J., Fish C. and Holmes E. (2005).Metabolic characterization of distinct neuroanatomical regions in ratsby magic angle spinning 1H nuclear magnetic resonancespectroscopy. Magn. Reson. Med. 53, 1018-1024.
Tugnoli V., Schenetti L., Mucci A., Nocetti L., Toraci C., Mavilla L.,Basso G., Rovati R., Tavani F., Zunarelli E., Righi V. and Tosi M.R.(2005). A comparison between in vivo and ex vivo HR-MAS 1H MRspectra of a pediatric posterior fossa lesion. Int. J. Mol. Med. 16,301-307.
Vescovi A.L., Galli R. and Reynolds B.A. (2006). Brain tumour stemcells. Nat. Rev. Cancer. 6, 425-436.
Wegner M. (2001). Expression of transcription factors duringoligodendroglial development. Microsc. Res. Tech. 52, 746-752.
Wesseling P., van der Laak J.A., Link M., Teepen H.L. and Ruiter D.J.(1998). Quantitative analysis of microvascular changes in diffuseastrocytic neoplasms with increasing grade of malignancy. Hum.Pathol. 29, 352-358.
Wunderlich V. and Bottger M. (1997). High-mobility-group proteins andcancer--an emerging link. J. Cancer Res. Clin. Oncol. 123, 133-140.
Yates A.J. (1992). An overview of principles for classifying brain tumors.Mol. Chem. Neuropathol. 17, 103-120.
Zimmerman H. and Arnold H. (1941). Experimental brain tumors. I.Tumors produced with methylcholantrene. Cancer Res. 1, 919-938.
Accepted May 23, 2007
1326Brain tumor model