standardisation of milk mir spectra, development of …¨s optimir... · 0 100 200 300 400 500-0.1...
TRANSCRIPT

Namur, 16/04/2015
Grelet C 1, Fernandez J.A 1, Dardenne P 1, Baeten V 1, Vanlierde A 1, Soyeurt H 2 , Darimont C 1 & Dehareng F 1
1 Walloon Agricultural Research Center (CRA-W), Gembloux, Belgique
2 University of Liège, Gembloux Agro-Bio Tech, Gembloux, Belgique [email protected]
Standardisation of milk MIR spectra,
Development of common MIR equations
0 50 100 150 200 250 300-0.04
-0.03
-0.02
-0.01
0
0.01
0.02
0.03
0.04
0 100 200 300 400 500
-0.1
0
0.1
0.2
0.3
0.4
0.5
Spectra after slave standardization
wavelength (cm-1)
A
0 100 200 300 400 500
-0.1
0
0.1
0.2
0.3
0.4
0.5
Spectra after slave standardization
wavelength (cm-1)
A
0 100 200 300 400 500
-0.1
0
0.1
0.2
0.3
0.4
0.5
Spectra after slave standardization
wavelength (cm-1)
A
0 100 200 300 400 500
-0.1
0
0.1
0.2
0.3
0.4
0.5
Spectra after slave standardization
wavelength (cm-1)
A
0 100 200 300 400 500
-0.1
0
0.1
0.2
0.3
0.4
0.5
Spectra after slave standardization
wavelength (cm-1)
A
0 100 200 300 400 500
-0.1
0
0.1
0.2
0.3
0.4
0.5
Spectra after slave standardization
wavelength (cm-1)
A
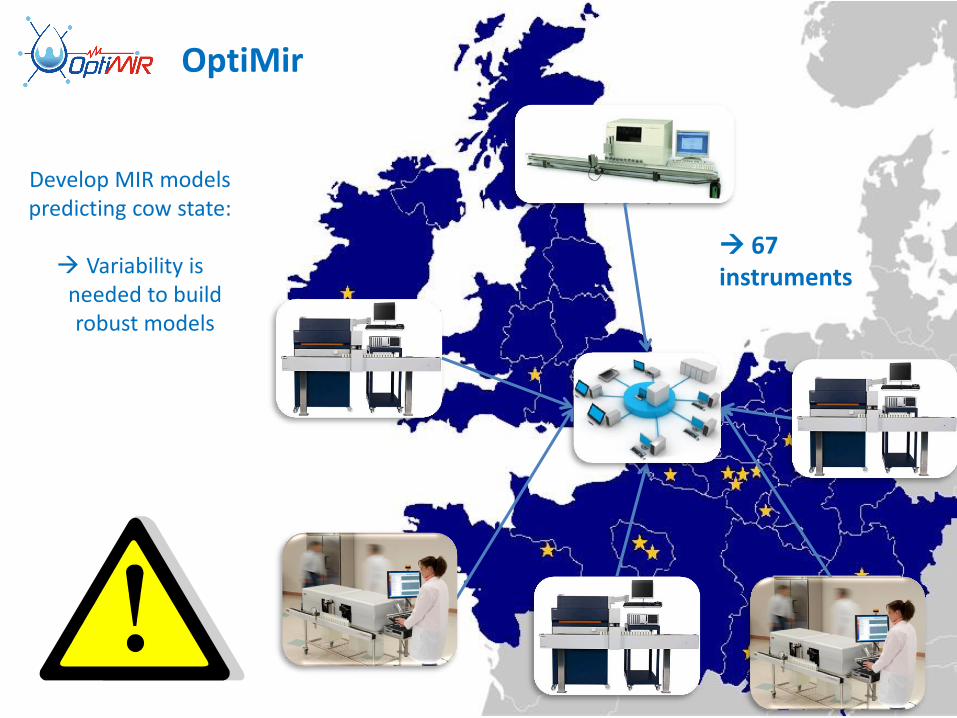
OptiMir
Develop MIR models predicting cow state:
Variability is
needed to build robust models
67 instruments
-0.015 -0.01 -0.005 0 0.005 0.01 0.015 0.02
-0.02
-0.015
-0.01
-0.005
0
0.005
0.01
0.015
Scores on PC 4 (0.01%)
Score
s o
n P
C 5
(0.0
1%
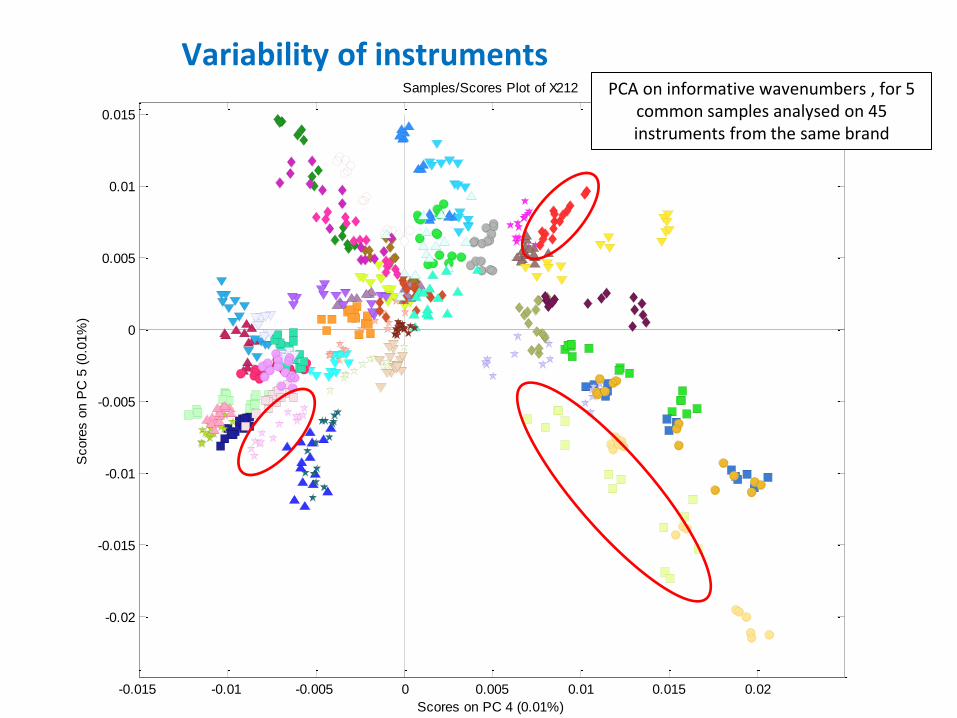
)Samples/Scores Plot of X212
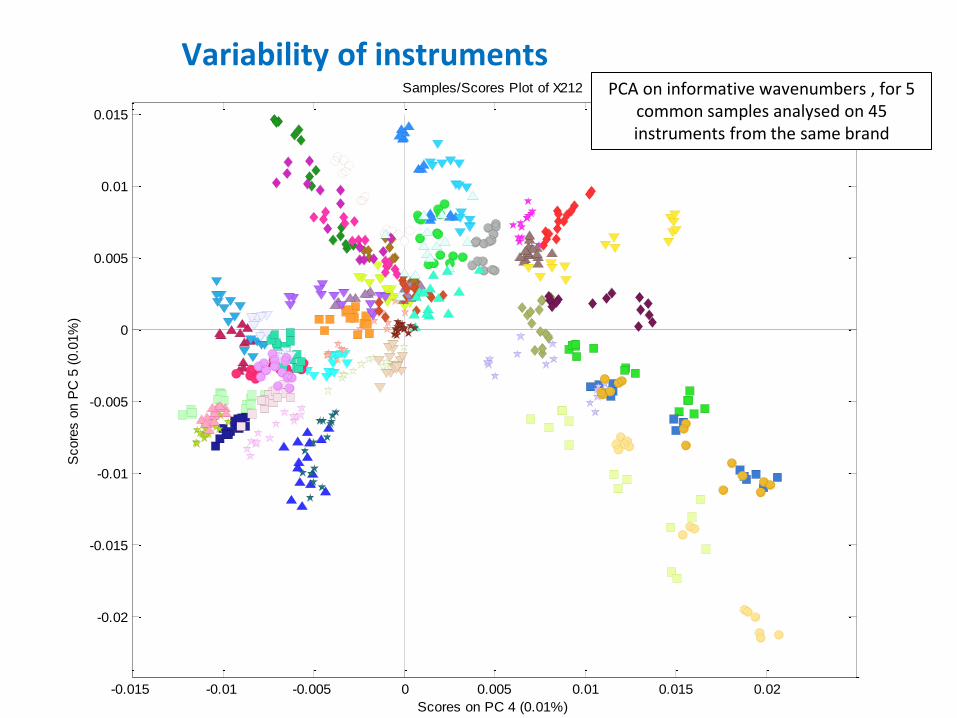
Variability of instruments PCA on informative wavenumbers , for 5
common samples analysed on 45 instruments from the same brand
1000 1200 1400 1600 1800 2000 2200 2400 2600 2800 3000-0.2
-0.1
0
0.1
0.2
0.3
0.4
Spectra after log
wavelength (cm-1)
A
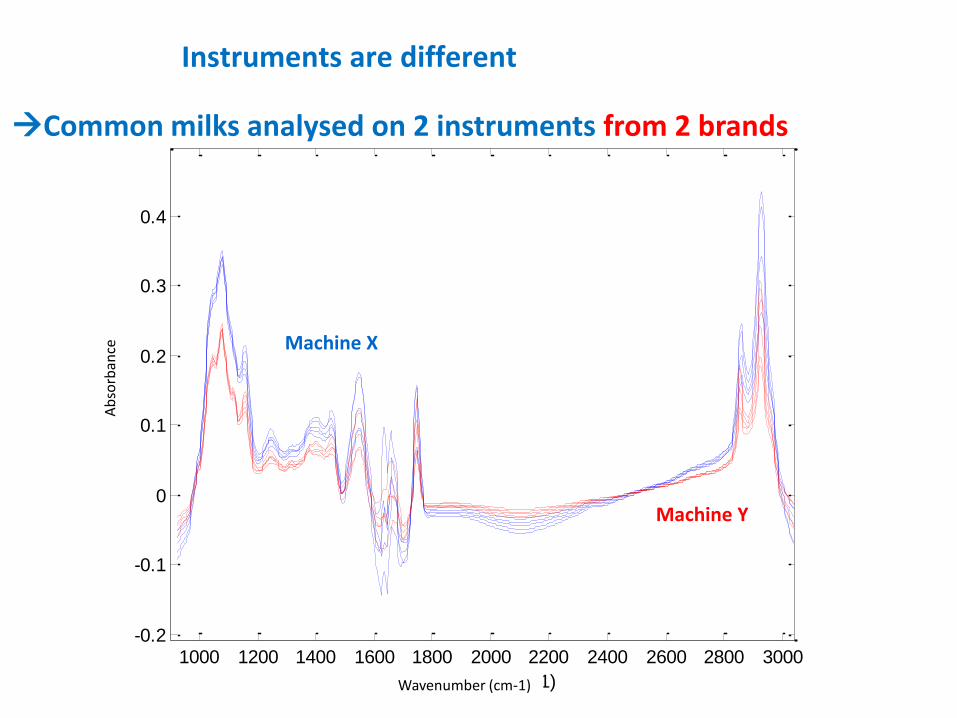
Machine Y
Machine X
Wavenumber (cm-1)
Ab
sorb
ance
Instruments are different
Common milks analysed on 2 instruments from 2 brands
0
100
200
300
400
500
600
700
800
900
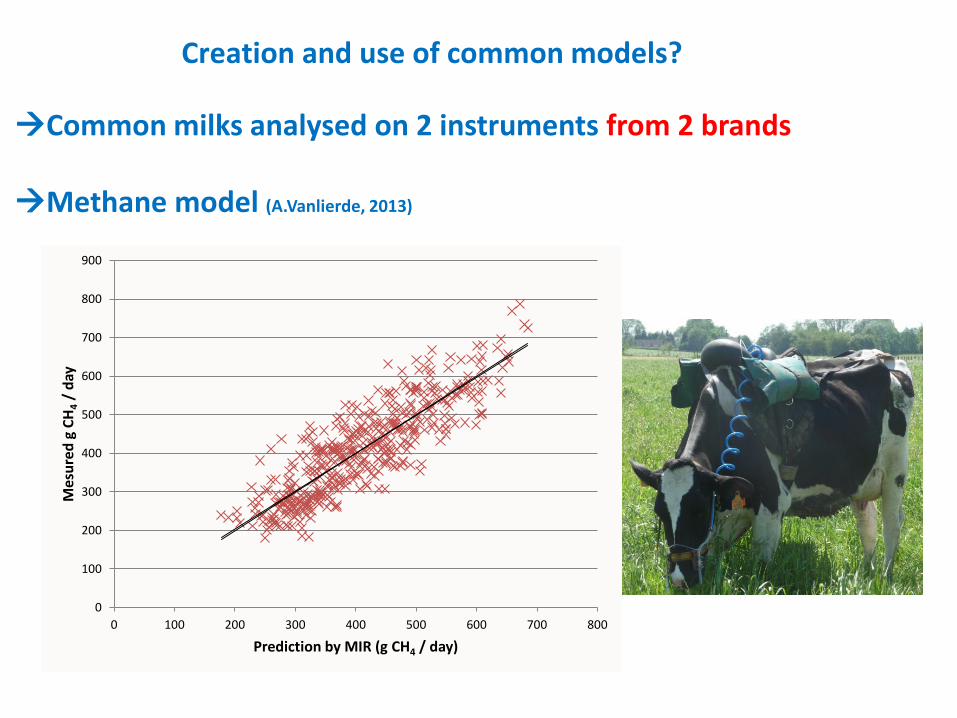
0 100 200 300 400 500 600 700 800
Mes
ure
d g
CH
4 /
day
Prediction by MIR (g CH4 / day)
Common milks analysed on 2 instruments from 2 brands Methane model (A.Vanlierde, 2013)
Creation and use of common models?

N= 5y= 590.7677+0.074968xR square= 0.0181biais= -766.7733RMSE= 778.462
-400 -200 0 200 400 600 800480
500
520
540
560
580
600
620
640
660
680CH4 (g/day) predictions without standardisation, Master vs BEL0201
Slave predictions
Maste
r pre
dic
tions
Common milks analysed on 2 instruments from 2 brands Methane model
Creation and use of common models?
Machine X : 670 g CH4/day
Machine Y : -230 g CH4/day
Predictions Instrument Y (g CH4/j)
Pre
dic
tio
ns
inst
rum
en
t X
(g
CH
4/j
)
Not possible to use a common model on 2
instruments from 2 brands
N= 5y= -5.90+1.84xRMSE= 200.53
150 200 250 300 350 400 450 500 550 600300
350
400
450
500
550
600CH4 Master vs. CH4 Slave
Slave CH4 predictions (g CH4/day)
Maste
r C
H4 p
redic
tions (
g C
H4/d
ay)
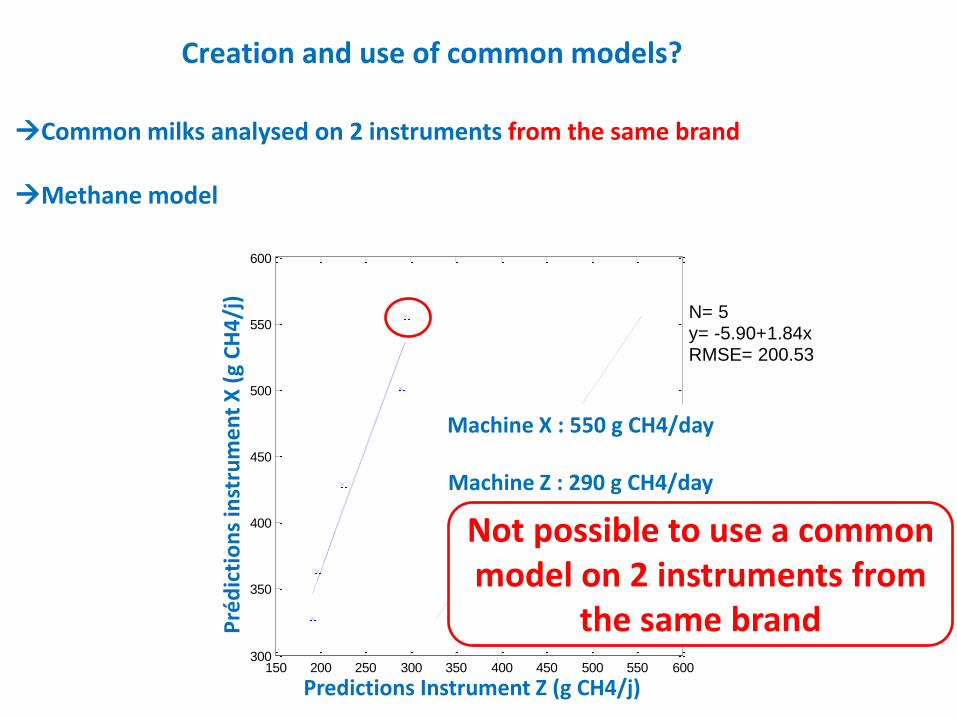
Common milks analysed on 2 instruments from the same brand Methane model
Creation and use of common models?
Machine X : 550 g CH4/day
Machine Z : 290 g CH4/day
Predictions Instrument Z (g CH4/j)
Pré
dic
tio
ns
inst
rum
en
t X
(g
CH
4/j
)
Not possible to use a common model on 2 instruments from
the same brand
Instrument X European Master
3.5
3.6
3.7
3.8
3.9
4
4.1
20
11
12
12
20
11
12
15
20
11
12
21
20
11
12
26
20
11
12
30
20
12
01
04
20
12
01
10
20
12
01
13
20
12
01
20
20
12
01
25
20
12
01
31
20
12
02
10
20
12
02
16
20
12
02
21
20
12
02
24
20
12
03
01
20
12
03
05
20
12
03
07
20
12
03
13
20
12
03
16
20
12
03
22
20
12
03
27
20
12
04
02
20
12
04
03
20
12
04
05
20
12
04
10
20
12
04
12
20
12
04
13
20
12
04
19
20
12
04
24
20
12
04
30
20
12
05
04
20
12
05
10
20
12
05
15
20
12
05
22
20
12
05
25
20
12
06
01
20
12
06
06
20
12
06
13
20
12
06
18
20
12
06
20
20
12
06
22
20
12
06
26
20
12
06
28
20
12
07
03
20
12
07
06
20
12
07
12
Fat
pre
dic
tio
n (
g/1
00
ml)
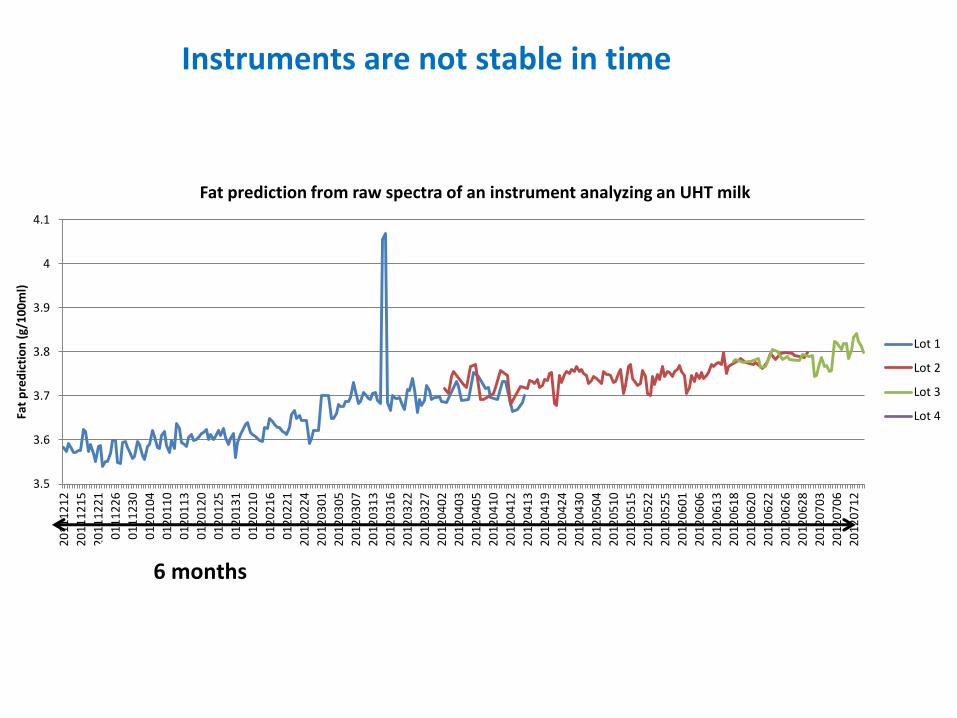
Fat prediction from raw spectra of an instrument analyzing an UHT milk
Lot 1
Lot 2
Lot 3
Lot 4
6 months
Instruments are not stable in time

Instrument X European Master
Instruments also suffer from big perturbations maintenance operation, piece replacement
3.45
3.5
3.55
3.6
3.65
3.7
3.75
3.8
3.85
3.9
3.95
4
20
11
12
19
20
11
12
21
20
11
12
23
20
11
12
29
20
12
01
02
20
12
01
04
20
12
01
09
20
12
01
13
20
12
01
20
20
12
01
26
20
12
01
30
20
12
02
01
20
12
02
06
20
12
02
09
20
12
02
14
20
12
02
17
20
12
02
21
20
12
03
01
20
12
03
05
20
12
03
12
20
12
03
13
20
12
03
14
20
12
03
15
20
12
03
19
20
12
03
28
20
12
04
03
20
12
04
18
20
12
05
02
20
12
05
08
20
12
05
15
20
12
05
21
20
12
05
30
20
12
06
04
20
12
06
08
20
12
06
13
20
12
06
19
20
12
06
21
20
12
06
22
20
12
06
26
20
12
06
29
20
12
07
06
20
12
07
12
Fat
pre
dic
tio
n (
g/1
00
ml)
Fat prediction from raw spectra of an instrument analyzing an UHT milk
Lot 1
Lot 2
Lot 3
6 months
Instruments are not stable in time

Issues:
• Not possible to create common tools
• Not possible to transfer a model on other instruments
• Instruments not stable in time
Slope/bias correction not possible for models predicting methane, fertility, ketosis… Direct Standardisation of the spectra
A model can be used on only 1 instrument and within a limited time
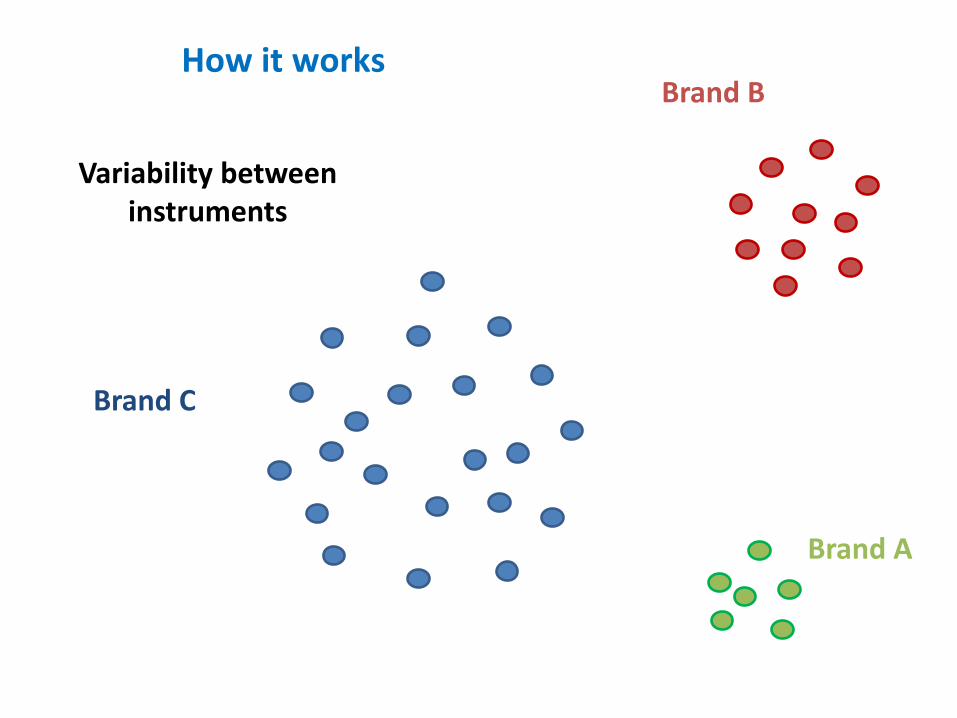
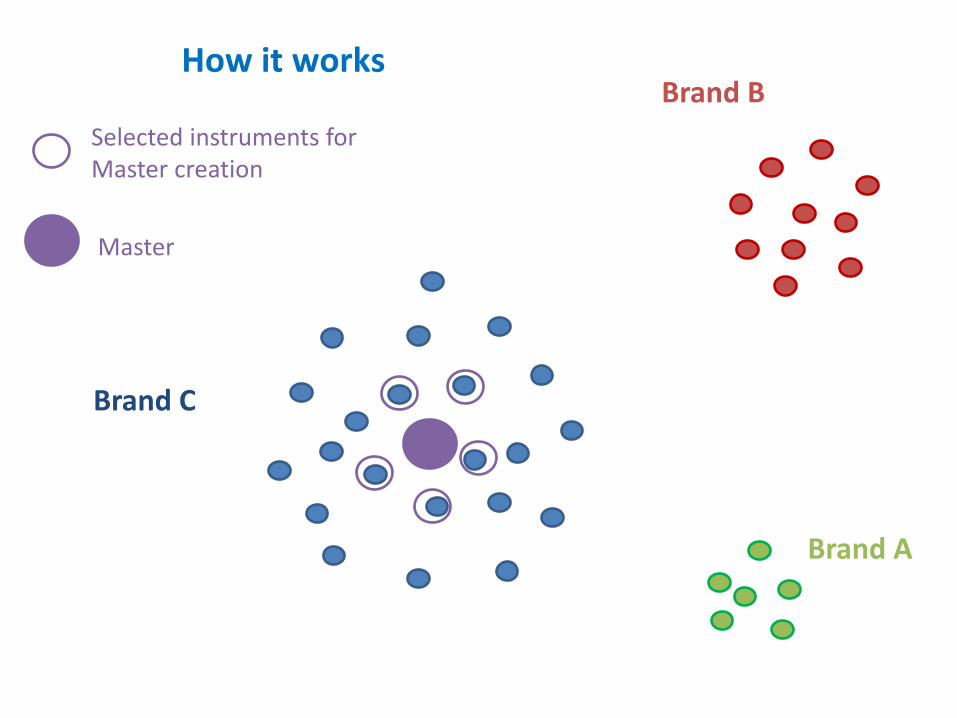
Brand C
Brand B
Brand A
Variability between instruments
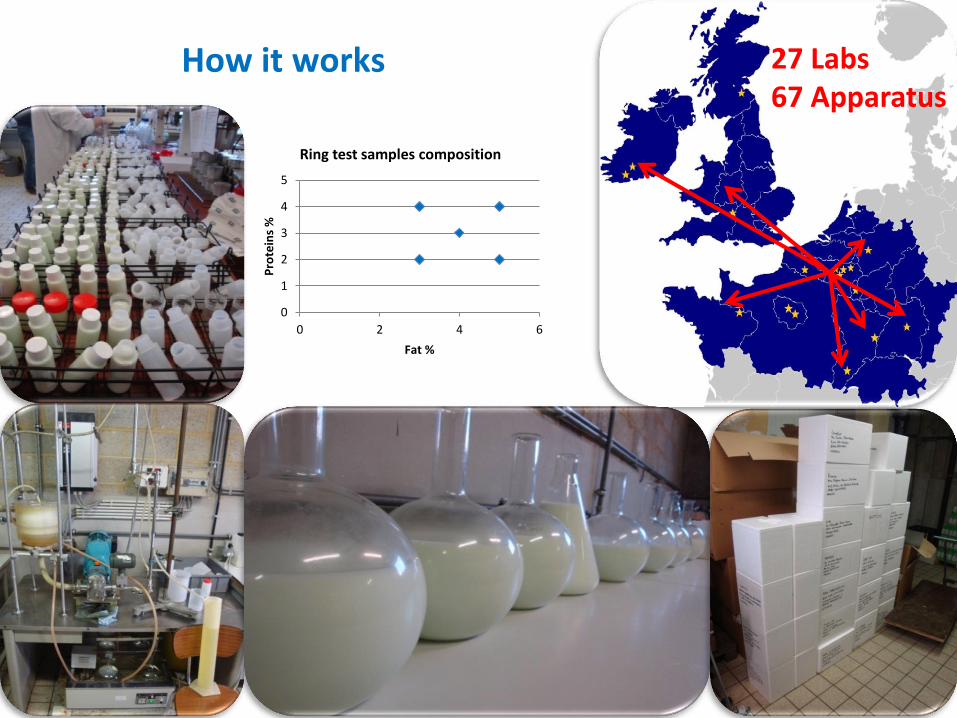
How it works
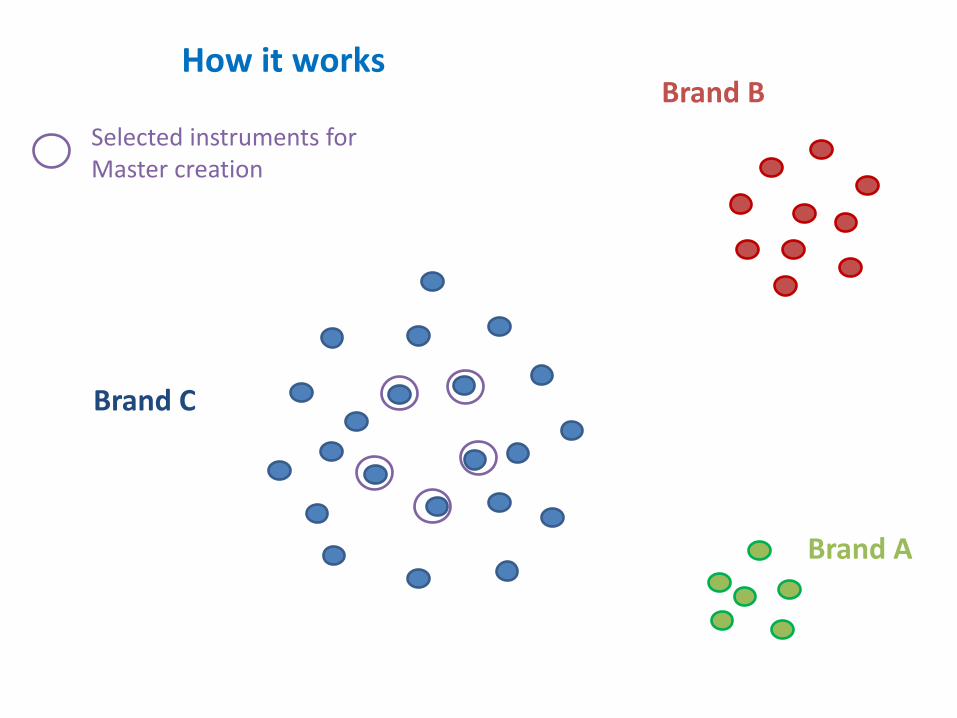
Selected instruments for Master creation
How it works
Brand C
Brand B
Brand A
Selected instruments for Master creation
Master
How it works
Brand C
Brand B
Brand A
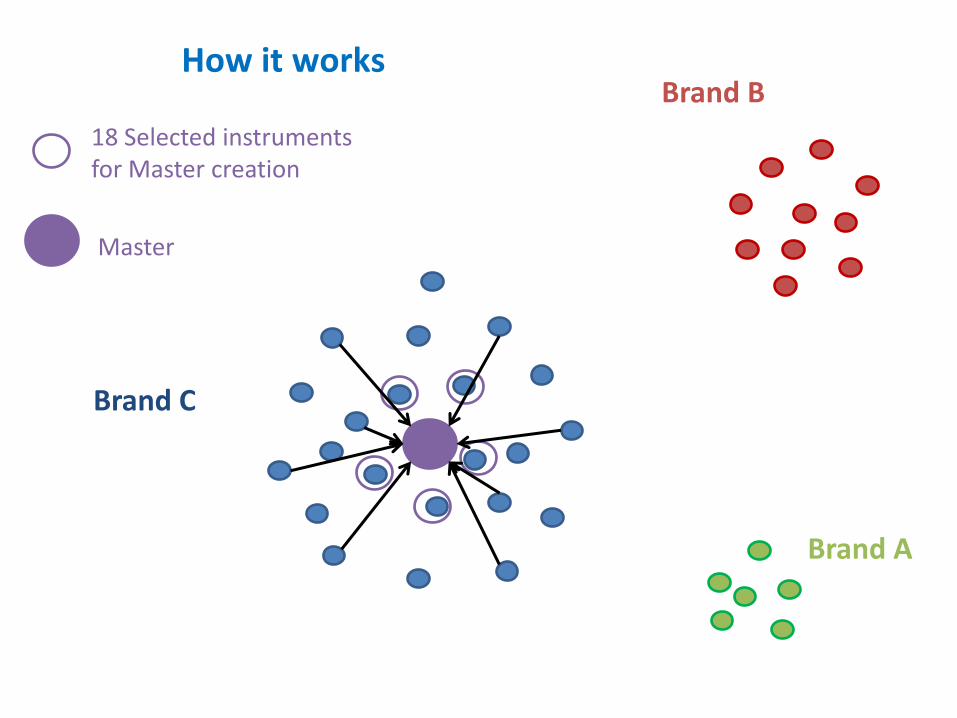
Master
18 Selected instruments for Master creation
How it works
Brand C
Brand B
Brand A

Master
18 Selected instruments for Master creation
How it works
Brand C
Brand B
Brand A
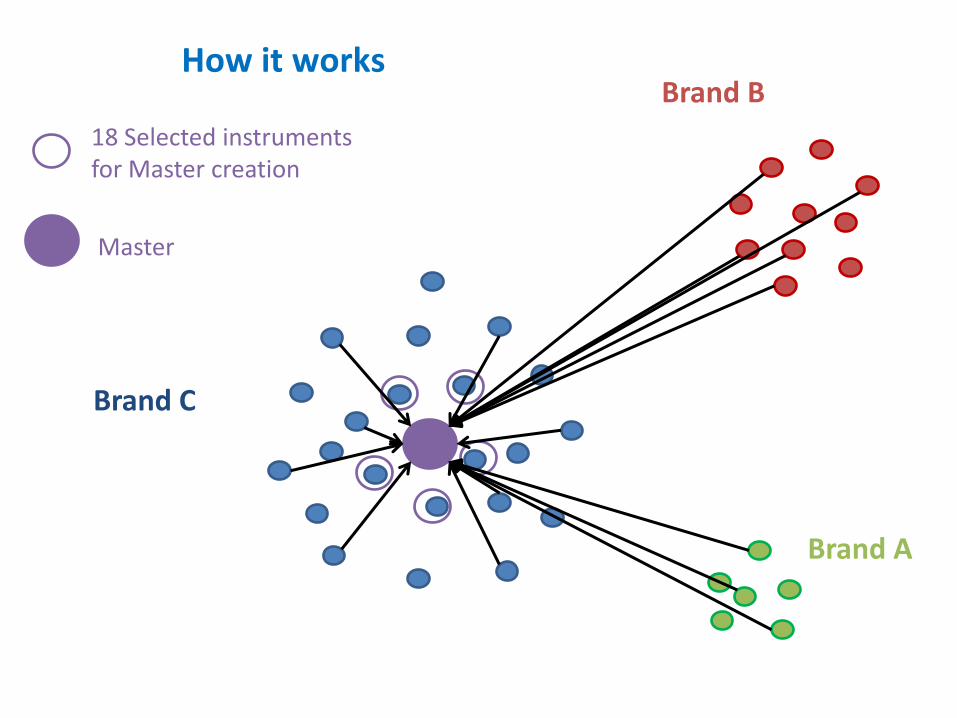
Master
18 Selected instruments for Master creation
How it works
Brand C
Brand B
Brand A

Standardized instruments
Master
Standardised instruments for
creation of equations
Standardised instruments for use
of equations
18 Selected instruments for Master creation
How it works
Brand C
Brand B
Brand A
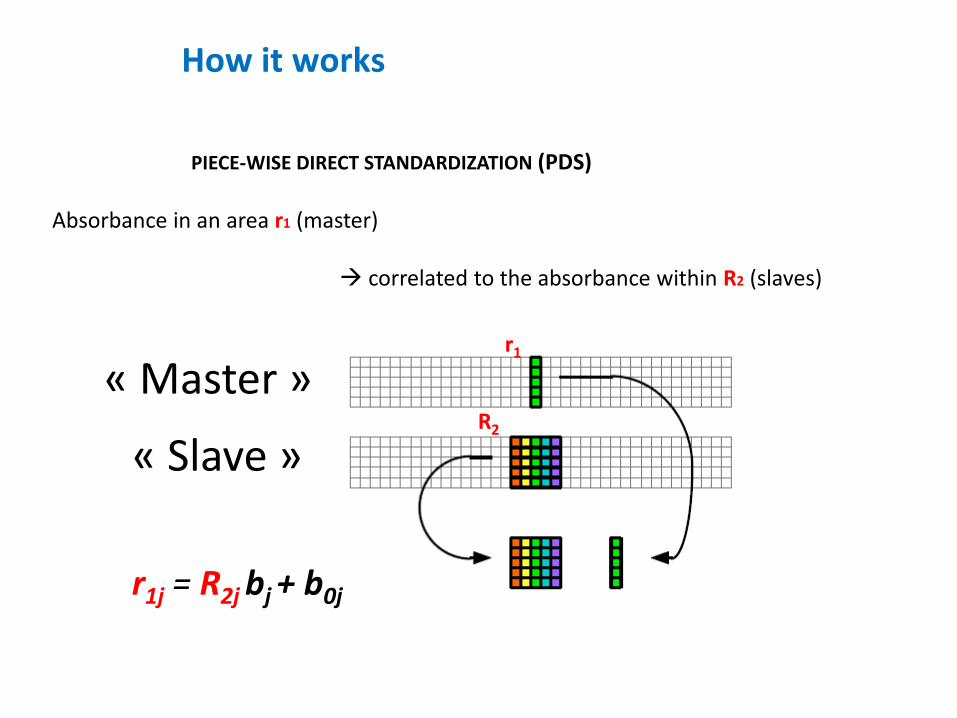
Absorbance in an area r1 (master) correlated to the absorbance within R2 (slaves)
« Master »
« Slave »
r1
R2
PIECE-WISE DIRECT STANDARDIZATION (PDS)
r1j = R2j bj + b0j
How it works
0
1
2
3
4
5
0 2 4 6
Pro
tein
s %
Fat %
Ring test samples composition
27 Labs 67 Apparatus
How it works
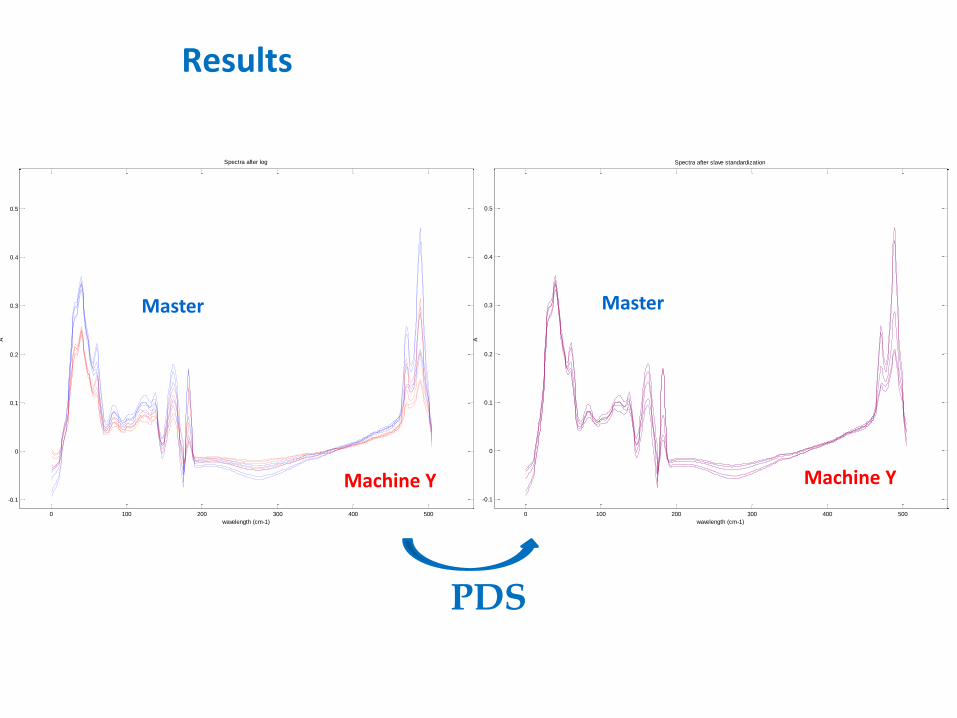
PDS
0 100 200 300 400 500
-0.1
0
0.1
0.2
0.3
0.4
0.5
Spectra after log
wavelength (cm-1)
A
0 100 200 300 400 500
-0.1
0
0.1
0.2
0.3
0.4
0.5
Spectra after slave standardization
wavelength (cm-1)
A
Machine Y
Master
Machine Y
Master
Results
-0.015 -0.01 -0.005 0 0.005 0.01 0.015 0.02
-0.02
-0.015
-0.01
-0.005
0
0.005
0.01
0.015
Scores on PC 4 (0.01%)
Score
s o
n P
C 5
(0.0
1%
)Samples/Scores Plot of X212
Variability of instruments PCA on informative wavenumbers , for 5
common samples analysed on 45 instruments from the same brand
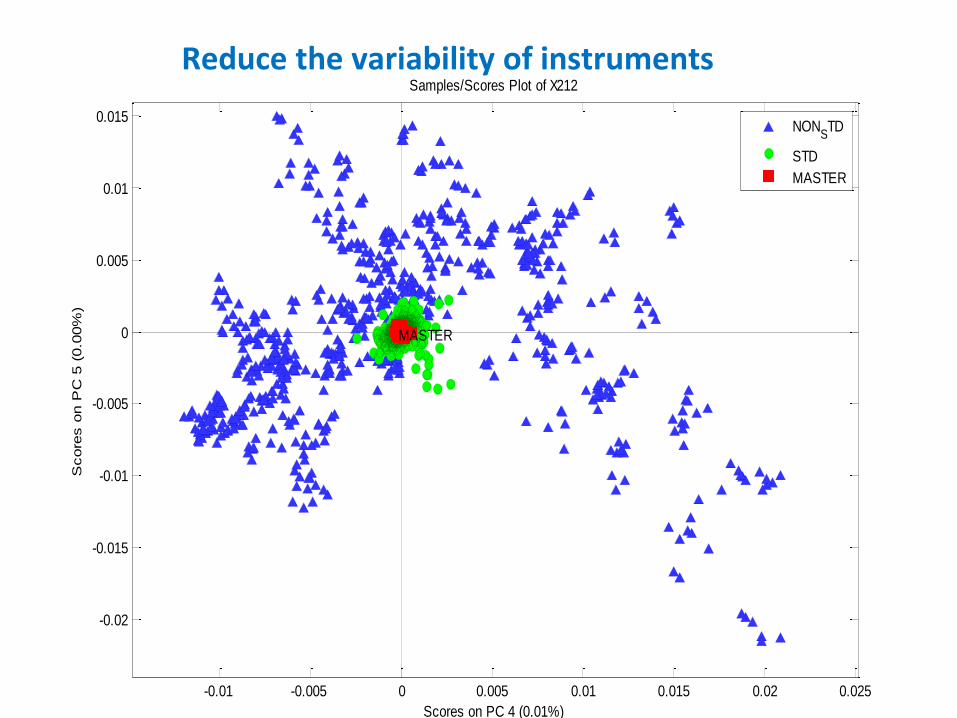
Reduce the variability of instruments
-0.01 -0.005 0 0.005 0.01 0.015 0.02 0.025
-0.02
-0.015
-0.01
-0.005
0
0.005
0.01
0.015
Scores on PC 4 (0.01%)
Score
s o
n P
C 5
(0.0
0%
)Samples/Scores Plot of X212
NONSTD
STD
MASTER
MASTER

N= 5y= 3.15+0.99xRMSE= 21.1816
300 350 400 450 500 550 600300
350
400
450
500
550
600CH4 Master vs. CH4 Slave
Slave CH4 predictions (g CH4/day)
Maste
r C
H4 p
redic
tions (
g C
H4/d
ay)
N= 5y= -5.90+1.84xRMSE= 200.53
150 200 250 300 350 400 450 500 550 600300
350
400
450
500
550
600CH4 Master vs. CH4 Slave
Slave CH4 predictions (g CH4/day)
Maste
r C
H4 p
redic
tions (
g C
H4/d
ay)
Predictions slave (g/d/cow)
Pré
dic
tio
ns
mas
ter
(g/d
/co
w)
Common milks analysed on the master and on a slave instrument from the same brand Methane model
Creation and use of common models?
Without standardisation With standardisaton
Predictions slave (g/d/cow)
Pré
dic
tio
ns
mas
ter
(g/d
/co
w)
Prédiction master : 560 g/d/cow
Prédiction slave : 545 g/d/cow Possible to use a common model on 2 instruments from
the same brand
N= 5y= 590.7677+0.074968xR square= 0.0181biais= -766.7733RMSE= 778.462
-400 -200 0 200 400 600 800480
500
520
540
560
580
600
620
640
660
680CH4 (g/day) predictions without standardisation, Master vs BEL0201
Slave predictions
Maste
r pre
dic
tions
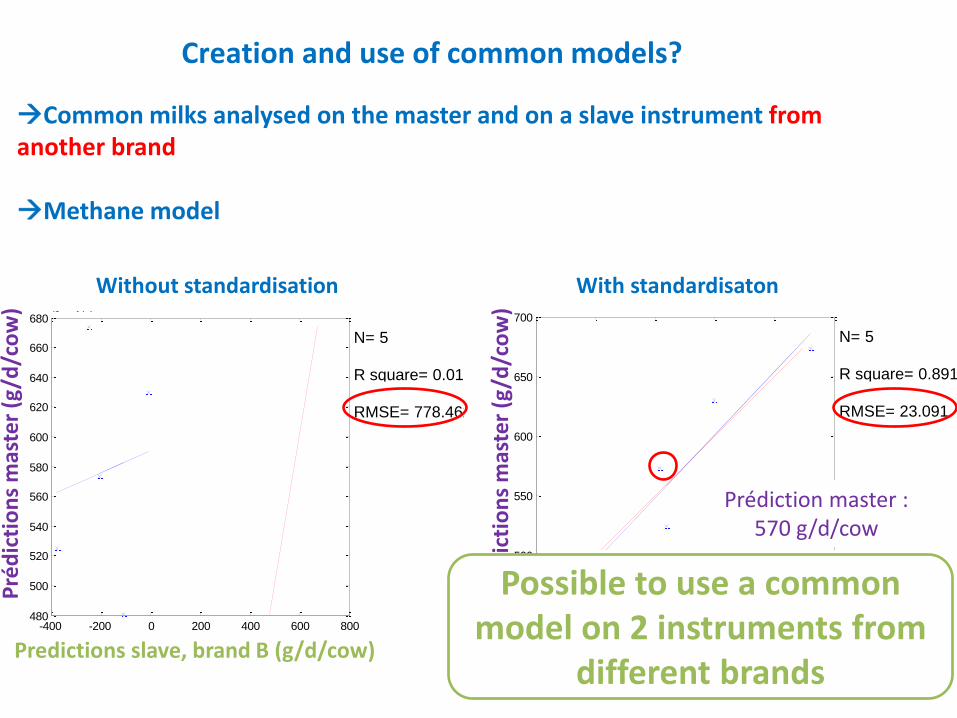
N= 5y= -28.4074+1.0493xR square= 0.89163biais= 7.8444e-013RMSE= 23.091
450 500 550 600 650 700450
500
550
600
650
700CH4 (g/day) predictions after standardisation, Master vs BEL0201
Slave predictions
Maste
r pre
dic
tions
Predictions slave, brand B (g/d/cow)
Pré
dic
tio
ns
mas
ter
(g/d
/co
w)
Common milks analysed on the master and on a slave instrument from another brand Methane model
Creation and use of common models?
Without standardisation With standardisaton
Predictions slave, brand B (g/d/cow)
Pré
dic
tio
ns
mas
ter
(g/d
/co
w)
Prédiction master : 570 g/d/cow
Prédiction slave : 550 g/d/cow Possible to use a common model on 2 instruments from
different brands

47 instruments (7 brand A, 1 brand B, 39 brand C) Methane model RMSE between master and slaves predictions, before and after standardisation
Brand A Brand B Brand C Global average
RMSE before PDS 195.54 778.46 132.15 155.34
RMSE after PDS 35.85 23.09 20.48 22.83
0.00
100.00
200.00
300.00
400.00
500.00
600.00
700.00
800.00
900.00
RM
SE o
f C
H4
(g/
d/c
ow
)
RMSE of CH4 predictions between master and slaves
Creation and use of common models?

47 instruments (7 brand A, 1 brand B, 39 brand C) Poly-Unsaturated Fatty acids model RMSE between master and slaves predictions, before and after standardisation
Brand A Brand B Brand C Global average
RMSE before PDS 0.0749 0.1175 0.0206 0.0308
RMSE after PDS 0.0092 0.0053 0.0032 0.0041
0.0000
0.0200
0.0400
0.0600
0.0800
0.1000
0.1200
0.1400
RM
SE P
UFA
(g/
10
0m
l)
RMSE of PUFA predictions between master and slaves
Creation and use of common models?
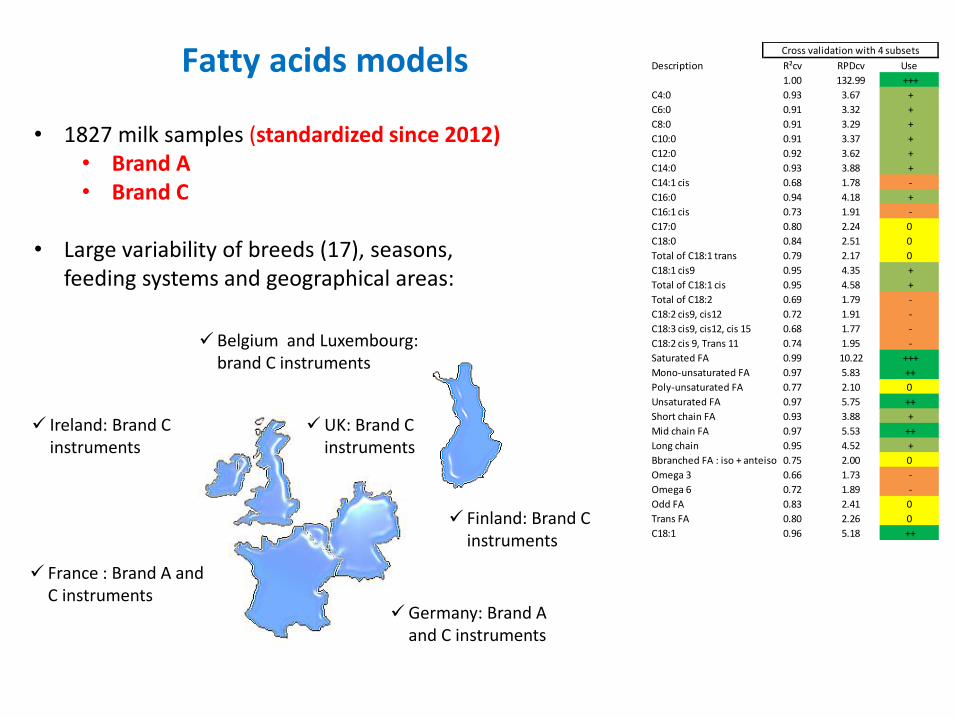
• 1827 milk samples (standardized since 2012) • Brand A • Brand C
• Large variability of breeds (17), seasons,
feeding systems and geographical areas:
Belgium and Luxembourg: brand C instruments
France : Brand A and C instruments
Germany: Brand A and C instruments
Ireland: Brand C instruments
Finland: Brand C instruments
UK: Brand C instruments
Fatty acids models Description Mean SECV R²cv RPDcv Use
3.912 0.007 1.00 132.99 +++
C4:0 0.104 0.008 0.93 3.67 +
C6:0 0.072 0.006 0.91 3.32 +
C8:0 0.047 0.004 0.91 3.29 +
C10:0 0.111 0.010 0.91 3.37 +
C12:0 0.133 0.012 0.92 3.62 +
C14:0 0.445 0.031 0.93 3.88 +
C14:1 cis 0.038 0.008 0.68 1.78 -
C16:0 1.192 0.093 0.94 4.18 +
C16:1 cis 0.066 0.013 0.73 1.91 -
C17:0 0.027 0.003 0.80 2.24 0
C18:0 0.393 0.057 0.84 2.51 0
Total of C18:1 trans 0.125 0.026 0.79 2.17 0
C18:1 cis9 0.751 0.062 0.95 4.35 +
Total of C18:1 cis 0.808 0.064 0.95 4.58 +
Total of C18:2 0.096 0.015 0.69 1.79 -
C18:2 cis9, cis12 0.061 0.012 0.72 1.91 -
C18:3 cis9, cis12, cis 15 0.020 0.004 0.68 1.77 -
C18:2 cis 9, Trans 11 0.028 0.010 0.74 1.95 -
Saturated FA 2.689 0.072 0.99 10.22 +++
Mono-unsaturated FA 1.077 0.058 0.97 5.83 ++
Poly-unsaturated FA 0.159 0.021 0.77 2.10 0
Unsaturated FA 1.237 0.065 0.97 5.75 ++
Short chain FA 0.347 0.025 0.93 3.88 +
Mid chain FA 1.982 0.105 0.97 5.53 ++
Long chain 1.580 0.110 0.95 4.52 +
Bbranched FA : iso + anteiso 0.090 0.012 0.75 2.00 0
Omega 3 0.026 0.006 0.66 1.73 -
Omega 6 0.103 0.015 0.72 1.89 -
Odd FA 0.155 0.016 0.83 2.41 0
Trans FA 0.160 0.030 0.80 2.26 0
C18:1 0.936 0.061 0.96 5.18 ++
Cross validation with 4 subsets
R²cv RPDcv Use
1.00 132.99 +++
0.93 3.67 +
0.91 3.32 +
0.91 3.29 +
0.91 3.37 +
0.92 3.62 +
0.93 3.88 +
0.68 1.78 -
0.94 4.18 +
0.73 1.91 -
0.80 2.24 0
0.84 2.51 0
0.79 2.17 0
0.95 4.35 +
0.95 4.58 +
0.69 1.79 -
0.72 1.91 -
0.68 1.77 -
0.74 1.95 -
0.99 10.22 +++
0.97 5.83 ++
0.77 2.10 0
0.97 5.75 ++
0.93 3.88 +
0.97 5.53 ++
0.95 4.52 +
0.75 2.00 0
0.66 1.73 -
0.72 1.89 -
0.83 2.41 0
0.80 2.26 0
0.96 5.18 ++
Cross validation with 4 subsets

Reference values (SF6)
Methane emitted by dairy cows (A.Vanlierde, 2013)
• 84 from Brand B • 368 from Brand C
0
100
200
300
400
500
600
700
800
900
0 100 200 300 400 500 600 700 800
Mes
ure
d g
CH
4 /
day
Prediction g CH4 / day
N = 452
R²c = 0,76
SECV=69
RPD=1.83
Methane model
0
2
4
6
8
10
12
14
16
18
20
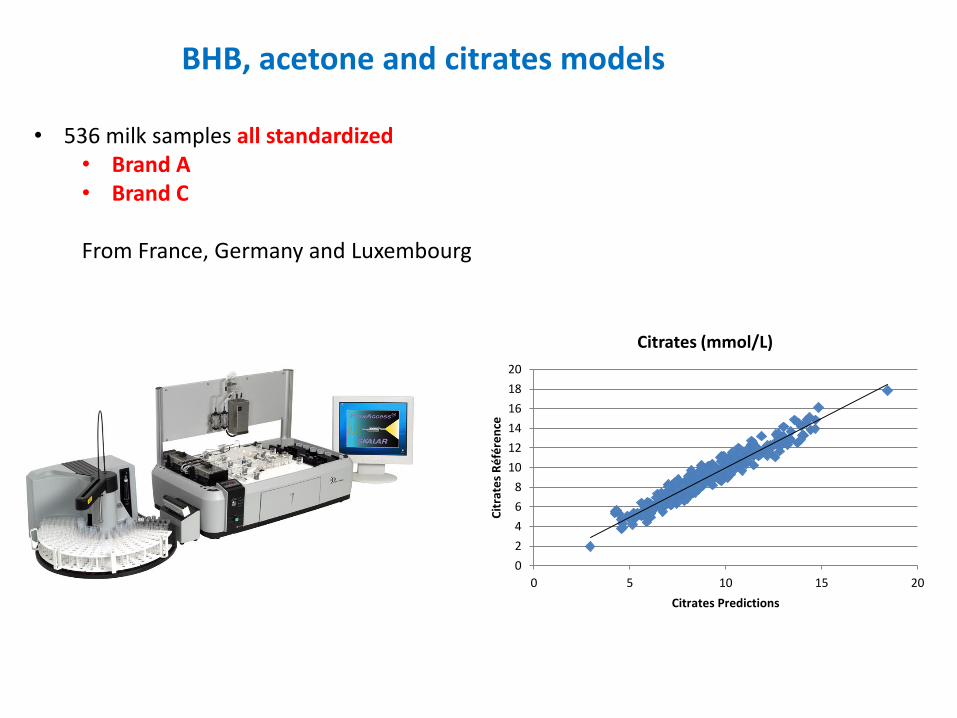
0 5 10 15 20
Cit
rate
s R
éfé
ren
ce
Citrates Predictions
Citrates (mmol/L)
BHB, acetone and citrates models
• 536 milk samples all standardized • Brand A • Brand C
From France, Germany and Luxembourg
Monthly since january 2012, 67 instruments into 27 labs Merging database
Creation of common models, more robust
Use of the models by all instruments
Conclusion
Common langage for all instruments
Equations become universal
Standardisation of milk mid-infrared spectra from a European dairy network, C. Grelet, J.A. Fernández Pierna, P. Dardenne, V. Baeten, F. Dehareng,
Journal of Dairy Sciences, 2015, 98 :2150–2160

New tools for a more sustainable dairy sector www.optimir.eu
WITH THE SUPPORT OF
Thank you for your attention