standard - virginia department of...
TRANSCRIPT
Copyright © 2016by theVirginia Department of EducationP.O. Box 2120Richmond, Virginia 23218-2120http://www.doe.virginia.gov
All rights reserved. Reproduction of these materials for instructional purposes in public school classrooms in Virginia is permitted.
Superintendent of Public InstructionSteven R. Staples
Chief Academic Officer/Assistant Superintendent for InstructionSteven M. Constantino
Office of Mathematics and Governor’s SchoolsDebra Delozier, Mathematics SpecialistTina Mazzacane, Mathematics and Science SpecialistChrista Southall, Mathematics Specialist
AcknowledgementsThe Virginia Department of Education wishes to express sincere thanks to Michael Bolling, who assisted in the development of the 2016 Mathematics Standards of Learning and 2016 Mathematics Standards of Learning Curriculum Framework.
NOTICEThe Virginia Department of Education does not unlawfully discriminate on the basis of race, color, sex, national origin, age, or disability in employment or in its educational programs or services.
Virginia 2016 Mathematics Standards of Learning Curriculum Framework Introduction
The 2016 Mathematics Standards of Learning Curriculum Framework, a companion document to the 2016 Mathematics Standards of Learning, amplifies the Mathematics Standards of Learning and further defines the content knowledge, skills, and understandings that are measured by the Standards of Learning assessments. The standards and Curriculum Framework are not intended to encompass the entire curriculum for a given grade level or course. School divisions are encouraged to incorporate the standards and Curriculum Framework into a broader, locally designed curriculum. The Curriculum Framework delineates in greater specificity the minimum content that all teachers should teach and all students should learn. Teachers are encouraged to go beyond the standards as well as to select instructional strategies and assessment methods appropriate for all students.
The Curriculum Framework also serves as a guide for Standards of Learning assessment development. Students are expected to continue to connect and apply knowledge and skills from Standards of Learning presented in previous grades as they deepen their mathematical understanding. Assessment items may not and should not be a verbatim reflection of the information presented in the Curriculum Framework.
Each topic in the 2016 Mathematics Standards of Learning Curriculum Framework is developed around the Standards of Learning. The format of the Curriculum Framework facilitates teacher planning by identifying the key concepts, knowledge, and skills that should be the focus of instruction for each standard. The Curriculum Framework is divided into two columns: Understanding the Standard and Essential Knowledge and Skills. The purpose of each column is explained below.
Understanding the StandardThis section includes mathematical content and key concepts that assist teachers in planning standards-focused instruction. The statements may provide definitions, explanations, examples, and information regarding connections within and between grade level(s)/course(s).
Essential Knowledge and SkillsThis section provides a detailed expansion of the mathematics knowledge and skills that each student should know and be able to demonstrate. This is not meant to be an exhaustive list of student expectations.
VDOE Mathematics Standards of Learning Curriculum Framework 2016: Algebra II
Mathematical Process Goals for Students
The content of the mathematics standards is intended to support the following five process goals for students: becoming mathematical problem solvers, communicating mathematically, reasoning mathematically, making mathematical connections, and using mathematical representations to model and interpret practical situations. Practical situations include real-world problems and problems that model real-world situations.
Mathematical Problem Solving
Students will apply mathematical concepts and skills and the relationships among them to solve problem situations of varying complexities. Students also will recognize and create problems from real-world data and situations within and outside mathematics and then apply appropriate strategies to determine acceptable solutions. To accomplish this goal, students will need to develop a repertoire of skills and strategies for solving a variety of problems. A major goal of the mathematics program is to help students apply mathematics concepts and skills to become mathematical problem solvers.
Mathematical Communication
Students will communicate thinking and reasoning using the language of mathematics, including specialized vocabulary and symbolic notation, to express mathematical ideas with precision. Representing, discussing, justifying, conjecturing, reading, writing, presenting, and listening to mathematics will help students clarify their thinking and deepen their understanding of the mathematics being studied. Mathematical communication becomes visible where learning involves participation in mathematical discussions.
Mathematical Reasoning
Students will recognize reasoning and proof as fundamental aspects of mathematics. Students will learn and apply inductive and deductive reasoning skills to make, test, and evaluate mathematical statements and to justify steps in mathematical procedures. Students will use logical reasoning to analyze an argument and to determine whether conclusions are valid. In addition, students will use number sense to apply proportional and spatial reasoning and to reason from a variety of representations.
Mathematical Connections
Students will build upon prior knowledge to relate concepts and procedures from different topics within mathematics and see mathematics as an integrated field of study. Through the practical application of content and process skills, students will make connections among different areas of mathematics and between mathematics and other disciplines, and to real-world contexts. Science and mathematics teachers and curriculum writers are encouraged to develop mathematics and science curricula that support, apply, and reinforce each other.
Mathematical Representations
Students will represent and describe mathematical ideas, generalizations, and relationships using a variety of methods. Students will understand that representations of mathematical ideas are an essential part of learning, doing, and communicating mathematics. Students should make connections among different representations – physical, visual, symbolic, verbal, and contextual – and recognize that representation is both a process and a product.
VDOE Mathematics Standards of Learning Curriculum Framework 2016: Algebra II
Instructional Technology
The use of appropriate technology and the interpretation of the results from applying technology tools must be an integral part of teaching, learning, and assessment. However, facility in the use of technology shall not be regarded as a substitute for a student’s understanding of quantitative and algebraic concepts and relationships or for proficiency in basic computations. Students must learn to use a variety of methods and tools to compute, including paper and pencil, mental arithmetic, estimation, and calculators. In addition, graphing utilities, spreadsheets, calculators, dynamic applications, and other technological tools are now standard for mathematical problem solving and application in science, engineering, business and industry, government, and practical affairs.
Calculators and graphing utilities should be used by students for exploring and visualizing number patterns and mathematical relationships, facilitating reasoning and problem solving, and verifying solutions. However, according to the National Council of Teachers of Mathematics, “… the use of calculators does not supplant the need for students to develop proficiency with efficient, accurate methods of mental and pencil-and-paper calculation and in making reasonable estimations.” State and local assessments may restrict the use of calculators in measuring specific student objectives that focus on number sense and computation. On the grade three state assessment, all objectives are assessed without the use of a calculator. On the state assessments for grades four through seven, objectives that are assessed without the use of a calculator are indicated with an asterisk (*).
Computational Fluency
Mathematics instruction must develop students’ conceptual understanding, computational fluency, and problem-solving skills. The development of related conceptual understanding and computational skills should be balanced and intertwined, each supporting the other and reinforcing learning.
Computational fluency refers to having flexible, efficient and accurate methods for computing. Students exhibit computational fluency when they demonstrate strategic thinking and flexibility in the computational methods they choose, understand and can explain, and produce accurate answers efficiently.
The computational methods used by a student should be based on the mathematical ideas that the student understands, including the structure of the base-ten number system, number relationships, meaning of operations, and properties. Computational fluency with whole numbers is a goal of mathematics instruction in the elementary grades. Students should be fluent with the basic number combinations for addition and subtraction to 20 by the end of second grade and those for multiplication and division by the end of grade four. Students should be encouraged to use computational methods and tools that are appropriate for the context and purpose.
Algebra Readiness
The successful mastery of Algebra I is widely considered to be the gatekeeper to success in the study of upper-level mathematics. “Algebra readiness” describes the mastery of, and the ability to apply, the Mathematics Standards of Learning, including the Mathematical Process Goals for Students, for kindergarten through grade eight. The study of algebraic thinking begins in kindergarten and is progressively formalized prior to the study of the algebraic content found in the Algebra I Standards of Learning. Included in the progression of algebraic content is patterning, generalization of arithmetic concepts, proportional reasoning, and representing mathematical relationships using tables, symbols, and graphs. The K-8 Mathematics Standards of Learning form a progression of content knowledge and develop the reasoning necessary to be well-prepared for mathematics courses beyond Algebra I, including Geometry and Statistics.
VDOE Mathematics Standards of Learning Curriculum Framework 2016: Algebra II
Equity
“Addressing equity and access includes both ensuring that all students attain mathematics proficiency and increasing the numbers of students from all racial, ethnic, linguistic, gender, and socioeconomic groups who attain the highest levels of mathematics achievement.” – National Council of Teachers of Mathematics
Mathematics programs should have an expectation of equity by providing all students access to quality mathematics instruction and offerings that are responsive to and respectful of students’ prior experiences, talents, interests, and cultural perspectives. Successful mathematics programs challenge students to maximize their academic potential and provide consistent monitoring, support, and encouragement to ensure success for all. Individual students should be encouraged to choose mathematical programs of study that challenge, enhance, and extend their mathematical knowledge and future opportunities.
Mathematics programs should have an expectation of equity by providing all students access to quality mathematics instruction and offerings that are responsive to and respectful of students’ prior experiences, talents, interests, and cultural perspectives. Successful mathematics programs challenge students to maximize their academic potential and provide consistent monitoring, support, and encouragement to ensure success for all. Individual students should be encouraged to choose mathematical programs of study that challenge, enhance, and extend their mathematical knowledge and future opportunities.
Student engagement is an essential component of equity in mathematics teaching and learning. Mathematics instructional strategies that require students to think critically, to reason, to develop problem-solving strategies, to communicate mathematically, and to use multiple representations engages students both mentally and physically. Student engagement increases with mathematical tasks that employ the use of relevant, applied contexts and provide an appropriate level of cognitive challenge. All students, including students with disabilities, gifted learners, and English language learners deserve high-quality mathematics instruction that addresses individual learning needs, maximizing the opportunity to learn.
VDOE Mathematics Standards of Learning Curriculum Framework 2016: Algebra II
Algebra II Strand: Expressions and Operations
AII.1 The student willa) add, subtract, multiply, divide, and simplify rational algebraic expressions;b) add, subtract, multiply, divide, and simplify radical expressions containing rational numbers and variables, and expressions
containing rational exponents; andc) factor polynomials completely in one or two variables.
Understanding The Standard Essential Knowledge And Skills
Computational skills applicable to numerical fractions also apply to rational expressions involving variables.
Radical expressions can be written and simplified using rational exponents.
Only radicals with a common radicand and index can be added or subtracted, which may require rewriting a radical with a lower base and different index.
A relationship exists among arithmetic complex fractions, algebraic complex fractions, and rational numbers.
The complete factorization of polynomials has occurred when each factor is a prime polynomial.
Pattern recognition can be used to determine complete factorization of a polynomial.
Polynomials may be factored in various ways, including, but not limited to grouping or applying general patterns such as difference of squares, sum and difference of cubes, and perfect square trinomials.
The student will use problem solving, mathematical communication, mathematical reasoning, connections, and representations to
Add, subtract, multiply, and divide rational algebraic expressions. (a)
Simplify a rational algebraic expression with monomial or binomial factors. Algebraic expressions should be limited to linear and quadratic expressions. (a)
Recognize a complex algebraic fraction, and simplify it as a quotient or product of simple algebraic fractions. (a)
Simplify radical expressions containing positive rational numbers and variables. (b)
Convert between radical expressions and expressions containing rational exponents. (b)
Add and subtract radical expressions. (b)
Multiply and divide radical expressions. Simplification may include rationalizing denominators. (b)
Factor polynomials in one or two variables with no more than four terms completely over the set of integers. Factors of the polynomial should be constant, linear, or quadratic. (c)
Verify polynomial identities including the difference of squares, sum and difference of cubes, and perfect square trinomials. (c)
Mathematics Standards of Learning Curriculum Framework 2016: Algebra II Page 5

Algebra II Strand: Expressions and Operations
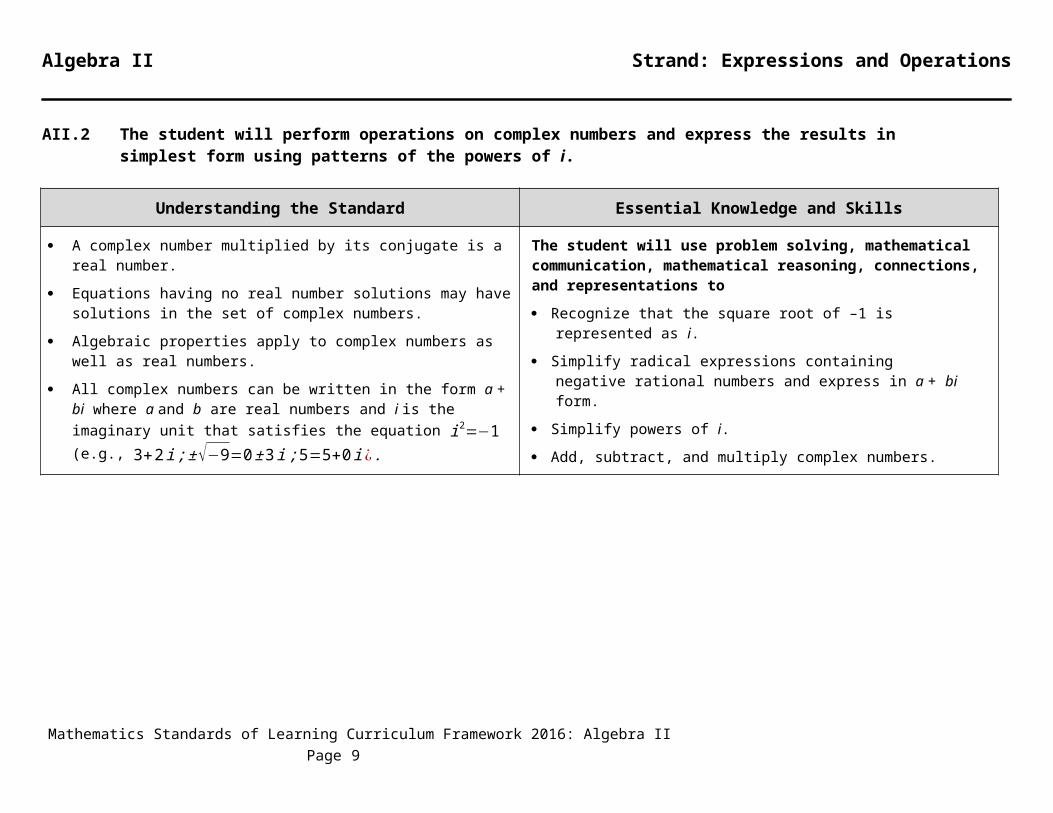
AII.2 The student will perform operations on complex numbers and express the results in simplest form using patterns of the powers of i.
Understanding the Standard Essential Knowledge and Skills
A complex number multiplied by its conjugate is a real number.
Equations having no real number solutions may have solutions in the set of complex numbers.
Algebraic properties apply to complex numbers as well as real numbers.
All complex numbers can be written in the form a + bi where a and b are real numbers and i is the imaginary unit that satisfies the equation i2=−1(e.g., 3+2 i ;±√−9=0±3 i ;5=5+0 i ¿ .
The student will use problem solving, mathematical communication, mathematical reasoning, connections, and representations to
Recognize that the square root of –1 is represented as i.
Simplify radical expressions containing negative rational numbers and express in a + bi form.
Simplify powers of i.
Add, subtract, and multiply complex numbers.
Mathematics Standards of Learning Curriculum Framework 2016: Algebra II Page 6

Algebra II Strand: Equations and Inequalities
AII.3 The student will solvea) absolute value linear equations and inequalities;b) quadratic equations over the set of complex numbers;c) equations containing rational algebraic expressions; andd) equations containing radical expressions.
Understanding the Standard Essential Knowledge and Skills
A quadratic function whose graph does not intersect the x-axis has roots with imaginary components.
The quadratic formula can be used to solve any quadratic equation.
The quadratic formula can be derived by applying the completion of squares to any quadratic equation in standard form.
The value of the discriminant of a quadratic equation can be used to describe the number and type of solutions.
Solutions of quadratic equations are real or a sum or difference of a real and imaginary component.
Complex solutions occur in conjugate pairs.
Quadratic equations with exactly one real root can be referred to as having one distinct root with a multiplicity of two. For instance, the quadratic equation, x2−4 x+4, has two identical factors, giving one real root with a multiplicity of two.
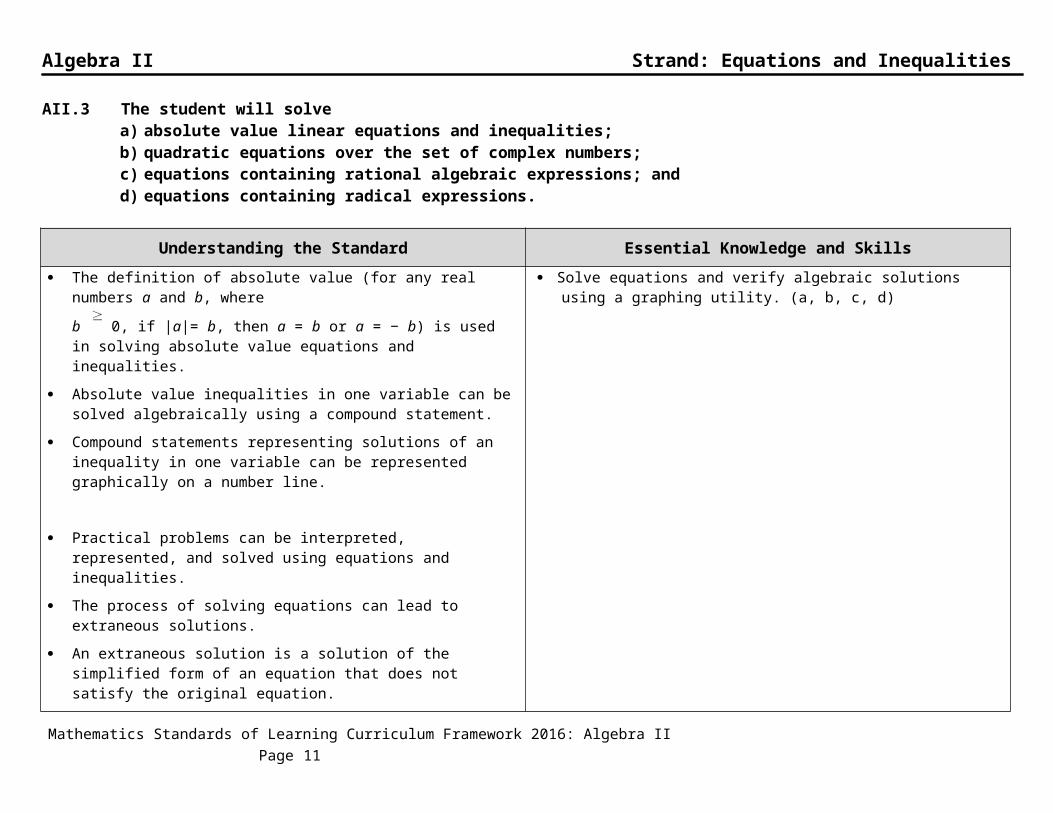
The definition of absolute value (for any real numbers a and b, where
b 0, if |a|= b, then a = b or a = − b) is used in solving absolute value equations and inequalities.
Absolute value inequalities in one variable can be solved algebraically using a compound statement.
Compound statements representing solutions of an inequality in one variable can be represented graphically on a number line.
The student will use problem solving, mathematical communication, mathematical reasoning, connections, and representations to
Solve absolute value linear equations or inequalities in one variable algebraically. (a)
Represent solutions to absolute value linear inequalities in one variable graphically. (a)
Solve a quadratic equation over the set of complex numbers algebraically. (b)
Calculate the discriminant of a quadratic equation to determine the number and type of solutions. (b)
Solve rational equations with real solutions containing factorable algebraic expressions algebraically and graphically. Algebraic expressions should be limited to linear and quadratic expressions. (c)
Solve an equation containing no more than one radical expression algebraically and graphically. (d)
Solve equations and verify algebraic solutions using a graphing utility. (a, b, c, d)
Mathematics Standards of Learning Curriculum Framework 2016: Algebra II Page 7

Algebra II Strand: Equations and Inequalities
AII.3 The student will solvea) absolute value linear equations and inequalities;b) quadratic equations over the set of complex numbers;c) equations containing rational algebraic expressions; andd) equations containing radical expressions.
Understanding the Standard Essential Knowledge and Skills
Practical problems can be interpreted, represented, and solved using equations and inequalities.
The process of solving equations can lead to extraneous solutions.
An extraneous solution is a solution of the simplified form of an equation that does not satisfy the original equation.
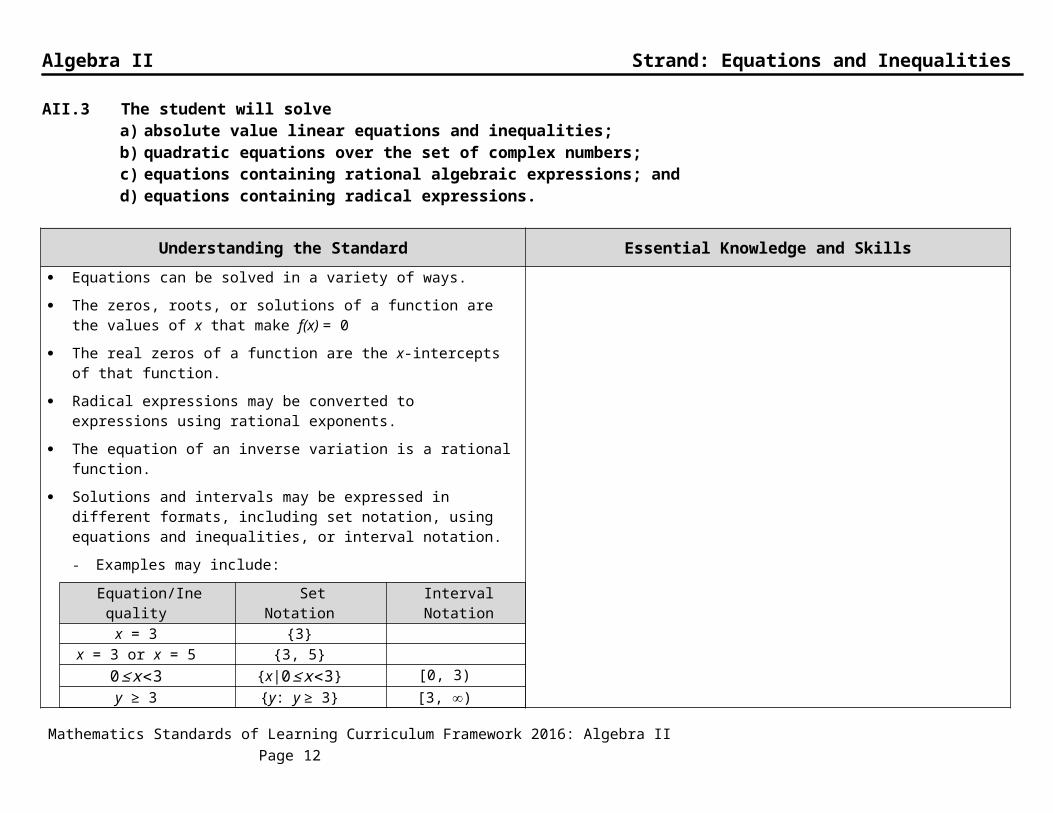
Equations can be solved in a variety of ways.
The zeros, roots, or solutions of a function are the values of x that make f(x) = 0
The real zeros of a function are the x-intercepts of that function.
Radical expressions may be converted to expressions using rational exponents.
The equation of an inverse variation is a rational function.
Solutions and intervals may be expressed in different formats, including set notation, using equations and inequalities, or interval notation.
- Examples may include:
Equation/Inequality Set Notation Interval Notationx = 3 {3}
x = 3 or x = 5 {3, 5}0≤ x<3 {x|0≤ x<3} [0, 3)
y ≥ 3 {y: y ≥ 3} [3, )Empty (null) set ∅ { }
Mathematics Standards of Learning Curriculum Framework 2016: Algebra II Page 8
Algebra II Strand: Equations and Inequalities
AII.4 The student will solve systems of linear-quadratic and quadratic-quadratic equations, algebraically and graphically.
Understanding the Standard Essential Knowledge and Skills
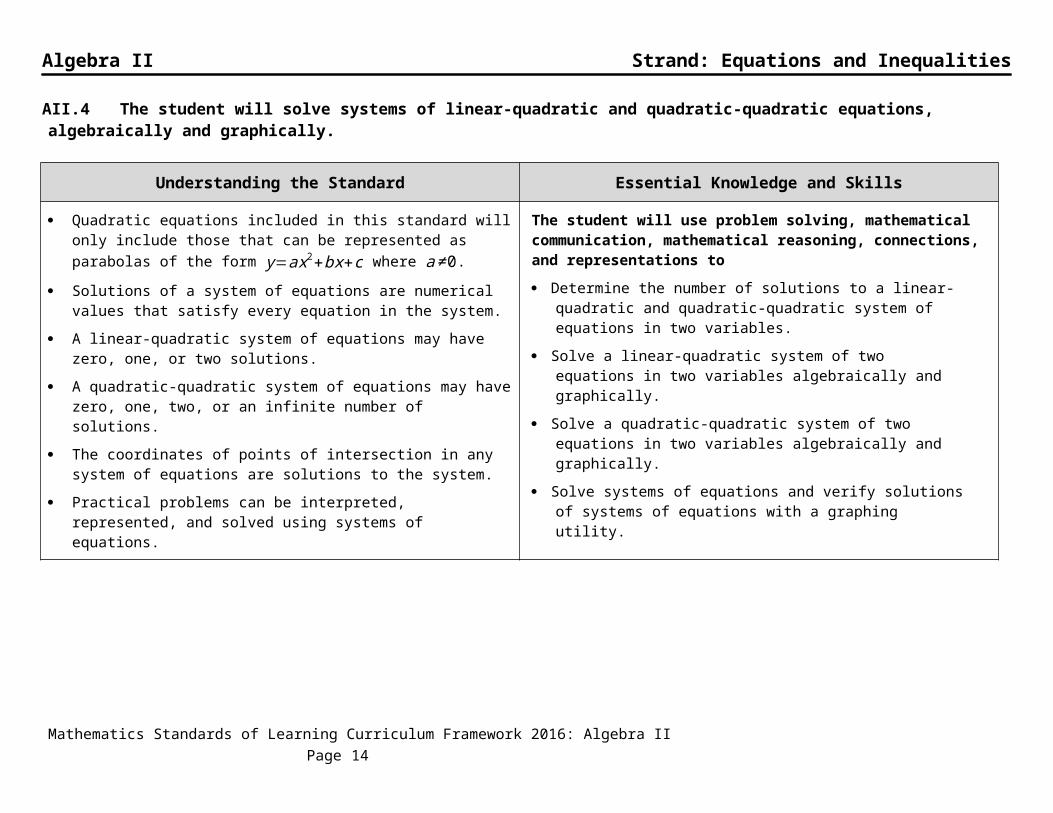
Quadratic equations included in this standard will only include those that can be represented as parabolas of the form y=ax2+bx+c where a≠0.
Solutions of a system of equations are numerical values that satisfy every equation in the system.
A linear-quadratic system of equations may have zero, one, or two solutions.
A quadratic-quadratic system of equations may have zero, one, two, or an infinite number of solutions.
The coordinates of points of intersection in any system of equations are solutions to the system.
Practical problems can be interpreted, represented, and solved using systems of equations.
The student will use problem solving, mathematical communication, mathematical reasoning, connections, and representations to
Determine the number of solutions to a linear-quadratic and quadratic-quadratic system of equations in two variables.
Solve a linear-quadratic system of two equations in two variables algebraically and graphically.
Solve a quadratic-quadratic system of two equations in two variables algebraically and graphically.
Solve systems of equations and verify solutions of systems of equations with a graphing utility.
Mathematics Standards of Learning Curriculum Framework 2016: Algebra II Page 9

Algebra II Strand: Functions
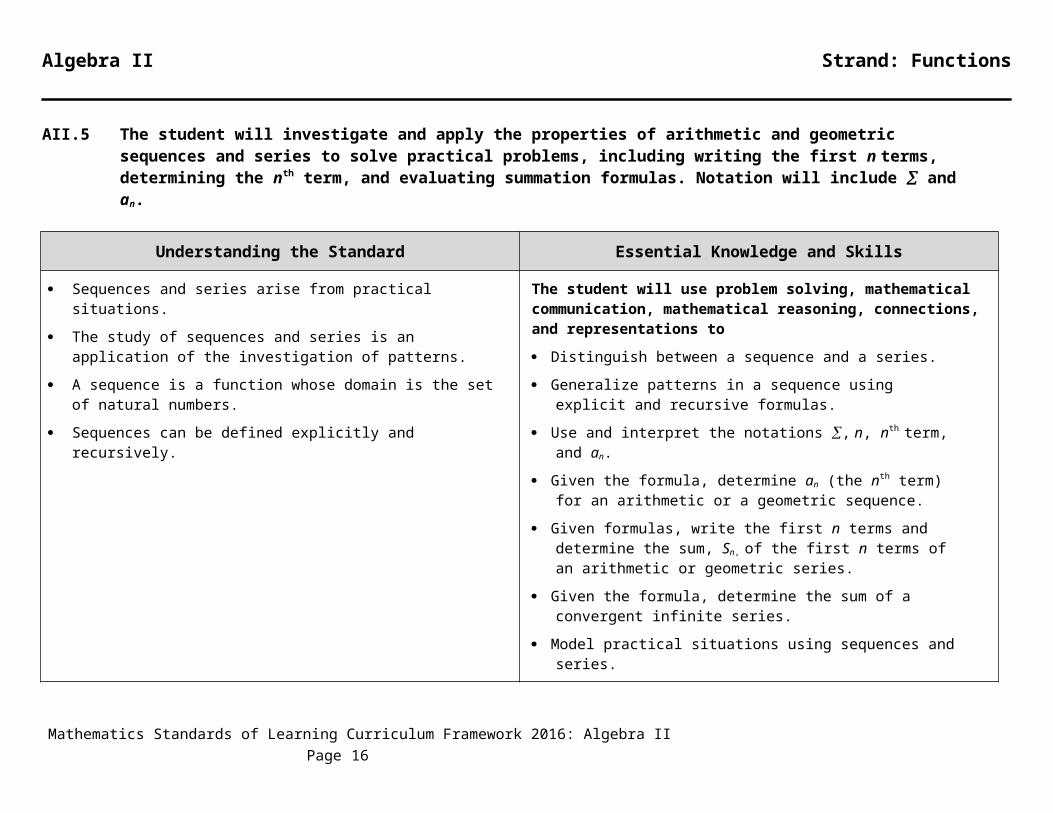
AII.5 The student will investigate and apply the properties of arithmetic and geometric sequences and series to solve practical problems, including writing the first n terms, determining the nth term, and evaluating summation formulas. Notation will include and an.
Understanding the Standard Essential Knowledge and Skills
Sequences and series arise from practical situations.
The study of sequences and series is an application of the investigation of patterns.
A sequence is a function whose domain is the set of natural numbers.
Sequences can be defined explicitly and recursively.
The student will use problem solving, mathematical communication, mathematical reasoning, connections, and representations to
Distinguish between a sequence and a series.
Generalize patterns in a sequence using explicit and recursive formulas.
Use and interpret the notations , n, nth term, and an.
Given the formula, determine an (the nth term) for an arithmetic or a geometric sequence.
Given formulas, write the first n terms and determine the sum, Sn, of the first n terms of an arithmetic or geometric series.
Given the formula, determine the sum of a convergent infinite series.
Model practical situations using sequences and series.
Mathematics Standards of Learning Curriculum Framework 2016: Algebra II Page 10
Algebra II Strand: Functions
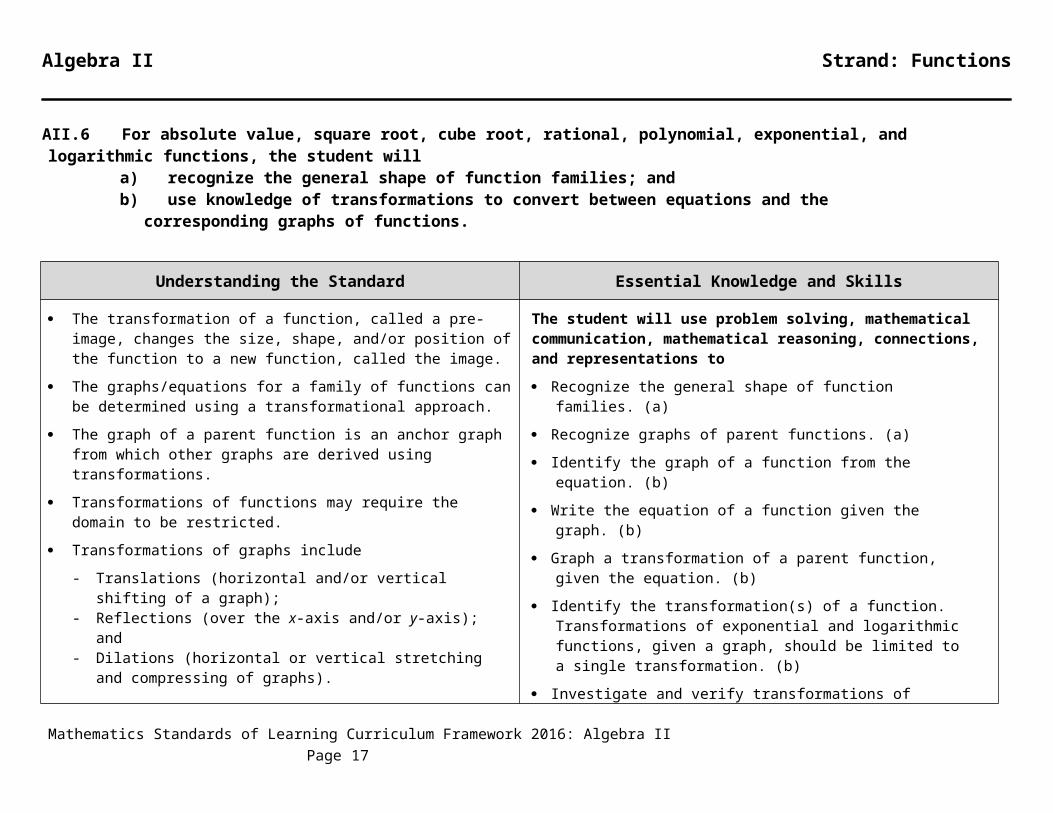
AII.6 For absolute value, square root, cube root, rational, polynomial, exponential, and logarithmic functions, the student willa) recognize the general shape of function families; andb) use knowledge of transformations to convert between equations and the corresponding graphs of functions.
Understanding the Standard Essential Knowledge and Skills
The transformation of a function, called a pre-image, changes the size, shape, and/or position of the function to a new function, called the image.
The graphs/equations for a family of functions can be determined using a transformational approach.
The graph of a parent function is an anchor graph from which other graphs are derived using transformations.
Transformations of functions may require the domain to be restricted.
Transformations of graphs include
- Translations (horizontal and/or vertical shifting of a graph);- Reflections (over the x-axis and/or y-axis); and- Dilations (horizontal or vertical stretching and compressing of
graphs).
The reflection of a function over the line y=x represents the inverse of a function.
The student will use problem solving, mathematical communication, mathematical reasoning, connections, and representations to
Recognize the general shape of function families. (a)
Recognize graphs of parent functions. (a)
Identify the graph of a function from the equation. (b)
Write the equation of a function given the graph. (b)
Graph a transformation of a parent function, given the equation. (b)
Identify the transformation(s) of a function. Transformations of exponential and logarithmic functions, given a graph, should be limited to a single transformation. (b)
Investigate and verify transformations of functions using a graphing utility. (a, b)
Mathematics Standards of Learning Curriculum Framework 2016: Algebra II Page 11
Algebra II Strand: Functions
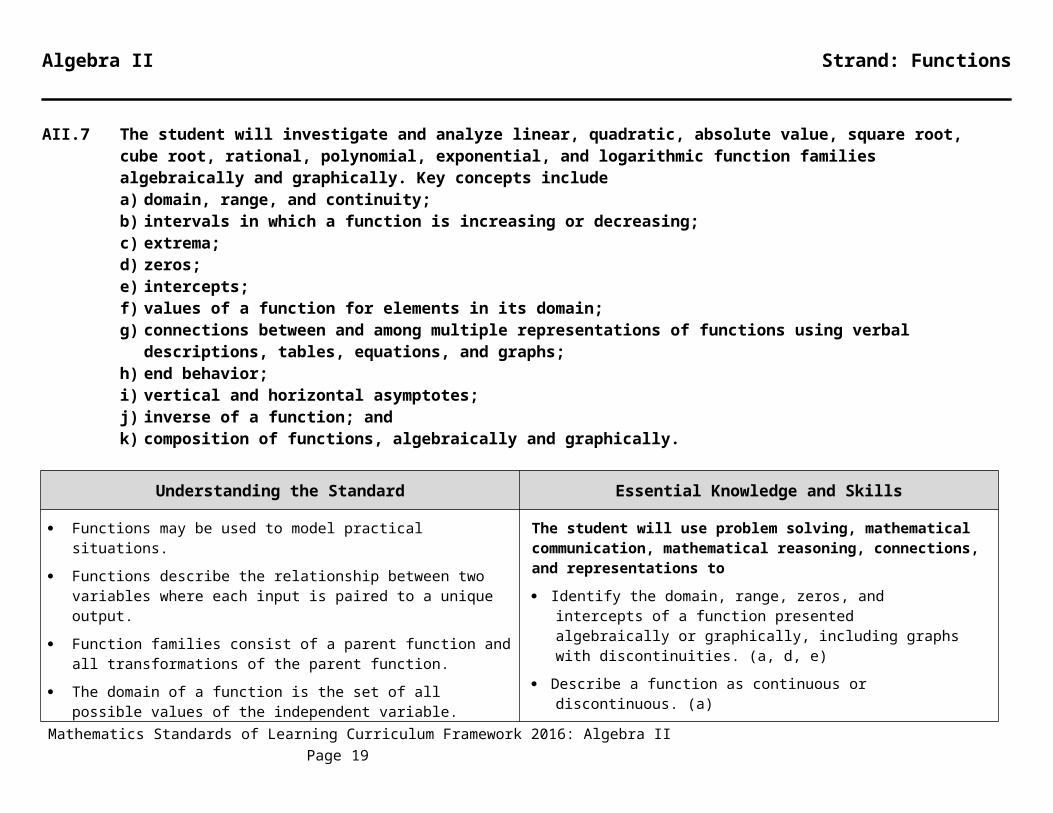
AII.7 The student will investigate and analyze linear, quadratic, absolute value, square root, cube root, rational, polynomial, exponential, and logarithmic function families algebraically and graphically. Key concepts includea) domain, range, and continuity;b) intervals in which a function is increasing or decreasing;c) extrema;d) zeros;e) intercepts;f) values of a function for elements in its domain;g) connections between and among multiple representations of functions using verbal descriptions, tables, equations, and graphs;h) end behavior;i) vertical and horizontal asymptotes;j) inverse of a function; andk) composition of functions, algebraically and graphically.
Understanding the Standard Essential Knowledge and Skills
Functions may be used to model practical situations.
Functions describe the relationship between two variables where each input is paired to a unique output.
Function families consist of a parent function and all transformations of the parent function.
The domain of a function is the set of all possible values of the independent variable.
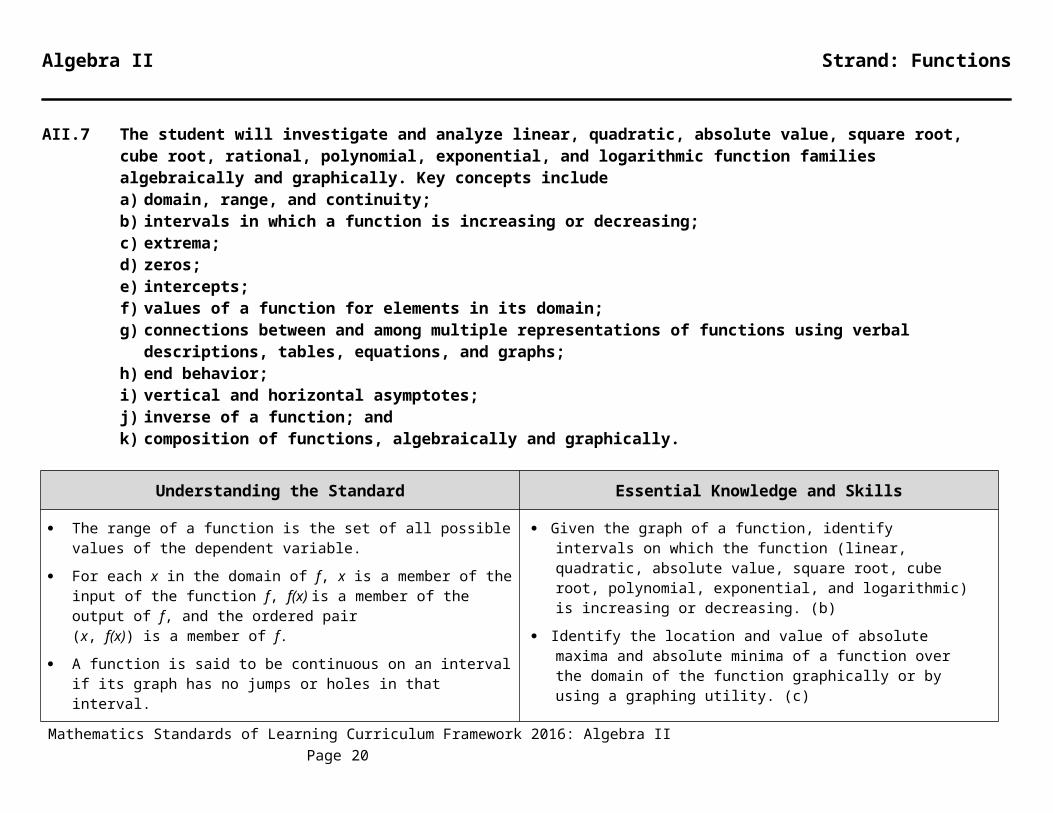
The range of a function is the set of all possible values of the dependent variable.
For each x in the domain of f, x is a member of the input of the function f, f(x) is a member of the output of f, and the ordered pair (x, f(x)) is a member of f.
A function is said to be continuous on an interval if its graph has no jumps or holes in that interval.
The student will use problem solving, mathematical communication, mathematical reasoning, connections, and representations to
Identify the domain, range, zeros, and intercepts of a function presented algebraically or graphically, including graphs with discontinuities. (a, d, e)
Describe a function as continuous or discontinuous. (a)
Given the graph of a function, identify intervals on which the function (linear, quadratic, absolute value, square root, cube root, polynomial, exponential, and logarithmic) is increasing or decreasing. (b)
Identify the location and value of absolute maxima and absolute minima of a function over the domain of the function graphically or by using a graphing utility. (c)
Identify the location and value of relative maxima or relative minima of a function over some interval of the domain graphically or by using
Mathematics Standards of Learning Curriculum Framework 2016: Algebra II Page 12
Algebra II Strand: Functions
AII.7 The student will investigate and analyze linear, quadratic, absolute value, square root, cube root, rational, polynomial, exponential, and logarithmic function families algebraically and graphically. Key concepts includea) domain, range, and continuity;b) intervals in which a function is increasing or decreasing;c) extrema;d) zeros;e) intercepts;f) values of a function for elements in its domain;g) connections between and among multiple representations of functions using verbal descriptions, tables, equations, and graphs;h) end behavior;i) vertical and horizontal asymptotes;j) inverse of a function; andk) composition of functions, algebraically and graphically.
Understanding the Standard Essential Knowledge and Skills
The domain of a function may be restricted algebraically, graphically, or by the practical situation modeled by a function.
Discontinuous domains and ranges include those with removable (holes) and nonremovable (asymptotes) discontinuities.
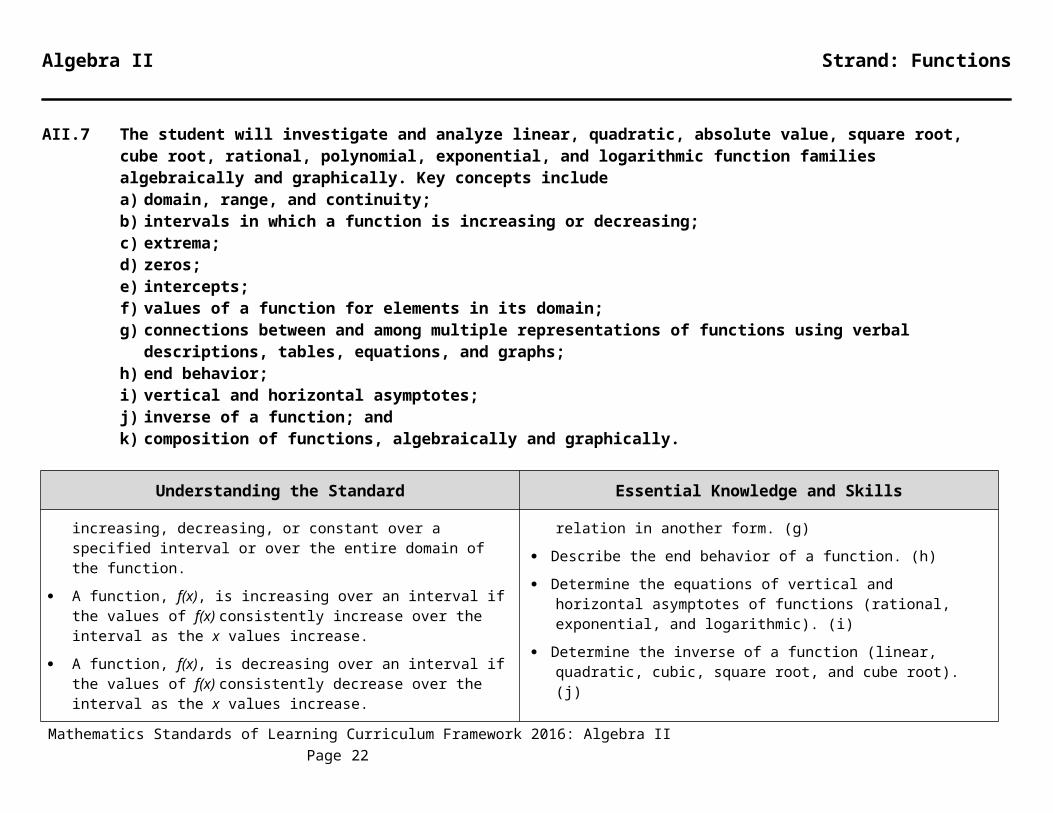
A function can be described on an interval as increasing, decreasing, or constant over a specified interval or over the entire domain of the function.
A function, f(x), is increasing over an interval if the values of f(x) consistently increase over the interval as the x values increase.
A function, f(x), is decreasing over an interval if the values of f(x) consistently decrease over the interval as the x values increase.
A function, f(x), is constant over an interval if the values of f(x) remain constant over the interval as the x values increase.
a graphing utility. (c)
For any x value in the domain of f, determine f(x). (f)
Represent relations and functions using verbal descriptions, tables, equations, and graphs. Given one representation, represent the relation in another form. (g)
Describe the end behavior of a function. (h)
Determine the equations of vertical and horizontal asymptotes of functions (rational, exponential, and logarithmic). (i)
Determine the inverse of a function (linear, quadratic, cubic, square root, and cube root). (j)
Graph the inverse of a function as a reflection over the line y = x. (j)
Determine the composition of two functions algebraically and graphically. (k)
Mathematics Standards of Learning Curriculum Framework 2016: Algebra II Page 13
Algebra II Strand: Functions
AII.7 The student will investigate and analyze linear, quadratic, absolute value, square root, cube root, rational, polynomial, exponential, and logarithmic function families algebraically and graphically. Key concepts includea) domain, range, and continuity;b) intervals in which a function is increasing or decreasing;c) extrema;d) zeros;e) intercepts;f) values of a function for elements in its domain;g) connections between and among multiple representations of functions using verbal descriptions, tables, equations, and graphs;h) end behavior;i) vertical and horizontal asymptotes;j) inverse of a function; andk) composition of functions, algebraically and graphically.
Understanding the Standard Essential Knowledge and Skills
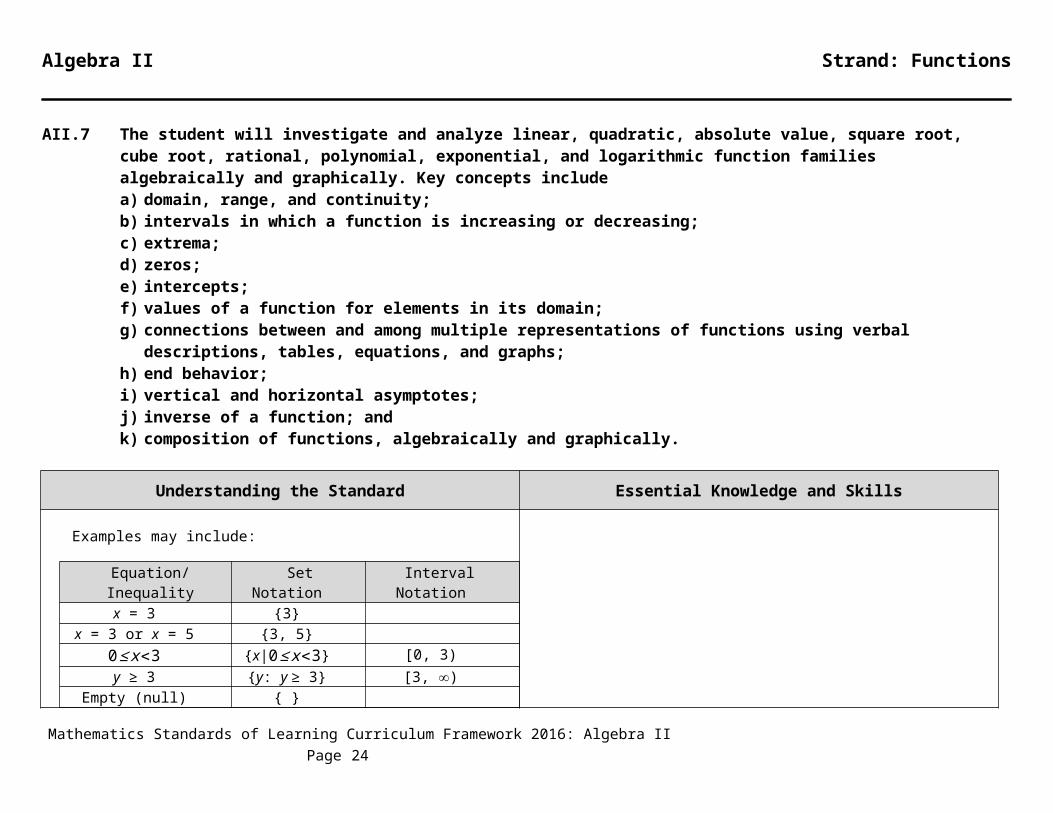
Solutions and intervals may be expressed in different formats, including set notation, using equations and inequalities, or interval notation. Examples may include:
Equation/Inequality Set Notation Interval Notationx = 3 {3}
x = 3 or x = 5 {3, 5}0≤ x<3 {x|0≤ x<3} [0, 3)
y ≥ 3 {y: y ≥ 3} [3, )Empty (null) set ∅ { }
A function, f, has an absolute maximum located at x = a if f(a) is the largest value of f over its domain.
A function, f, has an absolute minimum located at x = a if f(a) is the
Investigate and analyze characteristics and multiple representations of functions with a graphing utility. (a, b, c, d, e, f, g, h, i, j, k)
Mathematics Standards of Learning Curriculum Framework 2016: Algebra II Page 14

Algebra II Strand: Functions
AII.7 The student will investigate and analyze linear, quadratic, absolute value, square root, cube root, rational, polynomial, exponential, and logarithmic function families algebraically and graphically. Key concepts includea) domain, range, and continuity;b) intervals in which a function is increasing or decreasing;c) extrema;d) zeros;e) intercepts;f) values of a function for elements in its domain;g) connections between and among multiple representations of functions using verbal descriptions, tables, equations, and graphs;h) end behavior;i) vertical and horizontal asymptotes;j) inverse of a function; andk) composition of functions, algebraically and graphically.
Understanding the Standard Essential Knowledge and Skills
smallest value of f over its domain.
Relative maximum points occur where the function changes from increasing to decreasing.
A function, f, has a relative maximum located at x = a over some open interval of the domain if f(a) is the largest value of f on the interval.
Relative minimum points occur where the function changes from decreasing to increasing.
A function, f, has a relative minimum located at x = a over some open interval of the domain if f(a) is the smallest value of f on the interval.
A value x in the domain of f is an x-intercept or a zero of a function f if and only if f(x) = 0.
Given a polynomial function f(x), the following statements are equivalent for any real number, k, such that f(k) = 0:
- k is a zero of the polynomial function f(x) located at (k, 0);
Mathematics Standards of Learning Curriculum Framework 2016: Algebra II Page 15
Algebra II Strand: Functions
AII.7 The student will investigate and analyze linear, quadratic, absolute value, square root, cube root, rational, polynomial, exponential, and logarithmic function families algebraically and graphically. Key concepts includea) domain, range, and continuity;b) intervals in which a function is increasing or decreasing;c) extrema;d) zeros;e) intercepts;f) values of a function for elements in its domain;g) connections between and among multiple representations of functions using verbal descriptions, tables, equations, and graphs;h) end behavior;i) vertical and horizontal asymptotes;j) inverse of a function; andk) composition of functions, algebraically and graphically.
Understanding the Standard Essential Knowledge and Skills
- k is a solution or root of the polynomial equation f(x) = 0;- the point (k, 0) is an x-intercept for the graph of f(x) = 0; and- (x – k) is a factor of f(x).
Connections between multiple representations (graphs, tables, and equations) of a function can be made.
End behavior describes the values of a function as x approaches positive or negative infinity.
If (a, b) is an element of a function, then (b, a) is an element of the inverse of the function.
The reflection of a function over the line y=x represents the inverse of the reflected function.
A function is invertible if its inverse is also a function. For an inverse of a function to be a function, the domain of the function may need to be
Mathematics Standards of Learning Curriculum Framework 2016: Algebra II Page 16
Algebra II Strand: Functions
AII.7 The student will investigate and analyze linear, quadratic, absolute value, square root, cube root, rational, polynomial, exponential, and logarithmic function families algebraically and graphically. Key concepts includea) domain, range, and continuity;b) intervals in which a function is increasing or decreasing;c) extrema;d) zeros;e) intercepts;f) values of a function for elements in its domain;g) connections between and among multiple representations of functions using verbal descriptions, tables, equations, and graphs;h) end behavior;i) vertical and horizontal asymptotes;j) inverse of a function; andk) composition of functions, algebraically and graphically.
Understanding the Standard Essential Knowledge and Skills
restricted.
Exponential and logarithmic functions are inverses of each other.
Functions can be combined using composition of functions.
Two functions, f(x) and g(x), are inverses of each other if f(g(x)) = g(f(x)) = x.
AII.8 The student will investigate and describe the relationships among solutions of an equation, zeros of a function, x-intercepts of a graph, and factors of a polynomial expression.
Understanding the Standard Essential Knowledge and Skills
Mathematics Standards of Learning Curriculum Framework 2016: Algebra II Page 17
Algebra II Strand: Functions
The Fundamental Theorem of Algebra states that, including complex and repeated solutions, an nth degree polynomial equation has exactly n roots (solutions).
Solutions of polynomial equations may be real, imaginary, or a combination of real and imaginary.
Imaginary solutions occur in conjugate pairs.
Given a polynomial function f(x), the following statements are equivalent for any real number k, such that f(k) = 0:
- k is a zero of the polynomial function f(x) located at (k, 0);- k is a solution or root of the polynomial equation f(x) = 0;- the point (k, 0) is an x-intercept for the graph of polynomial
f(x) = 0; and- (x – k) is a factor of polynomial f(x).
Polynomial equations may have fewer distinct roots than the order of the polynomial. In these situations, a root may have “multiplicity.” For instance, the polynomial equation y=x3−6x2+9 x has two identical factors, (x−3), and one other factor, x. This polynomial equation has two distinct, real roots, one with a multiplicity of 2.
The student will use problem solving, mathematical communication, mathematical reasoning, connections, and representations to
Define a polynomial function in factored form, given its zeros.
Determine a factored form of a polynomial expression from the x-intercepts of the graph of its corresponding function.
For a function, identify zeros of multiplicity greater than 1 and describe the effect of those zeros on the graph of the function.
Given a polynomial equation, determine the number and type of solutions.
Mathematics Standards of Learning Curriculum Framework 2016: Algebra II Page 18
Algebra II Strand: Statistics
AII.9 The student will collect and analyze data, determine the equation of the curve of best fit in order to make predictions, and solve practical problems, using mathematical models of quadratic and exponential functions.
Understanding the Standard Essential Knowledge and Skills
Data and scatterplots may indicate patterns that can be modeled with an algebraic equation.
The curve of best fit for the relationship among a set of data points can be used to make predictions where appropriate.
Knowledge of transformational graphing using parent functions can be used to verify a mathematical model from a scatterplot that approximates the data.
Graphing utilities can be used to collect, organize, represent, and generate an equation of a curve of best fit for a set of data.
Data that fit quadratic ( y=ax2+bx+c), and exponential ( y=abx) models arise from practical situations.
Rounding that occurs during intermediate steps of problem solving may reduce the accuracy of the final answer.
Evaluation of the reasonableness of a mathematical model of a practical situation involves asking questions including:
- “Is there another curve (quadratic or exponential) that better fits the data?”
- “Does the curve of best fit make sense?”- “Could the curve of best fit be used to make reasonable
predictions?”
The student will use problem solving, mathematical communication, mathematical reasoning, connections, and representations to
Determine an equation of the curve of best fit, using a graphing utility, given a set of no more than 20 data points in a table, graph, or practical situation.
Make predictions, using data, scatterplots, or the equation of the curve of best fit.
Solve practical problems involving an equation of the curve of best fit.
Evaluate the reasonableness of a mathematical model of a practical situation.
Mathematics Standards of Learning Curriculum Framework 2016: Algebra II Page 19
Algebra II Strand: Statistics
AII.10 The student will represent and solve problems, including practical problems, involving inverse variation, joint variation, and a combination of direct and inverse variations.
Understanding the Standard Essential Knowledge and Skills
Practical problems can be represented and solved by using direct variation, inverse variation, joint variation, and a combination of direct and inverse variations.
A direct variation represents a proportional relationship between two quantities. The statement “y is directly proportional to x” is translated as y = kx.
The constant of proportionality (k) in a direct variation is represented by the ratio of the dependent variable to the independent variable and can be referred to as the constant of variation.
A direct variation can be represented by a line passing through the origin.
An inverse variation represents an inversely proportional relationship between two quantities. The statement “y is inversely proportional to x” is translated as y = .
The constant of proportionality (k) in an inverse variation is represented by the product of the dependent variable and the independent variable and can be referred to as the constant of variation.
The graph of an inverse variation is a rational function.
Joint variation is a combination of direct variations. The statement “y varies jointly as x and z” is translated as y = kxz.
The value of the constant of proportionality is typically positive when applied in practical situations.
The student will use problem solving, mathematical communication, mathematical reasoning, connections, and representations to
Given a data set or practical situation, write the equation for an inverse variation.
Given a data set or practical situation, write the equation for a joint variation.
Solve problems, including practical problems, involving inverse variation, joint variation, and a combination of direct and inverse variations.
Mathematics Standards of Learning Curriculum Framework 2016: Algebra II Page 20

Algebra II Strand: Statistics
AII.11 The student willa) identify and describe properties of a normal distribution;b) interpret and compare z-scores for normally distributed data; andc) apply properties of normal distributions to determine probabilities associated with areas under the standard normal curve.
Understanding the Standard Essential Knowledge and Skills
The focus of this standard is on the interpretation of descriptive statistics, z-scores, probabilities, and their relationship to the normal curve in the context of a data set.
Descriptive statistics include measures of center (mean, median, mode) and dispersion or spread (variance and standard deviation).
Variance (σ 2) and standard deviation (σ) measure the spread of data about the mean in a data set.
Standard deviation is expressed in the original units of measurement of the data.
The greater the value of the standard deviation, the further the data tends to be dispersed from the mean.
In order to develop an understanding of standard deviation as a measure of dispersion (spread), students should have experiences analyzing the formulas for and the relationship between variance and standard deviation.
A normal distribution curve is the family of symmetrical, bell-shaped curves defined by the mean and the standard deviation of a data set. The arithmetic mean (μ) is located on the line of symmetry of the curve and is approximately equivalent to the median and mode of the data set.
The normal curve is a probability distribution and the total area under the curve is 1.
The student will use problem solving, mathematical communication, mathematical reasoning, connections, and representations to
Identify the properties of a normal distribution. (a)
Describe how the standard deviation and the mean affect the graph of the normal distribution. (a)
Solve problems involving the relationship of the mean, standard deviation, and z-score of a normally distributed data set. (b)
Compare two sets of normally distributed data using a standard normal distribution and z-scores, given the mean and standard deviation. (b)
Represent probability as area under the curve of a standard normal distribution. (c)
Use the graphing utility or a table of Standard Normal Probabilities to determine probabilities associated with areas under the standard normal curve. (c)
Use a graphing utility to investigate, represent, and determine relationships between a normally distributed data set and its descriptive statistics. (a, b, c)
Mathematics Standards of Learning Curriculum Framework 2016: Algebra II Page 21
Algebra II Strand: Statistics
AII.11 The student willa) identify and describe properties of a normal distribution;b) interpret and compare z-scores for normally distributed data; andc) apply properties of normal distributions to determine probabilities associated with areas under the standard normal curve.
Understanding the Standard Essential Knowledge and Skills
For a normal distribution, approximately 68 percent of the data fall within one standard deviation of the mean, approximately 95 percent of the data fall within two standard deviations of the mean, and approximately 99.7 percent of the data fall within three standard deviations of the mean. This is often referred to as the Empirical Rule or the 68-95-99.7 rule.
NOTE: This chart illustrates percentages that correspond to subdivisions in one standard deviation increments. Percentages for
other subdivisions require the table of Standard Normal Probabilities or a graphing utility.
The mean and standard deviation of a normal distribution affect the location and shape of the curve. The vertical line of symmetry of the normal distribution falls at the mean. The greater the standard deviation,
Mathematics Standards of Learning Curriculum Framework 2016: Algebra II Page 22
2.35% 2.35%

Algebra II Strand: Statistics
AII.11 The student willa) identify and describe properties of a normal distribution;b) interpret and compare z-scores for normally distributed data; andc) apply properties of normal distributions to determine probabilities associated with areas under the standard normal curve.
Understanding the Standard Essential Knowledge and Skills
the wider (“flatter” or “less peaked”) the distribution of the data.
A z-score derived from a particular data value tells how many standard deviations that data value falls above or below the mean of the data set. It is positive if the data value lies above the mean and negative if the data value lies below the mean.
A standard normal distribution is the set of all z-scores. The mean of the data in a standard normal distribution is 0 and the standard deviation is 1. This allows for the comparison of unlike normal data.
The table of Standard Normal Probabilities and graphing utilities may be used to determine normal distribution probabilities.
Given a z-score (z), the table of Standard Normal Probabilities (z-table) shows the area under the curve to the left of z. This area represents the proportion of observations with a z-score less than the one specified. Table rows show the z-score’s whole number and tenths place. Table columns show the hundredths place.
Graphing utilities can be used to represent a normally distributed data set and explore relationships between the data set and its descriptive statistics.
Mathematics Standards of Learning Curriculum Framework 2016: Algebra II Page 23
Algebra II Strand: Statistics
AII.12 The student will compute and distinguish between permutations and combinations.
Understanding the Standard Essential Knowledge and Skills
The Fundamental Counting Principle states that if one decision can be made n ways and another can be made m ways, then the two decisions can be made nm ways.
A permutation is the number of possible ways to arrange a group of objects without repetition and when order matters (e.g., the outcome 1, 2, 3 is different from the outcome 3, 2, 1 when order matters; therefore, both arrangements would be included in the possible outcomes).
A combination is the number of possible ways to select or arrange objects when there is no repetition and order does not matter (e.g., the outcome 1, 2, 3 is the same as the outcome 3, 2, 1 when order does not matter; therefore, both arrangements would not be included in the possible outcomes).
The student will use problem solving, mathematical communication, mathematical reasoning, connections, and representations to
Compare and contrast permutations and combinations.
Calculate the number of permutations of n objects taken r at a time.
Calculate the number of combinations of n objects taken r at a time.
Use permutations and combinations as counting techniques to solve practical problems.
Calculate and verify permutations and combinations using a graphing utility.
Mathematics Standards of Learning Curriculum Framework 2016: Algebra II Page 24