standard problem exercise (spe) …€¦ · performance of containmentperformance of containment...
TRANSCRIPT

SPE-meeting Phase 1, Washington DC 2011-04-13Scanscot StudiesSca scot Stud es
STANDARD PROBLEM EXERCISE (SPE)
PERFORMANCE OF CONTAINMENTPERFORMANCE OF CONTAINMENT VESSEL UNDER SEVERE ACCIDENT
CODITION

Project Scanscot organization
Patrick Anderson Co ordination etc Patrick Anderson Co-ordination, etc. Björn Svärd Model 1, tendon study Oskar Elison Model 2 and 3 liner study Oskar Elison Model 2 and 3, liner study Torulf Nilsson Failure criteria
Ola Jovall Initial planning, reviewing Jan-Anders Larsson Advising Jan Anders Larsson Advising
Financiers Swedish Radiation Safety Authority (SSM) and Swedish /
Finnish nuclear power industry
SPE meeting, 11-04-13
p y

Overview
Scope
Scanscot SPE studies General Prestressing tendon behavior Global containment response Liner behavior near equipment hatch Influence of structural parameter variation
Conclusions
SPE meeting, 11-04-13

Scope Four different studiesStudy 1 Explain the interaction between horizontal tendons and theStudy 1 Explain the interaction between horizontal tendons and the
containment structure. FE-model describing a horizontal slice of containment wall. (Model 1)
Study 2 Global structural response with focus on the behavior near the equipment hatch (penetration E/H). FE-model describing the whole containment model, refined in E/H region. (Model 2 and 3), g ( )
Study 3 Detailed behavior of the steel liner near the equipment hatch. FE-model describing the steel liner and the interaction with the concrete structure. (Model 2)
Study 4 Variation in input data and influence on containment structural b h i F i th l b l i f th t i tbehavior. Focus is on the global expansion of the containment. (SPE 1.5)
SPE meeting, 11-04-13

SPE studies G l
Model 1
General Model 2 and 3
Global model, refined in E/H region
Midheigth horizontal slize model
Liner submodel, restrained by global model
SPE meeting, 11-04-13
Liner submodel, restrained by global model

SPE studies G l
FE-programGl b l d l Ab E li it
General
Global model: Abaqus Explicit Liner model: Abaqus Standard
Material models Material models Concrete: Brittle cracking (linear compression, non-linear tension) Steel: Plastic with hardeningg
FE-models Concrete: Solid elements Reinforcement: Shell elements, orthotropic, embedded Liner: Shell elements
Tendons: Bar elements (one by one)
Input”b t ti t ”
SPE meeting, 11-04-13
”best estimate”
SPE studiesPrestressing tendon behavior (Model 1)
SPE meeting, 11-04-13

SPE studiesPrestressing tendon behavior (Model 1)
FE-program Abaqus Explicit
Material models Concrete: Brittle cracking Steel: Plastic with hardening
FE d l FE-model Concrete: Solid elements Reinforcement: rebar layer embedded Reinforcement: rebar layer, embedded Liner: Shell elements
Tendons: Truss elements (one by one) Tendons: Truss elements (one by one)
Input ”best estimate” from material test
SPE meeting, 11-04-13
SPE studies
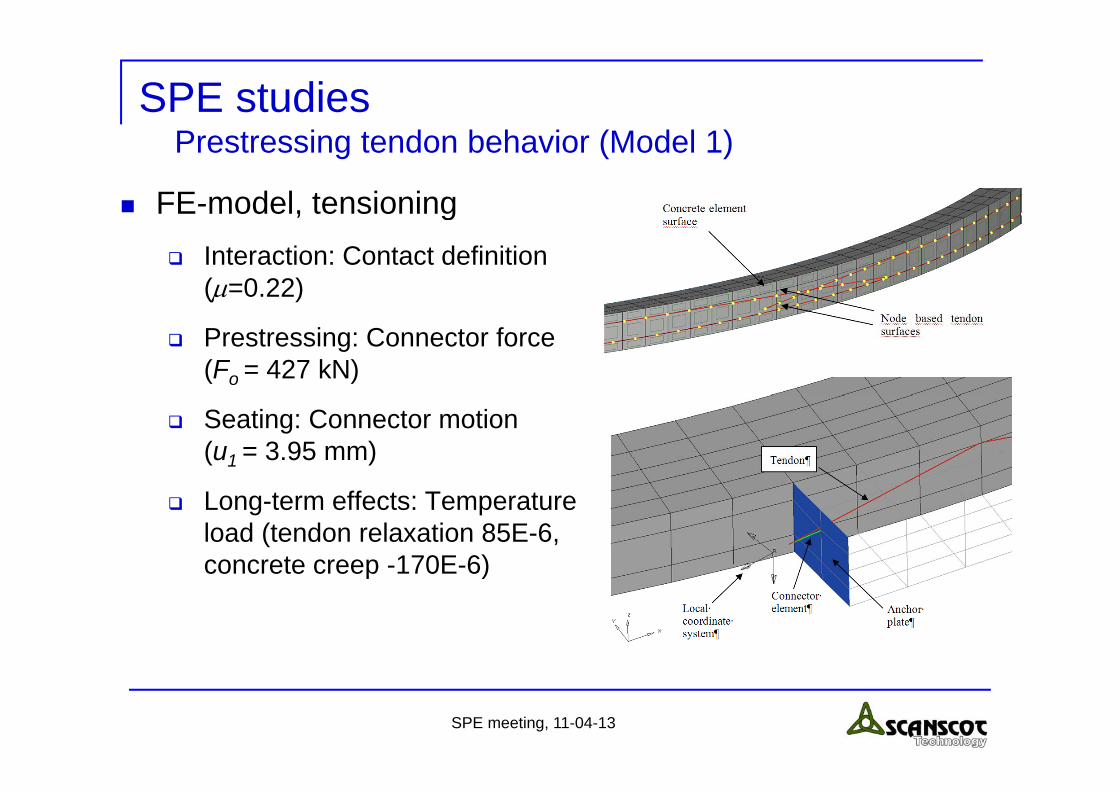
FE-model, tensioning
Prestressing tendon behavior (Model 1)
, g Interaction: Contact definition
(=0.22)
Prestressing: Connector force (Fo = 427 kN)
Seating: Connector motion (u1 = 3.95 mm)
Long-term effects: Temperature load (tendon relaxation 85E-6, concrete creep -170E-6)p )
SPE meeting, 11-04-13

SPE studies
Results, tendon force after prestressing
Prestressing tendon behavior (Model 1)
g
Force in tendon A A spännkabel A och B
SPE meeting, 11-04-13

SPE studies Prestressing tendon behavior (Model 1)
Results, tendon force at increasing pressure
Yield
g
Force in tendon A Average force tendon A and B
SPE meeting, 11-04-13

SPE studies Prestressing tendon behavior (Model 1)
Results, tendon anchor force and tangential slipg
Force in tendon at anchorage3D-model: Average tendon 52 to 68Measurments: Average 53,58,63 and 67
Tangential slip
SPE meeting, 11-04-13

SPE studier Liner near equipment hatch (Model 2)
SPE meeting, 11-04-13

SPE studier Liner near equipment hatch (Model 2)
FE-model, general Concrete structure
described by global model, refined in E/H region (tie)refined in E/H region (tie)
Steel liner described by submodel guided bysubmodel guided by displacement in global model
FE Global model (Model 3) FE-program Global model: Abaqus
Explicit
Li b d l (M d l 2)
Explicit Liner model: Abaqus
Standard
SPE meeting, 11-04-13
Liner submodel (Model 2)

SPE studier
FE-model, interaction Liner near equipment hatch (Model 2)
Vertical anchors: Connector elements, in-plane shear stiffness, normal-plan rigid
Horizontal stiffeners: Connector and shell elements, in-plane shear stiffness, normal-plan ”free”
Contact definition between liner and concrete
Region for liner submodel
*connectors highlighted in ello
SPE meeting, 11-04-13
Liner FE-model *connectors highlighted in yellow

SPE studier Liner near equipment hatch (Model 2)
FE-model, interaction
Shell elements, all nodes guided by the inner surface in global model
Connectors elements, describing shear stiffness* Mesh size liner model describing shear stiffness in vertical T-anchors and horizontal stiffeners(normal stiffness, rigid)
Mesh size liner model ~ 15 mm
Shell elements, describing
Contact definition, describing interactionbetween liner and concrete (no friction)
gliner steel plate
(Inner surface, pressure load)Liner element boundary, fix connection to concrete elements
SPE meeting, 11-04-13

SPE studier Liner near equipment hatch (Model 2)
Results, concrete strain and contact
Gap
Concrete hoop strain at 3.3 pd (1.29 MPa ). Contact opening between liner and concrete at 3.3 pd (1.29 MPa )*White color, separation between liner and concrete
SPE meeting, 11-04-13

SPE studier
Results, liner strain 0o
324o
Liner near equipment hatch (Model 2)
0o
Detected tears in liner after LST
5 7%
5.7%
5.7%
Gap
Liner hoop strain in at 3.3 Pd (1.29 MPa )
Hoop strain at 3.3 Pd (1.29 MPa )*High tensile strain on inside of bendline
Gap~ 0.8%
Non considered strain localisation– Grinding of welds, 50% of thickness
Discrete concrete cracks / friction
Elevated liner hoop strain – Vertical bend line, flexural
Regions where reinf is reduced
SPE meeting, 11-04-13
– Discrete concrete cracks / friction– Regions where reinf. is reduced

SPE studier Liner near equipment hatch (Model 2)
Results, concrete cracking
Initial cracking in E/H region at 1.33 Pd (0.52 Mpa) Initial through-wall cracking 1.38 Pd (0.54 Mpa)
SPE meeting, 11-04-13

SPE studier Liner near equipment hatch (Model 2)
Results, tendon stress and strainTendon elements exceeding 1% strain
Tendon no 69
Tendon strain exceeding 1% at 3.4 pd (1.32 MPa ) Tendon stress in E/H region for tendon no 69
SPE meeting, 11-04-13

SPE studies Global containment response (Model 3)
SPE meeting, 11-04-13

SPE studies Global containment response (Model 3)
FE-model
Tendons
Concrete
Reinforcement
SPE meeting, 11-04-13
Liner

SPE studies
FE-model, tendon interaction Global containment response (Model 3)
SPE meeting, 11-04-13

SPE studies
Results, radial displacementGlobal containment response (Model 3)
Red curve: 0×PdGreen curves: [1, 1.5, 2, 2.5, 3, 3.3, 3.4]×PdBlack curve: 3.62×Pd ~SFMTBlack curve: 3.62 Pd SFMT
Displacemnt at 324o (E/H) Average displacemnt at elevation 4.7 m (E/H)Displacemnt at 324 (E/H) g p ( )
SPE meeting, 11-04-13

SPE studies
Results, concrete hoop crackingGlobal containment response (Model 3)
Initial cracking(1.23Pd , 0.48 MPa)
Initial through-wall cracking(1.38Pd , 0.54 MPa)
~ All regions cracked(1.92Pd , 0.75 MPa)
Over 2Pd concrete stress ~ 0 in general parts of the cylinder wall
SPE meeting, 11-04-13

SPE studies
Results, tendon force at before seatingGlobal containment response (Model 3)
Grey curves: tendon forces in each individual tendonBlue curve: mean tendon force, anchoring at 90° azimuthRed curve: mean tendon force, anchoring at 270° azimuth
Force in all hoop tendons in the cylinder wallE/H E/HA/L
Side view, all hoop tendons
SPE meeting, 11-04-13

SPE studies
Results, tendon force after seating Global containment response (Model 3)
Grey curves: tendon forces in each individual tendonBlue curve: mean tendon force, anchoring at 90° azimuthRed curve: mean tendon force, anchoring at 270° azimuth
Force in all hoop tendons in the cylinder wallE/H E/HA/L
Side view, all hoop tendons
SPE meeting, 11-04-13

SPE studies
Results, average force at increasing pressureGlobal containment response (Model 3)
Average forceAverage force level 6.4 to 9.9 m
Red curve: 0×PdGreen curves: [1, 1.5, 2, 2.5, 3, 3.3, 3.4]×PdBlack curve: 1.41 MPa
Average force level 2.8 to 6.3 m
Side view, all hoop tendons
SPE meeting, 11-04-13

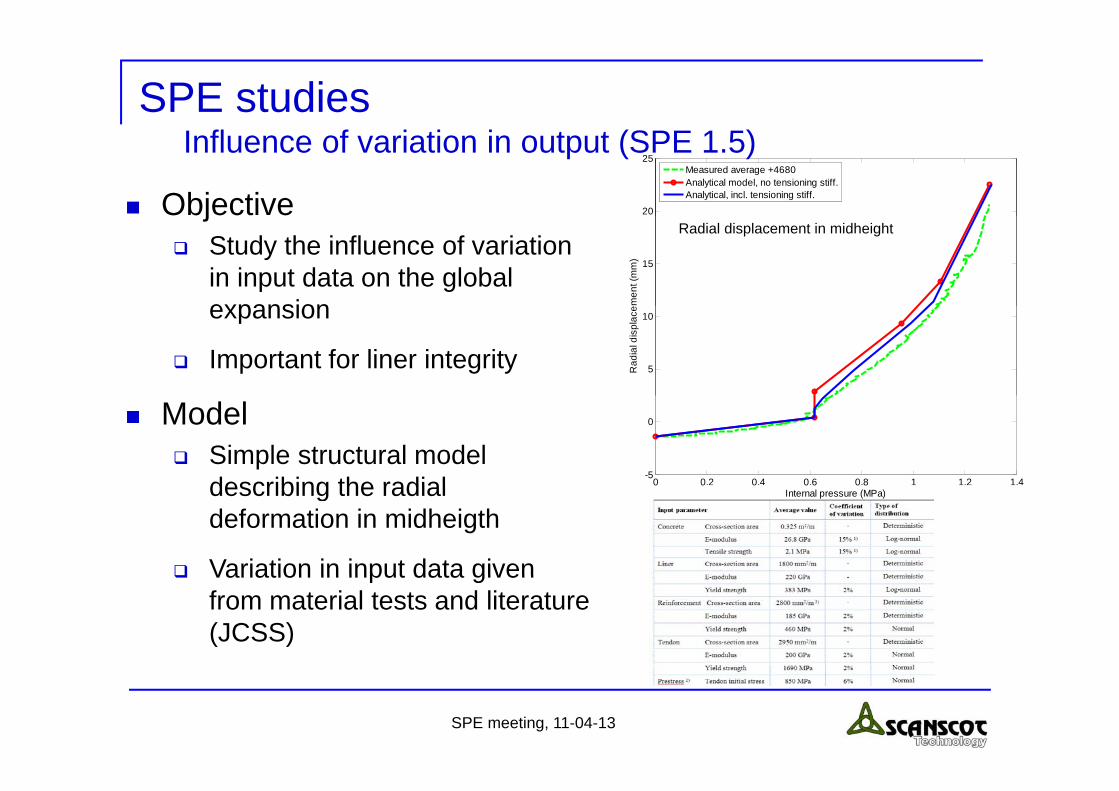
SPE studies Influence of variation in output (SPE 1.5)
SPE meeting, 11-04-13
SPE studies
20
25
Measured average +4680Analytical model, no tensioning stiff.Analytical, incl. tensioning stiff.
Objective
Influence of variation in output (SPE 1.5)
15
men
t (m
m)
Radial displacement in midheightj
Study the influence of variation in input data on the global expansion
5
10
Rad
ial d
ispl
aceexpansion
Important for liner integrity
0 0.2 0.4 0.6 0.8 1 1.2 1.4-5
0
Model Simple structural model
describing the radial 0 0 0 0 6 0 8Internal pressure (MPa)describing the radial
deformation in midheigth
Variation in input data given Variation in input data given from material tests and literature (JCSS)
SPE meeting, 11-04-13

SPE studies
20
25
Results, statistical variationInfluence of variation in output (SPE 1.5)
-Red solid line: Average input-Green dashed line: Nominal -Black dashed lines: Randomly
l t d
15
emen
t (m
m) Large number of analyses with
randomly selected input (Monte Carlo simulation)
selected
Critical region
5
10
Rad
ial d
ispl
aceCarlo simulation)
Nominal values differs mainly in steel yield limits
gfor liner
0 0.2 0.4 0.6 0.8 1 1.2 1.4-5
0
y
Load level critical for liner integrity, COV ~ 7.5%
Internal pressure (MPa)
0.6
0.7
0.8
0.9
1
cy
COV=7.3 %
Pressure=1.25 MPa
Mean=20.9 mm
N=10000
95% fid 23 4
std=1.53mm
Global displacement in midheigthfits to normal distribution
0.1
0.2
0.3
0.4
0.5
Freq
uenc 95% confidence =23.4mm
5% confidence =18.3mm
SPE meeting, 11-04-13
14 16 18 20 22 24 26 280
displacement (mm)

SPE studier Influence of variation in output (SPE 1.5)
Results, statistical variation
Originates mainly from variation in prestress
SPE meeting, 11-04-13