standard problem exercise no. 3 phase twostandard problem exercise no. 3 model 4 – case 1 and 2...
TRANSCRIPT

Standard Problem Exercise No. 3
Phase Two
March 27, 2012
Herman Graves
Madhumita Sircar
Lili Akin
Robert Dameron
Christopher Jones
Sandia National Laboratories is a multi-program laboratory managed and operated by Sandia Corporation,
a wholly owned subsidiary of Lockheed Martin Corporation, for the U.S. Department of Energy’s
National Nuclear Security Administration under contract DE-AC04-94AL85000.

Agenda
2
Tuesday, March 27, 2012
Time Topic Speaker
8:30 Meet at Building Lobby for
Badging and Security
9:30 Opening Remarks / Welcome
Address NRC / AERB
9:45 Overview of Model 4 – Case 1
and 2
NRC / SNL /
M&N
10:00 Model 4 Case 1 Presentations All Participants
12:00 Group Photo
12:15 Lunch – NRC Cafeteria
1:00 Case 1 – Comparison of Results
NRC / SNL /
M&N
1:30 Case 1 – Panel Discussion All Participants
2:30 Break All Participants
2:45 Model 4 Case 2 Presentations All Participants
4:45 Adjourn
Wednesday, March 28, 2012
Time Topic Speaker
8:30 Meet at Building Lobby for Badging
and Security
9:00 Model 4 Case 2 Comparisons
NRC / SNL /
M&N
9:30 Model 4 Case 2 Panel Discussion All Participants
10:30 Break
10:45 Leakage Rate Problem Definition
NRC / SNL /
M&N / AERB
11:00 Leakage Rate Presentations By
Participants All Participants
12:00 Lunch – NRC Cafeteria
1:00 Leakage Rate Presentations By
Participants (continued) All Participants
2:00 Leakage Rate Panel Discussion All Participants
3:30 Discussion of Transition to
Probabilistic Space
NRC / SNL /
M&N
4:00 Probabilistic Space Presentations All Participants
4:45 Adjourn

Agenda
3
Thursday, March 29, 2012
Time Topic Speaker
8:30 Meet at Building Lobby for Badging and
Security
9:00 Probabilistic Space Presentations
(Continued) All Participants
10:30 Probabilistic Space Panel Discussion Participants
11:30 Discussion of In-Situ Vs Design (If
Applicable) Participants
12:00 Projects of Interest to Panel NRC / SNL
12:15 Discussion of Future Work (Publications,
Results sent in, Next Workshop) All Participants
12:45 Adjourn

Standard Problem Exercise No. 3
Phase One Overview
March 27, 2012
Herman Graves
Madhumita Sircar
Lili Akin
Robert Dameron
Christopher Jones

Model 1 Summary
• Model 1: Tendon Behavior
Model
– Investigate Tendon Forces
as a Function of
Containment Dilation
– Use Friction Models to
Represent Slippage of
Prestressing Cables
– Pressure and
Pressure/Temperature
Analyses Completed
5

Model 1 Results
• Milestones:
1. Concrete Hoops
Stress Equals 0
2. Concrete Hoop
Cracking Occurs
3. Tendon A
Reaches 1% Strain
4. Tendon B
Reaches 1% Strain
5. Tendon A
Reaches 2% Strain
6. Tendon B
Reaches 2% Strain
6
0.0
0.2
0.4
0.6
0.8
1.0
1.2
1.4
1.6
1 2 3 4 5 6
Pre
ssure
(M
Pa)
Milestone
Comparison of Pressure Milestones at 135o Azimuth
NRC
SCANSCOT
FORTUM
EDF/NECS
GRS

Model 1 Results
• Example of Tendon Stress Distribution
7
0
200
400
600
800
1000
1200
1400
1600
1800
2000
-270 -240 -210 -180 -150 -120 -90 -60 -30 0 30 60 90
Str
ess
(M
Pa)
Azimuth (Deg)
Tendon Stress Distribution at 2.5 x Pd
NRC - 2.5 x Pd
SCANSCOT - 2.5 x Pd
FORTUM - 2.5 x Pd
EDF/NECS - 2.5 x Pd
GRS - 2.5 x Pd

Model 2 Summary
8
• Model 2: Equipment Hatch
Model
– Effects of Containment
Dilation on Prestressing
Force
– Slippage of Prestressing
Cables
– Steel-Concrete Interface
– Fracture Mechanics Behavior
– Ovalization of Concrete vs
Steel
– Pressure Only Analysis

Model 2 Results
Pressure Milestones:
1. Concrete Hoop
Cracking Occurs
2. Tendon Reaches
1% Strain
9
0
0.2
0.4
0.6
0.8
1
1.2
1.4
1.6
0 1 2 3
Pre
ssu
re (
MP
a)
MIlestone #
Comparison of Pressure Milestones
NRC
GRS
AERB
SCANSCOT

Model 2 Results
10
-0.001
0
0.001
0.002
0.003
0.004
0.005
0.006
0.007
0.008
0.009
0.010
.00
0
0.2
00
0.4
00
0.6
00
0.8
00
1.0
00
1.2
00
1.4
00
Str
ain
Pressure (MPa)
Liner Strain Magnitude vs Pressure - Location 1
NRC - Model 2a - Location 1
SCANSCOT - Model 2a - Location 1
GRS - Model 2a - Location 1
AERB - Model 2a - Location 1

Model 3 Summary
11
• Model 3: Detailed Global 3D
Model
– Effects of Containment
Dilation on Prestressing
Force
– Slippage of Prestressing
Cables
– Steel-Concrete Interface
– Fracture Mechanics Behavior
– Ovalization of Concrete vs
Steel
– Pressure Only Anlaysis

Model 3 Results
12
-5
0
5
10
15
20
25
30
35
40
0 0.4 0.8 1.2 1.6
Dis
pla
cem
en
ts (
mm
)
Pressure (MPa)
Displacements - SOL 4
NRC
SCANSCOT
FORTUM
AERB
LST - SOL4
SFMT - SOL 4

Model 3 Results
13
-0.005
0
0.005
0.01
0.015
0.02
0.025
0.03
0 0.4 0.8 1.2 1.6
Str
ain
Pressure (MPa)
Liner Strains - SOL 39 -h,6.2m
NRC
SCANSCOT
FORTUM
AERB
LST

Standard Problem Exercise No. 3
Model 4 – Case 1 and 2
March 27, 2012
Sandia National Laboratories is a multi-program laboratory managed and operated by Sandia Corporation,
a wholly owned subsidiary of Lockheed Martin Corporation, for the U.S. Department of Energy’s
National Nuclear Security Administration under contract DE-AC04-94AL85000.

Phase Two Overview
• Examine differences in behavior brought on by
temperature
• Estimate Leak Rates as a Function of Pressure
• Estimate Leak Rates as a Function of Pressure
and Temperature
• Transition to Probabilistic Space
15
Model 4 Overview
• Use Model 3 as a Starting Point
• Modify Model 3 as Needed
• Apply Two New Load Cases To Model 4: Cases 1 and 2
16

Case 1 – Saturated Steam
17
0.00
50.00
100.00
150.00
200.00
250.00
0.00 10.00 20.00 30.00 40.00 50.00
Time (m)
Tempe
ratu
re (C)
0.00
0.20
0.40
0.60
0.80
1.00
1.20
1.40
1.60
1.80
2.00
Press
ure (M
Pa)
Temperature Pressure

Case 1: Pressure-Temperature Relationship
18
80
100
120
140
160
180
200
220
0.0 0.2 0.4 0.6 0.8 1.0 1.2 1.4 1.6 1.8 2.0
Pressure (MPa)
Tempe
ratu
re [C]

Case 2 – Station Blackout
19

Thermal Analysis – Temp distr. From ISP48
• Model: Full-scale Axisymmetric with additional nodes throughout cylinder and dome - 12 through-thickness
• Material Properties: based on typical data
• Thermal Gradient calculation locations:
– See figure
• Boundary Conditions:
– Liner: Uniformly applied temperature; quasi-static, but transient
– Dome & Cylinder: convection to air
– Basemat/soil: conduction
• Reference:
Dameron, et. al., “Analysis of Axisymmetric Presstressed Concrete Containment Vessel (PCCV) Including Thermal Effects”, May, 2004
1
2
3
4
5
6 7 8

Case 1 Thermal Time Histories @ Section 2
0.00
50.00
100.00
150.00
200.00
250.00
0.00 10.00 20.00 30.00 40.00 50.00
Time (m)
Tempe
ratu
re (C)
0%
5%
10%
18%
25%
35%
52%
75%
100%
d/T

Case 1 Gradients @ Section 2
0.00
50.00
100.00
150.00
200.00
250.00
0% 10% 20% 30% 40% 50% 60% 70% 80% 90% 100%
d/T (%)
Tempe
ratu
re (C)
0.00
2.83
7.57
15.01
26.16
42.23
Time (m)

Case 1 Contours
VALUE, °C
-19
-1
16
32
49
66
82
99
116
132
149
166
182
200
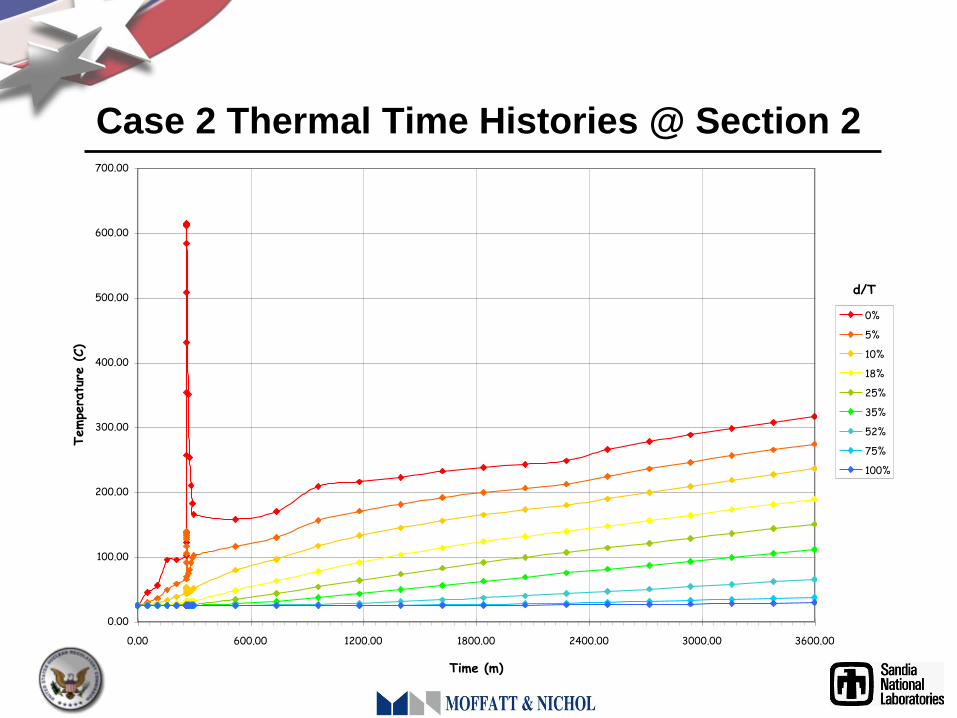
Case 2 Thermal Time Histories @ Section 2
0.00
100.00
200.00
300.00
400.00
500.00
600.00
700.00
0.00 600.00 1200.00 1800.00 2400.00 3000.00 3600.00
Time (m)
Tempe
ratu
re (C)
0%
5%
10%
18%
25%
35%
52%
75%
100%
d/T

Case 2 Gradients @ Section 2
0.00
100.00
200.00
300.00
400.00
500.00
600.00
700.00
0% 10% 20% 30% 40% 50% 60% 70% 80% 90% 100%
d/T (%)
Tempe
ratu
re (C)
0.02
104.08
260.18
260.60
261.02
268.72
284.12
299.52
959.62
1619.72
1839.83
2279.83
2940.00
3600.00
Time (m)

Case 2 Contours
VALUE, °C
-18
32
82
132
182
232
282
332
382
432
482
532
582
616

Concrete Degradation Properties at Elevated
Temperatures per Eurocode
27

Steel Degradation Properties at Elevated
Temperatures per Eurocode
28

Analysis Results
Required Output/Results for Model 4:
1. Description of Failure Prediction Model or Criteria Selected
2. Assumptions Made In Geometric Modeling / Model Description
3. Subset of response information defined by “55 standard output
locations” of 1:4 Scale PCCV round-robin;
4. Contour Plot of Peak Strains in Liner During LST at pressure
milestones: P = 0 (prestress applied); 1 x Pd; 1.5 Pd; 2 Pd; 2.5 Pd;
3 Pd; 3.3 Pd; 3.4 Pd; Ultimate Pressure
29

For direct comparison amongst participants,
also requested to plot (Using Excel)
• Liner Strain Magnitudes (Hoop Direction) at Locations Indicated in
Figure 11 (of SPE problem statement), versus pressure
• Tendon stress distribution at P = 0 (prestress applied); 1 x Pd; 1.5
Pd; 2 Pd; 2.5 Pd; 3 Pd; 3.3 Pd; 3.4 Pd; Ultimate Pressure for
– Hoop Tendons # H35, H53, H68
– Vertical Tendon # V37 and V46
– Plots of response versus pressure for Standard Output
Locations:
• 1-15 (displacements)
• 22-29 (rebar strains)
• 36-42 (liner strains)
• 48-55 (tendon strains and stresses)
(see Table 4-1 in NUREG/CR-6809 for locations of SOL’s)
30

Standard Problem Exercise No. 3
Leak Rate Problem Definition
March 28, 2012

Failure Criteria for PCCV
• From SPE Phase 1, the relevant failure criterion
for Model 1 was Tendon failure. The rebar
generally has higher ductility than the tendons,
so it is not the controlling criteria. For Models 2,
3, and 4, Tendon Failure criteria remains at 3.8%
strain as for Model 1. But for Models 3 and 4, liner
tearing is the predominate failure mode
• For SPE Phase 2, a key objective of the work is to
estimate crack size and leak area
• Based on the existing research of behavior of
steel-lined concrete containments, liner-tearing
with associated leakage is the failure mode for
slow pressurization of the containment 32

Calculate Leak Rate
• Participants are asked to develop a prediction of
leak rate as a function of pressure.
– Liner Strains
– Crack Size
– Leak Rate
• Participants shall use the functions provided by
AERB to calculate leak rate based on crack area if
they so desire
33

Liner Tears and Acoustic Events
180° 270°90°0° 62°
E/HM/S, F/WA/L
12
3
4
5
6
7
8
9
10
11
1213
B CA D E F G H I J K L A
16.125
15.716
14.551
12.807
10.750
9.230
7.730
6.200
4.680
2.630
1.430
0.2500.000
Top of
Basemat
Springline
Top of Dome
Tendon Gallery
Bottom of
Basemat
-1.175
-2.000
-3.500
Z
Free-FieldButtress Buttress
30° 60° 120° 135° 150° 210° 240° 300° 324° 330° 360°
Elevation
(meters)
(El.
ID)
Azimuth
(Az. ID)
Instr Frame Platforms
1
3
4
6
2
5
7
#14
#8
#1
#9
#2
#16
#10
#3
#4
#5 #6
#11
#15
#13
#12
#7
#17
Acoustic Events:
1: 2.4 Pd 5: 2.8 Pd
2: 2.6 Pd 6: 2.8 Pd
3: 2.7Pd 7: 3.0 Pd
4: 2.8 Pd

Liner Strain Map (see results presentation)
35

PCCV LST - Calculated Leak Rate
0.482%
0.003%
1.628%
-2.0%
-1.0%
0.0%
1.0%
2.0%
3.0%
4.0%
09
/26
/20
00
16
:00
09
/26
/20
00
20
:00
09
/27
/20
00
0:0
0
09
/27
/20
00
4:0
0
09
/27
/20
00
8:0
0
09
/27
/20
00
12
:00
Time (day/hour)
Leak R
ate
(% m
ass
/day)
Total Time (1.5 Pd) Point-to-Point (1.5 Pd)Total Time (2.0 Pd) Point-to-Point (2.0 Pd)Total Time (2.5 Pd) Point-to-Point (2.5Pd)

PCCV LST - Estimated Leak Rates (2.5-3.1 Pd)
0.0%
50.0%
100.0%
150.0%
200.0%
250.0%
300.0%
350.0%
10:0
0
11:0
0
12:0
0
13:0
0
14:0
0
15:0
0
16:0
0
Time (hour)
Leak R
ate
(% m
ass
/day)
Total Time Point-to-Point
2.5 Pd
2.55 Pd 2.6 2.65
2.7 2.752.8
2.852.90
2.95
3.0
3.1 Pd

PCCV LST - Calculated Leak Rate
56.7%
391.1%
585.4%
27.3%
851.83%
0.0%
100.0%
200.0%
300.0%
400.0%
500.0%
600.0%
700.0%
800.0%
900.0%
09
/27
/20
00
12
:00
09
/27
/20
00
16
:00
09
/27
/20
00
20
:00
09
/28
/20
00
0:0
0
09
/28
/20
00
4:0
0
09
/28
/20
00
8:0
0
09
/28
/20
00
12
:00
09
/28
/20
00
16
:00
09
/28
/20
00
20
:00
09
/29
/20
00
0:0
0
09
/29
/20
00
4:0
0
09
/29
/20
00
8:0
0
Time (day/hour)
Leak R
ate
(% m
ass
/day)
Total Time Point-Point
Leak Rate @ 170 psig
Terminal Leak Rate @ 180 psig

Leak Rate as a Function of Crack Size
• See Presentation by AERB
39

Standard Problem Exercise No. 3
Transition to Probabilistic Space
Problem Definition
March 28, 2012

Probabilistic Space
41

Standard Problem Exercise No. 3
42
Projects of Interest
March 29, 2012

Projects of Interest
NRC / SNL Projects:
43
Degraded containment research
• Detailed submodeling – Global boundary conditions
– Refined mesh
– Additional detail
– XFEM
• Plant specific investigation – Forensic analysis
– Computational reconstruction
Grouted Tendon Study • Behavior
• Monitoring
• Corrosion

Projects of Interest
• Insert Slides from NRC here
44

Standard Problem Exercise No. 3
Future Work
March 29, 2012
45

Future Work
• NUREG Publication of Phase One and Phase Two
Reports
• Follow Up Workshop?
• Additional Publications?
46