standard explanatory data definitions - adb.org” persons with an enterprise, which may be a...
TRANSCRIPT

March 2014
Standard Explanatory Data Definitions
For Inquiries: X. Fan, Strategy and Policy Department
(Ext. 6850)
M. Bezemer, Strategy and Policy Department
(Ext. 5845)


ABBREVIATIONS
ADB – Asian Development Bank ADF – Asian Development Fund CO2 – carbon dioxide CPS – country partnership strategy DMC – developing member country DMF – design and monitoring framework DVA – direct value-added FCAS – fragile and conflict-affected situations GDP – gross domestic product GPI – gender parity index IED – Independent Evaluation Department MDG – Millennium Development Goal MFF – multitranche financing facility NGO – nongovernment orgranization OCR – ordinary capital resources PCR – project completion report PFR – periodic financing request PVR – PCR validation report QAE – quality at entry RFI – results framework indicator RRP – report and recommendation of the President SED – standard explanatory data TA – technical assistance UN – United Nations UNAIDS – Joint United Nations Programme on HIV/AIDS XARR – extended annual review report
NOTE
In this report, "$" refers to US dollars.

CONTENTS
INTRODUCTION 2
LEVEL 1: DEVELOPMENT PROGRESS IN ASIA AND THE PACIFIC 3
LEVEL 2: ADB CONTRIBUTIONS TO DEVELOPMENT RESULTS 9
LEVEL 3: ADB OPERATIONAL MANAGEMENT 20
LEVEL 4: ADB ORGANIZATIONAL MANAGEMENT 34
APPENDIX The Asian Development Bank’s Developing Member Countries 36


2
INTRODUCTION
This document provides definitions and data compilation methodologies for the Asian Development Bank (ADB) standard explanatory data (SED) listed in the strategy paper on the review of the results framework.1 This guidance is for internal use by the staff of the Asian Development Bank. The guidance will be updated as necessary to reflect good practices and lessons learned. The SED allow ADB to systematically assess broader performance data while avoiding undue proliferation of indicators. Although not formally part of the framework, the SED enable ADB to (i) provide consistent and reliable performance information to external stakeholders, (ii) assess performance more rigorously to identify bottlenecks and inform action planning, and (iii) collect baseline data for future indicators. The SED have no targets as their primary purpose is to supplement the results framework indicators. Where appropriate, a footnote is added to indicate that the SED are directly related to a results framework indicator.2 The definition of these indicators can be found in the indicator definitions note.3 In the following list, operation is used as a collective term for the various types of ADB development assistance, guaranteed or not by the government of the recipient country, financed from ADB’s ordinary capital resources (OCR) or Asian Development Fund (ADF) resources, excluding assistance funded by technical assistance (TA) grants. A sovereign operation is an operation financed in part or in whole by one or more loans or grants financed from OCR and/or ADF resources extended to or guaranteed by the government. A nonsovereign operation is any loan, guarantee, equity investment, or other financing arrangement that (i) is not guaranteed by a government; or (ii) is guaranteed by a government under terms that do not allow ADB, upon default of the guarantor, to accelerate, suspend, or cancel any other loan or guarantee between ADB and the related sovereign operation. TA grants are referred to as TA projects. Where possible, data will be disaggregated as SED in the annual Development Effectiveness Review by country group (OCR-only, blend, ADF-only, and fragile and conflict-affected situations [FCAS]).4 1 ADB. 2012. Review of the ADB Results Framework. Manila. The strategy paper summarizes ADB’s experiences
with the framework, discusses the proposals for improving the framework, and provides their rationale. 2 ADB's results framework was adopted in 2008 and refined in 2010. It is organized into four levels. Level 1
indicators track overall development progress in Asia and the Pacific through selected poverty reduction and development outcome indicators to which ADB aims to contribute. Level 2 indicators measure ADB's contributions to development results in terms of (i) quality at completion of country strategies and assistance programs, and (ii) key sector outputs and outcomes delivered. Level 3 includes indicators for ADB’s operational management. Level 4 indicators track ADB’s organizational management. ADB assesses its performance using these indicators, and reports its progress through the annual Development Effectiveness Review (http://www.adb.org/search?keyword=Development+Effectiveness+Review). The assessment of ADB generally covers (i) for level 1, progress in all of ADB’s developing member countries (DMCs); and (ii) for levels 2–4, ADB operations funded by OCR and the ADF. The assessment of ADF generally covers (i) for level 1, progress in ADF countries (a subgroup of ADB developing member countries (DMCs) that have access to the ADF, including blend countries with access to both OCR and the ADF); and (ii) for levels 2–4, ADF-funded operations. The classification of ADB DMCs used in this definition note is given in the Appendix. Progress assessments generally exclude operations financed from ADB’s Countercyclical Support Facility, which was established in 2009 to help DMCs respond to the global economic crisis, because these operations were outside ADB’s regular operations.
3 ADB. 2012. Review of the ADB Results Framework. Supplementary Appendix A: Review of ADB Results
Framework Indicator Definitions. Manila. 4 OCR-only countries are countries with access only to OCR. ADF countries are those countries with access to the
ADF. ADF countries can be disaggregated into (i) ADF-only countries, which have access only to the ADF; and (ii) blend countries, which have access to both the ADF and OCR. These definitions are based on country access to these resources. For information on FCAS countries, see ADB. 2013. ADB Operational Plan for Enhancing ADB’s Effectiveness in Fragile and Conflict-Affected Situations. Manila.

3
LEVEL 1: DEVELOPMENT PROGRESS IN ASIA AND THE PACIFIC
Standard Explanatory Data Definition
Poverty (Income and Non-Income)
1. Proportion of own-account and contributing family workers in total employment (%)
a
The sum of the employment status groups of own-account workers and contributing family workers (vulnerable employment) as a proportion of total employment. Own-account workers are those workers who, working on their own account or with one or more partners, hold the type of jobs defined as a self-employment jobs (i.e., remuneration directly depends on the profits derived from the goods and services produced), and have not engaged on a continuous basis any employees to work for them during the reference period. Contributing family workers, also known as unpaid family workers, are those workers who are self-employed, as own-account workers in a market-oriented establishment operated by a related person living in the same household. Total employment comprises all persons above a specified age who during a specified brief period, either 1 week or 1 day, were in the following categories:
(i) “paid employment:” (a) “at work:” persons who during the
reference period performed some work for wage or salary, in cash or in kind; and
(b) “with a job but not at work:” persons who, having already worked in their present job, were temporarily not at work during the reference period and had a formal attachment to their job.
(ii) “self-employment:”
(a) “at work:” persons who during the reference period performed some work for profit or family gain, in cash or in kind; and
(b) “with an enterprise but not at work:” persons with an enterprise, which may be a business enterprise, a farm or a service undertaking, who were temporarily not at work during the reference period for any specific reason.
4
Standard Explanatory Data Definition
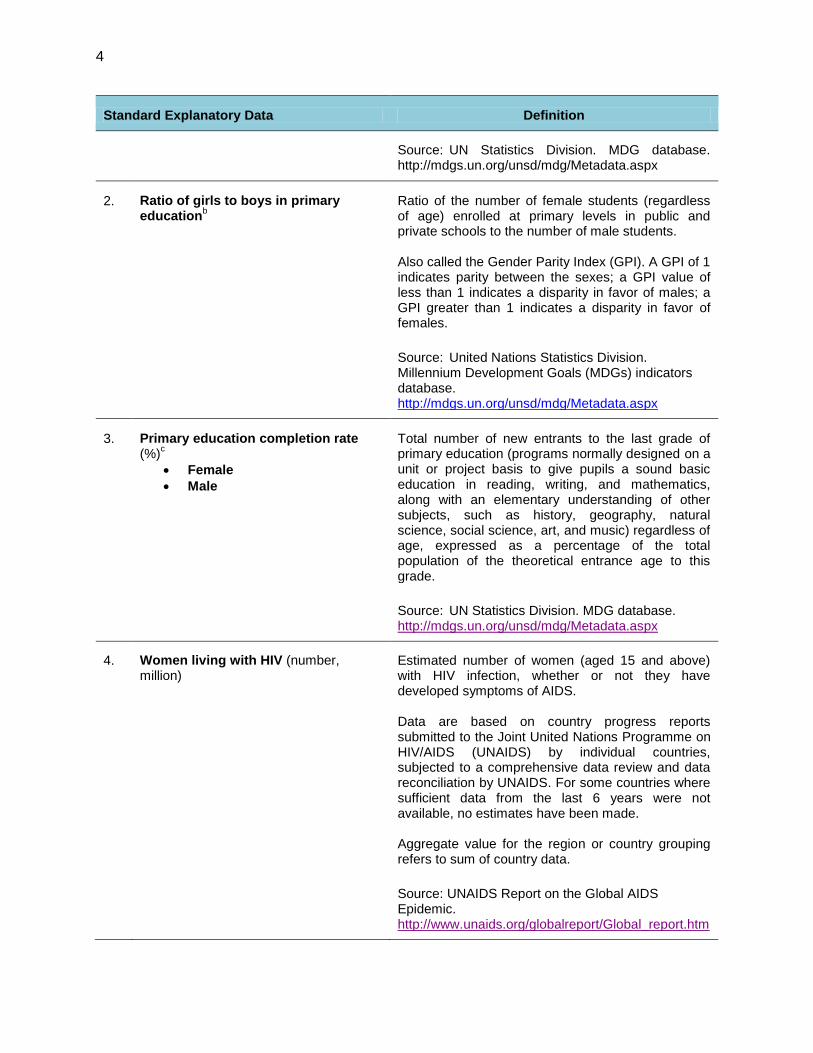
Source: UN Statistics Division. MDG database. http://mdgs.un.org/unsd/mdg/Metadata.aspx
2. Ratio of girls to boys in primary education
b
Ratio of the number of female students (regardless of age) enrolled at primary levels in public and private schools to the number of male students. Also called the Gender Parity Index (GPI). A GPI of 1 indicates parity between the sexes; a GPI value of less than 1 indicates a disparity in favor of males; a GPI greater than 1 indicates a disparity in favor of females.
Source: United Nations Statistics Division. Millennium Development Goals (MDGs) indicators database. http://mdgs.un.org/unsd/mdg/Metadata.aspx
3. Primary education completion rate (%)
c
Female
Male
Total number of new entrants to the last grade of primary education (programs normally designed on a unit or project basis to give pupils a sound basic education in reading, writing, and mathematics, along with an elementary understanding of other subjects, such as history, geography, natural science, social science, art, and music) regardless of age, expressed as a percentage of the total population of the theoretical entrance age to this grade.
Source: UN Statistics Division. MDG database. http://mdgs.un.org/unsd/mdg/Metadata.aspx
4. Women living with HIV (number, million)
Estimated number of women (aged 15 and above) with HIV infection, whether or not they have developed symptoms of AIDS. Data are based on country progress reports submitted to the Joint United Nations Programme on HIV/AIDS (UNAIDS) by individual countries, subjected to a comprehensive data review and data reconciliation by UNAIDS. For some countries where sufficient data from the last 6 years were not available, no estimates have been made. Aggregate value for the region or country grouping refers to sum of country data.
Source: UNAIDS Report on the Global AIDS Epidemic. http://www.unaids.org/globalreport/Global_report.htm

5
Standard Explanatory Data Definition
5. Social Protection Index (%) Total social protection expenditures divided by the number of intended beneficiaries as a percentage of one-quarter of gross domestic product (GDP) per capita. Social protection expenditures include central government expenditures on
(i) social insurance (i.e., health insurance, pensions and other forms of social insurance [unemployment benefits, severance payments, provident funds];
(ii) social assistance (i.e., social transfers, child protection, health assistance, assistance to the elderly, disability programs, disaster relief); and
(iii) labor market programs (e.g., employment guarantee programs and skills development and training).
Intended beneficiaries are those who are targeted for benefits, such as those over 60 for old-age insurance, employed population for health insurance (if universal, total population is used), poor population (defined by national poverty line), disabled, children 0–14 years, those eligible for disaster relief, unemployed and underemployed for labor market programs. Underemployed is defined as those working fewer than 35 hours per week, unpaid family workers, and seasonal workers. Regional and subregional aggregates are simple arithmetic averages of country data. For detailed information on the Social Protection Index methodology see: http://www.adb.org/sites/default/files/spi-handbook.pdf
Source: Regional Social Protection Index Report.
Other Development Outcomes
6. Governance and public sector management assessment (index)
d
Property rights and rule-based governance
Transparency, accountability, and corruption in the public sector
Quality of public
The average individual country assessments conducted by ADB for (i) property rights and rule-based governance; (ii) transparency, accountability, and corruption in the public sector; (iii) quality of public administration; (iv) quality of budgetary and financial management; and (v) efficiency of revenue mobilization.

6
Standard Explanatory Data Definition
administration Quality of budgetary and
financial management Efficiency of revenue
mobilization
Aggregate score for the region or country groupings is the unweighted average of country scores. ADB assigns overall country scores between 1 (low) and 6 (high). Source: ADB Strategy and Policy Department.
7. Intraregional equity and bond holdings in Asia and the Pacific (%)
Share of equity and debt securities that Asia invested intraregionally against total holdings of equity and debt securities. Country coverage: Afghanistan; Armenia; Azerbaijan; Bangladesh; Bhutan; Brunei Darussalam; Cambodia; the People’s Republic of China; the Cook Islands; Fiji; Georgia; Hong Kong, China; India; Indonesia; Japan; Kazakhstan; Kiribati; the Republic of Korea; the Kyrgyz Republic; the Lao People’s Democratic Republic; Malaysia; the Maldives; the Marshall Islands; the Federated States of Micronesia; Mongolia; Myanmar; Nauru; Nepal; Pakistan; Palau; Papua New Guinea; the Philippines; Samoa; Singapore; Solomon Islands; Sri Lanka; Taipei,China; Tajikistan; Thailand; Timor-Leste; Tonga; Turkmenistan; Tuvalu; Uzbekistan; Vanuatu; and Viet Nam.
Source: International Monetary Fund, Coordinated Portfolio Investment Survey.
8. International Logistics Performance (index)
Weighted average of country scores on six key dimensions:
(i) Efficiency of the clearance process (i.e., speed, simplicity, and predictability of formalities) by border control agencies, including customs;
(ii) quality of trade and transport related infrastructure (e.g., ports, railroads, roads, information technology);
(iii) ease of arranging competitively priced shipments;
(iv) competence and quality of logistics services (e.g., transport operators, customs brokers);
(v) ability to track and trace consignments; and
(vi) timeliness of shipments in reaching destination within the scheduled or expected delivery time.
Country scores range from 1 (worst) to 5 (best) and are derived from an online survey of logistics
7
Standard Explanatory Data Definition
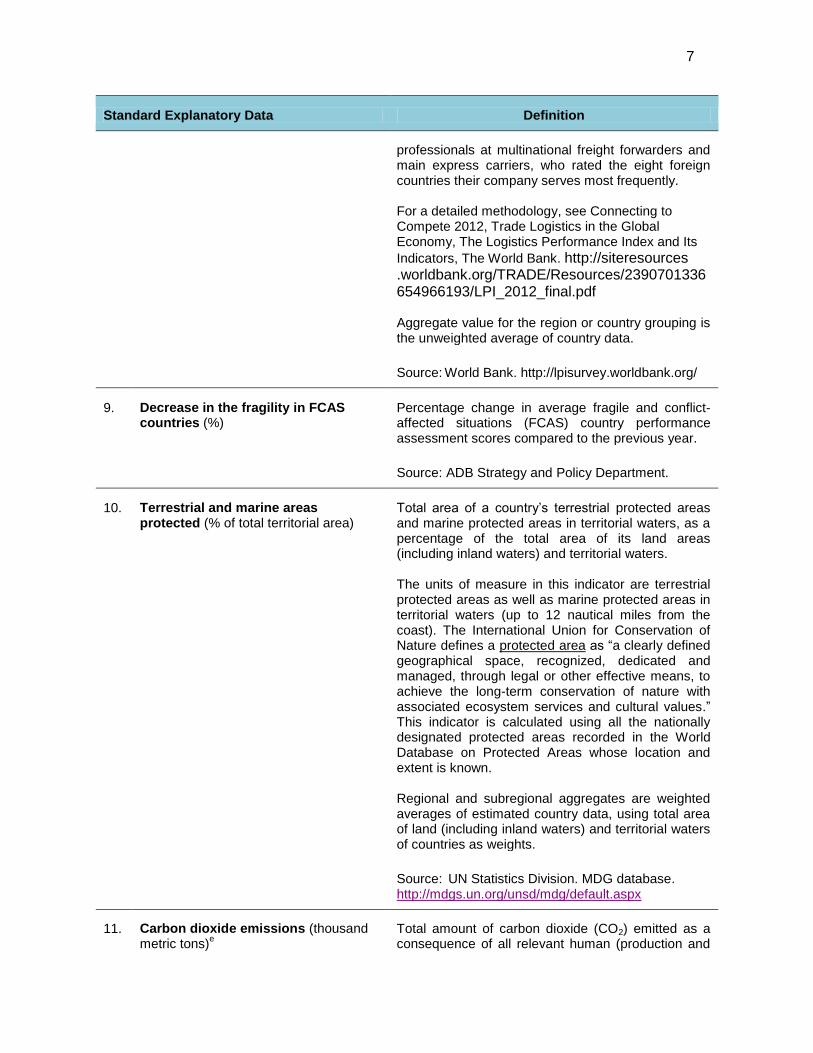
professionals at multinational freight forwarders and main express carriers, who rated the eight foreign countries their company serves most frequently. For a detailed methodology, see Connecting to Compete 2012, Trade Logistics in the Global Economy, The Logistics Performance Index and Its
Indicators, The World Bank. http://siteresources .worldbank.org/TRADE/Resources/2390701336654966193/LPI_2012_final.pdf Aggregate value for the region or country grouping is the unweighted average of country data.
Source: World Bank. http://lpisurvey.worldbank.org/
9. Decrease in the fragility in FCAS countries (%)
Percentage change in average fragile and conflict-affected situations (FCAS) country performance assessment scores compared to the previous year.
Source: ADB Strategy and Policy Department.
10. Terrestrial and marine areas protected (% of total territorial area)
Total area of a country’s terrestrial protected areas and marine protected areas in territorial waters, as a percentage of the total area of its land areas (including inland waters) and territorial waters. The units of measure in this indicator are terrestrial protected areas as well as marine protected areas in territorial waters (up to 12 nautical miles from the coast). The International Union for Conservation of Nature defines a protected area as “a clearly defined geographical space, recognized, dedicated and managed, through legal or other effective means, to achieve the long-term conservation of nature with associated ecosystem services and cultural values.” This indicator is calculated using all the nationally designated protected areas recorded in the World Database on Protected Areas whose location and extent is known. Regional and subregional aggregates are weighted averages of estimated country data, using total area of land (including inland waters) and territorial waters of countries as weights.
Source: UN Statistics Division. MDG database. http://mdgs.un.org/unsd/mdg/default.aspx
11.
Carbon dioxide emissions (thousand metric tons)
e
Total amount of carbon dioxide (CO2) emitted as a consequence of all relevant human (production and

8
Standard Explanatory Data Definition
consumption) activities. Aggregate values for the region or country groupings are the sum totals of country observations.
Source: UN Statistics Division. MDG Indicators. http://mdgs.un.org/unsd/mdg/default.aspx
12. Carbon dioxide intensity of GDP (kilograms per $ GDP)
e
Total CO2 emitted as a consequence of all relevant human (production and consumption) activities, divided by the total value of GDP expressed in purchasing power parity. Aggregate values for the region or country groupings are weighted averages using GDP as weights.
Source: UN Statistics Division. MDG Indicators. http://mdgs.un.org/unsd/mdg/default.aspx
Note: As the survey underlying the International Logistics Performance Index is not conducted annually, data will be reported as they become available. a
This SED is related to the results framework indicator (RFI) “Wage and salaried workers in total employment (%).” b
This SED is related to the RFI “Ratio of girls to boys in secondary and tertiary education.” c
This SED is related to the RFI “Gross lower secondary education graduation rate (%).” d
This SED is related to the RFI “Governance and public sector management assessment (index).” e
This SED is related to the RFI “Carbon dioxide emissions (metric tons per capita).”

9
LEVEL 2: ADB CONTRIBUTIONS TO DEVELOPMENT RESULTS
Standard Explanatory Data Definition
Quality at Completion
1. Completed sovereign operations rated successful (%)
a
Completed on time Completed on budget
All project completion reports (PCR) or program completion reports prepared for sovereign operations and circulated in the last 3 years, with successful or better ratings, as a percentage of the total number of PCRs circulated during the same period.
Where available, project performance evaluation report (PPER) ratings are taken as the final rating. If no PPER is prepared, an available PCR validation report (PVR) rating is used. If neither PPER nor PVR ratings are available, the PCR rating is used. When the PPER or PVR rating becomes available, the original rating in the PCR is updated. The success rates in the last 2 years may incorporate adjustments using actual validations and historical average rates of upgrading and downgrading of PCR ratings by the Independent Evaluation Department. Number of sovereign operations that were rated successful (latest ratings) and (i) completed on time, and (ii) completed on budget, as reported in PCRs or program completion reports circulated in the last 3 years, as a percentage of the total number of PCRs circulated during the same period.
Sources: PCRs.
2. Completed operations contributing
to outcomes (%)
Number of sector components of sovereign and nonsovereign operations with PCRs and XARRs circulated in the last 3 years and rated effective or highly effective in contributing to intended outcomes in core and other sectors, as a percentage of the total number of sector components assessed during the same period. Effectiveness rating of PCRs and overall rating of XARRs will be used as a proxy for assessing the project’s contribution to outcomes. The effectiveness rates in the last 2 years may incorporate adjustments using actual validations and historical average rates of upgrading and downgrading of ratings by the Independent Evaluation Department.
Sources: PCRs and XARRs.
3. Completed operations satisfactorily delivering thematic results (%)
b
Governance and/or capacity
Number of PCRs and XARRs circulated in the last 3 years that reported targets achieved and satisfactory results in (i) improving governance and/or enhancing
10
Standard Explanatory Data Definition
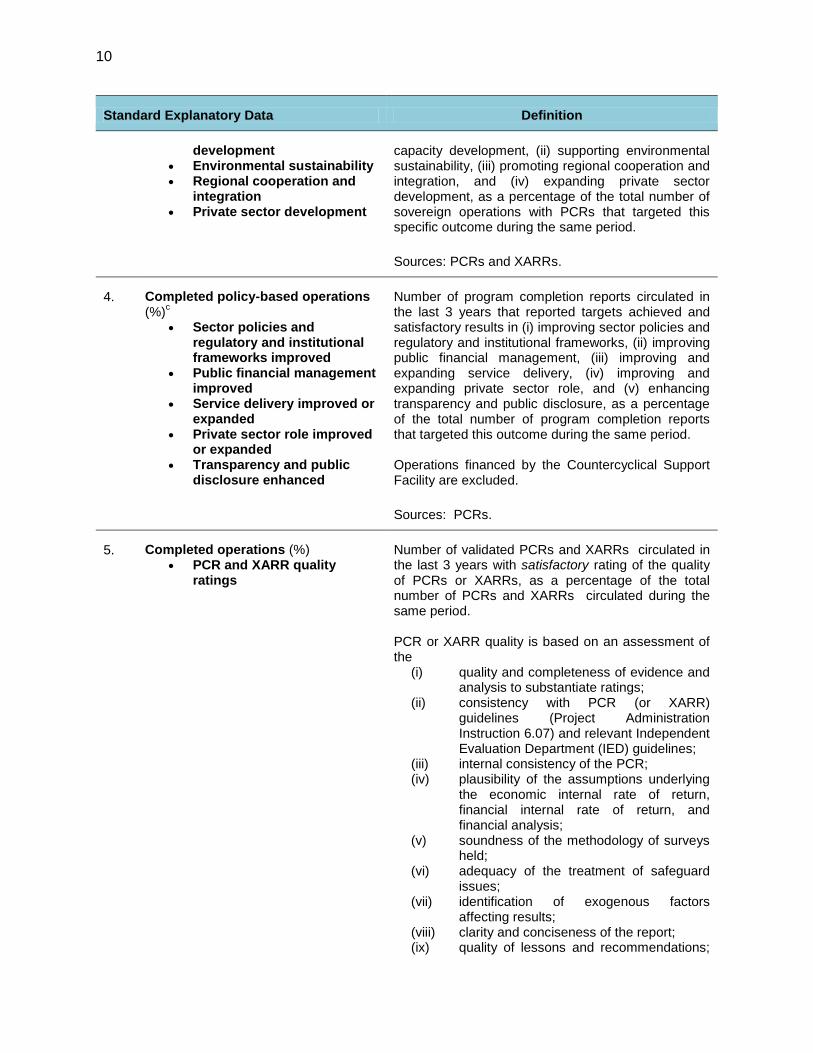
development Environmental sustainability Regional cooperation and
integration Private sector development
capacity development, (ii) supporting environmental sustainability, (iii) promoting regional cooperation and integration, and (iv) expanding private sector development, as a percentage of the total number of sovereign operations with PCRs that targeted this specific outcome during the same period.
Sources: PCRs and XARRs.
4. Completed policy-based operations (%)
c
Sector policies and regulatory and institutional frameworks improved
Public financial management improved
Service delivery improved or expanded
Private sector role improved or expanded
Transparency and public disclosure enhanced
Number of program completion reports circulated in the last 3 years that reported targets achieved and satisfactory results in (i) improving sector policies and regulatory and institutional frameworks, (ii) improving public financial management, (iii) improving and expanding service delivery, (iv) improving and expanding private sector role, and (v) enhancing transparency and public disclosure, as a percentage of the total number of program completion reports that targeted this outcome during the same period. Operations financed by the Countercyclical Support Facility are excluded.
Sources: PCRs.
5. Completed operations (%) PCR and XARR quality
ratings
Number of validated PCRs and XARRs circulated in the last 3 years with satisfactory rating of the quality of PCRs or XARRs, as a percentage of the total number of PCRs and XARRs circulated during the same period. PCR or XARR quality is based on an assessment of the
(i) quality and completeness of evidence and analysis to substantiate ratings;
(ii) consistency with PCR (or XARR) guidelines (Project Administration Instruction 6.07) and relevant Independent Evaluation Department (IED) guidelines;
(iii) internal consistency of the PCR; (iv) plausibility of the assumptions underlying
the economic internal rate of return, financial internal rate of return, and financial analysis;
(v) soundness of the methodology of surveys held;
(vi) adequacy of the treatment of safeguard issues;
(vii) identification of exogenous factors affecting results;
(viii) clarity and conciseness of the report; (ix) quality of lessons and recommendations;
11
Standard Explanatory Data Definition
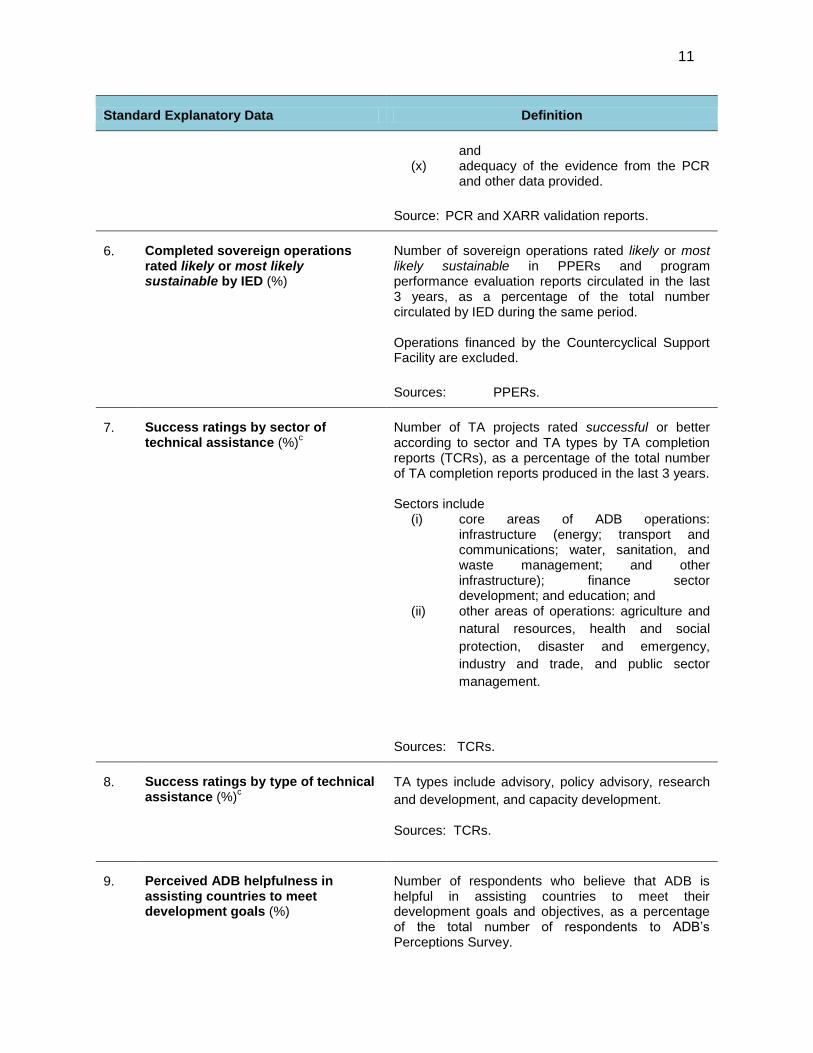
and (x) adequacy of the evidence from the PCR
and other data provided.
Source: PCR and XARR validation reports.
6. Completed sovereign operations rated likely or most likely sustainable by IED (%)
Number of sovereign operations rated likely or most likely sustainable in PPERs and program performance evaluation reports circulated in the last 3 years, as a percentage of the total number circulated by IED during the same period. Operations financed by the Countercyclical Support Facility are excluded.
Sources: PPERs.
7. Success ratings by sector of technical assistance (%)
c
Number of TA projects rated successful or better according to sector and TA types by TA completion reports (TCRs), as a percentage of the total number of TA completion reports produced in the last 3 years. Sectors include
(i) core areas of ADB operations: infrastructure (energy; transport and communications; water, sanitation, and waste management; and other infrastructure); finance sector development; and education; and
(ii) other areas of operations: agriculture and
natural resources, health and social
protection, disaster and emergency,
industry and trade, and public sector
management.
Sources: TCRs.
8. Success ratings by type of technical assistance (%)
c
TA types include advisory, policy advisory, research
and development, and capacity development.
Sources: TCRs.
9. Perceived ADB helpfulness in assisting countries to meet development goals (%)
Number of respondents who believe that ADB is helpful in assisting countries to meet their development goals and objectives, as a percentage of the total number of respondents to ADB’s Perceptions Survey.

12
Standard Explanatory Data Definition
The indicator is based on responses of “very helpful” or “somewhat helpful” to questions in the triennial multinational survey of opinion leaders and stakeholders under the section on overall impression of ADB: helpfulness in meeting development goals and objectives.
Source: ADB Perceptions Survey. http://www.adb .org/publications/series/perceptions-survey
10. Impact evaluations conducted (number)
Approaches Key findings
Number of impact evaluations undertaken in a year, distinguishing approaches, including experimental and nonexperimental, and their key findings. Experimental approaches typically evaluate impact through controlled trials, using ex-ante random assignment of the intervention to obtain comparable treatment and control groups. Impact estimates are calculated as the ex-post mean difference in outcomes between these two groups. Most ex-ante designed evaluations use experimental approaches. Nonexperimental approaches are based on econometric analysis to estimate impact and generally require more assumptions. As they mostly cannot control for unobservable characteristics on program assignment, impact estimates often suffer from an omitted variable bias, which means they must be accompanied with robustness checks. Other approaches of impact evaluations conducted will be reported on as well. For detailed information on impact evaluation types, see A Review of Recent Developments in Impact Evaluation. http://www.adb.org/sites/default/files/pub/ 2011/developments-impact-evaluation.pdf
Sources: Economics and Research Department, IED, and regional departments.
Core Operational Results
11. Aggregate outputs and outcomes achieved through completed operations in the past 4 years (number)
d
Total number of outputs and outcomes achieved through completed sovereign and nonsovereign operations for each of the core sector indicators, as reported in the PCRs and XARRs circulated in the last 4 years.

13
Standard Explanatory Data Definition
Source: PCRs and XARRs.
12. Aggregate outputs and outcomes programmed through new operations approved in the past 4 years (number)
d
Total number of outputs and outcomes programmed through approved sovereign and nonsovereign operations for each of the core sector indicators, as reported in reports and recommendations of the President (RRPs) during the last 4 years.
Sources: RRPs and periodic financing requests.
Energy
13. Energy saved (terawatt-hour equivalent per year)
e
Annual energy savings is the sum of electricity and fuel savings, after converting fuel savings in terrajoules to terawatt-hour equivalent per year. Fuel savings come from efficiency improvements due to the use of lesser fuels in terms of energy content (e.g., railway, district heating, and conversion of power plants from coal to combined-cycle gas turbine). Electricity savings result from efficiency improvements in supply (reduction of technical losses in generation and transmission) and demand (from industrial, commercial, and residential sectors). Energy saved is the energy savings resulting from a project or component of a project that involves efficiency improvements in energy use.
Sources: PCRs and RRPs.
14. New households connected to electricity (number)
f
Rural
Urban
Disaggregated number of new households provided with electricity connections, by rural and urban project classification. Only new household connections resulting from a project are counted. Households with electricity connection and receiving improved services through a project are not counted. The number of new household connections resulting from a project is counted in total and not proportional to the ADB funding component only. New connections may be reported as a straightforward number, i.e., the number of households that the project would connect to power. However, the indicator may also be measured in terms of population that would be served by the project. In this case, the population is divided by the average household size in the country or the locality.

14
Standard Explanatory Data Definition
Thus, it is important that the RRP mention the average household size.
Sources: PCRs and RRPs.
Transport
15. Roads built or upgraded (kilometers)g
Expressways and national highways
Provincial, district, and rural roads
Length of roads built or upgraded, expressed in kilometers, disaggregated into
(i) expressways and national highways (i.e., fully access-controlled roadways); and
(ii) provincial, district, and rural road networks built or upgraded (i.e., roads without full access control).
Fully access-controlled roadways imply (i) all cross traffic is fully grade separated (e.g., using overpasses); (ii) the use of a median crash barrier or wide median to physically separate both directions of travel; (iii) full segregation of motorized traffic from nonmotorized traffic, including pedestrians; (iv) prohibition of unsuitable vehicle classes and nonmotorized traffic from roadway use; and (v) use of roadside crash barriers or clear zones.
Roads without full access control may include kilometers of nonpaved road (tracks), if investments in these have been made through the project. Upgrading of roads includes all activities to restore a degraded road to its originally intended design capacity (repair or rehabilitation) and to improve on its design capacity (e.g., by widening). Upgrading of road signage only is excluded. This calculation is not affected by bidirectional travel or the number of lanes (i.e., corridor kilometers are used, not lane kilometers).
Sources: PCRs and RRPs.
16. Roads built or upgraded (kilometers)g
Rural
Urban
Disaggregated length of road networks built or upgraded, by rural and urban project classification. The length of expressways and national highways (i.e., fully access-controlled roadways) and provincial, district, and rural road networks (i.e., roads without full access control) built or upgraded, is expressed in kilometers. Fully access-controlled roadways imply (i) all cross

15
Standard Explanatory Data Definition
traffic is fully grade separated (e.g., using overpasses); (ii) the use of a median crash barrier or wide median to physically separate both directions of travel; (iii) full segregation of motorized traffic from nonmotorized traffic, including pedestrians; (iv) prohibition of unsuitable vehicle classes and nonmotorized traffic from roadway use; and (v) use of roadside crash barriers or clear zones. Roads without access control may include kilometers of nonpaved road (tracks), if investments in these have been made through the project. Upgrading of roads includes all activities to restore a degraded road to its originally intended design capacity (repair or rehabilitation) and to improve on its design capacity (e.g., by widening). Upgrading of road signage only is excluded. This calculation is not affected by bidirectional travel or the number of lanes (i.e., corridor kilometers are used, not lane kilometers).
Sources: PCRs and RRPs.
17. Passengers on urban rail- and bus-based mass transit systems built or upgraded (average daily number in the first full year of operation)
h
Traffic benefiting from built or upgraded urban rail- and bus-based mass transit systems in the year after project completion. Passengers are defined to mean passenger trips. Each passenger trip is counted, regardless of whether it is the same passenger making multiple trips. Average daily number refers to an average work day (weekends and holidays are not to be used). Passenger trip numbers are collected from electronic fare system outputs or surveys.
Sources: PCRs and RRPs.
Water
18. Households with new or improved water supply (number)
i
Rural
Urban
Disaggregated number of new households that benefit from new or improved water supply, by rural and urban project classification. All additional households that benefit from projects offering piped or non-piped water supply systems that are of a higher order than the system that the households used before (non-piped supply may
16
Standard Explanatory Data Definition
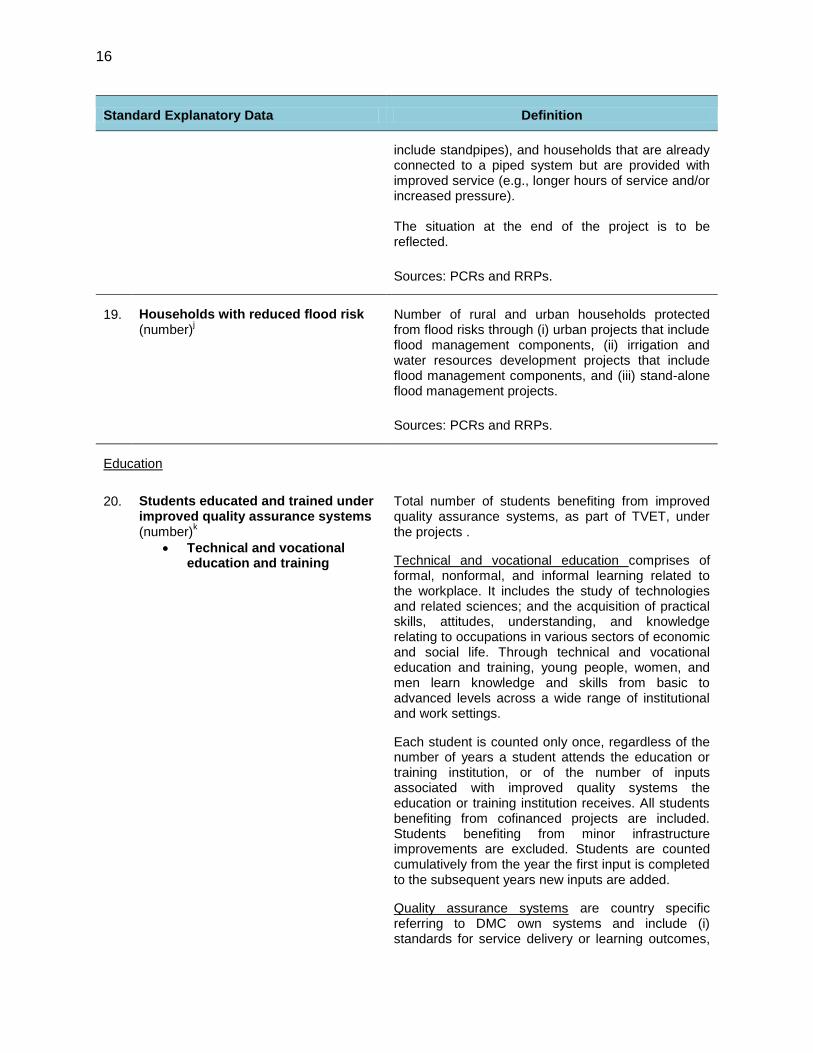
include standpipes), and households that are already connected to a piped system but are provided with improved service (e.g., longer hours of service and/or increased pressure). The situation at the end of the project is to be reflected.
Sources: PCRs and RRPs.
19. Households with reduced flood risk (number)
j
Number of rural and urban households protected from flood risks through (i) urban projects that include flood management components, (ii) irrigation and water resources development projects that include flood management components, and (iii) stand-alone flood management projects.
Sources: PCRs and RRPs.
Education
20. Students educated and trained under improved quality assurance systems (number)
k
Technical and vocational education and training
Total number of students benefiting from improved quality assurance systems, as part of TVET, under the projects .
Technical and vocational education comprises of formal, nonformal, and informal learning related to the workplace. It includes the study of technologies and related sciences; and the acquisition of practical skills, attitudes, understanding, and knowledge relating to occupations in various sectors of economic and social life. Through technical and vocational education and training, young people, women, and men learn knowledge and skills from basic to advanced levels across a wide range of institutional and work settings.
Each student is counted only once, regardless of the number of years a student attends the education or training institution, or of the number of inputs associated with improved quality systems the education or training institution receives. All students benefiting from cofinanced projects are included. Students benefiting from minor infrastructure improvements are excluded. Students are counted cumulatively from the year the first input is completed to the subsequent years new inputs are added.
Quality assurance systems are country specific referring to DMC own systems and include (i) standards for service delivery or learning outcomes,

17
Standard Explanatory Data Definition
(ii) a means for verifying achievement of standards, and (iii) a mechanism for implementing standards directly in education or training institutions.
Improved quality assurance systems include operations that
(i) invested in improved quality standards (e.g., minimum service delivery standards for education and training institutions, learning standards in the curriculum, competency-based teaching and learning systems, qualifications frameworks, and instructional staff qualifications) and a means for verifying progress toward achieving those standards (e.g., certification, compliance reviews, accreditation, institutional census surveys, learning assessments, and qualifying examinations);
(ii) financed inputs that enable education or training institutions to meet particular quality standards (e.g., teacher training, reformed examination, facility improvement grants for inputs directed at meeting standards, and improved facilities);
(iii) used mechanisms for verifying progress toward achievement of standards (e.g., institutional census, project surveys, learning assessments, and qualifying examinations); and
(iv) defined number of project education or training institutions receiving such inputs.
Sources: PCRs and RRPs.
21. Teachers trained with quality or competency standards (number)
l
Technical and vocational education and training
Number of teachers trained who are likely to improve teaching practices and support improvements in curriculum, textbooks, or pedagogy.
Technical and vocational education comprises of formal, nonformal, and informal learning related to the workplace. It includes the study of technologies and related sciences; and the acquisition of practical skills, attitudes, understanding, and knowledge relating to occupations in various sectors of economic and social life. Through technical and vocational education and training, young people, women, and men learn knowledge and skills from basic to advanced levels across a wide range of institutional and work settings.
Teachers include the following:
(i) Teachers who are full-time, part-time, or government paid or contracted. Teachers, principals,

18
Standard Explanatory Data Definition
instructors, lecturers, and professors covered by the project are included.
(ii) Preservice: Candidate teachers enrolled in training programs that have been strengthened by the project and result in qualifications or certification.
(iii) Upgrading: Teachers receiving in-service training that has been strengthened under the project and leads to certification or licensing.
(iv) In-service: The number of teachers receiving in-service training in specific subject areas or specific pedagogies where the training program has defined competencies and means for assessing attainment of competencies.
Each teacher is counted only once, regardless of how many times he/she participated in pre- and/or in-service programs.
If a teacher training institution receives upgrading through civil works and/or equipment, enrolled trainees are not counted unless teacher quality standards are also strengthened under the project.
The faculty of teacher training institutions is excluded from the count unless they directly teach in classrooms.
The number of teachers is counted cumulatively as follows:
(i) Preservice: Number of teachers enrolled in the strengthened program; and if the program multiyear program, add only the new intake for subsequent years;
(ii) In-service leading to certification: Number of teachers receiving certificates or licenses under the strengthened program; and
(iii) Short-course in-service: Teachers who participate in two or more short courses meeting quality standards counted once only.
Teachers trained under cofinanced projects are included provided the training meets ADB’s definition of quality standards.
Sources: PCRs and RRPs. a This SED is related to the RFI “Completed sovereign operations rated successful (%)—projects and policy-based
operations.” b
This SED is related to the RFI “Completed sovereign operations rated successful (%)—policy-based operations.” c This SED is related to the RFI “Completed technical assistance projects rated successful (%).”

19
d This SED is related to all core operational results indicators.
e This SED is related to the RFI “Greenhouse gas emission reduction (tons of carbon dioxide-equivalent per year).”
f This SED is related to the RFI “New households connected to electricity (number).”
g This SED is related to the RFI “Roads built or upgraded (kilometers).”
h This SED is related to the RFI “Urban rail- and bus-based mass transit systems built or upgraded (kilometers).”
i This SED is related to the RFI “Households with new or improved water supply (number).”
j This SED is related to the RFI “Land improved through irrigation, drainage, and/or flood management (hectares).”
k This SED is related to the RFI “Students educated and trained under improved quality assurance systems (number).”
l This SED is related to the RFI “Teachers trained with quality or competency standards (number).”

20
LEVEL 3: ADB OPERATIONAL MANAGEMENT
Standard Explanatory Data Definition
Implementation Quality
1. Performance of sovereign operations at implementation rated satisfactory per sector (%)
a
Project performance ratings are presented according to the project classification system:
(i) agriculture and natural resources, (ii) education, (iii) energy, (iv) finance, (v) health and social protection, (vi) industry and trade, (vii) multisector, (viii) public sector management, (ix) transport and information
communication technology, and (x) water and other municipal
infrastructure and services.
Source: e-Operations.
2. Sovereign operations performance at implementation per rating criteria (%)
a
Technical Procurement Disbursement Financial management Safeguards
Satisfactory performance for the following five rating criteria underlying the average rating score of the results framework indicator (RFI) “performance of sovereign operations at implementation rated satisfactory:” (i) technical, (ii) procurement, (iii) disbursement, (iv) financial management, and (v) safeguards. Satisfactory rating is measured by the sum of on track and potential problem.
Source: e-Operations.
Quality at Entry
3. Quality at entry of country partnership strategies rated satisfactory
(%)
b
Country diagnostics Identification of lessons Country strategy Country program Results framework Risk assessment and
mitigation Country partnership strategy
preparation process
Breakdown of the seven criteria that constitute quality at entry (QAE) assessments of country partnership strategies (CPSs). Sources: CPS and report of working group on QAE assessment.
4. Quality at entry of country partnership
strategies in integrating climate change
Percentage of CPSs over a 2-year period rated satisfactory or better with respect to the integration

21
Standard Explanatory Data Definition
concerns (%)b of climate change concerns.
Climate change integration will be assessed
according to the following criteria:
(i) analysis of climate risks, vulnerabilities,
and mitigation opportunities for the country,
specific regions within the country, and key
sectors, including future climate change
risks;
(ii) stakeholder consultations on climate
change mitigation and adaptation, as
appropriate;
(iii) consistency between country’s climate
change strategy and ADB’s approach to
supporting climate change mitigation and
adaptation; and
(iv) identification of sectors and/or regions
within the country that require climate
proofing of ADB’s investment program.
Source: Regional and Sustainable Development Department.
5. Quality at entry of country partnership
strategies in integrating gender
equality concerns (%)b
Percentage of CPSs over a 2-year period that (i) examine gender issues and include a clear gender strategy in the main text, (ii) analyze gender equality issues in sector road maps, and (iii) include gender indicators in the CPS and sector results frameworks. This indicator covers all CPSs, including the linked sector road maps and sector results frameworks.
Source: Regional and Sustainable Development Department.
6. Quality at entry of country partnership
strategies in integrating knowledge
plans (%)b
Percentage of CPSs over a 2-year period that (i) have explicit plans to mainstream knowledge on the basis of guiding principles of a knowledge management framework for the DMC and in the context of the ADB operations cycle, and (ii) indicate specific knowledge products at different stages of the cycle.
Source: CPS QAE assessment.
7. Quality at entry of sovereign projects rated satisfactory (%)
c
Breakdown of the nine criteria that constitute QAE assessments of sovereign projects.

22
Standard Explanatory Data Definition
Development objectives, outcomes, and impacts
Strategic relevance and approach
Technical and economic aspects
Poverty, social, and environmental aspects
Fiduciary aspects Policy and institutional
aspects Implementation arrangements,
monitoring, and evaluation Risk assessment Achievability and
sustainability of development objectives
Sources: RRPs and report of the working group on QAE assessment.
8. Quality at entry of nonsovereign projects rated satisfactory (%)
d
Development objectives Enabling environment
impact Strategic alignment and
project design ADB additionality and
complementarity Market, financial, economic,
and technical feasibility Environmental and social
responsibility Implementation
arrangements ADB profitability and
investment management Risk assessment and
management Achievability of development
objectives
Breakdown of the 10 criteria that constitute QAE of nonsovereign projects. Sources: RRPs and report of working group on QAE assessment.
9. Sovereign project design and monitoring frameworks rated satisfactory (%)
e
Percentage of sovereign project design and monitoring frameworks (DMFs) rated satisfactory or better on seven dimensions.
f
Sources: DMF quality review exercise statistics and Strategy and Policy Department.
10. Nonsovereign project design and monitoring frameworks rated satisfactory (%)
e
Percentage of nonsovereign project DMFs rated satisfactory or better on seven dimensions.
f
Equity investments and funds are excluded from this analysis.

23
Standard Explanatory Data Definition
Source: DMF quality review exercise statistics and Strategy and Policy Department.
Development Finance
11. Disbursement ratio for policy-based operations (%)
The ratio of total sovereign policy-based operations disbursements in a given year or period to the net amount available for disbursement at the beginning of the year or period, plus amounts that have become effective during the year or period, less cancellations made during the year or period. Total disbursement in a given year or period refers to the confirmed disbursement for the particular year or period covered. Net amount available at the beginning of the year or period refers to the undisbursed amount aggregated for all ongoing loan and ADF grant operations at the beginning of the year.
Source: Controller’s Department.
12. Official direct value-added cofinancing (% of ADB financing approved)g
Loans Investment grants
Official cofinancing as a percentage of total OCR and ADF approvals in the last year. Flowing mainly from financing partnerships with multilateral and bilateral development assistance agencies, official cofinancing mobilizes (i) grants and loans for operations supported by ADB, and (ii) grants for ADB’s TA operations. Such cofinancing is usually sourced from official development assistance. Consistent with ADB’s strategic directions and resource allocations, official cofinancing focuses on strong partner and client coordination for (i) easy access and efficiencies in processing, (ii) low transaction costs, and (iii) harmonized and transparent mechanisms in reporting to financing partners on the development impact of their contributions. A breakdown of official direct value-added (DVA) cofinancing components will be reported as well.
Source: Operations Services and Financial Management Department.
13. Commercial direct value-added cofinancing (% of ADB financing
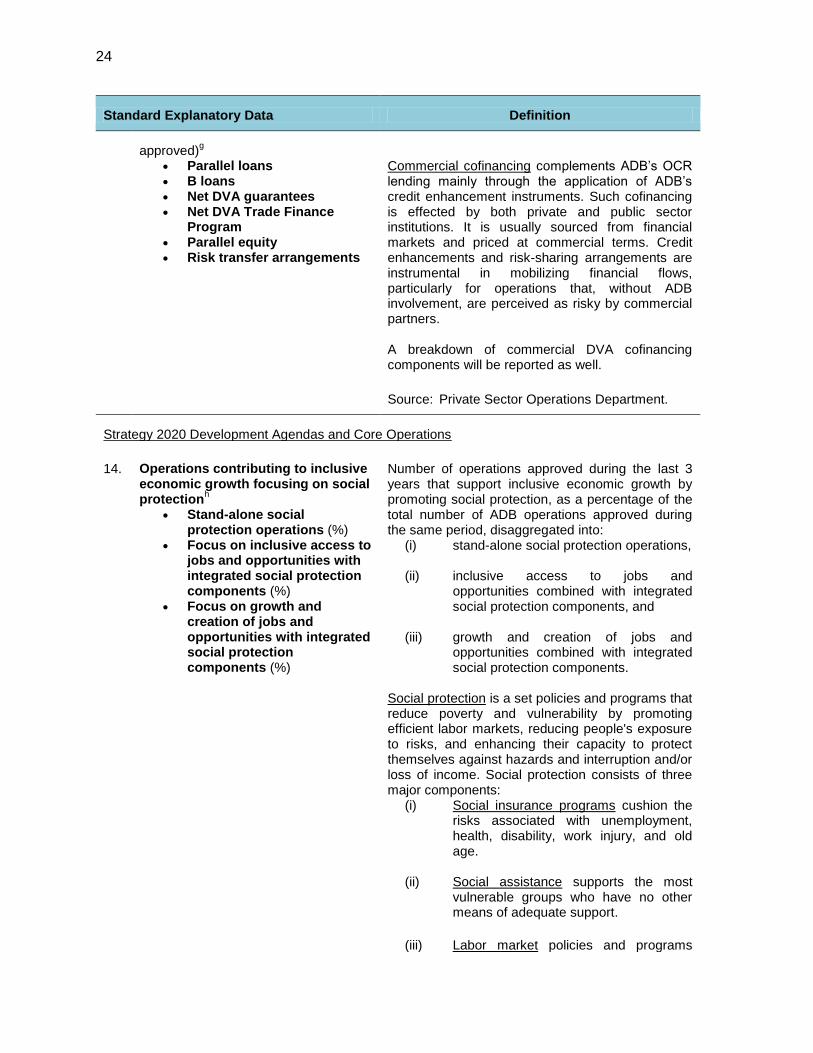
Commercial cofinancing as a percentage of total OCR and ADF approvals in the last year.
24
Standard Explanatory Data Definition
approved)g
Parallel loans B loans Net DVA guarantees Net DVA Trade Finance
Program Parallel equity Risk transfer arrangements
Commercial cofinancing complements ADB’s OCR lending mainly through the application of ADB’s credit enhancement instruments. Such cofinancing is effected by both private and public sector institutions. It is usually sourced from financial markets and priced at commercial terms. Credit enhancements and risk-sharing arrangements are instrumental in mobilizing financial flows, particularly for operations that, without ADB involvement, are perceived as risky by commercial partners. A breakdown of commercial DVA cofinancing components will be reported as well.
Source: Private Sector Operations Department.
Strategy 2020 Development Agendas and Core Operations
14. Operations contributing to inclusive economic growth focusing on social protection
h
Stand-alone social protection operations (%)
Focus on inclusive access to jobs and opportunities with integrated social protection components (%)
Focus on growth and creation of jobs and opportunities with integrated social protection components (%)
Number of operations approved during the last 3 years that support inclusive economic growth by promoting social protection, as a percentage of the total number of ADB operations approved during the same period, disaggregated into:
(i) stand-alone social protection operations,
(ii) inclusive access to jobs and opportunities combined with integrated social protection components, and
(iii) growth and creation of jobs and opportunities combined with integrated social protection components.
Social protection is a set policies and programs that reduce poverty and vulnerability by promoting efficient labor markets, reducing people's exposure to risks, and enhancing their capacity to protect themselves against hazards and interruption and/or loss of income. Social protection consists of three major components:
(i) Social insurance programs cushion the risks associated with unemployment, health, disability, work injury, and old age.
(ii) Social assistance supports the most vulnerable groups who have no other means of adequate support.
(iii) Labor market policies and programs

25
Standard Explanatory Data Definition
facilitate employment and promote efficient operation of the labor market.
Operations that focus on inclusive access to jobs and opportunities are those that typically support improvements in basic services, such as education, health, and water and sanitation, especially for the disadvantaged; access to finance; urban development for the poor; rural infrastructure, and reforms that promote the participation of disadvantaged groups. Operations that focus on growth and creation of jobs and opportunities are those that typically support robust infrastructure, a stable finance sector, effective public sector management, and sound regulatory regimes that allow the private sector to participate. The number of operations is based on RRPs and periodic financing requests (PFRs) circulated during the same period.
Sources: RRPs, PFRs, and e-Operations.
15. Financing for inclusive economic growth focusing on social protection
h
Stand-alone social protection operations (%)
Focus on inclusive access to jobs and opportunities with integrated social protection components (%)
Focus on growth and creation of jobs and opportunities with integrated social protection components (%)
Volume ($ amount) of operations approved during the last 3 years that support inclusive economic growth by promoting social protection, as a percentage of total volume ($ amount) of ADB operations approved during the same period, disaggregated into
(i) stand-alone social protection operations,
(ii) inclusive access to jobs and
opportunities combined with integrated
social protection components, and
(iii) growth and creation of jobs and
opportunities combined with integrated
social protection components.
Social protection is a set policies and programs that reduce poverty and vulnerability by promoting efficient labor markets, reducing people's exposure to risks, and enhancing their capacity to protect themselves against hazards and interruption and/or loss of income. Social protection consists of three major components:
(i) Social insurance programs cushion the

26
Standard Explanatory Data Definition
risks associated with unemployment,
health, disability, work injury, and old
age.
(ii) Social assistance supports the most
vulnerable groups who have no other
means of adequate support.
(iii) Labor market policies and programs
facilitate employment and promote
efficient operation of the labor market.
Operations that focus on inclusive access to jobs and opportunities are those that typically support improvements in basic services, such as education, health, and water and sanitation, especially for the disadvantaged; access to finance; urban development for the poor; rural infrastructure, and reforms that promote the participation of disadvantaged groups.
Operations that focus on growth and creation of jobs and opportunities are those that typically support robust infrastructure, a stable finance sector, effective public sector management, and sound regulatory regimes that allow the private sector to participate.
Sources: RRPs, PFRs, and e-Operations.
16. Financing for environmental sustainability (%)
i
Volume ($ amount) of operations with the thematic classification of environment sustainability in the last 3 years as a percentage of total volume ($ amount) of operations approved during the same period. Environmental sustainability may or may not be the primary theme. The thematic classification of projects is based on the RRPs or PFRs in the case of multitranche financing facilities (MFFs).
Sources: RRPs, PFRs, and e-Operations.
17. Financing for climate change mitigation and/or adaptation (%)
j
Volume ($ amount) of operations that support climate change mitigation and/or adaptation in the last 3 years as a percentage of total volume ($ amount) of operations approved during the same period.

27
Standard Explanatory Data Definition
Identification of the projects that support climate change mitigation and/or adaptation is based on the RRP or PFRs in the case of MFFs. Note: Harmonized multilateral development bank approaches for mitigation and adaptation finance reporting were defined in 2012. Based on the joint approach, activities should reflect at least one of the following categories to be classified as adaptation:
(i) addressing current drivers of vulnerability;
(ii) building resilience to current and future climate risks;
(iii) incorporating climate risks into investments; and
(iv) incorporating management of climate risk into plans, institutions, and policies.
Adaptation activities falling into these categories must in addition fulfill three design process criteria: (i) context of climate vulnerability; (ii) statement of purpose or intent to address or improve climate resilience; and (iii) link between project activities and the context of climate vulnerability, as reflected in the RRP. These criteria are necessary to differentiate between adaptation and development. Based on the joint approach, activities can be classified as contributing to climate change mitigation if it promotes “efforts to reduce or limit greenhouse gas emissions or enhance greenhouse gas sequestration.”
k
Consistent guidelines for project classification will be developed.
Sources: RRPs, PFRs, and e-Operations.
18. Operations supporting climate change (%)
j
Mitigation Adaptation Mitigation and adaptation
Number of operations that support climate change mitigation, adaptation, or both mitigation and adaptation in the last 3 years as a percentage of total number of climate change operations approved during the same period. Identification of the projects that support climate change mitigation and/or adaptation is based on the RRP or PFRs in the case of MFFs.

28
Standard Explanatory Data Definition
Activities should reflect at least one of the following categories to be classified as adaptation:
(i) addressing current drivers of vulnerability;
(ii) building resilience to current and future climate risks;
(iii) incorporating climate risks into investments; and
(iv) incorporating management of climate risk into plans, institutions, and policies.
Adaptation activities falling into these categories must in addition fulfill three design process criteria: (i) context of climate vulnerability, (ii) statement of purpose or intent to address or improve climate resilience, and (iii) link between project activities and the context of climate vulnerability, as reflected in the RRP. These criteria are necessary to differentiate between adaptation and development. Based on the joint approach, activities can be classified as contributing to climate change mitigation if it promotes “efforts to reduce or limit greenhouse gas emissions or enhance greenhouse gas sequestration.”
k
Consistent guidelines for project classification will be developed.
Sources: RRPs, PFRs, and e-Operations.
19. Operations supporting disaster risk reduction and management (%)
Number of operations that support disaster risk reduction and management in the last 3 years as a percentage of the total number of operations approved during the same period.
Sources: RRPs, PFRs, and e-Operations.
20. Financing for regional cooperation and integration (%)
l
Volume ($ amount) of operations with the thematic classification of regional cooperation and integration in the last 3 years as a percentage of total volume ($ amount) of operations approved during the same period. Regional cooperation and integration may or may not be the primary theme. The thematic classification of projects is based on the RRPs or PFRs in the case of MFFs.
Sources: RRPs, PFRs, and e-Operations.

29
Standard Explanatory Data Definition
21. Operations supporting Strategy 2020 core operational areas (%)
m
Number of sovereign and nonsovereign operations (including guarantees, equity investments, and B-loans) approved in the last year supporting Strategy 2020 core operational areas as a percentage of total number of ADB operations approved during the same period. Strategy 2020 core operational areas: infrastructure (transport, energy, water, and other infrastructure), environment, regional cooperation and integration, finance sector development; and education. Operations not classified as infrastructure, education, or finance sector are included if they have environment or regional cooperation and integration as theme, irrespective of whether or not this is the primary thematic classification.
Sources: RRPs, PFRs, and e-Operations.
22. Operations supporting other operational areas (%)
Number of sovereign and nonsovereign operations (including guarantees, equity investments, and B-loans) approved in the last year supporting other operational areas as a percentage of total number of ADB operations approved during the same period. Other operational areas: agriculture, health, industry, and public sector management.
Sources: RRPs, PFRs, and e-Operations.
23. Financing for other operational areas (%)
Volume ($ amount) of sovereign and nonsovereign operations (including guarantees, equity investments, and B-loans) approved in the last year supporting other operational areas as a percentage of total volume ($ amount) of ADB operations approved during the same period. Other operational areas: agriculture, health, industry, and public sector management.
Sources: RRPs, PFRs, and e-Operations.
24. Financing for food security (%)
Volume ($ amount) of sovereign and nonsovereign operations (including guarantees, equity investments, and B-loans) approved in the last 3 years supporting food security as a percentage of total volume ($ amount) of operations approved during the same period.

30
Standard Explanatory Data Definition
Food security investments can have three aspects: productivity, connectivity, and resilience to natural and economic shocks.
Sources: RRPs, PFRs, and e-Operations.
Strategy 2020 Drivers of Change
25. Financing for private sector development and private sector operations (%)
n
Volume ($ amount) of operations with the thematic classification of private sector development in the last 3 years as a percentage of total volume ($ amount) of operations approved during the same period. Private sector development may or may not be the primary theme. Private sector operations are generally classified as private sector development. The thematic classification of projects is based on the RRPs or PFRs in the case of MFFs.
Sources: RRPs, PFRs, and e-Operations.
26. Total number of nonsovereign operations approvals in Asian Development Fund countries (%)
Number of nonsovereign operations (including guarantees, equity investments, and B-loans) in ADF countries approved in the last 3 years, as a percentage of the total number of nonsovereign operations approved during the same period. The number of nonsovereign operations is based on the number of RRPs or PFRs in the case of MFFs circulated during the period.
Sources: RRPs, PFRs, and e-Operations.
27. Financing for governance and/or capacity development (%)
o
Volume ($ amount) of operations with the thematic classification of either governance or capacity development in the last 3 years as a percentage of the total volume of operations approved during the same period. Governance or capacity development may or may not be the primary theme. The thematic classification of projects is based on the RRPs or PFRs in the case of MFFs.
Sources: RRPs, PFRs, and e-Operations.
28. Financing for gender mainstreaming Volume ($ amount) of sovereign operations that

31
Standard Explanatory Data Definition
(%)p support gender mainstreaming in the last 3 years
as a percentage of total volume ($ amount) of sovereign operations approved during the same period. All sovereign operations use a four-tier system to measure the extent to which projects integrate gender issues in their design: (i) thematic classification of gender, (ii) effective gender mainstreaming (i.e., projects with specific design features that promote and facilitate women's access to and benefits from the project), (iii) some gender elements, and (iv) no gender elements. This gender mainstreaming indicator reports on the combined total of the first two categories. For the gender project classification system, see Guidelines for Gender Mainstreaming Categories of ADB Projects. http://www.adb.org/documents/ guidelines-gender-mainstreaming-categories-adb-projects The thematic classification of projects is based on the RRPs, and/or PFRs in the case of MFFs.
Sources: RRPs, PFRs, and e-Operations.
29. ADB perceived externally as excellent source of knowledge on development issues (% strongly agreeing)
q
Number of respondents who believe that ADB is an excellent source of knowledge on development issues, as a percentage of the total number of respondents to ADB’s Perceptions Survey. The indicator is based on responses of “strongly agreeing” with questions in the triennial multinational survey of opinion leaders and stakeholders under the section on ADB priorities and effectiveness.
Source: ADB Perceptions Survey. http://www.adb .org/publications/series/perceptions-survey
30. Level of engagement on social media (number)
Subscribers and followers Active engagement
Level of ADB-related engagement on social media in the reporting year, measured by:
(i) number of subscribers and followers of ADB on social media, including Twitter followers, Facebook “likes,” and YouTube channel and Scribd subscribers; and
(ii) active engagement in terms of number of retweets, favorites on Twitter, "people talking about this," "likes," "shares," or

32
Standard Explanatory Data Definition
comments on Facebook.
Source: ADB website statistics, Twitter, Facebook, and Department of External Relations.
31. Civil society organization participation in sovereign operations (% of approved operations)
r
Design stage Implementation stage Design and implementation
stage
Disaggregated data on approved sovereign operations in a year with elements of activity and/or participation by civil society organizations (CSOs) as reflected in the RRPs, as a percentage of the total number of sovereign operations approved during the year. Source: RRPs.
32. Country partnership strategies with civil society organizations action plan approved (number)
Of total CPSs in a given year, number of CPSs completed with a CSO action plan. The different approaches and depth of participation are defined in the ADB Guide to Participation, 2012. http://www.adb.org/sites/default/files/strengthening -participation-development-results.pdf
Source: NGO and Civil Society Center and Regional and Sustainable Development Department.
33. Cofinancing of ADB operations and technical assistance projects with civil society organizations (%)
Number of operations and TA projects approved where CSOs are cofinanciers in a given year. The different approaches and depth of participation are defined in the ADB Guide to Participation, 2012. http://www.adb.org/sites/default/files/strengthening -participation-development-results.pdf
Source: NGO and Civil Society Center and Regional and Sustainable Development Department.
Note: Cofinancing may also be provided by private foundations, private sector companies, and nongovernment organizations. Whether these types of contribution are classified as official or commercial cofinancing is generally determined on a case-by-case basis through interdepartmental consultation. a This SED is related to the RFI “Performance of sovereign operations at implementation rated satisfactory (%).”
b This SED is related to the RFI “Quality at entry of country partnership strategies rated satisfactory
(%).”
c This SED is related to the RFI “Quality at entry of sovereign operations rated satisfactory (%).”
d This SED is related to the RFI “Quality at entry of nonsovereign operations rated satisfactory (%).”
e This SED is related to the RFI “Project design and monitoring frameworks rated satisfactory (%).”
f These dimensions include impact, outcome, outputs, activities, indicators, data sources, and assumptions and risks.
g This SED is related to the RFI “Direct value-added cofinancing (% of ADB financing approved).”
h This SED is related to the RFIs “Operations contributing to inclusive economic growth focusing on growth and creation of jobs and opportunities (%), inclusive access to jobs and opportunities (%), and social protection (%).”

33
i This SED is related to the RFI “Operations supporting environmental sustainability (%).”
j This SED is related to the RFI “Operations supporting climate change mitigation and/or adaptation (%).” k OECD DAC, Definition of the Rio Marker on climate change mitigation. http://bit.ly/RioMit
l This SED is related to the RFI “Operations supporting regional cooperation and integration (%).” m
This SED is related to the RFI “Financing for Strategy 2020 core operational areas (%).” n
This SED is related to the RFI “Operations supporting private sector development and private sector operations (%).”
o This SED is related to the RFI “Operations supporting governance and/or capacity development (%).”
p This SED is related to the RFI “Operations supporting gender mainstreaming (%).”
q This SED is related to the RFI “Perceived ADB performance in promoting knowledge sharing and best practices
(%).” r This SED is related to the RFI “Civil society organization participation in sovereign operations (% of approved
operations).”

34
LEVEL 4: ADB ORGANIZATIONAL MANAGEMENT
Standard Explanatory Data Definition
Human Resources
1. Representation of women international staff at senior level (%)
a
Senior-level women international staff at levels 7–10 as a percentage of the total number of senior-level international staff at the same levels in a budget year.
Source: Institutional Gender Report.
2. Staff engagement survey results (index)
b
Analysis by category of the overall staff engagement index, which is derived from combining average favorable response rates to each of the 24 ADB attributes identified in the staff engagement survey.
c
Source: Staff Engagement Survey.
Process Efficiency and Client Orientation
3. Sovereign operations administered by resident missions (%)
d
Projects for which administration is led by staff (including outposted staff) in resident missions; the Pacific Liaison and Coordination Office in Sydney, Australia; the Special Office in Timor-Leste; and the Pacific Subregional Office in Suva, Fiji; as a percentage of all projects administered with substantial resident mission involvement.
Source: Human Resource Management Information System.
4. Sovereign operations administered by headquarters staff with resident mission staff participation in review mission(s) in the year (%)
d
Projects for which administration is led by headquarters staff and for which resident mission staff participated in review mission(s) in the year, as a percentage of all projects administered with substantial resident mission involvement.
Source: Human Resource Management Information System.
5. Budgeted international and national staff in resident missions (% of staff in regional departments)
Filled and vacant authorized international and national staff positions in resident missions as a percentage of the total number of such positions in regional departments in ADB in a budget year. The indicator includes regional department staff posted to resident missions.
Source: Human Resource Management Information System.

35
Standard Explanatory Data Definition
6. Processing time for sovereign projects (from start of loan fact-finding to Board approval, months)
e
Average time, in months, from start of loan fact-finding to Board approval of sovereign projects during the year.
Source: e-Operations.
7.
Processing time for policy-based operations (from start of loan fact-finding to Board approval, months)
e
Average time, in months, from start of loan fact-finding to Board approval of policy-based operations during the year.
Source: e-Operations.
8. Approval to effectiveness for sovereign operations (months)
Average time, in months, from Board approval of sovereign operations to effectiveness of loan agreement during the year. Approval refers to the Board approval date of the RRP. The effectiveness date is the day on which the loan, grant, or guarantee agreement comes into force. The agreement becomes effective after its signing by all parties, upon the borrower's compliance with the effectiveness conditions.
Source: e-Operations.
a This SED is related to the results framework indicator (RFI) “Representation of women in the international staff category (%).”
b This SED is related to the RFI “Staff engagement (index).”
c The staff engagement survey is conducted by an independent organization every 2 years to assess the level of ADB staff motivation.
d This SED is related to the RFI “Sovereign operations administered with substantial resident mission involvement
(%).” e This SED is related to the RFI “Sovereign operations processing time (from start of loan fact-finding to Board
approval, months).”

Appendix 36
THE ASIAN DEVELOPMENT BANK’S DEVELOPING MEMBER COUNTRIES
Table A1: ADB’s Developing Member Countries (as of September 2013)
Afghanistana Armeniaa Azerbaijan Bangladesha Bhutana Cambodiaa People’s Republic of China Cook Islands Fiji Georgiaa
India Indonesia Kazakhstan Kiribatia Kyrgyz Republica Lao People’s Democratic
Republica Malaysia Maldivesa Marshall Islandsa
Federated States of Micronesiaa
Mongoliaa Myanmar Naurua Nepala Pakistana Palaua Papua New Guineaa Philippines Samoaa
Solomon Islandsa Sri Lankaa Tajikistana Thailand Timor-Lestea Tongaa Turkmenistan Tuvalua Uzbekistana Vanuatua Viet Nama
ADB = Asian Development Bank. Note: Five developing members—Brunei Darussalam; Hong Kong, China; the Republic of Korea; Singapore; and Taipei,China—have graduated from regular ADB assistance and are not included in this table. The classification of Brunei Darussalam as a graduated developing member will be made effective upon the signing of a memorandum of understanding with ADB, outlining the systematic nature and strategic directions of assistance.
a Developing member countries with access to the ADF during its 11th replenishment period (2013–2016).
Source: ADB Strategy and Policy Department.
Table A2: Classification of ADB’s Developing Member Countries (as of September 2013)
Group C (OCR-Only) Group B (Blend Countries)a,b Group A (ADF-Only)b
Azerbaijan People’s Republic of China Cook Islands Fiji Indonesia Kazakhstan Malaysia Philippines Thailand Turkmenistan
Armenia Bangladesh Georgia India c Federated States of Micronesia Mongolia Pakistan Palau Papua New Guinea Sri Lanka Timor-Leste Uzbekistan Viet Nam
Afghanistan Bhutan Cambodia Kiribati Kyrgyz Republic Lao People’s Democratic Republic Maldives Marshall Islands Myanmar Nauru Nepal Samoa Solomon Islands Tajikistan Tonga Tuvalu Vanuatu
ADB = Asian Development Bank, ADF = Asian Development Fund, OCR = ordinary capital resources. a Countries that are eligible to borrow from ADF and have access to OCR.
b Countries with access to ADF during it 11th replenishment period (2013–2016), except those noted below.
c India is eligible for ADF assistance under ADB’s Graduation Policy but currently does not have access to the ADF.
Source: ADB Strategy and Policy Department.