standard bank iar 2016annualreport2016.standardbank.com/downloads/standard_bank_air… · 74...
TRANSCRIPT

Standard Bank Group Annual integrated report 2016 7574
“ROE is our most critical measure of shareholder value creation. The group’s ROE was 15.3% in 2016. We are focused on driving this measure to the upper end of our 15% to 18% target range over the medium term. To this end, we remain steadfast in our commitment to partnering with our clients on their growth journeys and we will concentrate on optimising resource allocation across the group, coupled with tighter management of capital supply and a diligent focus on improving our JAWs ratio.”
Arno Daehnke, Group financial director
OUR PERFORMANCE
Highlights of the group’s 2016 results
Group headline earnings and headline earnings per share increased by 4% to R23 009 million and 1 440 cents respectively#. The board declared a final dividend of 440 cents per share, bringing the total dividend for the year to 780 cents, up 16% on 2015. At year end, the group’s capital position was above the upper end of the group’s target range, which supported our decision to grow dividends faster than earnings.
We were particularly pleased that our banking activities’ headline earnings grew by 9% to R22 062 million and achieved an ROE of 16.8%, an improvement from 16.3% in the prior year. Strong income growth, a benign credit loss ratio of 0.86% and a positive JAWs ratio supported this result. Group ROE was 15.3%, down from 15.6% in 2015#.
Despite the elevated levels of macroeconomic, political and policy uncertainty experienced in many of the markets in which the group operates, we continued to grow our businesses in South Africa and in the Africa Regions, the latter contributing 25% to both the group’s total income and headline earnings in the 2016 financial year.
Note: Up to the end of December 2015, the group normalised its results. From 1 January 2016, the group reverted to IFRS as its primary reporting basis.
Refer to www.reporting.standardbank.com/reporting for further details on the group’s normalised results.
Rm
20142012 20162013 2015
%
18
16
14
12
10
8
6
4
2
■■ Group headline earnings Group ROE
30 000
25 000
20 000
15 000
10 000
5 000
Headline earnings and ROECAGR (2012 – 2016): 12%
■■
Cents %
Dividend per share and dividend payout ratioCAGR (2012 – 2016): 14%
20142012 20162013 2015
%
■■ Dividend per share Dividend payout ratio
■■
1 000
800
600
400
200
62.5
50.0
37.5
25.0
12.5
Group financial review
Demonstrating value creation
1 440 centsHEPSFY15: 1 389 cents Lib
86bpsCredit loss ratioFY15: 87bps
16.8%Banking ROEFY15: 16.3%
15.3%SBG ROEFY15: 15.6%Lib
0.3%JAWsFY15: (2.0%)
780 centsDPSFY15: 674 cents
R22 062 millionBanking headline earningsFY15: R20 323 million
13.9%CET 1 ratioFY15: 12.9%
Lib
HEADLINE EARNINGS BY BUSINESS UNIT
Change%
2016Rm
2015Rm
Personal & Business Banking 12 12 630 11 280Corporate & Investment Banking 16 10 558 9 076Central and other (>100) (1 126) (33)
Banking activities 9 22 062 20 323Other banking interests 99 (8) (569)Liberty (61) 955 2 433
Standard Bank Group 4 23 009 22 187
R23 009 millionSBG headline earningsFY15: R22 187 million Lib
Lib
# Lib

Standard Bank Group Annual integrated report 2016 75
Group headline earnings and headline earnings per share increased by 4% to R23 009 million and 1 440 cents respectively#. The board declared a final dividend of 440 cents per share, bringing the total dividend for the year to 780 cents, up 16% on 2015. At year end, the group’s capital position was above the upper end of the group’s target range, which supported our decision to grow dividends faster than earnings.
We were particularly pleased that our banking activities’ headline earnings grew by 9% to R22 062 million and achieved an ROE of 16.8%, an improvement from 16.3% in the prior year. Strong income growth, a benign credit loss ratio of 0.86% and a positive JAWs ratio supported this result. Group ROE was 15.3%, down from 15.6% in 2015#.
Despite the elevated levels of macroeconomic, political and policy uncertainty experienced in many of the markets in which the group operates, we continued to grow our businesses in South Africa and in the Africa Regions, the latter contributing 25% to both the group’s total income and headline earnings in the 2016 financial year.
Note: Up to the end of December 2015, the group normalised its results. From 1 January 2016, the group reverted to IFRS as its primary reporting basis.
Refer to www.reporting.standardbank.com/reporting for further details on the group’s normalised results.
Rm
20142012 20162013 2015
%
18
16
14
12
10
8
6
4
2
Group headline earningsGroup ROE
30 000
25 000
20 000
15 000
10 000
5 000
Headline earnings and ROECAGR (2012 – 2016): 12%
Cents %
Dividend per share and dividend payout ratioCAGR (2012 – 2016): 14%
20142012 20162013 2015
%
Dividend per shareDividend payout ratio
1 000
800
600
400
200
62.5
50.0
37.5
25.0
12.5
HEADLINE EARNINGS BY BUSINESS UNIT
Change%
2016Rm
2015Rm
Personal & Business Banking 12 12 630 11 280Corporate & Investment Banking 16 10 558 9 076Central and other (>100) (1 126) (33)
Banking activities 9 22 062 20 323Other banking interests 99 (8) (569)Liberty (61) 955 2 433
Standard Bank Group 4 23 009 22 187
Lib
# Lib

76
OUR PERFORMANCE Group financial review continued
Key drivers of our performance for the yearDespite the difficult operating environment, the group’s banking activities delivered strong headline earnings growth and an improved ROE of 16.8% from 16.3% the year before. This was mainly attributable to continued net interest income growth, the resilience of our balance sheet, and our diversified footprint across Africa.
1. Continued net interest income growthNet interest income (NII) has continued to increase and, over the period since 2012, has grown by, on average, 14% per annum. In 2016, NII grew 15% due to a growing average loan book and expanding margins. Average interest-earning assets grew by 6% for the year under review and average interest earning loans to customers grew by 8.5%. Margins on interest-earning assets widened by 44 basis points to 477 basis points, mainly attributable to:
A positive endowment impact totalling R2.6 billion or 21 basis points
Increased loan pricing of 11 basis points, mainly in PBB, with good portfolio concession management in home loans and higher rates on new revolving credit plans in South Africa
A positive impact of 10 basis points on the funding margin as reliance on wholesale-priced funding reduced.
Rm
20142012 20162013 2015
%
60 000
50 000
40 000
30 000
20 000
10 000
5
4
3
2
1
Net interest income and net interest marginCAGR (2012 – 2016): 14%
Net interest incomeNet interest margin before impairment chargesNet interest margin after impairment charges
bps
MixEndowment Funding Other
480
470
460
450
440
430
420
410
Loanpricing
Margin analysis on interest-earning assets
FY15 FY16
21
11
10
3 1
Standard Bank Group Annual integrated report 2016 77
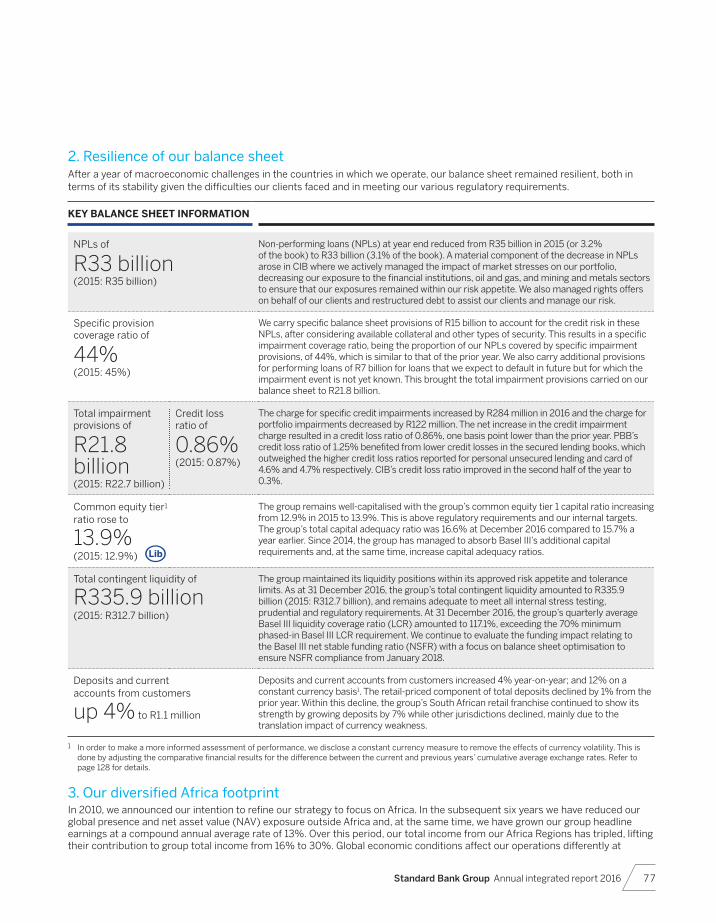
2. Resilience of our balance sheetAfter a year of macroeconomic challenges in the countries in which we operate, our balance sheet remained resilient, both in terms of its stability given the difficulties our clients faced and in meeting our various regulatory requirements.
KEY BALANCE SHEET INFORMATION
NPLs of
R33 billion
(2015: R35 billion)
Non-performing loans (NPLs) at year end reduced from R35 billion in 2015 (or 3.2% of the book) to R33 billion (3.1% of the book). A material component of the decrease in NPLs arose in CIB where we actively managed the impact of market stresses on our portfolio, decreasing our exposure to the financial institutions, oil and gas, and mining and metals sectors to ensure that our exposures remained within our risk appetite. We also managed rights offers on behalf of our clients and restructured debt to assist our clients and manage our risk.
Specific provision coverage ratio of
44%
(2015: 45%)
We carry specific balance sheet provisions of R15 billion to account for the credit risk in these NPLs, after considering available collateral and other types of security. This results in a specific impairment coverage ratio, being the proportion of our NPLs covered by specific impairment provisions, of 44%, which is similar to that of the prior year. We also carry additional provisions for performing loans of R7 billion for loans that we expect to default in future but for which the impairment event is not yet known. This brought the total impairment provisions carried on our balance sheet to R21.8 billion.
Total impairment provisions of
R21.8billion
(2015: R22.7 billion)
Credit loss ratio of
0.86%
(2015: 0.87%)
The charge for specific credit impairments increased by R284 million in 2016 and the charge for portfolio impairments decreased by R122 million. The net increase in the credit impairment charge resulted in a credit loss ratio of 0.86%, one basis point lower than the prior year. PBB’s credit loss ratio of 1.25% benefited from lower credit losses in the secured lending books, which outweighed the higher credit loss ratios reported for personal unsecured lending and card of 4.6% and 4.7% respectively. CIB’s credit loss ratio improved in the second half of the year to 0.3%.
Common equity tier1 ratio rose to
13.9%(2015: 12.9%)
The group remains well-capitalised with the group’s common equity tier 1 capital ratio increasing from 12.9% in 2015 to 13.9%. This is above regulatory requirements and our internal targets. The group’s total capital adequacy ratio was 16.6% at December 2016 compared to 15.7% a year earlier. Since 2014, the group has managed to absorb Basel III’s additional capital requirements and, at the same time, increase capital adequacy ratios.
Total contingent liquidity of
R335.9 billion
(2015: R312.7 billion)
The group maintained its liquidity positions within its approved risk appetite and tolerance limits. As at 31 December 2016, the group’s total contingent liquidity amounted to R335.9 billion (2015: R312.7 billion), and remains adequate to meet all internal stress testing, prudential and regulatory requirements. At 31 December 2016, the group’s quarterly average Basel III liquidity coverage ratio (LCR) amounted to 117.1%, exceeding the 70% minimum phased-in Basel III LCR requirement. We continue to evaluate the funding impact relating to the Basel III net stable funding ratio (NSFR) with a focus on balance sheet optimisation to ensure NSFR compliance from January 2018.
Deposits and current accounts from customers
up 4% to R1.1 million
Deposits and current accounts from customers increased 4% year-on-year; and 12% on a constant currency basis1. The retail-priced component of total deposits declined by 1% from the prior year. Within this decline, the group’s South African retail franchise continued to show its strength by growing deposits by 7% while other jurisdictions declined, mainly due to the translation impact of currency weakness.
1 In order to make a more informed assessment of performance, we disclose a constant currency measure to remove the effects of currency volatility. This is done by adjusting the comparative financial results for the difference between the current and previous years’ cumulative average exchange rates. Refer to page 128 for details.
3. Our diversified Africa footprintIn 2010, we announced our intention to refine our strategy to focus on Africa. In the subsequent six years we have reduced our global presence and net asset value (NAV) exposure outside Africa and, at the same time, we have grown our group headline earnings at a compound annual average rate of 13%. Over this period, our total income from our Africa Regions has tripled, lifting their contribution to group total income from 16% to 30%. Global economic conditions affect our operations differently at
Lib

78
OUR PERFORMANCE Group financial review continued
4. Volatile currenciesGlobal markets were unsettled by the UK’s decision to leave the European Union in June (“Brexit”) and by the outcome of the US presidential election in November, both of which led to currency volatility. Our home and reporting currency, the rand, was impacted by this volatility, as well as by local political and economic issues.
The rand ended 2016 at 13.69 to the US dollar, much stronger than the opening position of 15.50 after the change in the Finance Minister in December 2015. This, together with the rand strengthening against other currencies, led to the translation of our foreign currency-denominated balance sheets at a stronger rand exchange rate, which resulted in the group’s foreign currency translation reserves (FCTR) decreasing by R11.4 billion#. The group’s FCTR is discussed in further detail on page 93.
During 2016, the group’s results were materially affected by the variability of major African currencies relative to the rand. Two markets saw significant dislocations in their currencies: Nigeria, when it floated its currency in June, and Mozambique, which steadily lost value in its currency. This created a difficult operating environment for our Africa Regions’ operations which was further diluted when translating those operations’ results into rands.
Although our diversified African footprint is delivering pleasing results, these currency movements during 2016 significantly impacted our operations. Headline earnings growth was diluted and, on a constant currency basis, our Africa Regions reported a net asset value increase of 32%, compared to a reported decrease of 15% in rand terms.
Depreciation of major African currencies
Jan2016
— ZAR/NGN — ZAR/GHS — ZAR/KES— ZAR/MZN — ZAR/AOA
220
200
180
160
140
120
100
Jan2017
Mar2016
May2016
Jul2016
Sep2016
Nov2016
different times, and local conditions are idiosyncratic in their movements. Our diversified footprint across the 20 countries in which we operate in sub-Saharan Africa has contributed to the 24% average year-on-year growth in headline earnings in our Africa Regions since 2011.
During 2016, our Africa Regions grew overall headline earnings by 3% to R5.7 billion from R5.5 billion in 2015 – on a constant currency basis this growth was 7%. Our Africa Regions’ headline earnings now represent a quarter of the group’s headline earnings.
Our east Africa region delivered positive results in 2016, growing total income by 17% to R6.1 billion despite interest rate caps in Kenya that negatively impacted NII. Credit impairments rose sharply by 60% to R425 million and headline earnings grew by 12% to R1.2 billion.
Our largest and most mature grouping of banks in the south and central region grew revenues by 8% to R11.6 billion, and by 14% on a constant currency basis. After accounting for higher credit impairments, particularly in Mozambique, increased costs and a higher tax charge, this region’s headline earnings declined by 3% to R2.9 billion, but grew by 2% on a constant currency basis.
Our west Africa region grew headline earnings by 8% to R1.6 billion. Excluding gains on property investments in the prior year, headline earnings increased 28%. This result was achieved despite absorbing a higher credit impairment charge in this commodity rich region, an increased tax charge and our investment in the Ivory Coast, which was granted a banking licence in 2016.
Our operations in Nigeria returned to being the largest contributor to our Africa Regions’ headline earnings, closely followed by Mozambique and Uganda.
The ROEs in our Africa Regions dropped overall as countries, on average, increased their capital adequacy ratios to build resilience and continued to invest in partnering our clients on their growth journeys.
Rbn
2014
Africa Regions’ headline earnings
2012 20162013 2015
East (19% CAGR)South and central (17% CAGR)West (55% CAGR)
6
5
4
3
2
1
# Lib

Standard Bank Group Annual integrated report 2016 79
Looking aheadThe momentum in economic growth seen towards the end of 2016, driven by China and the US, has continued into 2017. The International Monetary Fund (IMF) is forecasting an improvement in global growth from 3.1% in 2016 to 3.4% and 3.6% in 2017 and 2018 respectively. Global trade activity is expected to increase due to policy stimulus and a gradual normalisation of large economies, such as Brazil and Russia. However, uncertainty surrounding US policy direction under the new administration, Brexit negotiations and the broader European macroeconomic outlook may pose downside risks to global growth prospects.
Sub-Saharan Africa’s GDP growth is expected to be 2.8% for 2017, buoyed by global trade, resource demand and generally improved economic prospects. Agriculture sectors in drought-stricken countries benefited from rains in late 2016 and early 2017. Commodity exporters will benefit from the commodity price recovery in late 2016 and into 2017. Nigeria is expected to return to growth, after a contraction of 1.5% in 2016, subject to oil supply and an easing of foreign exchange restrictions. South Africa’s growth forecast of 1.5% is an improvement, but remains subject to idiosyncratic event risk, such as rating agency and political decisions in the coming year. Lastly, the South African Reserve Bank has indicated that it expects interest rates to remain flat, subject to inflation and exchange rate developments, and household consumption and fixed investment are likely to stay constrained.
We measure our strategic progress as a group using five value drivers, as discussed on page 12 in this report. Looking forward, we will focus on all five value drivers as described below.
CLIENT FOCUS
With the macroeconomic dynamics in mind, we look to our clients, to the challenges and opportunities they may face, and seek ways to partner with them on their journeys in 2017 and beyond. As we focus on delivering market-leading client experiences, we continue to invest in our client-facing digital capabilities to enable our clients to transact independently and safely anytime, anywhere. We recognise and value the trust that our clients place in us and remain vigilant in our efforts to protect our clients’ resources and data. Accordingly, we continue to monitor developments and potential threats, engage with industry bodies and invest in our defences to enhance our resilience.
EMPLOYEE ENGAGEMENT
The businesses we operate are complex and we rely on our people across our network to navigate the challenges each business faces and make appropriate decisions in line with strategic priorities. To this end, we continue to invest and equip our people with the skills required, empower them to make decisions, hold them accountable and celebrate their successes. Furthermore, we are seeking opportunities to use technology to leverage our data to inform decisions, deliver client specific solutions and drive process efficiency and productivity gains.
RISK AND CONDUCT
We remain steadfast in our commitment to doing the right business the right way. In this context, we continue to embed a culture of responsible business practices. We recognise the need to balance prudent capital management with appropriate return-based resource allocation and leverage.
FINANCIAL AND SEE OUTCOME
We remain committed to delivering through-the-cycle headline earnings growth and driving ROE to the upper-end of our target range of 15% to 18% over the medium term#. With regards to Liberty, we are working closely with its board and management and are supportive of their efforts to address their shorter term challenges relating to sales, the competitiveness of Liberty’s product suite and ongoing cost management.
As a bank we play an important role in society which is broader than creating shareholder value. We seek to create value for all our stakeholders - clients, employees, shareholders, government and communities alike. In doing so, we continue to contribute meaningfully to the social, economic and environmental prosperity and wellbeing in the markets in which we operate.
For further discussion of our social, economic and environmental outcomes refer to the group’s report to society available at www.sustainability.standardbank.com.
# Lib

Standard Bank Group Annual integrated report 2016 8180
OUR PERFORMANCE Group financial review continued
Economic environment impacting our banking activitiesBelow we provide a summary of the economic environment of the top seven countries, as measured by headline earnings contribution to the group.
The commentary below has been written from a local currency perspective.
Economics data obtained from the group’s internal research team.
Currency impact GDP result Commentary on our operation’s results in the country
Nigeria The naira weakened by 58% against the US dollar. Although there has been some relaxation of controls on foreign exchange trading, foreign exchange supply did not improve significantly, which created difficult operating conditions for businesses and placed strain on the economy.
GDP contraction estimated to be 1.5% (2015: growth of 2.8%).
Despite the challenging macroeconomic environment driven by the depreciation of the naira, forex shortages and higher inflation, local currency earnings demonstrated resilience with impressive double digit growth. A smaller asset base (due to contained risk appetite), a higher but well-controlled cost base and significantly increased impairments were cushioned by a strong performance from the Wealth business and expanding margins as a greater weighting of transactional balances repositioned the funding book.
COUNTRY OF OPERATION ECONOMIC ENVIRONMENT AND THE IMPACT ON BANKING RESULTS
Mozambique The metical weakened by 50% against the US dollar. Following the announcement of undeclared state-owned entities’ borrowings, which led to the suspension of foreign aid, the supply of foreign exchange reduced. The Central Bank of Mozambique lifted interest rates to 23.25% from 9.75% during the year, which had a negative impact on consumers and the economy.
GDP growth estimated to be 2.5% (2015: 6.9%).
Earnings grew, despite the weaker currency. This was driven by total income growth due to increased activity in transactional, card and foreign exchange retail business, as well as the positive endowment effect of higher interest rates.
Uganda The shilling depreciated by 7% against the US dollar. Government spending resulted in elevated debt levels without any positive impact on growth. The drought in 2016 is expected to lead to a further reduction in foreign currency inflows.
GDP growth estimated at 3.0% (2015: 5.5%).
A strong increase in local currency earnings was achieved largely due to a strongly positive JAWs ratio, despite the impact of a reduction in interest rates and contracting endowment benefits. The impact of the latter was, however, contained by effective endowment hedges.
Namibia The Namibian dollar appreciated by 12% against the US dollar. The economy benefited from a relatively high degree of regulatory efficiency and liberal trade policies.
GDP growth estimated at 1.2% (2015: 5.3%).
Year-on-year earnings were flat, largely due to costs increasing at a rate faster than the growth in income. Higher funding costs dampened the growth in net interest margin (NIM). Operating expenses were higher in part due to an increased investment in staff, systems and points of representation.
Ghana The cedi weakened by 12% against the US dollar, mainly due to pre-election concerns. Fiscal deficits have kept the country in a cycle of borrowing and debt servicing.
GDP growth estimated to be 4.2% (2015: 3.9%).
High interest and inflation rates focused our efforts to improve our credit risk profile, which resulted in impairment losses declining year-on-year. Constrained risk appetite also translated into reduced customer lending which resulted in single digit top line growth. Despite double digit inflation rates, costs were contained, and, despite the challenges, satisfactory growth in headline earnings was achieved.
Kenya The currency remained relatively flat year-on-year against the US dollar. Drought conditions became evident in the food-growing parts of the country towards the end of the year. This has the potential to reduce food production and contribute to higher inflation in 2017, placing strain on consumers.
GDP growth estimated to be 5.7% (2015: 5.3%).
Local currency headline earnings contracted due to credit impairments and the initial impact on NIM of the interest rate caps (on lending rates) and floors (on deposits), which came into effect in September 2016.
South Africa The rand appreciated by 14% against the US dollar despite the risk of a sovereign downgrade during the year. Although the downgrade was avoided, country risk remained elevated with an adverse effect on the economy. Tightening monetary policy contributed to declining real disposable income and, combined with rising food inflation, negatively affected consumers.
GDP growth estimated to be 0.4% (2015: 1.3%).
SBSA reported strong headline earnings growth of 9% notwithstanding the difficult economic conditions. Increased NIM supported this growth, slightly offset by cost growth due to higher amortisation expenses and the impact of operational risk losses which included the Japan card fraud of R300 million.
COUNTRY OF OPERATION ECONOMIC ENVIRONMENT AND THE IMPACT ON BANKING RESULTS

Standard Bank Group Annual integrated report 2016 8382
OUR PERFORMANCE Group financial review continued
Interest expense
Net fee and commission
revenue
Trading revenue
Other revenue
Income from investment
management and life insurance
activities
Other operating costs
Interest income and credit
impairments
Staff costs
Measuring our financial outcome
OUR PERFORMANCE
Headline earnings*
The group’s headline earnings is one of the components used in the determination of the group’s ROE and represents the major lever in lifting the group’s ROE to continue to meet our medium-term target. Headline earnings is used as a key reference point in decision making throughout the group.
Credit impairments (CAGR: 2%)
While the credit impairment charge increased on average by 2% since 2012, the credit loss ratio has declined to 0.86%. The decline in the credit loss ratio followed an improvement in recoveries due to rehabilitation strategies, recovery effectiveness and more stringent credit criteria. During 2016, credit impairments increased marginally by 2%.
Operating expenses (CAGR: 11%)
Operating expenses increased over the period as a result of inflation, increased headcount to expand our footprint across the Africa Regions, a weaker exchange rate, increased amortisation of intangible assets entering production and higher associated IT support costs. Total operating expenses increased by 9% in 2016 following growth in headcount and higher operational risk losses. The cost-to-income ratio, however, decreased as a result of total cost growth being lower than the growth in total income.
Non-interest revenue (CAGR: 7%)
Growth in NIR over the period is attributable to the increase in interchange fee income as a result of growth in the group’s customer base, transactional volumes and points of representation, notably in the Africa Regions. During the year, NIR grew by 3% through higher card-based commissions together with strong organic volume growth, new merchant acquisitions and terminal price increases in South Africa, increased account transaction fee income from a larger customer base and increased transaction volumes, and double digit growth in electronic transaction fees.
Contributing to the 15% compound growth from 2012 to 2016 in banking activities’ headline earnings is the growth in our Africa Regions’ headline earnings of 24% and the 5% growth in SBSA’s headline earnings. The strong growth in NII and NIR, which exceeded the growth in credit impairments and operating expenses, contributed to this growth in headline earnings. This growth was, however, offset by losses post the global financial crisis in the group’s London based operation, SB Plc, of which 60% was disposed of effective 1 February 2015.
Banking activities’ headline earnings (CAGR: 15%)
Net loans and advances (CAGR: 7%)
1 200
1 000
800
600
400
200
Rbn2012 2013 2014 2015 2016
Deposits and debt funding (CAGR: 7%)
1 400
1 200
1 000
800
600
400
200Rbn
2012 2013 2014 2015 2016
Trading and pledged assets, net derivatives and financial investments (CAGR: 7%)
300
250
200
150
100
50
Rbn2012 2013 2014 2015 2016
Net interest income (CAGR: 14%)
The cumulative effect of improved risk-based pricing strategies, optimisation of funding composition and growth in the group’s Africa Regions has supported the growth in the group’s NII. During the year, NII grew 15% on the back of a growing average loan book, widened margins and the positive endowment impact of lower average interest rates.
60
50
40
30
20
10
Rbn2012 2013 2014 2015 2016
5
4
3
2
1
%
Net interest incomeNIMNIM after credit impairments
12
10
8
6
4
2
Rbn2012 2013 2014 2015 2016
1.2
1.0
0.8
0.6
0.4
0.2
%
Total credit impairmentsCredit loss ratio
60
50
40
30
20
10
Rbn2012 2013 2014 2015 2016
60
55
50
45
40
35
%
OtherIT and amortisationDepreciationStaff costsCost-to-income ratio
25
20
15
10
5
Rbn2012 2013 2014 2015 2016
Between 2012 and 2015, Liberty’s headline earnings benefited from a steady improvement in its operating earnings but this moderated as a result of lower shareholder investment portfolio gains. Liberty’s headline earnings attributable to the group decreased in 2016 by 61% to R955 million as a result of lower investment returns, a challenging consumer environment and the accounting mismatch of R167 million that arose as a result of the listing of its REIT structure during December 2016.
The reduction in the headline earnings loss from the group’s other banking interests to R8 million in 2016 was as a result of the loss from the group’s 40% interest in ICBCS more than halving in 2016.
Liberty’s headline earnings – SBG share (CAGR: -15%)
Other banking interests’ headline earnings
2.5
2.0
1.5
1.0
0.5
Rbn2012 2013 2014 2015 2016
0.4
0.2
(0.2)
(0.4)
Rbn2013 20162014 2015
Group headline earnings (CAGR: 12%)
Group headline earnings growth of 12% over the period, has enabled the group to deliver growth in dividends per share of 14%.
25
20
15
10
5
2012 2013 2014 2015 2016
800
600
400
200
centspershare
Rbn
Group headline earningsDividend per share
BANKING ACTIVITIES
Growth in deposits and debt funding and loans and advances have provided the group’s banking activities with the ability to increase its headline earnings between 2012 and 2016 by a compound annual growth rate (CAGR) of 15%.
Banking activities’ balance sheet drivers
Net fee and commission revenueTrading revenueOther revenue
50
40
30
20
10
Rbn2012 2013 2014 2015 2016
* Restated to be presented on an IFRS basis. The group previously reported its financial results on a normalised basis. Refer to www.reporting.standardbank.com/reporting for further details.
Lib
Our clients

Standard Bank Group Annual integrated report 2016 8584
OUR PERFORMANCE Group financial review Measuring our financial outcome continued
Our ROE is the most relevant measure of our financial performance over time as it combines all of our critical drivers, including earnings growth and capital utilisation, into a single metric. Internally, we also measure our return on risk-weighted assets (RoRWA) as a more direct measure of earnings relative to regulatory capital utilisation. Understanding the drivers of ROE is key to understanding the success of our strategy and business performance over time.
Return on equity*
Refer to page 82 for detail on our headline earnings.
For details regarding the group’s cost of equity refer to the group’s risk and capital management report
3.0
2.5
2.0
1.5
1.0
0.5%
2012 2013 2014 2015 2016
25
20
15
10
5
2012 2013 2014 2015 2016
800
600
400
200
centspershare
Rbn
Group headline earningsDividend per share
Between 2012 and 2016, the group’s average risk-weighted assets (RWA) increased as a result of higher regulatory requirements as required by Basel III, banking book operational growth and rand weakness. The increasing trend was partially offset in 2015 by a decrease in average RWA following the disposal of the group’s controlling interest in SB Plc.
Group average risk-weighted assets (CAGR: 3%)
900
800
700
600
500
400
Rbn2012 2013 2014 2015 2016
Return on equity
In 2016, the group’s ROE remained within the medium-term target range of 15% to 18%. While banking activities’ ROE increased to 16.8% from 16.3% in the previous year as a result of headline earnings growth exceeding average shareholders’ equity, the 61% decrease in Liberty’s headline earnings resulted in the group’s ROE decreasing from 15.6% to 15.3%.
medium-term ROE target of
15% – 18%
20
18
16
14
%2012 2013 2014 2015 2016
ROE
18
15
The group’s average shareholders’ equity increased between 2012 and 2016 primarily as a result of growth in the group’s retained earnings. The group’s FCTR further contributed to the increase in shareholders’ equity from 2012 to 2015, but decreased significantly in 2016 following a stronger rand.
Average shareholders’ equity
160140120100
80604020
Rbn2012 2013 2014 2015 2016
The group’s financial leverage is determined by dividing the group’s average RWA by the group’s average shareholders’ equity. The decreasing trend from 2012 to 2016 of the group’s financial leverage is due to the average shareholders’ equity increasing at a faster rate than the increase of the group’s average RWA.
Group financial leverage 87654321
times2012 2013 2014 2015 2016
CLIENT FOCUS
EMPLOYEE ENGAGEMENT
RISK AND CONDUCT
Our value drivers, which contribute to
delivering progressively improving ROE, will allow
us to meet our
For detail of the value drivers, see page 12.
* Restated to be presented on an IFRS basis. The group previously reported its financial results on a normalised basis. Refer to www.reporting.standardbank.com/reporting for further details.
Group headline earnings (CAGR: 12%)
Average shareholders’ equity (CAGR: 10%)
Group return on average risk-weighted assets (CAGR: 9%)
The group’s return on average risk-weighted assets (RoRWA) has increased from 1.9% in 2012 to 2.7% in
2016. This was driven by the 12% growth in the group’s headline earnings as compared to the 3% growth in the
group’s average RWA. The significant improvement in RoRWA in 2015 was due to the material reduction
in loss from SB Plc and the removal of the RWA
associated with this operation following its
disposal in February 2015.
Lib

86
OUR PERFORMANCE Group financial review continued
Income statement analysisThe income statement reflects the revenue generated by the group and the costs incurred in generating that revenue. The analysis that follows discusses the group’s financial performance and the principal headline earnings drivers for growth in our ROE as explained further on page 82. We have also explained other material income statement line items.
GROUP INCOME STATEMENT FOR THE YEAR ENDED 31 DECEMBER 2016
Change%
2016Rm
2015Rm
Net interest income 15 56 892 49 310Non-interest revenue 3 42 965 41 803
Net fee and commission revenue 8 29 012 26 920Trading revenue (0) 10 988 11 016Other revenue (23) 2 965 3 867
Total income 10 99 857 91 113Credit impairment charges 2 9 533 9 371
Specific credit impairments 4 8 382 8 098Portfolio credit impairments (10) 1 151 1 273
Income before operating expenses 10 90 324 81 742Operating expenses 9 56 235 51 434
Staff costs 11 30 976 27 968Other operating expenses 8 25 259 23 466
Net income before equity accounted earnings 12 34 089 30 308Share of profit from associates and joint ventures (25) 172 229
Net income before non-trading and capital related items 12 34 261 30 537Non-trading and capital related items 20 (1 123) (1 402)
Goodwill impairment (45) (482) (333)Impairment of intangible assets 46 (654) (1 220)Gains on disposal of group entities (80) 61 311Other non-trading and capital items 70 (48) (160)
Net income before indirect taxation 14 33 138 29 135Indirect taxation (6) 1 865 1 981
Profit before direct taxation 15 31 273 27 154Direct taxation 30 7 631 5 873
Profit for the year from continuing operations 11 23 642 21 281Profit from discontinued operation (100) 2 741
Profit for the year (2) 23 642 24 022Attributable to non-controlling interests 16 1 977 1 704Attributable to preference shareholders 8 406 377
Attributable to ordinary shareholders – banking activities (3) 21 259 21 941Headline adjustable items – banking activities >100 803 (1 618)
Headline earnings – banking activities 9 22 062 20 323Headline earnings – other banking interests 99 (8) (569)Headline earnings – Liberty (61) 955 2 433
Standard Bank Group headline earnings 4 23 009 22 187

Standard Bank Group Annual integrated report 2016 87
acquisitions and annual terminal price increases in South Africa, as well as continued merchant acquisitions and higher transaction volumes in Namibia, Zimbabwe, Mozambique and Zambia. The impact of interchange fee reforms introduced in South Africa from March 2015 partly offset this growth.
Other fee and commission revenue growth of 16% to R5 billion was achieved through continued growth in assets under management in Nigeria, higher securities lending fees and growth in guarantees, arrangement and commitment fees in South Africa.
Knowledge-based fees and commissions decreased by 4% to R2.2 billion due to reduced capital markets activity in the Africa Regions.
While trading revenue was flat year-on-year, CIB’s client franchise trading revenues were up 8%. The group’s trading revenue continues to be generated from its diverse client base active in sub-Saharan Africa and benefited from volatility in financial markets as clients took a more active stance in protecting themselves against risk. Trading revenue further benefited from higher client activity in equities and foreign exchange trading due to increased foreign exchange volatility in Uganda, Ghana, Nigeria and South Africa. These gains were, however, offset by foreign currency-related losses on the group’s strategic currency hedging initiatives in the Africa Regions.
Other income was down 23% to R3 billion due to gains on the disposal of certain property investments, together with the associated rental income not repeated in the year under review.
Rm
50 000
40 000
30 000
20 000
10 000
2014
Analysis of non-interest revenueCAGR (2012 – 2016): 7%
2012 20162013 2015
Net fee and commission revenueTrading revenueOther revenueNon-interest revenue to total revenue
%
60
48
36
24
Net interest income
Net interest income is the difference between interest received on lending products and investments, and the interest paid on our deposits and debt funding. The interest margin expresses net interest income as a ratio to total average assets. The movement in benchmark lending rates, such as the prime rate in South Africa, is a key factor that causes the net interest margin to vary.
Refer to page 76 for further detail.
Non-interest revenue
Non-interest revenue comprises net fee and commission revenue, trading and other revenue. The net fee and commission revenue is closely linked to transactional banking volumes, which are a function of economic activity and competition for banking services. Trading revenue is a function of trading volumes and market volatility that affects trading spreads. Other revenue consists of other banking activity-related revenue, including property-related revenue and income derived from bancassurance agreements.
The net fee and commission revenue growth of 8% was largely due to the following:
Account transaction fees increased by 5% to R11.4 billion, due to higher transactional volumes and overnight increases on cash withdrawal, cash deposits and cheque encashment fees on business and commercial transactions, as well as strong transactional growth in the upper-income personal segment and the introduction of a service fee within the Access account portfolio in South Africa. Further contributing to the increase was the growth in the client base and higher transactional volumes in Nigeria, Ghana, Malawi and Mozambique.
Electronic banking fees growth of 14% to R3.2 billion was attributable to increased business online activity and the optimisation of ATMs in South Africa, growth in instant money transactions and higher online transactional volumes in Zimbabwe, Uganda and Nigeria. The impact of lower transaction fees in Nigeria due to the abolishment of ATM charges coupled with a reduction in fees charged to the customer as required by the Central Bank of Nigeria, partly offset this growth.
The growth of 12% in card-based commissions to R6.3 billion was attributable to competitive pricing and higher Mastercard and Visa commissions earned in Nigeria, strong organic volume growth, new merchant

88
OUR PERFORMANCE Group financial review continued
Rm
12 000
10 000
8 000
6 000
4 000
2 000
(2 000)2014
Credit impairment chargesCAGR (2012 – 2016): 2%
2012 20162013 2015
%
1.5
1.0
0.5
(0.5)
Specific credit impairmentsPortfolio credit impairmentsCredit loss ratio
Operating expenses
Operating expenses represent the costs that are incurred to generate current and future revenues. Inflation and foreign exchange rates are key external variables that contribute to the increase in operating expenses. Many internal factors also affect the growth in operating expenses, such as our staffing levels and investments in our branch and IT infrastructure.
Operating expenses increased by 9% year-on-year and the group’s cost-to-income ratio improved from 56.5% to 56.3%. Staff costs increased 11% due to several factors: salary increases, the conversion of temporary staff to permanent employment, increases in headcount in the Africa Regions to support business growth, innovation and digital banking and wealth and investment initiatives, and the increased amortisation of the previous year’s incentive awards. Other operating expenses rose 8% due to higher premises costs from refurbishments and branch closures, higher electricity charges and additional maintenance spending in the branch network in South Africa, Ghana, Kenya and Uganda. Other factors contributing to the higher operating expenses were operational risk losses due to the increased frequency of impersonation fraud, ATM bombings and the R300 million loss related to the card fraud in Japan, an increase of R496 million in the amortisation of capitalised software assets and the adverse translation impact of a weaker rand exchange rate in the first half of 2016. Our focus on IT cost saving initiatives helped contain growth in IT-related costs to 2% over the year. Despite inflationary pressures, the group delivered a positive JAWs ratio of 0.3%.
Credit impairment charges
Credit impairments represent the losses incurred due to the inability of our clients to repay their debt obligations. The credit loss ratio expresses these impairment charges as a percentage of average loans and advances.
Overall total credit impairment charges were largely flat and the total credit loss ratio (CLR) of 0.86% was in line with the 0.87% recorded in the prior year. In South Africa, the CLR declined on the back of lower impairments in mortgages and vehicle and asset finance, as the performance of those portfolios continued to improve. In contrast, the CLR in the Africa Regions deteriorated primarily due to higher impairments in Nigeria and Mozambique.
In CIB, we have been actively managing the impact of market stresses on our portfolio. During the year, we decreased our exposure to financial institutions, oil and gas, and mining and metals sectors. CIB’s credit impairment charges rose to R1 603 million and its CLR to clients increased to 0.44%, driven by higher provisions in the Africa Regions portfolio, in particular, Nigeria. CIB’s NPLs declined, reflecting a combination of write-offs, successful restructurings and the impact of currency translation. CIB’s portfolio impairment provisions increased to R811 million during the year, after several counterparties’ credit ratings were downgraded, specifically in sectors and markets sensitive to commodity prices.
PBB’s CLR reduced marginally to 1.25%, driven predominantly by a decline in mortgage-related impairment charges year-on-year, reflecting the good performance of the book and collection-related actions. Vehicle and asset finance impairments declined by 11%, while business and commercial lending impairments were 41% higher, primarily in the Africa Regions. PBB’s impairment charges also benefited from post write-off recoveries following higher debt sale proceeds from card debtors, personal overdrafts and revolving credit plan portfolios. Overall personal unsecured impairments rose, reflecting constrained consumer affordability. Low commodity prices, foreign exchange rate volatility and political uncertainty contributed to higher credit impairment charges in PBB’s Africa Regions, notably in Nigeria, Kenya, Mozambique and Zambia.

Standard Bank Group Annual integrated report 2016 89
Rm
8 000
6 400
4 800
3 200
1 600
2014
Direct taxation charge and effective direct taxation rate
2012 20162013 2015
%
30
24
18
12
6
Direct taxation chargeEffective direct taxation rate
Headline earnings – other banking interests
From a segment reporting perspective, the group’s 20% interest in ICBC Argentina, previously included in the group’s Central and other segment, and 40% interest in ICBC Standard Bank Plc (ICBCS), previously included in CIB’s segment results, now comprise the group’s other banking interests and represent the group’s vestigial associate interests in previously consolidated entities that are held in terms of strategic partnerships with ICBC. CIB and Central and other’s previously reported results have accordingly been restated to exclude the equity accounted earnings relating to these entities.
Headline earnings from the group’s other banking interests improved to a net loss of R8 million from a net loss of R569 million in the previous year. The headline earnings contribution from the group’s 20% interest in ICBC Argentina declined 3% year-on-year to R583 million due to a weaker Argentinian Peso (37% increase on a constant currency basis). Equity accounted losses from the group’s 40% interest in ICBCS more than halved in 2016 to R591 million from R1 294 million in 2015 (excluding once-offs related to the insurance recovery and the Deferred Prosecution Agreement costs).
The currency-related headwinds in the first half of 2016 due to the weak rand largely reversed in the second half of the year on the back of a strengthening rand and weakness in various African currencies. On a constant currency basis, the group recorded a positive JAWs ratio of 0.6%.
Non-trading and capital related items
This line item comprises of gains and losses on the disposal of businesses and property and equipment, and impairment of goodwill, intangible assets, and associates and joint ventures.
Non-trading and capital related items decreased during the year by 20% to a loss of R1 123 million. Included in the non-trading and capital related items were impairments of intangible assets of R654 million, which arose largely due to certain intangible assets no longer being used as intended. A goodwill impairment of R482 million was recognised on the group’s investment in Nigeria, due to the weakening of the naira. These items were excluded from the group’s headline earnings.
Taxation
Taxation includes both direct income taxes and indirect taxes such as withholding taxes and the residual portion of value-added tax (VAT).
The effective direct tax rate increased by 2.8% from 21.6% to 24.4% due to the non-recognition of deferred tax assets in various Africa Regions, increased withholding taxes and non-tax deductible items.
The total tax paid by our banking operations amounted to R9.9 billion (2015: R9 billion) and tax collected from third parties and employees amounted to R12.3 billion (2015: R12.0 billion).
Refer to the group’s report to society for further information.

90
OUR PERFORMANCE Group financial review continued
Headline earnings – Liberty
The group has a 55% interest in Liberty, which comprises life insurance and investment management activities. Consistent with the boundary of this annual integrated report, the group’s share of Liberty’s earnings is reflected in this financial review as a single line item to ensure a clear distinction from the group’s banking activities. Liberty’s earnings are dependent on both earnings from insurance operations and from the performance of investment markets.
Headline earnings for Liberty amounted to R2.2 billion, down 46% compared to R4.1 billion in 2015.
The main contributors to the reduction in earnings include lower returns on the shareholders’ investment portfolio in the second half of the year (due to poor portfolio returns, rand strength and the write-down of infrastructure investments held in the alternatives portfolio), the net negative actuarial assumption changes in the Individual Arrangements business relating mainly to worsening persistency, abnormally higher risk claims in the South African Individual Arrangements and Liberty Corporate businesses, contributing to reduced risk profits in the second half, reduced earnings from STANLIB relating mainly to once off operational write-offs in both the South African and East African asset management businesses and the costs incurred on the implementation of the outsourcing of the local retail administration function.
Liberty’s 2016 headline earnings were also impacted by the first time consolidation of the listed Liberty Two Degrees (L2D) REIT. This resulted in a negative earnings impact of R304 million at a Liberty level, which represents an accounting mismatch that arose on consolidation of L2D between the open market value of the investment property assets of L2D and the corresponding obligations to policyholders in respect of the listed price of the L2D units. This mismatch does not reflect the economic reality of Liberty’s results and has been adjusted for in calculating Liberty’s normalised headline earnings. Normalised headline earnings for the 2016 year were 39% lower, representing a 37% decline in normalised operating earnings and a 42% decline in earnings from LibFin Investments.
After recognising our 55% share of Liberty’s IFRS earnings we are required, at a group level, to eliminate share price movements on deemed treasury shares held in Liberty. These are Standard Bank shares held by Liberty on behalf of policyholders. During 2015, we added back the negative impact of a declining Standard Bank share price and, in 2016, we are eliminating gains made in Liberty as a result of the higher Standard Bank share price. This resulted in Standard Bank including R955 million of headline earnings from Liberty (2015: R2 433 million) in the group’s results.

Standard Bank Group Annual integrated report 2016 91
Balance sheet analysisThe balance sheet or statement of financial position1 shows the position of the group’s assets, liabilities and equity at 31 December 2016, and reflects what the group owns, owes and the equity attributable to shareholders.
Change%
2016Rm
2015Rm
Assets Cash and balances with central banks 3 77 474 75 112Derivative assets (40) 61 752 102 094Trading assets 51 128 098 84 587Pledged assets (78) 3 313 15 204Financial investments (2) 154 630 157 855Loans and advances (1) 1 065 628 1 077 145
Loans and advances to banks (13) 143 788 165 156Loans and advances to customers 1 921 840 911 989
Other assets (21) 14 639 18 448Interest in associates and joint ventures (1) 1 489 1 499Property and equipment (10) 13 450 14 952Goodwill and other intangible assets (2) 23 285 23 714
Goodwill (46) 2 239 4 152Other intangible assets 8 21 046 19 562
Total assets – banking activities (2) 1 543 758 1 570 610
Total assets – other banking interests (19) 6 445 7 933
Total assets – Liberty2 (1) 404 087 408 385
Standard Bank Group – total assets (2) 1 954 290 1 986 928
Equity and liabilitiesEquity
Equity attributable to ordinary shareholders 1 133 175 131 934Preference share capital and premium – 5 503 5 503Non-controlling interest (24) 6 641 8 710
Total equity – banking activities (1) 145 319 146 147
Total equity – other banking interests (19) 6 445 7 933
Total equity – Liberty2 11 27 595 24 828
Standard Bank Group – total equity 0 179 359 178 908
Liabilities
Derivative liabilities (44) 68 037 121 649Trading liabilities 10 48 109 43 809Deposits and debt funding 2 1 228 993 1 201 549
Deposits from banks (13) 119 247 137 202Deposits and current accounts from customers 4 1 109 746 1 064 347
Other liabilities (6) 31 162 33 100Subordinated debt (9) 22 138 24 356
Total liabilities – banking activities (2) 1 398 439 1 424 463Total liabilities – Liberty2 (2) 376 492 383 557
Standard Bank Group – total liabilities (2) 1 774 931 1 808 020
Total equity and liabilities – banking activities (2) 1 543 758 1 570 610
Total equity and liabilities – other banking interests (19) 6 445 7 933
Total equity and liabilities – Liberty2 (1) 404 087 408 385
Standard Bank Group – total equity and liabilities (2) 1 954 290 1 986 928
1 This balance sheet presents the group’s banking activities separately from the other banking interests and Liberty. It differs to the balance sheet presented in the group’s risk and capital management report and annual financial statements, which is presented on a consolidated basis.
2 Includes adjustments on consolidation of Liberty into the group.

92
OUR PERFORMANCE Group financial review continued
The CIB portfolio declined 1% year-on-year, but grew by 3% on a constant currency basis. Corporate loans contracted 4%. The CIB South Africa portfolio grew by 1%, while the Africa Regions portfolio recorded a decline year-on-year, exacerbated by currency weakness in our key markets. On a constant currency basis, the CIB Africa Regions portfolio increased by 17%. The 17% increase in commercial property finance was attributable to South Africa due to higher lending to key commercial property finance clients.
Loans and advances to banks decreased by 13% to R143.8 billion, mainly due to the stronger rand on translation of foreign-denominated balances.
Deposits, debt funding and subordinated debt
Deposits and debt funding provides the group with the means to lend to its customers and clients. This fulfils the group’s role in connecting providers of capital with those that require additional capital and thereby contributes to the functioning of the broader financial system. The group’s subordinated debt provides further funding for growth requirements and qualifies as Tier II capital.
Deposits and current accounts from customers increased by 4% or 12% on a constant currency basis over the year. Retail-priced deposits declined by 1% while wholesale-priced funding grew by 7%, increasing by 11% and 2% respectively on a constant currency basis.
The group successfully raised R27.2 billion in longer-term funding during the year, through a combination of senior and subordinated debt, as well as syndicated loans. SBSA issued R1.7 billion of Basel III compliant Tier II subordinated debt.
Refer to the discussion on the resilience of our balance sheet on page 77.
Other banking interests
Our other banking interests consist of the group’s most material associates and joint ventures, being a 40% interest in ICBCS and a 20% interest in ICBC Argentina.
During the year, the carrying value of these associates decreased by 16% from R9.7 billion to R8.2 billion. The decrease in the carrying value of the interests in associates is principally attributable to foreign currency translation reserve losses due to the stronger rand against both the US dollar (for the group’s investment in ICBCS) and the Argentinian peso (for the group’s investment in ICBC Argentina).
Loans and advances
Loans and advances represent the largest asset class on the group’s balance sheet. They provide the group’s biggest source of revenue in the form of interest income, and create cross-selling opportunities to earn transactional fees and insurance-related revenues. Growing loans and advances within the group’s accepted risk levels is, therefore, essential to growing revenue.
Gross loans and advances to customers grew by 1% year-on-year to R944 billion, and 4% on a constant currency basis.
COMPOSITION OF LOANS AND ADVANCES
Change%
2016Rm
2015Rm
Personal & Business Banking 2 588 353 576 078
Mortgage loans 3 336 451 325 867Vehicle and asset finance 1 81 035 80 278Card debtors 0 31 229 31 174Other loans and advances 0 139 638 138 759
Corporate & Investment Banking (1) 360 336 363 596
Corporate loans (4) 294 817 307 546Commercial property finance 17 65 519 56 050
Other services (0) (5 056) (5 033)
Gross loans and advances to customers 1 943 633 934 641Less: credit impairments for loans and advances (4) 21 793 22 652
Net loans and advances to customers 1 921 840 911 989Loans and advances to banks (13) 143 788 165 156
Net loans and advances (1) 1 065 628 1 077 145
PBB’s loans to customers grew 2% year-on-year, underpinned by a 3% growth in residential mortgages and partially offset by a 1% decline in business lending and a 5% decline in personal unsecured lending on the back of tighter risk appetite. Vehicle and asset finance’s book increased marginally by 1% to R81 billion, benefiting from our continued focus on improving internal processes and system integration with the dealer market. Revolving credit plan balances on lending products (included in other loans and advances) grew following limit increases, higher utilisation and growth in average balances per active account.

Standard Bank Group Annual integrated report 2016 93
On 13 January 2017, Standard Bank London Holdings Limited (SBLH), a wholly owned subsidiary of the group and ICBC jointly, and pro rata to their shareholdings in ICBCS, injected additional regulatory capital in the form of ordinary equity into ICBCS. SBLH’s pro rata portion of this capital injection amounted to USD106 million (R1.44 billion). This capital was provided in terms of ICBC and SBLH’s obligations under the shareholders’ agreement of ICBCS pursuant to increasing regulatory capital requirements. The additional investment will be recognised in the group’s 2017 financial reporting year.
Ordinary shareholders’ fundsThe banking activities’ ordinary shareholders’ funds increased by 1% to R133.2 billion. While the group’s shareholders’ funds increased during the year due to the earnings attributable to shareholders of R22.2 billion, this was largely offset by dividends to ordinary and preference shareholders of R11.5 billion and the decrease in the group’s FCTR of R11.4 billion (refer below for further detail)#.
WHAT HAS MATERIALLY IMPACTED THE GROUP’S FCTR OVER THE PAST FEW YEARS?Significant realisations of FCTR to the income statement (excluded from headline earnings) include:
2014: R1.2 billion gain due to the liquidation of several wholly owned subsidiaries.
2015: R4.1 billion gain due to the disposal of the group’s controlling interest in SB Plc to ICBC.
Other significant changes in the group’s FCTR include:
2013 and 2015 (increase in FCTR): As a result of the weakness in the rand against several currencies. In 2015, this was partly offset by the strengthening of the rand against the Argentinian peso.
2016 (decrease in FCTR): As a result of the rand’s significant strengthening against several foreign currencies, notably the US dollar, British pound, Nigerian naira, Argentinian peso, Mozambique metical and Ghanaian cedi.
WHICH KEY GROUP FINANCIAL RATIO IS AFFECTED BY FCTR?The group’s ROE is determined with reference to the group’s average monthly ordinary shareholders’ equity. The monthly FCTR is included in the group’s monthly ordinary shareholders’ equity, and therefore impacts the average ordinary shareholders’ equity and, in turn, the group’s ROE. In circumstances where the currencies in countries in which we have invested capital weaken relative to the rand, the FCTR is debited and the ordinary share capital declines. By contrast, in circumstances where the rand is weaker, the FCTR is credited and ordinary share capital increases.
Refer to the group’s risk and capital management report’s foreign currency risk type section for detail regarding the group’s management of this risk.
Key accounting concept – foreign currency translation reserve
Given the impact of the R11.4 billion (debit) on the group’s FCTR, resulting from foreign exchange rate movements, we have provided additional information below explaining what FCTR is and how it is determined.
For further detail on FCTR, refer to the group’s accounting policies in the risk and capital management report and annual financial statements.
WHAT IS THE GROUP’S FCTR?The FCTR is a reserve that results from the consolidation by the group of its foreign operations. These operations include the group’s subsidiaries in the Africa Regions, and associate interests in ICBCS, based in the UK, and ICBC Argentina.
The impact of changing foreign exchange rates on the group’s net asset value (NAV) is recognised in the group’s FCTR. The group’s FCTR is inherently volatile due to changes in foreign currency exchange rates related to our foreign operations. The graph below indicates the yearly changes in the group’s FCTR compared to the changes in the US dollar/rand foreign currency rate, which is a key driver of changes in the group’s FCTR.
Rm
20142012 20162013 2015
%
Translation reserve (debit)/creditUSD/ZAR appreciation/(depreciation) – closingUSD/ZAR appreciation/(depreciation) – average
8 000
6 000
4 000
2 000
(2 000)
(4 000)
(6 000)
(8 000)
(10 000)
(12 000)
30
15
(15)
(30)
(45)
Currency translation effects
# Lib